 Lyndon Brooks
 Carol Palmer
 Anthony D. Griffiths
 Kenneth H. Pollock
- 1StatPlan Consulting Pty Ltd., Woodburn, NSW, Australia
- 2Marine Ecology Research Centre, Southern Cross University, Lismore, NSW, Australia
- 3Marine Ecosystems, Flora and Fauna Division, Department of Environment and Natural Resources, Palmerston, NT, Australia
- 4Faculty of Engineering, Health, Science and the Environment, Research Institute for the Environment and Livelihoods, Charles Darwin University, Darwin, NT, Australia
- 5Department of Applied Ecology, North Carolina State University, Raleigh, NC, USA
Monitoring variation in populations of coastal dolphins presents a range of challenges. Many species occur at low local population levels, are cryptic and appear to range over larger areas than presumed. Here we present the results of a three and half year intensive monitoring study undertaken in Darwin Harbor and two neighboring sites (1086 km2). The study comprised multi-site robust design capture-recapture models that yielded estimates of abundance, apparent survival and temporary emigration on three species of coastal dolphins: Australian humpback (Sousa sahulensis), bottlenose (Tursiops sp.) and Australian snubfin (Orcaella heinsohni). Combining all three sites, abundance estimates varied between species. The Australian humpback was the most abundant with a mean of 90, bottlenose were stable at mean of 27 and the Australian snubfin varied widely from 19 to 70 with a mean of 41. Overtime, Australian humpback abundance estimates showed a steady decline in Darwin Harbor but a population increase in the two neighboring sites was recorded, suggesting there were movements out of Darwin Harbor. However, the estimates of movement rates were not sufficiently sensitive to demonstrate this, due to the relatively small size of the local population and consequent low rates of observed movement. The multi-state robust design model offers the potential for assessing abundance estimates and population trends. It is able to distinguish between movements to and from a site from demographic changes on the site that otherwise might be attributed to other factors (i.e., decrease in survival). The study highlights the substantial effort and time required to detect population trends for coastal dolphins by needing to account for movement among sites. However, the reality of assessing the conservation status for coastal dolphins is challenging. Moreover, to enact conservation measures a reassessment at both global and nationals levels of the IUCN Red List categories (A and C) is required.
Introduction
By global standards, the coastal waters of northern Australia are relatively undisturbed (Halpern et al., 2008; Edyvane and Dethmers, 2010; Palmer, 2014). However, with increasing prospects and proposals for development in coastal waters around Australia's northern coastline there are concerns about the conservation status and management of three coastal dolphin species occurring in these waters (Allen et al., 2012; Bejder et al., 2012; Palmer, 2014; Palmer et al., 2014a), the Australian humpback (Sousa sahulensis; hereafter referred to as “humpback”) (Jefferson and Rosenbaum, 2014), Australian snubfin (Orcaella heinsohni, hereafter referred to as “snubfin”) (Beasley et al., 2005; Palmer et al., 2011), and the bottlenose (Tursiops sp., hereafter referred to as “bottlenose”), whose taxonomic status in monsoonal northern Australia remains uncertain (Krützen et al., 2004; Palmer et al., 2014a).
Coastal dolphins are highly susceptible to anthropogenic activities and environmental change due to their dependency on estuarine and nearshore environments, specific habitat requirements and residency patterns (Parra et al., 2006; Ross, 2006; Allen et al., 2012; Palmer et al., 2014a,b; Hanf et al., 2016). Additionally, they are distributed across large remote areas in small and potentially isolated subpopulations (Frère et al., 2008, 2011; Cagnazzi et al., 2013; Palmer et al., 2014a; Brown et al., 2016). Studying coastal dolphins is challenging, expensive and time consuming (Dhandapani, 1992; Parra and Corkeron, 2001; Kreb, 2004; Palmer et al., 2011) particularly for the snubfin and humpback dolphins, which can be boat shy and have unpredictable surfacing patterns (Parra and Arnold, 2008; Parra and Ross, 2009; Palmer et al., 2011). Many occur at low densities and are cryptic, so the ability to detect change in populations becomes especially difficult and problematic (Thompson et al., 2000).
Assessment of the conservation status of coastal dolphins is constrained by information deficiencies on population size and trends, and area of occupancy which causes difficulties to implement conservation management actions (Taylor and Gerrodette, 1993; Peel et al., 2015). For snubfin and humpback dolphins, there are abundance estimates for a small number of local populations and no estimates of population trends at any site or across their Australian distribution (Corkeron et al., 1997; Hale, 1997; Parra et al., 2002, 2004; Palmer et al., 2014b; Brown et al., 2016; Hanf et al., 2016). In relation to the estuarine bottlenose dolphin, prior to this study, there was only one other estimate of the abundance across the entire monsoonal northern Australia (Palmer et al., 2014b).
The objectives of this study were to monitor changes in abundance, distribution and movement patterns of three coastal dolphin species in Darwin Harbor and two neighboring sites. A statistically robust monitoring design was developed which used photo-identification, and Pollock's robust capture-recapture models to provide estimates of abundance, apparent survival and movements between sites over time.
Methods
Sampling
The sampling design for the Darwin Harbor Dolphin Monitoring Program was based on a “robust design” sampling structure (Pollock et al., 1990; Williams et al., 2002; Brooks and Pollock, 2011), consisting of two primary samples per year (March/April and October), with nine secondary sample days in each primary period. The nine secondary sample days are divided into three sampling blocks, with surveys alternating between Darwin Harbor (DH) and Bynoe Harbor (BH) /Shoal Bay (SB) (Figure 1, Table 1). Secondary sampling is defined as a complete set of transects per day (DH-200, BH-150, and SB-50 km; Brooks and Pollock, 2011). Surveys were undertaken over an 18 day period, to align the sampling dates on the sites as much as possible for fitting multistate models which assume that all sites were sampled simultaneously (Table 1). Surveys followed a transect design in which similar transects were followed although varied somewhat depending on tide state. Figure 1 shows a set of typical transect lines on the three sites.
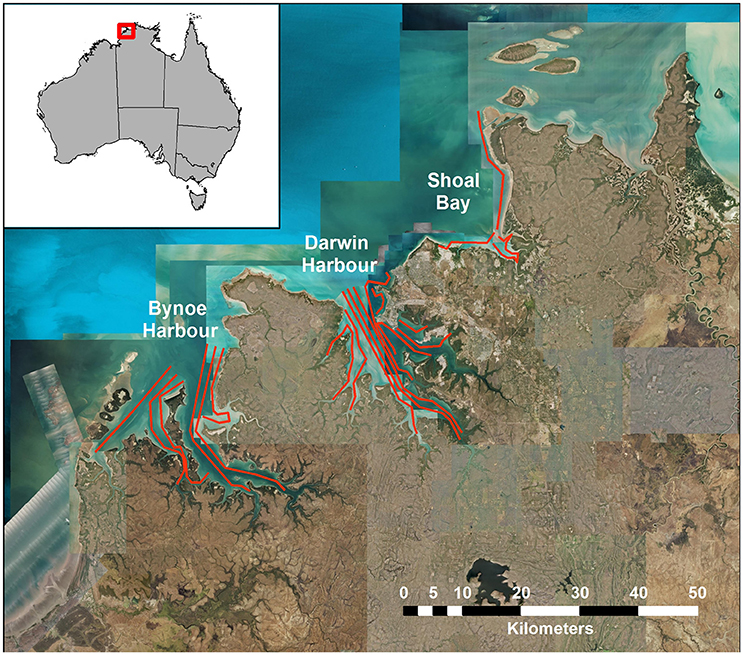
Figure 1. Map of transect lines in Bynoe Harbor, Darwin Harbor and Shoal Bay.
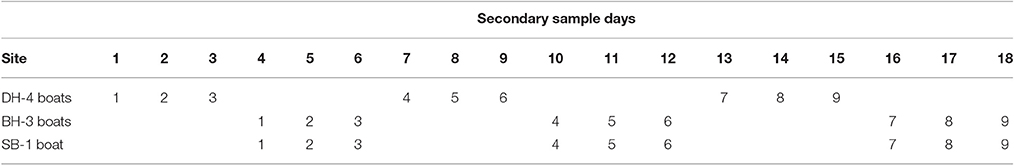
Table 1. Secondary sampling routine across the three sites (DH, Darwin Harbor; BH, Bynoe Harbor; SB, Shoal Bay) and including number of vessels undertaking the surveys at each site.
Primary survey data consisted of recording GPS location, species and photographing the dorsal fin which were used to identify an individual dolphin from the nicks, scars and pigmentation and to yield capture-recapture data to model abundance, apparent survival and movements.
The Northern Territory is defined by a strongly monsoonal climate and is exposed to an orderly procession of climatic extremes (Woinarski et al., 2007). The three sites were surveyed during the late wet season (March/April) and the late dry and build-up seasons (September/October) (Palmer et al., 2014b).
Sampling was completed for eight primary samples at all sites between 20th October 2011 and 19th April 2015. The dates of sampling in each primary sample are listed in Table 2.
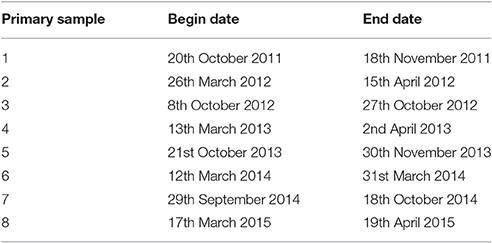
Table 2. Primary sample survey dates.
Surveys followed a transect design in which similar transects were followed in each secondary sample, although their exact paths varied somewhat depending on tides and other factors. Figure 1 shows a set of typical transect lines on the three sites, Bynoe Harbor, Darwin Harbor and Shoal Bay.
Photo-ID Methods
Capture-recapture methods have been widely used to estimate demographic parameters for a number of dolphin species including snubfin, humpback and bottlenose dolphins (Würsig and Jefferson, 1990; Parra et al., 2006; Nicholson et al., 2012; Palmer et al., 2014b). A general overview of capture-recapture models is found in Amstrup et al. (2005) while more detailed coverage is found in Williams et al. (2002).
Many cetaceans bear nicks and marks that allow identification of individuals from photographs, and such identifiers provide a mechanism for population estimation based on capture-recapture methods, where re-sightings of individuals with distinctive natural marks constitute re-captures (Hammond and Thompson, 1990). Here images of dorsal fins showing nicks and scars on the leading and trailing edges and overall fin shape were employed as the primary means of individual identification while pigmentation patterns were sometimes used as secondary identifiers (See Figure S1).
It was initially intended that when a local group was sighted, an attempt would be made to estimate the number of individuals upon approach and keep track of their positions during photo-identification and take an equal number of photographs of each individual. This proved impossible in the field with such highly mobile animals that frequently move out of view below the water. Instead, approximately 50–100 photographs were taken during each sighting session, attempting to capture all individuals an approximately equal number of times, while recognizing that this was likely to be achieved only occasionally.
The images taken of each individual were graded on quality of the image (poor, average, good, excellent) based on focus, contrast, clarity, and angle of dorsal fin. Only images graded as good or excellent were retained for further processing. The individuals depicted in the good and excellent quality images were then graded for the distinctiveness of their marks (uniquely identifiable, not uniquely identifiable) (Urian et al., 1999).
Statistical Methods
Models for the Marked Population
Only distinctively marked individuals may be considered to be captured in photographs and therefore capture-recapture models can only be applied to distinctively marked members in a population. Where there were sufficient data the Multistate Closed Robust Design Model (MSCRD, Brownie et al., 1993; Nichols and Coffman, 1999; Kendall and Nichols, 2002; Kendall, 2013) was employed for analysis of the capture-recapture data to estimate abundance, apparent survival, and movements between sites and temporary emigration between primary samples. The MSCRD extends the Closed Robust Design model (CRD, Pollock, 1982; Kendall et al., 1995, 1997; Kendall and Nichols, 1995) to include multiple states following the multistate model for recapture data (Arnason, 1972, 1973; Brownie et al., 1993; Schwarz et al., 1993).
The MSCRD model provides estimates of:
1. Apparent survival between primary samples (probabilities of being alive and present in the sample area, S parameters),
2. Movements between sites and temporary emigration between primary samples (probabilities, ψ parameters). Whereas, temporary emigration is modeled in terms of ϒ″ and ϒ′ parameters in the CRD, temporary emigration is included among the movements (ψ parameters) in the MSCRD by defining an ‘unobservable’ state for dolphins that are temporarily absent during a primary sample,
3. Abundance at each primary sample (number present on a site, N parameters).
Whereas the CRD model deals with only one site at a time (BH, DH, and SB) each considered separately or all considered together as one site), the MSCRD model can simultaneously provide these estimates for multiple states (here multiple sites, BH, DH, and SB).
With three sites, four states were defined: three observable states on the three sites (A = BH, DH, or SB) and one unobservable state (U) for temporary absence from all three sites. Dolphins may move between all four states (or stay where they were) between consecutive pairs of primary samples, with such movements being modeled as transition probabilities. With all sites considered together as one, the CRD model may be thought of as having only two states, the observable state A and the unobservable state U.
The parameters of the MSCRD model are described in Table 3 and the set of transitions between states is listed in Table S1.
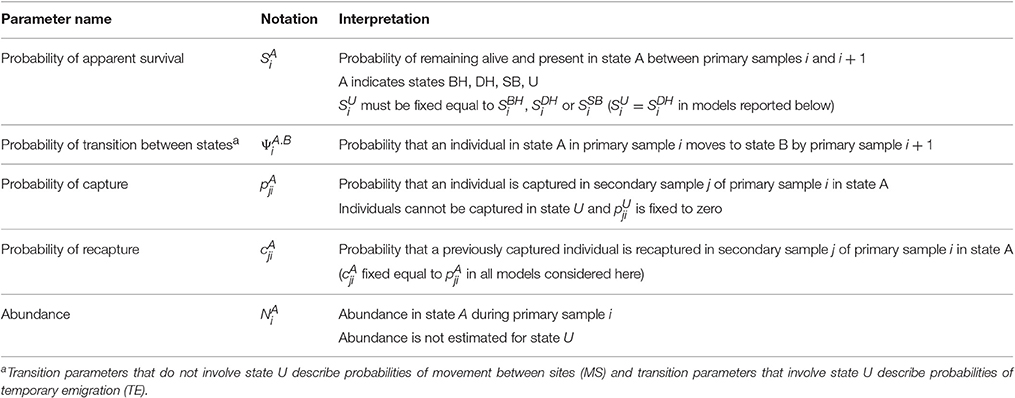
Table 3. Parameters of the MSCRD model.
Different patterns or structures of temporary emigration may be estimated by applying constraints to the corresponding temporary emigration () and (re) immigration () parameters. An implication of estimating these separately is that the probability of emigration in an interval is related to the probability of emigration in the previous interval or has a Markovian temporal structure. When the probability of emigration in an interval is equal to the probability of staying away after a previous absence, whether an animal comes or goes is a random process and the temporary emigration structure is referred to as “random.” When the probability of emigration in an interval is equal to the probability of immigration after a previous absence there is an even flow of animals into and out of the sample area and the temporary emigration structure is referred to as “even flow.” Kendall (2013) may be the most accessible account of these temporary emigration structures. Table S2 specifies the parameter constraints that define these structures.
In most cases it was necessary to use CRD models by pooling the data over all three sites because the data from each site were too sparse to fit the MSCRD. While CRD models may be fitted with MSCRD software by limiting the number of states to two (A, U), it is more straightforward to fit CRD models with CRD software. As described above, temporary emigration is modeled in terms of gamma” and gamma' parameters in the CRD, while in the MSCRD temporary emigration is included among the movements (ψ parameters). There is a direct relationship between the γ parameters of the CRD and the ψ parameters of the MSCRD, as follows: γ″ = ΨA.U and γ′ = 1−ΨU.A (i.e., the probability of staying away is the complement of the probability of returning).
Capture-recapture studies typically yield an estimate of apparent survival or the probability of both remaining alive and available for recapture in the sample area. Estimates of the probability of remaining alive (biological survival) must be made by other means. If estimates of both apparent and biological survival are available however, an estimate may be made of the probability of permanent emigration from the sample area. More formally, an estimate of the probability of permanent emigration Ê may be derived as where is an estimate of the probability of apparent survival and Ŝ is an estimate of the probability of biological survival.
Life history data on Australian inshore dolphins that might support an estimate of the rate of biological survival for a species are extremely limited. Studies on the Indo-Pacific humpback dolphin (Sousa chinensis) in the Pearl River Estuary in southern China (Huang et al., 2012) yielded an estimate of biological survival of 0.975 (95% CI = 0.96–0.99) per annum. The Indo-Pacific humpback dolphin is a close relative of the newly described Australian humpback dolphin studied here and the biological survival rates of the two species may be expected to be similar. The adult survival rates for the Australian snubfin dolphin (Orcaella heinsohni) and for the Indo-Pacific bottlenose dolphin (Tursiops aduncus) were both reported as 0.95 per annum by Taylor et al. (2007). Although the taxonomic status of the bottlenose dolphin studied here is uncertain (Palmer et al., 2014b), its morphological and behavioral similarity to the Indo-Pacific bottlenose dolphin found elsewhere in Australia suggest that it may have a similar biological survival rate. These estimates are used together with capture-recapture estimates of apparent survival to estimate approximate rates of permanent emigration.
Model Fitting
Whole sample (all sites combined) results from CRD models are reported for all species and additional site by site results from MSCRD models are reported for the most abundant and widely distributed humpback dolphin.
The modeling process involves fitting a set of models with alternative parameter structures and comparing them for fit to data and parsimony. Models were compared with the Akaike Information Criterion corrected for small sample sizes (AICc, Burnham and Anderson, 2002), with smaller values of AICc indicating better fitting models, and with AICc weights, which measure the relative likelihoods of the models in the set. When one model in the set had a clearly lower AICc than all others and attracted the major proportion of the AICc weight, the parameter estimates from this “best” model are reported; when several models have similar AICc values and shared the AICc weight, model-averaging may be applied (Buckland et al., 1997) whereby a weighted average of the parameter estimates from several models are reported.
We used program U-CARE (Choquet et al., 2005) for goodness of fit tests. The tests were performed on data collapsed to primary samples; for CRD models the tests assume a Cormack-Jolly-Seber (CJS; Lebreton et al., 1992) type of model and for MSCRD models they assume a multistate version of the model that allows for transitions between states (JollyMove; Brownie et al., 1993). In some cases there was significant lack of fit making it necessary to adjust the estimates using an estimate of the variance inflation factor ĉ and a version of AICc for overdispersed data (not to be confused with the probability of recapture in the models) (QAICc; Burnham and Anderson, 2002). The variance inflation factor ĉ was estimated as the ratio of the overall test statistic for the model from U-CARE and the model degrees of freedom.
For CRD models, models were fitted with apparent survival varying by primary sample, by season (i.e., constant for the same seasons) or constant over time. Temporary emigration varied as none (no TE), random, even flow or Markovian and by primary sample, season or constant (12 alternatives). Capture probability varied by primary sample, secondary sample or both. In particular, capture probability varied interactively by primary and secondary sample or by primary sample only. Temporal variation for apparent survival and temporary emigration refers to the intervals between consecutive primary samples, while temporal variation in capture probability refers to secondary sample. Consecutive seasonal intervals alternated between dry to wet and wet to dry seasons.
Multistate Closed Robust Design Model (MSCRD) models included the above for each site with additional parameters for movement between sites. As for temporary emigration, these varied by primary sample, by season or constant over time. Movements between sites can only be estimated when movements were observed. For movements by primary sample, this means that estimates can be made only between the sites and for the intervals when movements were observed. Having not observed a movement does not mean that no movement occurred: these are small populations and an animal must have been captured in both sites in consecutive primary samples for its movement to have been observed. For movements by season, if movement was observed between a pair of sites for at least one seasonal interval, estimates may be made for all corresponding intervals. Similarly, for constant movement models, at least one movement between the pair of sites must have been observed. Movements between pairs of sites might also be assumed to be symmetric, with the same rate of flow in both directions. In that case, movements need to be observed only in one direction for the rate in both directions to be estimated. Consequently, it is possible to estimate symmetric flow between Shoal Bay and the other sites although no movements from Shoal Bay were observed. Where there were no observed movements to support estimates, the affected parameters were fixed to zero. It is unlikely that models with complex structures on movement parameters will be found to fit well as relatively few movements were observed.
For the MSCRD models, capture probability varied by site, primary sample, secondary sample or combinations of these. In particular, models were fitted for capture probability varying interactively by site, primary sample and secondary sample or varying interactively by site and primary sample.
With apparent survival, movement, temporary emigration, capture probability and abundance parameters on three sites over eight primary samples each with nine secondary samples there are a very large number of parameters to be estimated, even in reduced parameter models (i.e., not fully time varying on all parameters). Attempts to fit MSCRD models to the complete data caused catastrophic estimation problems with more complex models and generated estimates after up to 10 million iterations that were accompanied by warnings that numeric convergence was suspect. The complexity of the problem was greatly reduced by collapsing over the nine secondary samples on each site in each primary sample to three. This data structure effectively re-defines a secondary sample as three complete sets of transects. This structure fits well with the sampling regime, with the re-defined secondary samples corresponding to the alternating 3 day sessions on the sites. With this new data structure, although there were still many parameters to be estimated, estimates were produced without warnings.
Model Assumptions
Robust Design capture-recapture models make the following important assumptions:
1) Natural marks are distinct enough for individual identification without error,
2) Homogeneous capture probabilities between individuals within a sampling event i.e., no heterogeneity and no trap response,
3) Homogeneous survival probabilities between primary periods,
4) Instantaneous sampling for secondary periods,
5) Population is closed within primary periods,
6) Captures are independent between individuals (clustering causes over dispersion), and,
7) For the MSCRD we also made the assumption of no movement between states within a primary period.
Unlike for standard open models, temporary emigration is allowed (both random and Markovian, Kendall et al., 1997). We attempted to minimize assumption violations as much as possible.
For assumption 1, to ensure correct identification, we followed the approach of recent papers (Sprogis et al., 2016) and used high quality photographs and only distinctive marks. (An adjustment to account for non-uniquely marked animals is described in the next section). For assumption 2, no trap response was expected because animals were not captured or recaptured in the traditional sense. Heterogeneity of capture probabilities can be reduced by using only distinct photographs and closely following image selection and matching protocols. Remaining heterogeneity can be accounted for by modeling or by accounting for lack of fit using the variance inflation factor. For assumption 3, we reduced differences in survival by using only adult animals. For assumption 4, we ran the individual secondary samples over a 1 day period. For assumption 5, we ran the secondary samples within a primary period as close together as possible. Assumption 6, the independence assumption, is always violated for dolphins because they occur in clusters or local populations. We adjusted for the resulting overdispersion using the variance inflation factor. For assumption 7, there was some movement within primary periods despite making the secondary periods as close together as possible. When this occurred we used the first location during the primary sample.
Marked Proportion and Total Population Size
Not all individuals have sufficiently distinctive marks to support unambiguous identification. Only distinctively marked individuals may be considered to be captured in photographs and capture-recapture models can only yield estimates of the number of distinctively marked members in a population. Therefore, this estimate may be adjusted to yield an estimate of total population size by dividing by an estimate of the proportion of distinctively marked individuals in the population as described below.
For each species, the number of good quality photographs (Pt) and, of those, the number that depicted a distinctively marked individual (Pm) was recorded for each local population encounter. A mixed effects binary logistic model was fitted to the distinctiveness data on individual good quality photographs (1 = distinctively marked, 0 = not distinctively marked) with local population and individual within local population as random factors to estimate the marked proportion (Mp) of the population. Between-local population variation may arise with natural variation in the proportion of distinctive to non-distinctive individuals or with the number of good quality photographs taken of distinctive and non-distinctive individuals. The model separates this variance from the variance associated with the estimated population proportion.
The total abundance (Ntotal) of each population for any sampling period and site may be estimated by dividing the estimated abundance of marked dolphins () by the estimated marked proportion ():
Log-normal confidence intervals for abundance estimates may be calculated following Burnham et al. (1987):
Research protocol was approved by the Charles Darwin University Animal Ethics Committee and all procedures were carried out in accordance with the recommendations of the Committee (A06018 and A13005). Research was carried out under Permits from the Parks and Wildlife Service of the Northern Territory, Australia (47915).
Results
Overall a total of 60,000 km of transects were run, 96,588 images taken and 279 individual dolphins of all three species identified. Over eight primary samples, 159 individual humpback dolphins were captured a total of 1,128 times and movements recorded between sites. These data were analyzed with the MSCRD model; Forty individual bottlenose dolphins were captured a total of 387 times and bottlenose dolphins were quite mobile throughout the total sample area but the relatively small populations on each site in each primary sample do not justify the complexity of the MSCRD model; Eighty individual snubfin dolphins were captured a total of 286 times. The relatively small number of snubfin individuals captured on each of the three sites and the rates of movement between sites does not justify a MSCRD model (Table 4).
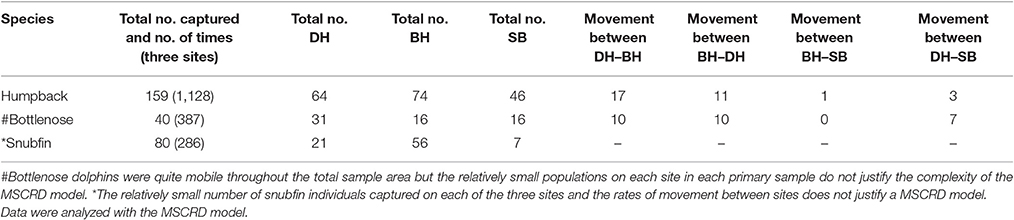
Table 4. Total number of individuals and number of times captured across three sites and movements between sites.
Humpback Dolphin
Closed Robust Design Model
The tests indicated significant lack of fit of the data to the model (χ2 = 91.92, df = 20, p = 0.000) and ĉ was estimated at 4.6. This was adjusted in program Mark (White and Burnham, 1999) and QAICc used for model comparisons.
No even flow model or any model with temporary emigration varying by primary sample accounted for as much as 1% of the QAICc weight and these models are not further considered. The four models with the lowest QAICc accounted for 94% of the QAICc weight. All of these models had capture probability varying by both primary and secondary sample, apparent survival varying by season, and temporary emigration either random or Markovian and either constant or varying by season. Table S3 reports model comparison statistics for the four lowest QAICc CRD models.
The marked proportion of the humpback population was estimated as 0.97 with SE = 0.004. The number of humpback dolphins present on the total sample area during the approximately 3 weeks in each primary sample was reasonably stable around a mean of 90 (with mean CV = 0.12) (Table 3). The number of dolphins present was relatively low (77) in primary sample five and relatively high (99) in primary sample six. The estimated total number of dolphins present in each primary sample is plotted with its 95% confidence interval in Figure 2.
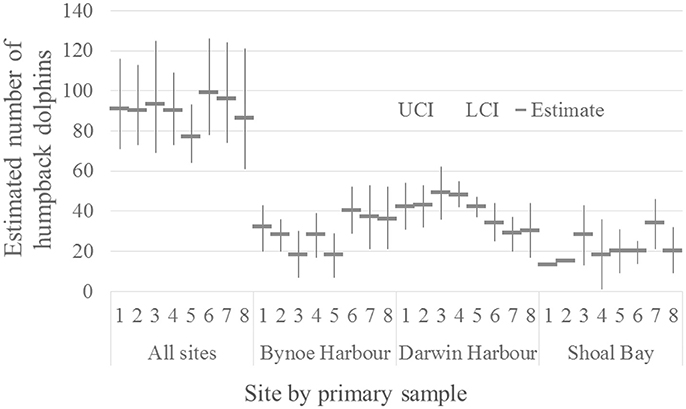
Figure 2. Estimated number of humpback dolphins present in each primary sample (all sites combined) (CRD model) and on each site (Bynoe Harbor, Darwin Harbor and Shoal Bay) (MSCRD model).
The estimates for apparent survival displayed a seasonal pattern (Table 5). If biological survival is assumed to be constant, humpback dolphins present in a dry season were more likely to permanently emigrate than those present in a wet season. If a biological survival rate of 0.975 (Huang et al., 2012) is assumed, while there was very little permanent emigration for humpback dolphins present in a wet season (about 8%), the rate of permanent emigration for dolphins present in a dry season was substantial (about 27%).
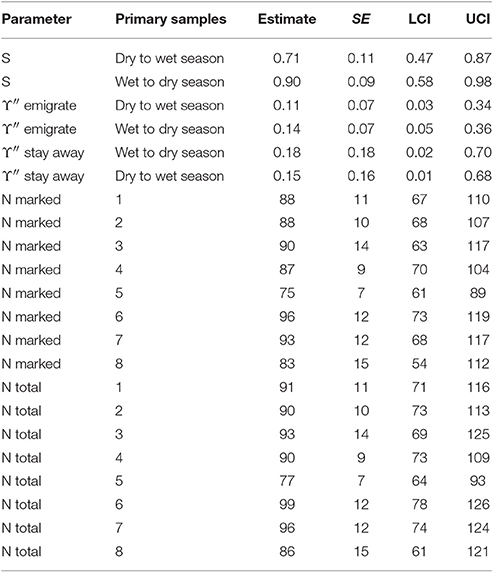
Table 5. Humpback dolphin: Model averaged parameter estimates from the four lowest AICc CRD models (all sites combined).
In contrast to the apparent survival pattern, humpback dolphins present in a dry season were less likely to emigrate temporarily during the following wet season than dolphins present in a wet season were to temporarily emigrate during the following dry season (Table 5). Humpback dolphins temporarily absent in a wet season were more likely to stay away in the following dry season than dolphins absent in a dry season were to stay away in the following wet season. Taken together, the estimates for temporary emigrating and of staying away indicate that a higher proportion of humpback dolphins were temporarily absent from the sampling area in dry than wet seasons. Overall however, the confidence intervals on the temporary emigration parameters were quite wide and, although the seasonal pattern was well established by the QAICc statistics, the true sizes of the estimates are uncertain.
Considering both the apparent survival and temporary emigration estimates, humpback dolphins that emigrated between a dry and a wet season were more likely to emigrate permanently and less likely to emigrate temporarily than dolphins that emigrated between a wet and a dry season. In other words, humpback dolphins that were absent from the sample area during a wet season were more likely to have permanently emigrated and less likely to have temporarily emigrated than humpback dolphins that were absent from the sample area during a dry season.
Although the estimated variation in the total number of humpback dolphins present in the sample area over the primary samples was reasonably consistent, there was more variation in the last four primary samples (October/November 2013 to March/April 2015) than the first four primary samples (October/November 2011 to March/April 2013). Neither the relatively large reduction in the number of humpback dolphins present between primary samples four (March/April 2013) and five (October/November 2013) nor the relatively large increase between primary samples five (October/November 2013) and six (March 2014) can be accounted for in terms of unusually high variation in permanent or temporary emigration both of which followed a constant seasonal pattern.
Multistate Closed Robust Design Model
The goodness of fit tests indicated significant lack of fit of the data to the model (χ2 = 131.02, df = 67, p = 0.000) and ĉ was estimated at 2.0. This was adjusted in program Mark and QAICc used for model comparisons.
Many of a large number of models assessed were found to account for a very small proportion of the QAICc weight and were not further considered. Models with movements between pairs of sites separately for each direction (e.g., BH to DH and DH to BH) yielded estimates with very similar probabilities in both directions, and models were then fitted with symmetric (even flow) movement between pairs of sites. Models with temporary emigration from all sites yielded estimates of near zero temporary emigration from DH and SB, and models were then fitted with temporary emigration only from BH.
The six models with lowest QAICc accounted for 98.4% of the QAICc weight and were selected for further consideration. All of these models had apparent survival varying both by site and season, constant symmetric movement between pairs of sites, capture probability varying by site, primary sample and secondary sample, and temporary emigration only from BH. They differed however in whether temporary emigration was even flow, random or Markovian and whether temporary emigration was constant or varied by season. Table S4 reports model comparison results for the six lowest QAICc MSCRD models. The QAICc statistics indicate strong support for apparent survival varying by both site and season, constant, symmetric movement between pairs of sites, and either constant or seasonal temporary emigration only from BH. Temporary emigration did not clearly follow an even flow, random or Markovian pattern.
With the marked proportion estimated at 0.97 for this species and a maximum estimated population size of 49, adjustment to total population sizes made little difference and adjusted estimates are not reported.
The seasonal patterns differed among the sites, with greater apparent survival following wet than dry seasons in DH and SB but the opposite pattern in BH with greater apparent survival there following dry than wet seasons (Table 6). The wet to dry season estimate in SB was very high with a very small standard error which often indicates a confounded estimate. There is no apparent reason however why this estimate should be confounded. All humpback dolphins captured in SB in the wet season primary samples two and four and all but one of 18 captured in wet season primary sample six were subsequently recaptured there indicating that the estimate of close to 100% apparent survival is reasonable. Overall, the apparent survival estimates were on average greater in DH than the other two sites, with the seasonal contrast being strongest in SB.
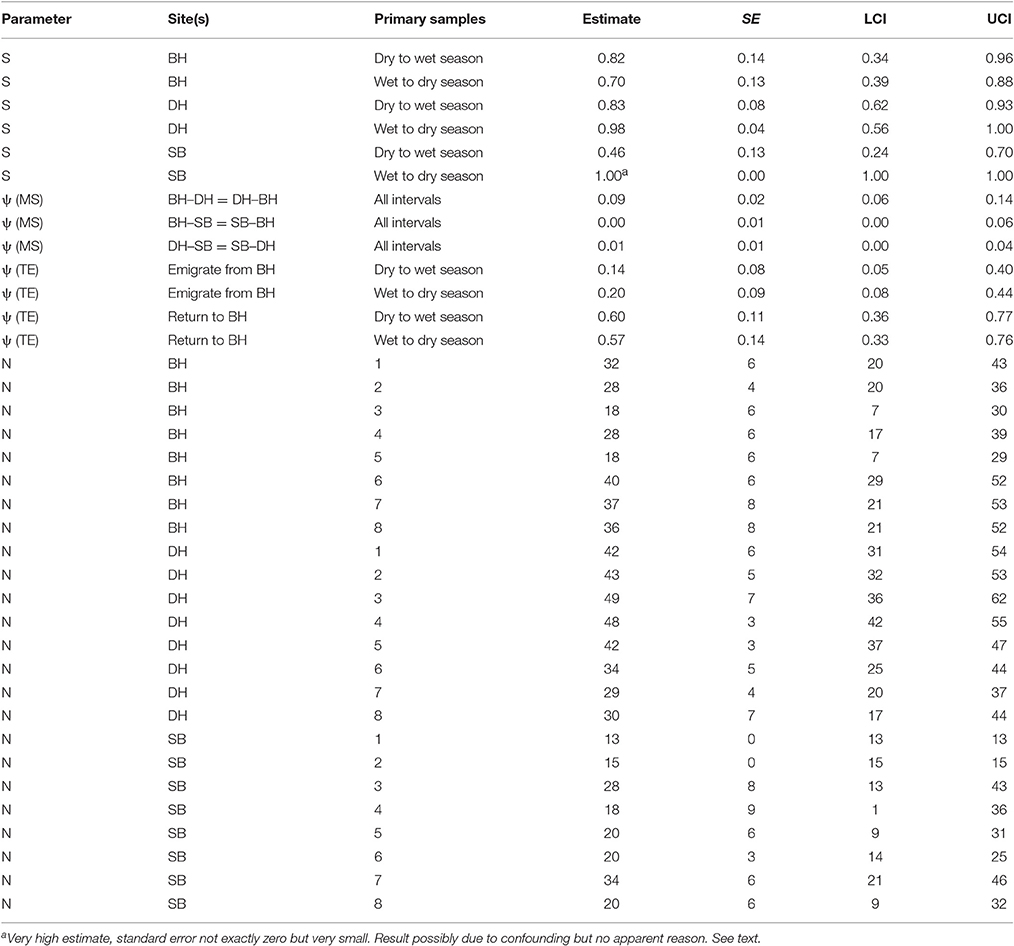
Table 6. Humpback dolphin: Model averaged parameter estimates from the six lowest AICc MSCRD models.
The apparent survival estimate for wet to dry seasons in DH was 0.98, at the upper limit of what biological survival might be expected to be and indicating no permanent emigration of humpback dolphins from DH of dolphins present there in a wet season. If an annual biological survival rate of 0.98 is assumed to be constant, approximately 15% of humpback dolphins that were present in DH during a dry season were estimated to permanently emigrate prior to the wet season. Applying this estimate of biological survival to BH and SB, approximately 16% of humpback dolphins present in BH during a dry season and 29% of those present during a wet season were estimated to emigrate permanently, while approximately 53% of dolphins present in SB in a dry season were estimated to emigrate permanently.
While about 9% were estimated to have moved in both directions between BH and DH in a typical interval between primary samples, the estimated rates of movement to and from SB were very small (at most 1% per interval).
These are relatively small populations and the confidence intervals around the apparent survival (S) and transition parameters (ψ) were quite wide, indicating caution against over-interpretation.
The number of humpback dolphins present in DH steadily declined between primary samples four (March/April 2013) and seven (September/October 2014) when there were fewest, and remained close to that number during primary sample eight (March/April 2015). The number present in BH, although variable, showed a marked increase between primary samples five (October/November 2013) and six (March 2014) and has remained relatively consistent since then. The number present in SB has shown a general tendency to have increased over time with two peaks in primary samples three (October 2012) and seven (September/October 2014) (Table 6).
Although the confidence intervals were reasonably narrow for such small populations, most on the same sites have some degree of overlap. Exceptions in DH include between the highest estimate in primary sample three (October 2012) and the lowest in primary sample seven (September/October 2014), and between the quite precise estimate in primary sample five (October/November 2013) and the lowest estimate in primary sample seven (September/October 2014) (Table 6).
The total numbers on all three sites over the eight primary samples from the MSCRD estimates (Table 6).
Bottlenose Dolphin
The goodness of fit tests indicated non-significant lack of fit of the data (χ2 = 22.48, df = 14, p = 0.069) to the model and ĉ was left at the default value of 1.0.
Of the suite of models fitted, the even flow models with reasonable fit all estimated apparent survival with either a zero or a very large standard error (95% CI = 0–1) and were removed from the comparison set. Models with apparent survival varying by primary sample and models with capture probability varying only by primary sample fitted very poorly (with relatively very large AICc values) and were also removed. Models further considered all had capture probability varying by both primary and secondary sample, apparent survival constant or varying by season (dry to wet and wet to dry), and temporary emigration either Markovian or random and constant or varying by primary sample or season. Among these models, the eight with the lowest AICc values accounted for 97.5% of the AICc weight in the set. Table S5 reports model comparison statistics for the eight lowest AICc models.
The AICc weights indicate some evidence for seasonal variation in apparent survival and a Markovian temporary emigration pattern: i.e., the probability of staying away in the present primary sample after an absence in the previous primary sample differs from the probability of leaving after a presence. The parameter estimates from the best eight models were computed as averages weighted by their AICc weights. The model averaged estimates from the best eight CRD models are reported in Table 5.
If it is assumed that biological survival is constant, the estimates of apparent survival indicate that bottlenose dolphins present in a dry season may be more likely to permanently emigrate than those present in a wet season. If the rate of biological survival is assumed to be 0.95 for this species (Taylor et al., 2007) about 7% of the bottlenose dolphins present in a dry season and about 3% of dolphins present in a wet season were estimated to permanently emigrate. Both the dry to wet and wet to dry season estimates were similar and reasonably high however, and may be close to the biological survival rate for this species indicating low rates of permanent emigration.
The estimates for temporary emigration were very similar for the dry and wet seasons although a slight seasonal structure is present. Around 15% of bottlenose dolphins present during a primary sample were outside the sample area for around 3 weeks in the following primary sample. Around 45% of bottlenose dolphins that were temporarily absent in the previous primary sample did not return in the present primary sample; this is substantially different to the percentage of new emigrants (15%) revealing a Markovian pattern. That estimates with this pattern (more likely to stay away having left than leave) are reasonably constant over primary samples suggests that bottlenose dolphins that were offsite for around 3 weeks (the period within a primary sample) were reasonably likely to stay offsite for 6 months (the period between primary samples) or more.
The number of bottlenose dolphins present in the sampling area during the primary samples has remained reasonably stable around a mean of 27 with a high of 38 in primary sample three (October 2012) and a low of 20 in primary sample five (October/November 2013).
Despite quite high capture probabilities for this species (mean = 0.29, mean SE() = 0.08), their small number may have precluded models from detecting more subtle temporal structure in temporary emigration which might then have accounted for more of the variation in abundance over time.
Snubfin Dolphin
The tests indicated non-significant lack of fit of the data (χ2 = 23.64, df = 20, p = 0.258) to the model and ĉ was left at the default value of 1.0.
The parameter estimates from the best four models were computed as averages weighted by their AICc weights (Table S6). The model averaged estimates from the four lowest AICc CRD models are reported in Table 8.
The abundance estimates reported are estimates of the number of distinctively marked snubfin dolphins present in the sample area during each primary sample. The marked proportion was estimated to be 0.986 (with SE = 0.005) for this species. Adjustment to total abundance increases these estimates by 1.4% or at most one dolphin and adjusted estimates are not reported.
If it is assumed that biological survival is constant, the estimates of apparent survival indicate that snubfin dolphins present in a dry season were more likely to permanently emigrate than those present in a wet season. If we assume that annual biological survival is 0.95 (Taylor et al., 2007), the estimates indicate that while nearly all of the snubfin dolphins present in a wet season returned to the sample area at some stage (while they are alive), about 10% of dolphins present in a dry season permanently emigrated.
The estimates for temporary emigration (be absent for about 3 weeks) were sometimes large (up to 63%), varied greatly between primary samples, were especially large in the first three intervals prior to primary sample four (March/April 2013) and lowest in the last interval to primary sample eight (March/April 2015). The estimates for staying away after an absence were of similar size and varied similarly with the results being dominated by random temporary emigration models.
In sum, the proportion of temporarily absent snubfin dolphins was substantially greater up to primary sample four (March/April 2013) than subsequently and particularly small in primary sample eight (March/April 2015).
The number of snubfin dolphins present in the sample area during a primary sample increased greatly between primary samples four (March/April 2013) and five (October/November 2013), and a further large increase occurred in primary sample eight (March/April 2015). These results correspond well with the pattern of temporary emigration, with far higher proportions of previously present snubfin dolphins absent in primary samples two to four than subsequently and the lowest in primary sample eight.
Assuming a minimum of 32 snubfin dolphins present during primary sample one (the number captured), the number of snubfin dolphins present on the total sample area during the 3-week primary samples varied widely around a mean of 41 (SD = 20) between 19 in primary sample four (March/April 2013) and 70 in primary sample eight (March/April 2015).
Discussion
Monitoring Variation and Abundance Estimates
We applied the robust design capture recapture models following a sampling structure where primary samples are separated by a 5–6 month time scale and this would allow for gains and losses from the populations. Through our study, population estimates for the three species derived across the three sites were broadly comparable to local populations reported elsewhere in Australia (Parra et al., 2006; Fury and Harrison, 2008; Cagnazzi et al., 2011; Palmer et al., 2014b; Brown et al., 2016; Hanf et al., 2016). The approximate area for the study site 1089 km2 and sampling regime (four vessels and 60,000 km of transects) is the most intense undertaken in Australia for coastal dolphins, yet low recapture rates for bottlenose and snubfin dolphins still precluded capture recapture models for each site. Interestingly, regardless of the size of the study sites across Australia (Corkeron et al., 1997; Parra et al., 2006; Cagnazzi et al., 2011, 2013; Palmer et al., 2014b; Brown et al., 2016) low recapture rates prevail.
Currently, there is little basis for understanding coastal dolphin movement and ranging patterns in monsoonal northern Australia. Coastal dolphins may be responding to seasonal influences (Smith, 2012; Palmer et al., 2017) and spatial and temporal variation in the abundance of prey species (Silva et al., 2009; Cagnazzi et al., 2013; Parra and Cagnazzi, 2016). However, the results have highlighted that the study period (three and half years) and study area (1086 km2) didn't encompass the whole ranging patterns for the three species, which appears to be much larger than assumed (Silva et al., 2009; Nicholson et al., 2012; Palmer et al., 2014b; Brown et al., 2016).
Humpback Dolphin
Humpback dolphins were distributed over the whole area and found in most parts of the available habitats. Movement between sites was observed, but it was relatively limited and largely confined to movement between BH and DH (Table 4). Over the entire year, around 35% of the humpback dolphins may permanently emigrate from the total sample area (8% following wet and 27% following dry seasons). The observed stability of the total population over time and the low breeding rate of coastal dolphins generally, indicates that a similar amount of immigration takes place from areas outside the study sample areas. Temporary emigration occurred only from BH and it seems likely that both the observed permanent and temporary migration involve connectivity with other areas, probably to the west of BH. We suspect this because very few movements were observed between BH or DH and SB, and temporary emigration did not occur from either DH or SB.
The humpback dolphins showed a steady decline in DH between primary samples four (March/April 2013) and seven (September/October 2014). While this downward trend was occurring in DH, the number of humpback dolphins present across the whole sample area increased, suggesting movement of some humpback dolphins out of DH and possibly into BH and SB which showed increased numbers during this period (Figure 2).
Bottlenose Dolphin
Bottlenose dolphins were found in all sites but most often in DH (Table 4). However, we could not model their movements due to low local population size and recapture rates with the MSCRD. They appear to move relatively freely among the three sites with as many of the 40 individuals identified being sighted on different sites at different times. The permanent emigration rate was low and while the number estimated to have been present during the primary samples was quite stable, there was one unusually large estimate in primary sample three (38 up from 29), suggesting the arrival of immigrants and a degree of connectivity between the Darwin area local population and dolphins from outside the sample area.
Snubfin Dolphin
Snubfin dolphins showed clear evidence of connectivity between local population of snubfin dolphins in DH and areas outside it with an increasing population, sometimes very high rates of temporary emigration, and a likely permanent emigration rate of around 10% following presence in the sample area during a dry season. The rate of immigration was particularly high between primary samples four and five (19–67), and seven and eight (46–70) (Table 4). There are a number of unexplained features of the snubfin dolphin pattern of use of the area, including the entry of apparently large numbers of new dolphins from outside the sample area. Most snubfin dolphins were seen in BH, the most westerly site, and only ever seen there suggesting, as for humpback dolphins, connectivity to areas to the west. The estimated rates of movement between sites might have been informative of movement out of DH and into BH and SB had the populations been larger and more between-site movements observed again, highlighting the difficulties in detecting movements when local populations are small (Table 4).
Snubfin Dolphin
The number of snubfin dolphins present in the entire sample area during the primary samples varied widely between 19 in March/April 2013 to 70 in March/April 2015 with a mean of 41 (SD = 20). A large part of the wide variation in the abundance of snubfin dolphins was due to sometimes high rates of temporary emigration and large increases in abundance between primary samples.
There is clear evidence of connectivity between local population of snubfin dolphins in Darwin Harbor and areas outside it with an increasing population, sometimes very high rates of temporary emigration, and a likely permanent emigration rate of around 10% following presence in the sample area during a dry season. The rate of immigration was particularly high between primary samples four and five (19–67), and seven and eight (46–70). There are a number of unexplained features of the snubfin dolphin pattern of use of the area, including the entry of apparently large numbers of new dolphins from outside the sample area. Most snubfin dolphins were seen in Bynoe Harbor, the most westerly site, and only ever seen there suggesting, as for humpback dolphins, connectivity to areas to the west.
Survival Estimates, Temporary Emigration, Seasonality, and Movements
Wet and dry season effects were often observed on apparent survival and temporary emigration estimates. Estimates of apparent survival and temporary emigration often had wide confidence intervals for all species. The width of the confidence intervals around apparent survival estimates and the paucity of knowledge of biological survival rates for Australian coastal dolphin species indicate that the estimates of rates of permanent emigration presented should be interpreted with caution. Estimates of apparent survival that fell well below the expected biological survival rates for similar species reported elsewhere (Currey et al., 2008; Silva et al., 2009; Cantor et al., 2011; Wang et al., 2012) potentially point to sometimes quite high rates of permanent emigration.
The seasonal apparent survival estimates for bottlenose and snubfin dolphins were quite high relative to some of the estimates for humpback dolphins. Both bottlenose and snubfin dolphins were however more likely to permanently emigrate from the whole sample area following their presence in a dry than a wet season, suggesting that both bottlenose and snubfin dolphins have more dry season than wet season occasional visitors (Tables 7, 8). Humpback dolphins were more likely to permanently emigrate from the whole sample area following presence there in a dry rather than a wet season (Tables 5, 6).
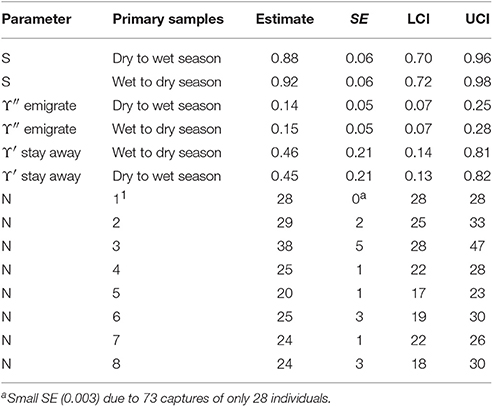
Table 7. Bottlenose dolphin: Model averaged parameter estimates from the eight lowest AICc CRD models.
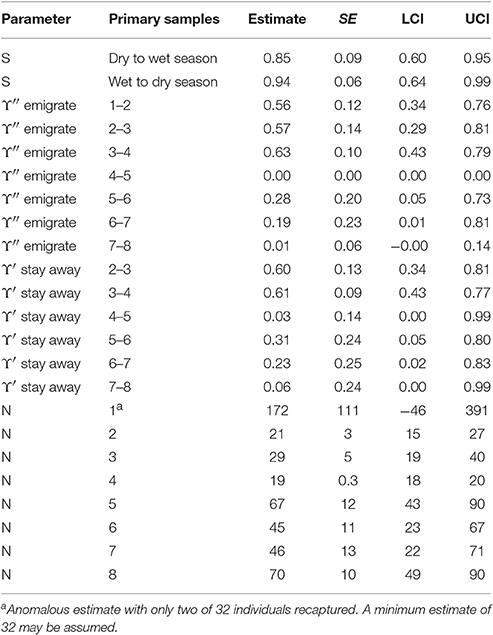
Table 8. Snubfin dolphin: Model-averaged parameter estimates from the four lowest AICc CRD models.
The seasonal pattern of humpback dolphins permanent emigration from each of the three sites was more complex with the species more likely to permanently emigrate from Bynoe Harbor following presence there in a wet season than a dry season but more likely to emigrate from Darwin Harbor and Shoal Bay following their presence there in a dry than a wet (Tables 3, 4). The permanent emigration rate from Shoal Bay following presence there in a dry season was particularly high. If occasional visitation from other areas does underlie the sometimes high rates of permanent emigration, it would appear that Bynoe Harbor may have more occasional visitors from elsewhere in wet than dry seasons, while Darwin Harbor, Shoal Bay and the sample area as a whole may have more occasional visitors from elsewhere in dry than wet seasons.
The estimated rates of movement between sites might have been informative of movement out of Darwin Harbor and into Bynoe Harbor and Shoal Bay had the populations been larger and more between-site movements observed, again highlighting the difficulties in detecting movements when local populations are small.
Multistate Closed Robust Design Model (MSCRD)
A monitoring study on only the immediate area around a site of construction or other potentially disruptive activity would be at risk of misattribution changes in local abundance to effects of the activity unless alternative accounts were considered. Alternative accounts may be made in terms of temporary movements off the study area (temporary emigration), movements to and from the focal area and alternative available habitat (transitions between sites) or seasonal or other environmental influences. The robust design models are the only way temporary emigration can be modeled, and the Multistate Robust Design is the only way movements between the focal area and other sites and temporary emigration can be modeled. This study was designed to yield seasonal sample data for analysis under the MSCRD model for these reasons. The clustered sampling pattern of a robust design study also allows for structured management of sampling effort and for the timing of sampling in parallel with the timing of planned construction activity or seasonal environmental influences to facilitate interpretation of the estimates. A further advantage of the robust design is that the first primary sample represents a quite reasonable pilot study on which basis the design might be modified for subsequent sampling.
The full potential of the MSCRD could not be exploited in this study mainly because of the small sizes of the dolphin local populations using the three sites. This meant that the MSCRD model could be employed here only for data on humpback dolphins but not the other two species. Reasonably precise estimates of abundance were obtained for a population of only around 90 individual humpback dolphins and as few as around 20 individuals on one of the sites (Shoal Bay). The same cannot be said for the precision of the estimates of apparent survival, temporary emigration or movements between sites on which the confidence intervals were considerably wider. Nonetheless, despite quite wide confidence intervals on estimates of these parameters, useful and informative estimates were obtained indicating seasonal and typical (constant over primary samples) effects.
Although the MSCRD was not a viable model for the data on bottlenose or snubfin dolphins, combining the species data on the three sites and treating them as one allowed the advantages of the single state version of the model (CRD) to be exploited, including estimation of temporary emigration. This was especially useful in interpreting the sometimes large changes in the abundance of snubfin dolphins.
Conservation Management
Limits on the results in this study followed largely from the small sizes of the local populations but are typical of populations sizes reported elsewhere for these species. Moreover, the effort expended in this study i.e., four vessels, 60,000 km of transects, 96,588 images, 2,823 animals photographed and 279 individual dolphin identified (for all three species) (over three and half years) highlights that detecting population trends for species like coastal dolphins is possible but resource and time intensive due to small numbers, movement in and out of study sites and low re-capture rates.
Anthropogenic activities in the marine environments are increasing (Reeves et al., 2013; Ferguson et al., 2015) and there a number of activities that are of concern for conservation management of marine species e.g., energy development, shipping, fishing and coastal construction (Ferguson et al., 2015). One common component of these activities is underwater noise. Sound is essential for cetaceans to be able to communicate, detect predators and prey, traverse and sense environmental cues (Ferguson et al., 2015; Paiva et al., 2015). Increasing anthropogenic underwater sound could be influencing cetaceans ability to detect key sounds (Ellison et al., 2012; Ferguson et al., 2015) and hence have an effect on emigration rates and movement patterns (Wang et al., 2007; Dungan et al., 2011). The design of future population studies of coastal dolphins needs to account for temporary and permanent migration and ranging patterns.
Conservation assessment at the international and national level relies heavily on population trend data that is statistically robust and demonstrates a proof of a decline for small populations of cetaceans (Taylor and Gerrodette, 1993; Thompson et al., 2000; Taylor et al., 2007). Hence, this study draws attention to the challenges in the application of the conservation assessment criteria in relation to coastal dolphins and requires reassessment if they are to be used as a trigger for implementation of conservation management programs (Parsons, 2016).
Author Contributions
Survey design: LB, KP, AG, and CP. Coordination and data management: CP. Analyzed data: LB with advice from KP. Manuscript: LB, KP, and CP with contributions, review and editing by AG.
Funding
Ichthys LNG Project and the Northern Territory Government.
Conflict of Interest Statement
The authors declare that the research was conducted in the absence of any commercial or financial relationships that could be construed as a potential conflict of interest.
Acknowledgments
The Darwin Harbor Coastal Dolphin Monitoring Program was funded through the INPEX-led Ichthys LNG Project's Nearshore Environmental Monitoring Program. The Program was a partnership between the Northern Territory Government, INPEX and their sub-contractor (GHD), and Indigenous sea ranger groups from Larrakia Nation and the Northern Land Council's Kenbi Rangers. The undertaking of the biannual field surveys involved up to 20 staff from these organizations and operating four vessels over 20 day periods and good communication was crucial to the success of the program. Many thanks to all staff involved in the surveys for their proficiency in dolphin observations, photo-id and data collection. The paper is dedicated to the memory of Matthew Fegan whose GIS support throughout the entire program was crucial to the success of the program. Six monthly reports were submitted to INPEX and a final report. All are available online: http://www.inpex.com.au/our-projects/ichthys-lng-project/ichthys-commitments/environment/monitoring-the-environment/
Supplementary Material
The Supplementary Material for this article can be found online at: http://journal.frontiersin.org/article/10.3389/fmars.2017.00094/full#supplementary-material
Figure S1. Three dorsal fin images of one dolphin of each species collected in different years.
Table S1. Complete set of between primary sample transitions among the four states.
Table S2. Parameter constraints for random, even flow and Markovian temporary emigration structures.
Table S3. Humpback dolphin: Model comparison statistics for the four lowest QAICc CRD models.
Table S4. Humpback dolphin: Model comparison statistics for the six lowest QAICc MSCRD models.
Table S5. Bottlenose dolphin: Model comparison statistics for the eight lowest AICc CRD models.
Table S6. Snubfin dolphin: Model comparison statistics for the four lowest AICc CRD models.
References
Allen, S. J., Cagnazzi, D. D. B., Hodgson, A. J., Loneragan, N. R., and Bejder, L. (2012). Tropical inshore dolphins of north-western Australia: unknown populations in a rapidly changing region. Pac. Conserv. Biol. 18, 56–63. doi: 10.1071/PC120056
Amstrup, S. C., McDonald, T. L., and Manly, B. F. J. (2005). Handbook of Capture-Recapture Analysis. Princeton, NJ: Princeton University Press.
Arnason, A. N. (1972). Parameter estimates for mark-recapture experiments on two populations subject to migrations and death. Res. Popul. Ecol. 13, 99–113. doi: 10.1007/bf02521971
Arnason, A. N. (1973). The estimation of population size, migration rates and survival in a stratified population. Res. Popul. Ecol. 15, 1–8. doi: 10.1007/BF02510705
Beasley, I., Robertson, K. M., and Arnold, P. (2005). Description of a new dolphin, the Australian Snubfin dolphin Orcaella heinsohni sp. n. (Cetacea, Delphinidae). Mar. Mamm. Sci. 21, 365–400. doi: 10.1111/j.1748-7692.2005.tb01239.x
Bejder, L., Hodgson, A. J., Loneragan, N. R., and Allen, S. J. (2012). Coastal dolphins in north-western Australia: the need for re-evaluation of species listings and shortcomings in the environmental impact assessment process. Pac. Conserv. Biol. 18, 22–25. doi: 10.1071/PC120022
Brooks, L., and Pollock, K. H. (2011). A Sampling Design for Monitoring Dolphin Populations in Darwin Harbour. Unpublished report held by Northern Territory Department of Land Resource Management.
Brown, A., Bejder, L., Pollock, K. H., and Allen, S. J. (2016). Site-Specific assessments of the abundance of three inshore Dolphin Species to inform conservation and management. Front. Mar. Sci. 3:4. doi: 10.3389/fmars.2016.00004
Brownie, C., Hines, J. E., Nichols, J. D., Pollock, K. H., and Hestbeck, J. B. (1993). Capture-recapture studies for multiple strata including non-Markovian transition probabilities. Biometrics 49, 1173–1187. doi: 10.2307/2532259
Buckland, S. T., Burnham, K. P., and Augustin, N. H. (1997). Model selection: an integral part of inference. Biometrics 53, 603–618. doi: 10.2307/2533961
Burnham, K. P., and Anderson, D. R. (2002). Model Selection and Multimodel Inference: A Practical Information-Theoretic Approach. New York, NY: Springer.
Burnham, K. P., Anderson, D. R., White, G. C., Brownie, C., and Pollock, K. P. (1987). Design and analysis methods for fish survival experiments based on release-capture data. Biometrics 51, 888–898. doi: 10.2307/2532990
Cagnazzi, D. D. B., Harrison, P. L., Ross, G. J. B., and Lynch, P. (2011). Abundance and site fidelity of Indo-Pacific Humpback dolphins in the Great Sandy Strait, Queensland, Australia. Mar. Mamm. Sci. 27, 255–281. doi: 10.1111/j.1748-7692.2009.00296.x
Cagnazzi, D., Parra, G. J., Westley, S., and Harrison, P. L. (2013). At the heart of the industrial boom: Australian snubfin dolphins in the capricorn coast, Queensland, need urgent conservation action. PLoS ONE 8:e56729. doi: 10.1371/journal.pone.0056729
Cantor, M., Wedekin, L. L., Daura-Jorge, F. G., Rossi-Santos, M. R., and Simões-Lopes, P. C. (2011). Assessing population parameters and trends of Guiana dolphins (Sotalia guianensis): an eight year mark-recapture study. Mar. Mamm. Sci. 28, 63–83. doi: 10.1111/j.1748-7692.2010.00456.x
Choquet, R., Reboulet, A. M., Lebreton, J. D., Giminez, O., and Pradel, R. (2005). U-Care 2.2 User's Manual. Montpellier: CEFE. Available online: http://www.cefe.cnrs.fr/fr/recherche/bc/bbp/264-logiciels
Corkeron, P. J., Morissette, N. M., Porter, L., and Marsh, H. (1997). Distribution and status of humpbacked dolphins Sousa chinensis, in Australian waters. Asian Mar. Biol. 14, 49–59.
Currey, R. J. C., Rowe, L. C., Dawson, S. M., and Slooten, E. (2008). Abundance and demography of bottlenose dolphins in Dusky Sound, New Zealand, inferred from dorsal fin photographs. New Zeal. J. Mar. Fresh. Res. 42, 439–449. doi: 10.1080/00288330809509972
Dhandapani, P. (1992). Status of the Irrawaddy river dolphin Orcaella brevirostris in Chilka Lake. J. Mar. Biol. Assoc. India 34, 90–93.
Dungan, S. Z., Riehl, K. N., Wee, A., and Wang, J. Y. (2011). A review of the impacts of anthropogenic activities on the critically endangered eastern Taiwan Strait Indo-Pacific humpback dolphins (Sousa chinensis). J. Mar. Anim. Their Ecol. 4, 3–9. Available online at: http://www.oers.ca/journal/volume4/issue2/Duggan_Galley.pdf
Edyvane, K., and Dethmers, K. (2010). Identifying Potential Areas for Marine Protected Areas in the Northern Territory. Final Project Report CF2007/135, Department of Natural Resources, Environment, the Arts and Sport: Darwin.
Ellison, W. T., Southall, B. L., Clark, C. W., and Frankel, A. S. (2012). A new context-based approach to assess marine mammal behavioural responses to anthropogenic sounds. Conserv. Biol. 26, 21–28. doi: 10.1111/j.1523-1739.2011.01803.x
Ferguson, M. C., Curtis, C., Harrison, J., and Van Parjis, S. M. (2015). Biologically important areas for cetaceans within U.S. waters–overview and rationale. Aquat. Mamm. 4, 2–16. doi: 10.1578/AM.41.1.2015.2
Frère, C. H., Hale, P. T., Porter, L., Cockcroft, V. G., and Dalebout, M. L. (2008). Phylogenetic analysis of mtDNA sequences suggests revision of humpback dolphin (Sousa spp.) taxonomy is needed. Mar. Fresh. Res. 59, 259–268. doi: 10.1071/MF07120
Frère, C. H., Seddon, J., Palmer, C., Porter, L., and Parra, G. (2011). Multiple lines of evidence for an Australasian geographic boundary in the Indo-Pacific humpback dolphin (Sousa chinensis): population or species divergence? Conserv. Genet. 12, 1633–1638. doi: 10.1007/s10592-011-0242-9
Fury, C. A., and Harrison, P. L. (2008). Abundance, site fidelity and range patterns of Indo-Pacific bottlenose dolphins (Tursiops aduncus) in two Australian subtropical estuaries. J. Mar. Fresh. Res. 59, 1015–1027. doi: 10.1071/MF08109
Halpern, B. S., Walbridge, S., Selkoe, K. A., Kappel, C. V., Micheli, F., and Watson, R. (2008). A global map of human impact on marine ecosystems. Science 319, 948–952. doi: 10.1126/science.1149345
Hammond, P. S., and Thompson, P. M. (1990). Minimum estimate of the number of bottlenose dolphins (Tursiops truncatus) in the Moray Firth. Biol. Conserv. 56, 79–88. doi: 10.1016/0006-3207(91)90090-V
Hanf, D. M., Hunt, T., and Parra, G. J. (2016). Humpback dolphins of Western Australia: a review of current knowledge and recommendations for future management. Adv. Mar. Biol. 73, 193–217. doi: 10.1016/bs.amb.2015.07.004
Huang, S. L., Karczmarski, L., Chen, J., Zhou, R., Lin, W., Zhang, H., et al. (2012). Demography and population trends of the largest population of Indo-Pacific humpback dolphins. Biol. Conserv. 147, 234–242. doi: 10.1016/j.biocon.2012.01.004
Jefferson, T. A., and Rosenbaum, H. C. (2014). Taxonomic revision of the humpback dolphins (Sousa spp.) and description of a new species from Australia. Mar. Mamm. Sci. 30, 1494–1541. doi: 10.1111/mms.12152
Kendall, W. L. (2013). “The robust design,” in Program Mark–A Gentle Introduction, Vol. 15, 13th Edn., eds E. G. Cooch and G. C. White. Available online at: http://www.phidot.org/software/mark/docs/book/
Kendall, W. L., and Nichols, J. D. (1995). On the use of secondary capture-recapture samples to estimate temporary emigration and breeding proportions. J. Appl. Stat. 22, 751–762. doi: 10.1080/02664769524595
Kendall, W. L., and Nichols, J. D. (2002). Estimating state-transition probabilities for unobservable states using capture-recapture/re-sighting data. Ecology 83, 3276–3284. doi: 10.2307/3072078
Kendall, W. L., Nichols, J. D., and Hines, J. E. (1997). Estimating temporary emigration and breeding proportions using capture-recapture data with Pollock's robust design. Ecology 78, 563–578.
Kendall, W. L., Pollock, K. H., and Brownie, C. (1995). A likelihood-based approach to capture-recapture estimation of demographic parameters under the Robust Design. Biometrics 51, 293–308. doi: 10.2307/2533335
Kreb, D. (2004). Abundance of freshwater Irrawaddy dolphins in the Mahakam River in east Kalimantan, Indonesia, based on mark-recapture analysis of photo-identified animals. J. Cetacean Res. Manage. 6, 269–277.
Krützen, M., Sherwin, W. B., Berggren, P., and Gales, N. (2004). Population structure in an inshore cetacean revealed by microsatellite and mtDNA analysis: bottlenose dolphins (Tursiops sp.) in Shark Bay, Western Australia. Mar. Mamm. Sci. 20, 28–47. doi: 10.1111/j.1748-7692.2004.tb01139.x
Lebreton, J. D., Burnham, K. P., Clobert, J., and Anderson, D. R. (1992). Modeling survival and testing biological hypotheses using marked animals: a unified approach with case studies. Ecol. Monogr. 62, 67–118. doi: 10.2307/2937171
Nichols, J. D., and Coffman, C. J. (1999). “Demographic parameter estimation for experimental landscape studies on small mammal populations,” in Landscape Ecology of Small Mammals, eds G. W. Barrett and J. D. Peles. Available online at: http://link.springer.com/book/10.1007/978-0-387-21622-5
Nicholson, K., Bejder, L., Allen, S., Krützen, K., and Pollock, K. (2012). Abundance, survival and temporary emigration of bottlenose dolphins (Tursiops sp.) off Useless Loop in the western gulf of Shark Bay, Western Australia. Mar. Fresh. Res. 63, 1059–1068. doi: 10.1071/MF12210
Paiva, E. G., Kent, C. P. S., Gagnon, M. M., McCauley, R., and Finn, H. (2015). Reduced detection of indo-pacific bottlenose dolphins (Tursiops aduncus) in an inner harbour channel during pile driving activities. Aquat. Mamm. 41, 455–468. doi: 10.1578/AM.41.4.2015.455
Palmer, C. (2014). Conservation Biology of Dolphins in Coastal Waters of the Northern Territory, Australia. PhD Thesis. Darwin (Northern Territory): Charles Darwin University.
Palmer, C., Baird, R. W., Webster, D. L., Patterson, R., Edwards, A., Withers, A., et al. (2017). A preliminary study of the movement patterns of false killer whales Pseudorca crassidens in coastal waters of the Northern Territory, Australia. Mar. Fresh. Res. doi: 10.1071/mf16296
Palmer, C., Brooks, L., Parra, G. J., Rogers, T., Glasgow, D., and Woinarski, J. (2014b). Estimates of abundance and apparent survival of coastal dolphins in Port Essington harbour, Northern Territory, Australia. Wildl. Res. 41, 35–35. doi: 10.1071/WR14031
Palmer, C., Murphy, S. A., Thiele, D., Parra, G. J., Robertson, K. M., Beasley, I., et al. (2011). Analysis of mitochondrial DNA clarifies the taxonomy and distribution of the Australian snubfin dolphin (Orcaella heinsohni) in northern Australian waters. Mar. Fresh. Res. 62, 1303–1307. doi: 10.1071/MF11063
Palmer, C., Parra, G. J., Rogers, T., and Woinarski, J. (2014a). Collation and review of sightings and distribution of three coastal dolphin species in waters of the Northern Territory, Australia. Pac. Conserv. Biol. 20, 116–125. doi: 10.1071/PC140116
Parra, G. J., and Arnold, P. W. (2008). “Australian snubfin dolphin: Orcaella heinsohni,” in The Mammals of Australia, eds S. M. Van Dyck and R. Strahan (Sydney, NSW: New Holland), 865–866.
Parra, G. J., Azuma, C., Preen, A. R., Corkeron, P. J., and Marsh, H. (2002). Distribution of Irrawaddy dolphins, Orcaella brevirostris, in Australian waters. Raffles Bull. Zool. 10, 141–154.
Parra, G. J., and Cagnazzi, D. (2016). Chapter seven – conservation status of the australian humpback dolphin (Sousa sahulensis) using the IUCN red list criteria. Adv. Mar. Biol. 73, 157–192. doi: 10.1016/bs.amb.2015.07.006
Parra, G. J., and Corkeron, P. J. (2001). Feasibility of using photo-identification techniques to study the Irrawaddy dolphin, Orcaella brevirostris (Owen in Gray 1866). Aquat. Mamm. 27, 45–49.
Parra, G. J., Corkeron, P. J., and Marsh, H. (2004). The Indo-Pacific humpback dolphin, Sousa chinensis (Osbeck, 1765), in Australian waters: a summary of current knowledge. Aquat. Mamm. 30, 197–206. doi: 10.1578/AM.30.1.2004.197
Parra, G. J., Corkeron, P. J., and Marsh, H. (2006). Population sizes, site fidelity and residence patterns of Australian snubfin and Indo-Pacific humpback dolphins: implications for conservation. Biol. Conserv. 129, 167–180. doi: 10.1016/j.biocon.2005.10.031
Parra, G. J., and Ross, G. J. B. (2009). “Humpback dolphins: S. chinensis and S. teuszii,” in Encyclopedia of Marine Mammals, 2nd Edn, eds W. F. Perrin, W. Bernd and J. G. M. Thewissen (London: Academic Press), 576–582.
Parsons, E. C. M. (2016). Why IUCN should replace “Data Deficient” conservation status with a precautionary “Assume Threatened” status-A cetacean case study. Front. Mar. Sci. 3:193. doi: 10.3389/fmars.2016.00193
Peel, D., Kelly, N., Smith, J., Childerhouse, S., Moore, T. J., and Redfern, J. (2015). Quantitative Assessment of Ship Strike to Humpbacks in the Great Barrier Reef. Final Report to the Australian Marine Mammal Centre Grants Programme (Project 13/46), Australian Antarctic Division.
Pollock, K. H. (1982). A capture recapture design robust to unequal probability of capture. J. Wildl. Manag. 46, 752–757. doi: 10.2307/3808568
Pollock, K. H., Nichols, J. D., Brownie, C., and Hines, J. E. (1990). Statistical inference for capture-recapture experiments. Wildl. Monogr. 107, 3–97.
Reeves, R. R., McClellan, K., and Werner, T. B. (2013). Marine mammal bycatch in gillnet and other entangling net fisheries, 1990 to 2011. Endanger. Species Res. 20, 71–97. doi: 10.3354/esr00481
Ross, G. J. B. (2006). Review of the Conservation Status of Australia's Smaller Whales and Dolphins. Canberra, ACT: Australian Government.
Schwarz, C. J., Schweigert, J. F., and Arnason, A. N. (1993). Estimating migration rates using tag recovery data. Biometrics 49, 177–193. doi: 10.2307/2532612
Silva, M. A., Magalhāes, S., Prieto, R., Serrao Santos, R., and Hammond, P. S. (2009). Estimating survival and abundance in a bottlenose dolphin population taking into account transience and temporary migration. Mar. Ecol. Prog. Ser. 392, 263–276. doi: 10.3354/meps08233
Smith, H. (2012). Population Dynamics and Habitat Use of Bottlenose Dolphins (Tursiops aduncus), Bunbury, WA. Ph.D. Thesis. Perth (Western Australia): Murdoch University.
Sprogis, K. R., Pollock, K. H., Raudino, H. C., Allen, S. J., Kopps, A. M., Manlik, O., et al. (2016). Sex-specific patterns in abundance, temporary emigration and survival of Indo-Pacific bottlenose dolphins (Tursiops aduncus) in coastal and estuarine waters. Front. Mar. Sci. 3:12. doi: 10.3389/fmars.2016.00012
Taylor, B. L., Chivers, S. J., Larese, J., and Perrin, W. F. (2007). Generation Length and Percent Mature Estimates for IUCN Assessments of Cetaceans. Administrative Report LJ-07-01, Southwest Fisheries Science Center, 8604 La Jolla Shores Blvd., La Jolla, CA 92038.
Taylor, B. L., and Gerrodette, T. (1993). The uses of statistical power in conservation biology: the vaquita and northern spotted owl. Conserv. Biol. 7, 489–500. doi: 10.1046/j.1523-1739.1993.07030489.x
Thompson, P. M., Wilson, B., Grellier, K., and Hammond, P. S. (2000). Combining power analysis and opulation viability analysis to compare traditional and precautionary approaches to conservation of coastal cetaceans. Conserv. Biol. 14, 1253–1263. doi: 10.1046/j.1523-1739.2000.00099-410.x
Urian, K. W., Hohn, A. A., and Hansen, L. J. (1999). Status of the Photo-Identification Catalog of Coastal Bottlenose Dolphins of the Western North Atlantic. Report of a Workshop of Catalog Contributors. NOAA Technical Memorandum NMFS-SEFSC-425.
Wang, J. Y., Shih, C., Fruet, P., and Secchi, E. R. (2012). Mark-recapture analysis of the critically endangered Eastern Taiwan Strait population of Indo-Pacific humpback dolphins (Sousa Chinensis): Implications for Conservation. Bull. Mar. Sci. 88, 885–902. doi: 10.5343/bms.2010.1097
Wang, J. Y., Yang, S. C., Hung, S. K., and Jefferson, T. A. (2007). Distribution, abundance and conservation status of the eastern Taiwan Strait population of Indo-Pacific humpback dolphins, Sousa chinensis. Mammalia 71, 157–165. doi: 10.1515/MAMM.2007.032
White, G. C., and Burnham, K. P. (1999). Program MARK: survival estimation from populations of marked animals. Bird Study 46, S120–S139. doi: 10.1080/00063659909477239
Williams, B. K., Nichols, J. D., and Conroy, M. J. (2002). Analysis and Management of Animal Populations. San Diego, CA: Academic Press.
Woinarski, J. C. Z., Mackay, B., Nix, H., and Trail, B. (2007). The Nature of Northern Australia, Natural Values, Ecological Processes and Future Prospects. The Australian National University Canberra ACT 0200. Available online at: http://epress.anu.edu.au
Würsig, B., and Jefferson, T. A. (1990). “Methods of photo-identification for small cetaceans,” in Individual Recognition of Cetaceans: Use of Photo-Identification and Other Techniques to Estimate Population Parameters, eds P. S. Hammond, S. A. Mizroch, and G. P. Donovan (Cambridge: International Whaling Commission), 43–52.
Keywords: dolphin, Sousa sahulensis, Tursiops sp., Orcaella heinsohni, capture-recapture, multistate robust design, monitoring, photo-identification
Citation: Brooks L, Palmer C, Griffiths AD and Pollock KH (2017) Monitoring Variation in Small Coastal Dolphin Populations: An Example from Darwin, Northern Territory, Australia. Front. Mar. Sci. 4:94. doi: 10.3389/fmars.2017.00094
Received: 13 December 2016; Accepted: 20 March 2017;
Published: 13 April 2017.
Edited by:
Rob Harcourt, Macquarie University, AustraliaReviewed by:
Antonios D. Mazaris, Aristotle University of Thessaloniki, GreeceTilen Genov, Morigenos-Slovenian Marine Mammal Society, Slovenia
Copyright © 2017 Brooks, Palmer, Griffiths and Pollock. This is an open-access article distributed under the terms of the Creative Commons Attribution License (CC BY). The use, distribution or reproduction in other forums is permitted, provided the original author(s) or licensor are credited and that the original publication in this journal is cited, in accordance with accepted academic practice. No use, distribution or reproduction is permitted which does not comply with these terms.
*Correspondence: Carol Palmer, caroll.palmer@nt.gov.au