 Jaime Otero
 Xosé Antón Álvarez-Salgado
 Antonio Bode
- 1Instituto de Investigaciones Marinas (IIM-CSIC), Vigo, Spain
- 2Centro Oceanográfico de A Coruña, Instituto Español de Oceanografía, A Coruña, Spain
Species composition plays a key role in ecosystem functioning. Theoretical, experimental and field studies show positive effects of biodiversity on ecosystem processes. However, this link can differ between taxonomic and functional diversity components and also across trophic levels. These relationships have been hardly studied in planktonic communities of coastal upwelling systems. Using a 28-year time series of phytoplankton and zooplankton assemblages, we examined the effects of phytoplankton diversity on resource use efficiency (RUE, ratio of biomass to limiting resource) at the two trophic levels in the Galician upwelling system (NW Iberian peninsula). By fitting generalized least square models, we show that phytoplankton diversity was the best predictor for RUE across planktonic trophic levels. This link varied depending on the biodiversity component considered: while the effect of phytoplankton richness on RUE was positive for phytoplankton RUE and negative for zooplankton RUE, phytoplankton evenness effect was negative for phytoplankton RUE and positive for zooplankton RUE. Overall, taxonomic diversity had higher explanatory power than functional diversity, and variability in phytoplankton and zooplankton RUE decreased with increasing phytoplankton taxonomic diversity. Phytoplankton used resources more efficiently in warmer waters and at greater upwelling intensity, although these effects were not as strong as those for biodiversity. These results suggest that phytoplankton species numbers in highly dynamic upwelling systems are important for maintaining the planktonic biomass production leading us to hypothesize the relevance of complementarity effects. However, we further postulate that a selection effect may operate also because assemblages with low evenness were dominated by diatoms with specific functional traits increasing their ability to exploit resources more efficiently.
Introduction
Marine phytoplankton is responsible for roughly half of the global primary production (50 Pg C year−1; Chavez et al., 2011), contributes to nutrient cycling and regulation of climate dynamics, affects the fate of adjacent trophic levels (Richardson and Schoeman, 2004), and, ultimately, constrains fishery catches (Chassot et al., 2010). Marine phytoplankton is an extremely diverse group of organisms (De Vargas et al., 2015), and this diversity, encompassing a large variety of life histories, is an essential factor that affects the whole structure of marine ecosystems (Naeem, 2012). It is indeed the diversity of functional traits that differs among and within species and taxonomic groups, the key component determining the fitness of planktonic communities along environmental gradients and influencing the functioning of pelagic ecosystems (Irwin and Finkel, 2018). Therefore, there is a need to better understand the relationship between the variability in phytoplankton diversity and its effects on ecosystem processes.
In recent years, various reviews have synthesized the effects of alterations of biodiversity (B) on ecosystem functioning (EF) concluding that biodiversity has a major role in sustaining the productivity of ecosystems and their stability (Cardinale et al., 2012; Tilman et al., 2014). Most of this evidence comes from controlled experiments; however, field studies are also consistent with theory and experiments demonstrating the strong effect of biodiversity on ecosystem production even after accounting for abiotic forcing (Duffy et al., 2017). In the marine realm, several studies have been devoted also to understand the effects that marine biodiversity has on production, biomass, or on the resilience to disturbances or invasions (Stachowicz et al., 2007; van der Plas, 2019). Yet the majority of this experimental and field research has examined relationships in the benthos (O'Connor and Byrnes, 2014; Duffy et al., 2017). Regarding the pelagos, recent studies have addressed BEF relationships within natural assemblages of plankton either in fresh or marine waters. A BEF relationship in the plankton was first described by Ptacnik et al. (2008), who showed that resource-use efficiency (RUE), an ecological index that measures the proportion of supplied resources turned into new biomass (Hodapp et al., 2019), scaled positively with phytoplankton taxonomic richness in multiple Fennoscandian lakes and in the Baltic Sea. Korhonen et al. (2011) also used data from boreal lakes to connect, in this case, productivity to diversity of various plankton groups showing linear, unimodal, or nonsignificant relationships between richness and biomass production depending on the spatial scale. Furthermore, Olli et al. (2014), using long-term phytoplankton sampling, concluded that increased diversity enhanced RUE for primary producers across the brackish Baltic Sea. However, it is unclear if these BEF relationships apply to highly dynamic Eastern Boundary Upwelling Ecosystems (EBUEs). For instance, in the California Current System, an ecosystem model coupled to a circulation model showed a hump-shaped relationship between diversity and productivity with portions of the diversity-productivity scatter being dependent on geographic regions (Goebel et al., 2013). Other authors did not find a relationship between phytoplankton species richness and ecosystem productivity (e.g., Cermeño et al., 2013).
Typically, the majority of BEF studies have used richness as the metric of biodiversity because it is easy to manipulate in experiments and to measure in the field. However, there is also evidence of the relevance of other components of biodiversity to understand pelagic processes. For instance, some authors have studied the effect(s) of evenness on planktonic ecosystem properties showing a strong negative effect on RUE in the phytoplankton of the Wadden Sea (Hodapp et al., 2015) or on biomass and resource use in the phytoplankton of the Baltic Sea (Lehtinen et al., 2017) highlighting the importance of the identity of dominant species. Besides taxonomic diversity, biodiversity can be assessed in terms of functional diversity, that is, accounting for the expression of multiple functional traits in the community, often concluding that functional diversity can be a better predictor of ecosystem properties than taxonomic diversity as shown for phytoplankton communities in Fennoscandian lakes (Abonyi et al., 2018). Whether taxonomic or functional diversity of competing species affects ecosystem properties, it is also fundamental to incorporate trophic complexity in order to understand the effects of biodiversity across trophic levels (Duffy et al., 2007). In experimental planktonic systems, Striebel et al. (2012) showed that phytoplankton diversity increased zooplankton productivity, while Filstrup et al. (2014) showed that the effect of phytoplankton evenness on RUE switched from negative at the producer level (phytoplankton) to positive at the consumer level (zooplankton) in US lakes.
Apart from average effects on ecosystem functioning, theory, experiments, and field studies predict that increasing diversity can reduce the variability of community biomass or other ecosystem properties in time and space through several mechanisms (Loreau and de Mazancourt, 2013). This would occur because more diverse assemblages containing interacting species, which respond differently to the environment are more likely to buffer the effects of perturbations conferring stability to the community and maintaining the ecosystem properties in a dynamic environment (Ives and Carpenter, 2007). Stability, however, is a complex and multifaceted concept with multiple components, such as variability, resistance, or resilience, which might be unrelated implying that the overall stability of an ecosystem might not be simply explained by one particular component (Hillebrand et al., 2018), thus leading to different biodiversity-stability relationships (Craven et al., 2018). Most analyses on biodiversity-stability relationships have been performed through experiments in terrestrial systems (Tilman et al., 2014), whereas fewer studies dealt with natural ecosystems, and the majority have focused on plants (e.g., García-Palacios et al., 2018; but see Cusson et al., 2015). In the case of natural plankton assemblages, Ptacnik et al. (2008) showed that higher levels of phytoplankton taxonomic richness implied less variability of both resource use and community composition, and Shurin et al. (2007) documented a positive relationship between zooplankton diversity and community stability in temperate lakes. Despite all these research efforts, the importance of phytoplankton diversity on stability in EBUEs, so as the shape of BEF relationships between trophic levels, and the performance of functional diversity vs. taxonomic diversity have been yet poorly addressed (but see Cermeño et al., 2013; Goebel et al., 2013; Vallina et al., 2017).
Planktonic communities are highly dynamic with assemblages changing rapidly in response to circulation and fertilization patterns and other physical and environmental forcing. This is even more evident in coastal upwelling systems where planktonic assemblages might fluctuate at short-time scales with different assemblages characterizing the various phases of an upwelling cycle (Marañón, 2015). At larger spatial and temporal scales, the structure of phytoplankton and zooplankton assemblages is affected by seasonal changes, with species' abundance responding to light conditions, temperature, nutrient inputs, or the presence of particular producers and consumers (Wiltshire et al., 2015). Therefore, planktonic biodiversity is affected by the physical environment, water hydrography, and biotic variables (Sarker et al., 2018). However, BEF studies have focused less on the abiotic and biotic context that might exert comparable effects to changes in species richness in mediating ecosystem properties (Godbold, 2012; van der Plas, 2019). Thus, accounting for the environmental context in BEF relationships under natural (or experimental) conditions is crucial to understand and interpret the effects that changing biodiversity has on ecosystem properties (García et al., 2018), stability (García-Palacios et al., 2018), or community performance (Schabhüttl et al., 2013).
In this study, we analyzed whether the phytoplankton diversity effects on ecosystem function follows theoretical and experimental expectations in real communities occurring in EBUEs for which knowledge is limited. In doing so, we used long-term time series of phytoplankton and zooplankton community data in conjunction with meteorological and hydrographic data to examine BEF relationships in a highly dynamic coastal upwelling ecosystem. In particular, we (i) evaluated the effect of two components of phytoplankton taxonomic diversity (richness and evenness) on phytoplankton and zooplankton rates of productivity to the amount of available resources (i.e., RUE), (ii) tested whether biodiversity influences planktonic RUE variability, (iii) quantified the importance of biodiversity relative to environmental conditions in driving planktonic RUE dynamics, and (iv) evaluated the explanatory power of phytoplankton taxonomic diversity vs. functional diversity in explaining planktonic RUE.
Materials and Methods
Study Area and Plankton Sampling
Galicia is at the northern boundary of the Iberia/Canary current EBUE (Figure 1). Coastal winds at these latitudes (42° to 44° N) are seasonal; northerly winds prevail from March–April to September–October, promoting coastal upwelling, and downwelling-favorable southerly winds predominate the rest of the year. However, more than 70% of the variability in coastal winds occurs in periods of <1 month, so that the upwelling season appears as a succession of wind-stress events separated by wind-calm episodes, with a wide variety of frequencies ranging from 3 to 15 days (Álvarez-Salgado et al., 2002).
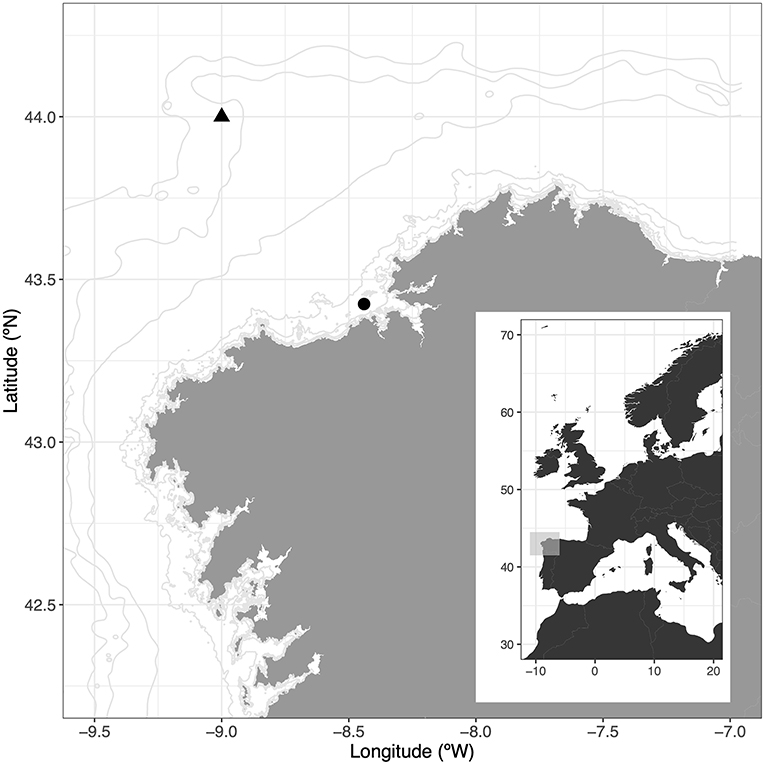
Figure 1. Map of study area showing the location of the plankton and hydrographic sampling station (black dot), and the location of the grid cell where the upwelling index was calculated (black triangle).
Phytoplankton identification and count data were obtained from the time series project RADIALES conducted by the Instituto Español de Oceanografía off A Coruña (NW Spain, Figure 1) (Bode et al., 2009). Specifically, water samples were collected monthly with 5 L of Niskin bottles or a rosette sampler from 0-, 5-, 10-, 20-, 30-, 40-, and 70-m depths at station E2CO (water depth, 80 m; 43°25′30″N, 08°26′20″W; Figure 1) from January 1989 to December 2016 (n = 313 days sampled), though sampling at 7 m ended in 1993, and from 2010 onward, samples were taken just from 3 depths between the surface and 40 m including the depth of the surface chlorophyll maximum. For each depth, samples were collected for the determination of phytoplankton abundance and inorganic nutrients and chlorophyll a concentration following the methods described in Casas et al. (1997). Phytoplankton samples of volume 50–100 ml were preserved in Lugol's solution and kept in the dark until analysis. Depending on phytoplankton concentration, 10–25 ml of samples was allowed to settle in the Utermöhl chamber for up to 24 h. Samples were counted following the technique described by Utermöhl (Lund et al., 1958) using a Nikon Diaphot TMD microscope until May 1997 and a Nikon Eclipse TE300 microscope until the end of the time series. A magnification of 100× was used for large forms, 250× for intermediate forms, and 400× for small forms. The entire slide was examined at 100× to account for large species, while only transects or smaller areas were examined at higher magnification. At least 250 cells were counted for each sample. Whenever possible, organisms were classified at the species or genus level. Species nomenclature followed the World Register of Marine Species (http://www.marinespecies.org). The samples were identified by two experts (M. Varela until 2010, and J. Lorenzo from 2010 to 2016). The individual biomass (in pg C) for each identified taxa was estimated from cell biovolume (in μm3) after measuring the dimensions of 30–100 cells in samples distributed over all seasons and applying conversion equations from the literature (see details in Huete-Ortega et al., 2010). Biomass (in pg C L−1) of a given species in a given day and sampled depth was then calculated as the abundance (in cells L−1) times the cell biomass. For the purposes of the present work, we used the taxa that were systematically identified at the species level in at least 10 samples along the time series. This resulted in a set of 73 taxa, 18 of which started to be identified in 2008 (Supplementary Table 1). The total biomass (obtained as the sum of the biomass of all counted species in each day and sampled depth) was significantly correlated with chlorophyll a concentration (Supplementary Figure 1), and the biomass was dominated by diatoms (Supplementary Figure 2). The original dataset is available at PANGAEA (https://doi.org/10.1594/PANGAEA.908815) (Bode, 2019). Additionally, we collated a series of morphological (cell size and ability to form chains or colonies), physiological (silica requirement, trophic strategy, and pigment composition), and behavioral (ability to swim) traits for each phytoplankton species (Supplementary Table 1) using our own compilation and data from the literature (Klais et al., 2017). This group of traits is of relevance for reproduction, resource acquisition, and survival (Litchman and Klausmeier, 2008). Together, they affect phytoplankton fitness and are involved in several functions such as light use, nutrient uptake, or predator avoidance. Cell size can be further considered as a key trait that affects metabolism, growth rate, and community structure among others (Marañón, 2015).
Zooplankton was sampled at the same station and dates as phytoplankton by means of double oblique tows from the surface to 5 m of the bottom using a 50-cm diameter Juda—Bogorov plankton net with 250-μm (until 1997) or 200-μm (from 1997 onward) mesh size. The net was equipped with a General Oceanic Flowmeter for the calculation of water filtered and a depth recorder. Samples were preserved in 2–4% sodium borate-buffered formaldehyde. Subsamples were taken to estimate total zooplankton abundances (in ind × m−3) by direct examination using a stereo microscope, and biomass (in μg DW × L−1) by weighting dried aliquots (50°C, 48 h). Further details can be found in Bode et al. (2012). The original dataset is available at PANGAEA (https://doi.org/10.1594/PANGAEA.908815) (Bode, 2019).
Hydrographic Sampling and Analysis
Concurrently with the plankton samples, vertical profiles of temperature and salinity were measured with a CTD probe (Seabird SBE-25). The salinity of the CTD was checked against the salinity of bottom water samples measured with an induction salinometer Autosal 8400A calibrated with Standard Seawater (Casas et al., 1997). Salinity was expressed in the practical salinity scale (UNESCO, 1986). Nitrate concentration (NO3 in μmol L−1) was determined by segmented flow analysis according to the standard procedures of Grasshoff et al. (1983) using a Technicon AA-II (1989–2006), a Bran–Luebbe AA3 (2007–2012), and a Seal Analytics QuAAttro 39 (2013–2016). Chlorophyll a concentration (Chl a in mg m−3) was measured by fluorimetric analysis of acetone extracts of phytoplankton collected on 0.8-μm pore-size membrane filters (until 1992) or GF/F filters (from 1993 onward). Specific calibrations were performed to ensure the continuity of the chlorophyll series when changing from the filter fluorometer method (Parsons et al., 1984) to the spectrofluorimetric technique (Neveux and Panouse, 1987) after 2001. Nutrient and chlorophyll data series are available at: https://doi.org/10.1594/PANGAEA.885413 (Bode et al., 2018).
Physical Forcing
Daily upwelling index (UI in m3 s−1 km−1) data, a rough estimate of the volume of water upwelled per km of coastline for the period 1989 to 2016 were downloaded from: http://www.indicedeafloramiento.ieo.es/index_UI_en.html. UI was estimated from geostrophic winds calculated from the surface atmospheric pressure fields supplied every 6 h by the US Navy Operational Global Atmospheric Prediction System (NOGAPS) model maintained by the Fleet Numerical Meteorological and Oceanography Center (http://www.usno.navy.mil/FNMOC/) in a 1° × 1° grid centered at 44°N 9°W (Figure 1). This cell is representative for the physical forcing that determines the impact of coastal upwelling in the region (Bode et al., 2015). We used the meridional wind component, thus the UI represents the volume of water upwelled along the West–East direction with positive values of UI indicating upwelling-favorable conditions. Conversely, negative values indicate downwelling-favorable conditions. Further numerical details can be found in González-Nuevo et al. (2014). In this study, values of UI were averaged over 15 days prior to each sampling date.
Data Analyses
Resource-Use Efficiency and Biodiversity Estimations
Phytoplankton resource-use efficiency (RUEpp) was calculated sensu Ptacnik et al. (2008) in terms of phytoplankton carbon biomass (pg C L−1) per unit of nitrate concentration (μmol L−1), i.e., RUEpp = phytoplankton biomass/ concentration. Other components such as ammonia are important for the dissolved inorganic nitrogen (DIN) pool in this region; however, this variable was not measured with the same periodicity. Nonetheless, nitrate is the main limiting nutrient for the primary production in this region (Álvarez-Salgado et al., 1997). Zooplankton resource-use efficiency (RUEzp) was calculated sensu Filstrup et al. (2014) in terms of zooplankton biomass (μg L−1) per unit phytoplankton carbon biomass (pg C L−1), i.e., RUEzp = zooplankton biomass/phytoplankton biomass. Both ratios were natural log-transformed for later modeling.
Taxonomic diversity (TD) was expressed as species richness (S) and as evenness (J) (Pielou, 1966) using phytoplankton biomass as follows:
where Hmax = lnS and where Bi is the biomass of a species i, and Btot is the total biomass. Additionally, we calculated various uncorrelated multitrait-based functional diversity (FD) metrics, which capture the various aspects of functional diversity (Mouchet et al., 2010). In particular, FD was expressed as functional group richness (FGR) and functional dispersion (FDis) following Laliberté and Legendre (2010), and functional evenness (FEve) following Villéger et al. (2008). To calculate the FD metrics, the abundance matrix was based on species biomass, and the functional trait matrix contained a quantitative variable (cell biomass expressed in log units) and other six binary variables describing other morphological, physiological, and behavioral traits (see Supplementary Table 1). FGR is a dendrogram-based indicator of functional groups computed from an a posteriori classification of species based on their functional traits for which the Ward method was used to create the dendrogram of the species that was cut at nine functional groups. FDis is a distance-based metric that measures the distance to the centroid of the assemblage in the trait space, and FEve is a metric that combines the evenness of species spacing in trait space and the evenness of species relative abundances. FDis and FEve metrics were weighted by the biomass of the species, and FEve was not defined for samples with fewer than three taxa (n = 6 cases). Finally, single-trait-based indices, that is, community-weighted mean (CWM) traits were also calculated to examine phytoplankton single-trait contributions to RUE. CWMs were calculated for each trait weighted by species biomass using methods implemented by Laliberté and Legendre (2010).
Statistical Analyses
The values of RUEpp calculated for a day i and depth j were modeled using generalized least square (GLS) models that were formulated as follows:
where α is an intercept, and nsn is a natural cubic spline describing the effect of the day of the year (DoY), i.e., the seasonality, the time trend, i.e., the interannual long-term pattern (days, i.e., consecutive days from 1989 to 2016), the depth (D), the water temperature (WT), the coastal upwelling index (UI), the phytoplankton richness (S), and the phytoplankton evenness (J). All splines had 2 degrees of freedom (df) with the exception of DoY that used 4 df. Finally, ϵi,j is a vector of errors assumed to have mean 0 and variance σ2. To evaluate the variability in the response variable, i.e., a nonconstant variance, the variance in RUEpp (σ2) was modeled as an exponential function of the environmental conditions (i.e., WT or UI) or the taxonomic diversity metrics (i.e., S or J). For instance, for WT: Var(ϵi,j) = σ2 × exp (2 × δ × WTi,j), where δ is an unknown parameter to be estimated that describes the estimated change in variance with water temperature. Model fitting improvement and comparison between the possible variance covariates were evaluated using the Akaike information criterion (AIC) and likelihood ratio tests (Pinheiro and Bates, 2000). Covariability among predictors was evaluated using variance inflation factors (VIFs).
The values of RUEzp calculated for a day i were also modeled using GLS models that were formulated as follows:
In this case, to match the zooplankton oblique tows, WT was averaged over the water column, and phytoplankton carbon biomass (necessary to calculate RUEzp, see above), S and J were estimated based on the species biomass averaged over the water column. The rest of the parameters and variance model are as described for Equation (1).
To enable comparison of the phytoplankton and zooplankton BEF relationships using taxonomic and functional diversity, RUEpp and RUEzp calculated for a day i were related to phytoplankton S, J, and FD metrics estimated also for a day i, therefore, based on the species biomasses averaged over the water column as explained above for the RUEzp model. To quantify the bivariate relationships, we used reduced major axis (RMA) regression, and we did not include other covariates in these models because biodiversity was the best predictor as observed in the more detailed models (see Results below).
Finally, complementary analyses were further performed. In particular, we confronted the patterns found using a measure of standing stock to quantify biomass production with other alternative forms of calculating RUEpp, that is, calculated sensu Ptacnik et al. (2008) in terms of chlorophyll a (mg m−3) per unit of nitrate (μmol L−1), and sensu Lehtinen et al. (2017) in terms of primary production (mg C m−3 h−1) per unit of nitrate (μmol L−1). Primary production was obtained from Bode et al. (2019). These models were fitted to data covering the whole period, though restricting the phytoplankton species to the 55 taxa that were consistently identified along all three decades (Supplementary Table 1).
All treatment of data and analyses were performed with the software R (version 4.0.2, R Core Team, 2020) and using the packages “nlme 3.1-149” (Pinheiro and Bates, 2000), “relaimpo 2.2-3” (Grömping, 2006), “FD 1.0-12” (Laliberté and Legendre, 2010), and “lmodel2 1.7-3” (Legendre and Legendre, 1998).
Results
Phytoplankton Resource-Use Efficiency
The model fitted to phytoplankton resource-use efficiency data (Equation 1, Supplementary Table 2) revealed that RUEpp showed a seasonal cycle peaking in late March to early April (Figure 2A) and a nonlinear long-term trend over the study period (Figure 2B). RUEpp decreased linearly with sampling depth (Figure 2C) and was positively related to water temperature (Figure 2D) and upwelling index (Figure 2E). Furthermore, RUEpp was related to taxonomic diversity scaling positively with phytoplankton richness (Figure 2F) and negatively with phytoplankton evenness (Figure 2G). Studying the importance of predictors for RUEpp based on the proportional marginal variance decomposition, taxonomic diversity, and richness (61.5%) in particular, was the best predictor in explaining RUEpp dynamics, whereas the environmental factors (WT and UI) played a secondary role (Supplementary Table 2). Including a variance model in the GLS as an exponential function of covariates resulted in better fittings (Supplementary Table 3). More specifically, the spread of RUEpp decreased with evenness that was the most optimal variance covariate. In particular, an increase in 0.2 units of phytoplankton evenness reduced RUEpp variability by 21.4% (Supplementary Table 3). Finally, the RUEpp model did not show any relevant remaining patterns in the residuals (Supplementary Figure 3).
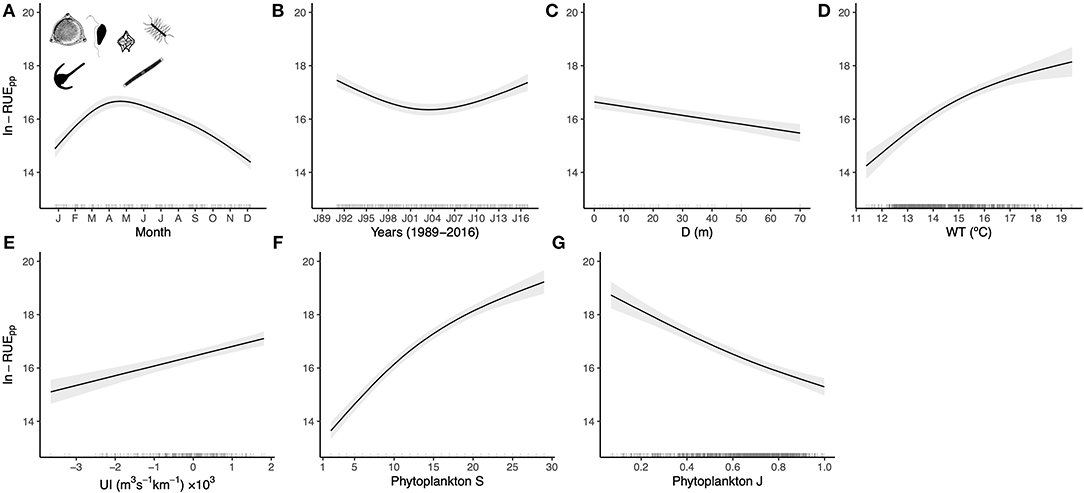
Figure 2. Partial-effects plots from the RUEpp GLS model depicted in Equation (1). Shown are the seasonal (A) and long-term (B) changes in RUEpp, the trend with depth (C), and the relationships with water temperature (D), upwelling index (E), phytoplankton richness (F), and phytoplankton evenness (G). Bands indicate 95% confidence intervals and the rugs along the x-axes display the distribution of the data. See ANOVA table in Supplementary Table 2 and model selection of variance covariates in Supplementary Table 3. Silhouettes were obtained from http://www.phylopic.org.
Zooplankton Resource-Use Efficiency
The model fitted to zooplankton resource-use efficiency data (Equation 2, Supplementary Table 4) revealed that RUEzp showed a seasonal cycle peaking in late March to early April (Figure 3A) and a decreasing trend from 2003 onward (Figure 3B). RUEzp was positively related to water temperature (Figure 3C) and had a nonlinear relationship with the upwelling index (Figure 3D). Furthermore, RUEzp was related to phytoplankton taxonomic diversity scaling negatively with richness (Figure 3E) and positively with evenness (Figure 3F). As for the case of RUEpp, when studying the importance of predictors for RUEzp, taxonomic diversity, and richness (66.6%) in particular, was the best predictor, whereas the environmental factors played a secondary role (Supplementary Table 4). Including a variance model in the GLS as an exponential function of covariates resulted in better fittings (Supplementary Table 5). More specifically, the spread of RUEzp decreased with richness that was the most optimal variance covariate. In particular, an increase in 10 units of phytoplankton richness reduced RUEzp variability by 18.8% (Supplementary Table 5). Finally, the RUEzp model did not show any relevant remaining patterns in the residuals (Supplementary Figure 4).
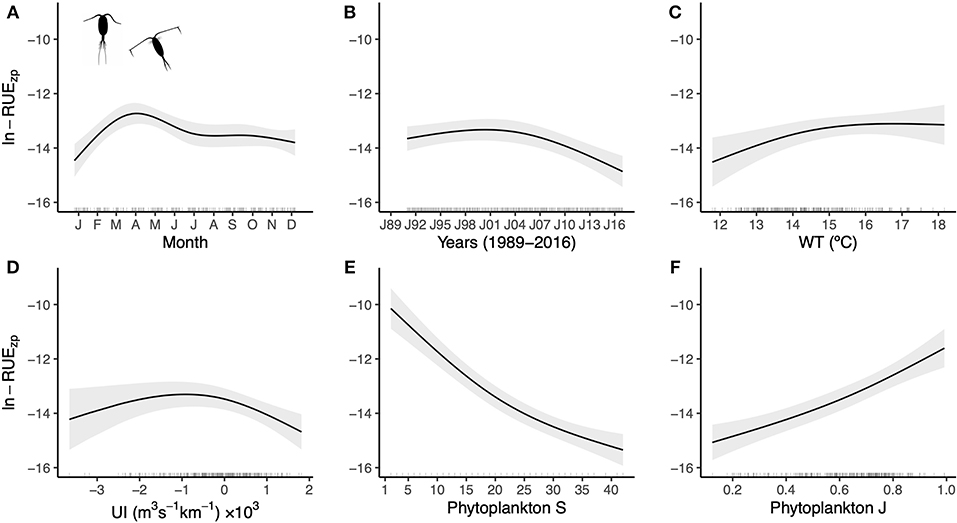
Figure 3. Partial-effects plots from the RUEzp GLS model depicted in Equation (2). Shown are the seasonal (A) and long-term (B) changes in RUEzp, and the relationships with water temperature (C), upwelling index (D), phytoplankton richness (E), and phytoplankton evenness (F). Bands indicate 95% confidence intervals, and the rugs along the x-axes display the distribution of the data. See ANOVA table in Supplementary Table 4, and model selection of variance covariates in Supplementary Table 5. Silhouettes were obtained from http://www.phylopic.org.
Taxonomic and Functional Diversity Effects on Resource-Use Efficiency
Multitrait-based functional diversity metrics were unrelated, though they showed a certain degree of association with taxonomic diversity, especially between FDis and J, and FGR and S (Supplementary Figure 5). Figures 4, 5 compare the effects of taxonomic and functional diversity of phytoplankton on RUEpp and RUEzp, respectively. First, both taxonomic (Figure 4A) and functional (Figure 4C) richness had positive effects on RUEpp, while the effects were negative on RUEzp (Figures 5A,C). Second, both taxonomic (Figure 4B) and functional (Figure 4D) evenness had negative effects on RUEpp, while the effects were positive on RUEzp (Figures 5B,D). Finally, the relationship with FDis showed the same trend as for FEve for phytoplankton RUE, where more functionally similar phytoplankton assemblages had higher RUE (Figure 4E), and for zooplankton RUE, where zooplankton preying upon more functionally dissimilar phytoplankton assemblages had higher RUE (Figure 5E). Regarding the explanatory power, TD metrics had higher explanatory power (i.e., greater R2) compared to FD metrics. Within TD, richness was a better predictor (48 and 47% for RUEpp and RUEzp, respectively), whereas within FD, FEve was a better predictor (29 and 20% for RUEpp and RUEzp, respectively). All slopes were statistically significant (p < 0.0001), and in all cases, elevated RUEpp values occurred when diatom biomass was higher, while,when RUEzp values were higher, phytoplankton biomass was less dominated by diatoms.
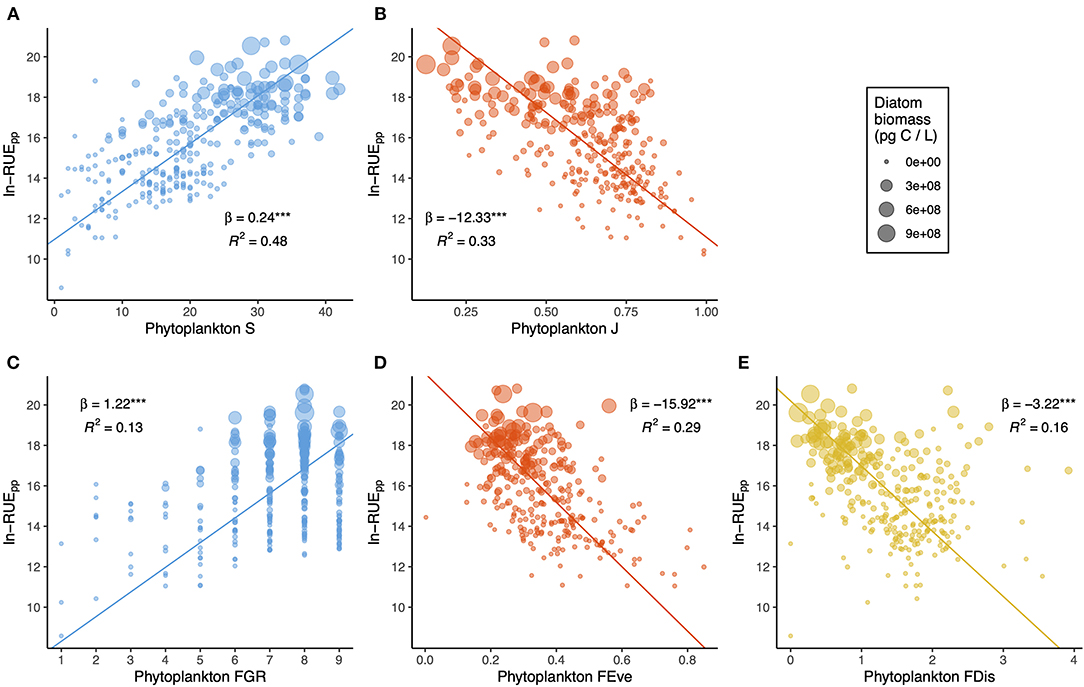
Figure 4. Bivariate plots showing the effects of phytoplankton taxonomic (A,B) and functional (C–E) diversity on RUEpp. Dot size is scaled to diatom biomass, and lines show reduced major axis (RMA) fits. For each relationship, the slope (and statistical significance with parametric p-value < 0.0001***) and the explanatory power are shown.
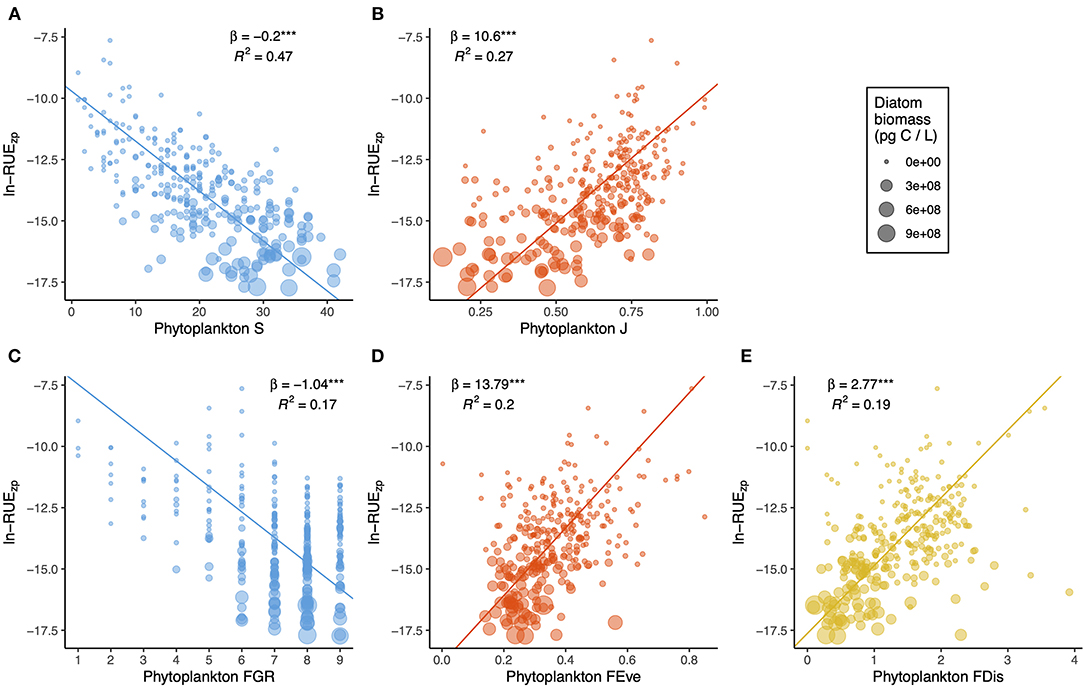
Figure 5. Bivariate plots showing the effects of phytoplankton taxonomic (A,B) and functional (C–E) diversity on RUEzp. Dot size is scaled to diatom biomass, and lines show RMA fits. For each relationship, the slope (and statistical significance with parametric p-value < 0.0001***) and the explanatory power are shown.
Finally, regarding the phytoplankton single-trait-based indices, three CWMs had important effects on plankton RUE: the ability to use biogenic silica, the ability to swim, and the ability to form chains or colonies (Figure 6, Supplementary Table 6). For RUEpp, the largest contributor was CWMchain (Figure 6C), while CWMmotility (Figure 6B) and CWMsilica (Figure 6A) contributed less to explain phytoplankton resource use. For RUEzp, all three CWMs contributed almost equally to zooplankton resource use (Figures 6D–F), though the contribution of CWMmotility was slightly higher (Supplementary Table 6). RUEpp increased with CWMsilica and CWMchain, and decreased with CWMmotility. However, the direction of the effects was the opposite for the case of RUEzp.
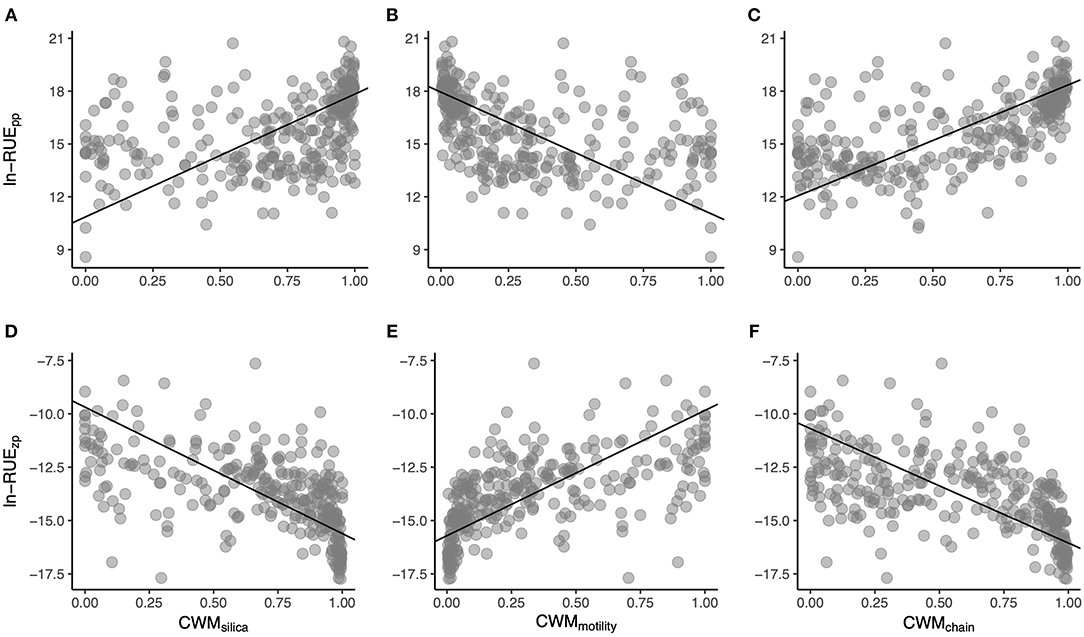
Figure 6. Scatterplots showing the relationships between RUEpp (A–C) and RUEzp (D–F) with CWMsilica (A,D), CWMmotility (B,E), and CWMchain (C,F). Lines show RMA fits, and corresponding numerical data are provided in Supplementary Table 6.
Complementary Analyses
Models using alternative calculations of RUEpp, namely, with chlorophyll a (Supplementary Figure 6) and primary production (Supplementary Figure 7) and fitted to data covering the whole period though restricting the phytoplankton species to the 55 taxa that were consistently identified along all three decades, resulted roughly in the same patterns as described above using a measure of standing stock to quantify the phytoplankton biomass production.
Discussion
Phytoplankton and Zooplankton Resource-Use Efficiency
The model for RUEpp showed that more phytoplankton species lead to higher biomass per unit resource. This positive relationship between phytoplankton RUE and richness concurs with earlier observations made in aquatic systems both in the field (Ptacnik et al., 2008) and in experiments (Striebel et al., 2009a). At the same time, the model revealed also a negative relationship between evenness and RUEpp, which again agrees well with previous field observations in differing aquatic systems such as is the Wadden Sea, where phytoplankton evenness was the most important driver of productivity and RUE (Hodapp et al., 2015), or in Midwestern US lakes, where phytoplankton RUE was inversely related to phytoplankton evenness (Filstrup et al., 2014). On the other hand, the model for RUEzp showed that zooplankton communities produced the least biomass per unit of phytoplankton biomass when feeding upon species-rich phytoplankton communities but dominated by few species or group of species. Again, this result concurs with previous findings documenting a negative relationship between phytoplankton evenness and the production of zooplankton biomass per unit of phytoplankton biomass in lakes (Filstrup et al., 2014). However, it differs from Filstrup et al. (2019) who found a nonsignificant role of phytoplankton richness in driving zooplankton resource use efficiency in lakes.
In general, two nonexclusive mechanisms have been identified to explain why biodiversity enhances ecosystem function: complementarity, by which more diverse communities use limiting resources more efficiently through niche partitioning or facilitation, and the selection effect, by which more diverse communities are more likely to include a few dominant species with specific traits that drive the ecosystem functioning (O'Connor and Byrnes, 2014). Separating and quantifying these processes can be addressed experimentally (Loreau and Hector, 2001); however, it is rather difficult to differentiate between these two mechanisms in the field. Nevertheless, the positive effect of richness found in our study can be likely explained by the niche complementarity mechanism. This interpretation would be based on the premise that a more diverse community may include more diverse traits such as light and nutrient utilization traits reflecting a better niche differentiation in wavelength utilization and resource use (Striebel et al., 2009a,b; Behl et al., 2011). This would be important during periods of nutrient enrichment (e.g., upwelling pulses) when more and more variable resources would facilitate the coexistence of a larger number of species. On the other hand, the negative effect of evenness would indicate that certain dominant species, or group of species, would exhibit specific traits that would give them certain physiological advantages allowing for a more efficient exploitation of resources, that is, a selection effect (Filstrup et al., 2019).
The simultaneous action of complementarity and selection effects would probably be associated to the heterogeneous environment that typically characterizes EBUEs. Coastal upwelling systems are highly productive regions where most of the biomass is usually composed of chain-forming diatoms especially during blooms (Sarthou et al., 2005). This fact has been shown also in our study zone where diatoms are the dominant group and assemblages change rapidly between upwelling/relaxation/downwelling phases (Casas et al., 1997). Diatoms are fast growing species capable of maintaining high nutrient uptake rates for longer periods, and exploit typical upwelling-intermittent nutrient pulses more effectively than other taxa of the same size (Marañón, 2015). Dominance primarily reflects the distribution of traits within a community and the identity of the dominant traits, thus this fact has been recognized as an important effect to explain the fate of ecosystem processes because evenness often responds more rapidly to altered environmental constraints than species richness leading to rapid responses in ecosystem functioning (Hillebrand et al., 2008). Given these premises, we suggest that the mechanistic basis for the shift in the effect of phytoplankton richness and evenness would be dependent on the diatom biomass and, more specifically, on the functional traits that diatoms have. This is evidenced by the relationships found with the community-weighted mean traits highlighting that the predominance of traits that characterizes diatom species, specially the ability to form chains and colonies, increases phytoplankton resource use. Furthermore, diatoms show high growth rates relative to their cell volume. However, nutrient traits tend to be similar among taxa for a typical cell size. This indicates that diatoms appear to be adapted to high nutrient conditions as those found within upwelling regions (Edwards et al., 2012). Indeed, phytoplankton species with greater growth rates and, in particular diatoms sampled in our region tend to respond more strongly to increased upwelling (Otero et al., 2018). Concurring with our results, a population growth model fitted to phytoplankton species over an annual cycle pointed out the fundamental importance of the selection effect in driving marine primary productivity (Cermeño et al., 2016).
This effect of diatom dominance would translate up in the food web. For the consumer level, we found lower RUEzp when phytoplankton biomass was dominated by diatoms, which could be likely explained by several factors including the lower impact that mesozooplankton compared to microzooplankton has on phytoplankton (e.g., Fileman and Burkill, 2001), the inhibition that diatom exudates can exert on zooplankton grazing (e.g., Malej and Harris, 1993), or the reduced impact that copepod grazing has on phytoplankton biomass and production during production peaks compared to upwelling transition periods when phytoplankton biomass is lower, and dinoflagellates are more abundant (e.g., Bode et al., 2003). Indeed, when there was a predominance of traits in the community that characterize dinoflagellate species (e.g., ability to swim), zooplankton resource use was higher. Likewise, in lakes, when zooplankton preys upon phytoplankton communities dominated by cyanobacteria, RUEzp decreases because cyanobacteria is a poor food source for zooplankton (Filstrup et al., 2014).
A simultaneous detection of a positive and negative effect of richness and evenness, respectively, on ecosystem function as the one observed here, was shown also by others either in fresh (Filstrup et al., 2019) or marine (Napoleón et al., 2014) waters. However, there are contrasting results on the relative contribution of the two effects, that is, the differences between the strength of the relationships. Overall, our models indicated that taxonomic richness consistently had much stronger effects on both phytoplankton and zooplankton RUE. This result contrasts with what has been observed in lakes, where evenness explained more variance in phytoplankton and zooplankton RUE than richness leading the authors to suggest that it might be the distribution of taxa rather than their number, the main driver of ecosystem function in lakes (Filstrup et al., 2019). Coastal upwelling ecosystems are highly heterogeneous and contain an enormous species richness rapidly changing with the environmental conditions. Such high number of species is probably necessary to maintain the overall productivity of the system and ensures the occurrence of highly productive species. This scenario would lead to both complementarity and selection effects operating simultaneously, with complementarity being stronger when functionally different species coexist (e.g., during the spring bloom) and take advantage of a heterogeneous resource supply, whereas selection effects would be important when a broad trait space coincides with a more homogeneous landscape (Hodapp et al., 2016). Nonetheless, taken altogether, our results suggest that the opposing effects of primary producer biodiversity on phytoplankton and zooplankton resource use efficiency would be of similar nature in the ocean and freshwater environment. However, there appear to be differences on the sensitivity of ecosystem functioning to richness and evenness that could be ascribed to intrinsic differences among systems, such as changes in hydrographic and biogeochemical characteristics, or the identity of the dominant taxa, or to other underlying mechanisms demanding further research.
Environmental Effects on Resource-Use Efficiency
Apart from the importance of the environmental conditions in determining the overall composition of the community outlined above, we detected direct abiotic effects on RUE and time-varying patterns. In particular, our statistical models showed an annual peak located in April for both phytoplankton and zooplankton RUE coinciding with the spring bloom (Casas et al., 1997). Moreover, there were somehow an interannual inverse pattern between RUEpp and RUEzp that would point to changes in the plankton community along years. In this regard, the studied system displayed phase shifts in plankton community structure around the turn of the 21st century following changes in climate and local hydrography (Bode et al., 2020). The models also revealed the influence of water temperature and upwelling intensity on RUE, albeit less pronounced than the effects of biodiversity. These effects were weak for RUEzp and especially apparent for RUEpp. Resource use efficiency had greater values when upwelling intensity was high and waters were warmer. This combination of high upwelling during the 15 days previous to the sampling date and high water temperature during the sampling date indicates the typical succession of intense upwelling followed by wind relaxation. The positive effect of upwelling contributes to fertilize the system, which promotes a proliferation of phytoplankton biomass and a more efficient use of resources during the subsequent upwelling relaxation (e.g., Huete-Ortega et al., 2010). The effect of temperature could also be explained because this variable favors cell growth. Besides that, RUEpp decreased with depth likely associated to the decrease in phytoplankton biomass in deeper and less illuminated waters. Therefore, the abiotic environment was found to play a role in explaining part of the variability of RUE; however, its effect was minor compared to those of biodiversity. Recent meta-analyses showed that the effects of abiotic and biotic drivers in mediating ecosystem properties can overlap or be even stronger than the effects of species loss in controlled experiments (Godbold, 2012). However, Ptacnik et al. (2008) showed in the field that the relative importance of abiotic drivers vs. that of richness was minor in explaining phytoplankton RUE dynamics, thus agreeing with our results. Moreover, Hodapp et al. (2015) identified also a weaker effect of temperature and light compared to evenness on phytoplankton productivity.
Biodiversity Effects on Resource-Use Efficiency Variability
Our statistical models also showed that phytoplankton and zooplankton RUE were both less variable at higher levels of diversity, evenness in the case of RUEpp, and richness in the case of RUEzp. These results indicate that RUEpp and RUEzp would be stabilized when phytoplankton biomass is more evenly distributed, and when zooplankton preys upon richer phytoplankton communities, respectively. In general, theoretical, experimental, and field studies conclude that temporal stability of ecosystem processes would be greater at higher diversity, usually in the form of species numbers, and that those processes would be simultaneously enhanced also at higher levels of diversity (Tilman et al., 2014). Our variance models do not explicitly account for the temporal scale, but we can interpret the fact that biodiversity increases RUE stability as a consequence of that; first, more diverse assemblages are more likely to include different species maintaining the ecosystem function under different environmental conditions (i.e., the insurance hypothesis), and second, more diverse assemblages may show increased asynchrony in species' abundances (i.e., the portfolio effect) favoring the stability of RUE (Thibaut and Connolly, 2013). Furthermore, contrary to expectations, our results showed that the highest levels of RUE were not associated with the lowest levels of variability. This would be in line with recent synthesis of multiple experiments, which concluded that, while biodiversity of primary producers simultaneously increases both the production and stability of biomass in terrestrial and aquatic ecosystems, these effects are independent, suggesting that an ecosystem process and its variability would not necessarily reach the highest levels simultaneously with biodiversity (Cardinale et al., 2013).
Taxonomic vs. Functional Diversity Effects on Resource-Use Efficiency
Our analyses included the evaluation of the performance of three FD metrics resulting in the same patterns as their TD counterparts. This is in line with other works that pointed out the validity and potential of using phytoplankton functional traits to explain community assembly and ecosystem processes both in fresh (e.g., Leruste et al., 2018) and marine (e.g., Breton et al., 2017) waters. However, our results showed that FD metrics were slightly poorer predictors of RUE than TD metrics. This observation differs from what has been previously shown by other comparative studies undertaken in fresh (Abonyi et al., 2018) and marine (Ye et al., 2019) waters where FD usually outperforms TD in predicting ecosystem functioning. This discrepancy could be explained in part because the set of traits included in our analysis is insufficient and does not fully capture the fine variability along the species-specific ecological niches. For instance, quantitative light utilization traits and nutrient utilization traits are determinant for species-specific metabolism; thus, both functions, efficient use of light and nitrogen acquisition, might not be well represented reducing the percentage of variance of RUE explained by FD. Functional traits are typically sourced from published laboratory experiments, usually not available for all studied species (as would be the case here) but for the most common species, thus preventing a thorough examination of FD effects on RUE for this particular upwelling ecosystem. Apart from the comparison in explanatory power between TD and FD, it is worth mentioning that, in contrast to TD, FD evenness outperformed FD richness, which was a poor predictor, suggesting that FEve captures better the distribution of species across the functional trait space and its effect on RUE. Furthermore, the observed effects of FDis highlight that an increase in functional similarity of phytoplankton increases phytoplankton production per unit of nitrate, whereas at the same time, zooplankton biomass per phytoplankton biomass was higher when phytoplankton assemblages were more functionally dissimilar. This would reinforce the hypotheses that a selection effect would occur when trait dissimilarity was low in diatom-dominated assemblages inducing greater phytoplankton RUE and lower zooplankton RUE. In line with this, Cadotte (2017) using experimental plant assemblages found opposing relationships between selection (negative) and complementarity (positive) effects with functional dispersion.
Study Limitations
Our study has some limitations. On the one hand, we have not accounted for potential cell size changes through time that might bias biomass calculations as size is expected to decrease when temperature increases (Morán et al., 2010). On the other hand, and more importantly, we acknowledge that we have worked with an incomplete number of species. It is known that conventional sampling methods may underestimate phytoplankton diversity (Cermeño et al., 2014); however, we used a very specific assemblage that made the dataset more homogeneous along the time series. This assemblage was indeed representative as shown by the relationship between chlorophyll a and phytoplankton carbon, and covered the most abundant species occurring in this region in each recognized upwelling/relaxation/downwelling phase (Casas et al., 1997). Furthermore, this assemblage was able to explain the variability in phytoplankton and zooplankton RUE calculated in terms of chlorophyll a. Additionally, our definition of RUE was based on the quantification of biomass production using a measure of standing stock thus not accounting for gross production; nonetheless, using a direct measure of primary production (secondary production was not available), we also found comparable patterns in the dynamics of RUEpp. These complementary analyses suggest that the patterns found are robust. Therefore, we believe that, given the consistency of the sampling methods along the three decades, and the comparable results obtained using different RUE calculations, the facts outlined above could have some influence on the effect size of our models, for instance, by minimizing the effect of rare species, though not on the direction of the effects. Finally, we assumed here a single resource limitation (nitrate); thus, further investigations are needed to explore the importance of colimitation or multiple resource limitation (Hodapp et al., 2019) following the dynamics of upwelling.
Conclusions
We found that taxonomic and functional diversity enhance planktonic resource use efficiency in a coastal upwelling system. The sign of this relationship differed with the components of diversity considered (richness vs. evenness) and had opposite patterns across trophic levels. These effects can be likely explained through a simultaneous complementarity effect, by which more diverse assemblages with more diverse functional traits use resources more efficiently, and a selection effect through the dominance of diatoms growing rapidly and exploiting typical upwelling-intermittent nutrient pulses more effectively than other taxa of similar cell size. Additionally, resource use efficiency was less variable at higher levels of diversity; however, greater stability was not associated with the highest levels of RUE. Our results contribute to the understanding of phytoplankton diversity effects on ecosystem processes underpinning the differing effects of two contrasting biodiversity metrics and how these relationships vary across adjacent trophic levels in a coastal upwelling area. Incorporation of this approach to the observation, experimentation, and modeling of plankton ecology in EBUEs will allow gaining understanding on the important processes occurring in these productive coastal ecosystems and how these processes are mediated by biodiversity.
Data Availability Statement
The datasets presented in this study can be found in online repositories. The names of the repository/repositories and accession number(s) can be found below: https://doi.org/10.1594/PANGAEA.908815; https://doi.org/10.1594/PANGAEA.885413.
Author Contributions
JO designed the project. AB provided the data. JO analyzed the data with assists from AB and XÁ-S. JO wrote the manuscript with comments from co-authors. All authors contributed to the article and approved the submitted version.
Funding
This work is part of the time series project RADIALES conducted and funded by the Instituto Español de Oceanografía (http://www.seriestemporales-ieo.net) with additional support from project MarRisk (Interreg POCTEP Spain-Portugal) grant number 0262 MARRISK 1 E, from grants Contrato-Programa GAIN-IEO, and grant number IN607A2018/2 of the Axencia Galega de Innovación (GAIN, Xunta de Galicia, Spain). JO was supported by a Junta para la Ampliación de Estudios Fellowship (JAE-Doc programme 2011) from the CSIC and ESF.
Conflict of Interest
The authors declare that the research was conducted in the absence of any commercial or financial relationships that could be construed as a potential conflict of interest.
Acknowledgments
This article is dedicated to the memory of Dr. Manuel Varela, respected friend and colleague, who passed away on October 24, 2019. We would like to acknowledge the dedication of a large number of technicians, crew members, and scientists who contributed to the observational time series project RADIALES. We are particularly indebted to M. Varela (phytoplankton) and M. T. Álvarez-Ossorio (zooplankton) for maintaining the plankton series for more than 20 years. J. Lorenzo continued the phytoplankton counts since 2011, and E. Rey and M. A. Louro ensured the continuity of the zooplankton series. Nutrient data were provided by N. González and R. Carballo (1989–2012) and by M. Álvarez and M. Castaño (2013–2016).
Supplementary Material
The Supplementary Material for this article can be found online at: https://www.frontiersin.org/articles/10.3389/fmars.2020.592255/full#supplementary-material
References
Abonyi, A., Horváth, Z., and Ptacnik, R. (2018). Functional richness outperforms taxonomic richness in predicting ecosystem functioning in natural phytoplankton communities. Fresh. Biol. 63, 178–186. doi: 10.1111/fwb.13051
Álvarez-Salgado, X. A., Beloso, S., Joint, I., Nogueira, E., Chou, L., Pérez, F., et al. (2002). New production of the NW Iberian shelf during the upwelling season over the period 1982–1999. Deep Sea Res. I 49, 1725–1739. doi: 10.1016/S0967-0637(02)00094-8
Álvarez-Salgado, X. A., Castro, C. G., Pérez, F. F., and Fraga, F. (1997). Nutrient mineralization patterns in shelf waters of the Western Iberian upwelling. Cont. Shelf Res. 17, 1247–1270. doi: 10.1016/S0278-4343(97)00014-9
Behl, S., Donval, A., and Stibor, H. (2011). The relative importance of species diversity and functional group diversity on carbon uptake in phytoplankton communities. Limnol. Oceanogr. 56, 683–694. doi: 10.4319/lo.2011.56.2.0683
Bode, A. (2019). Monthly Series of Phytoplankton and Zooplankton Abundance as Well as Biomass Collected Between 1989 and 2016 at A Coruña (NW Spain). PANGEA. Available online at: https://doi.pangaea.de/10.1594/PANGAEA.908815
Bode, A., Álvarez, M., García-García, L. M., Louro, M. A., Nieto-Cid, M., Ruíz-Villarreal, M., et al. (2020). Climate and local hydrography underlie recent regime shifts in plankton communities off Galicia (NW Spain). Oceans 1, 181–197. doi: 10.3390/oceans1040014
Bode, A., Álvarez, M., Ruíz-Villarreal, M., and Varela, M. (2018). Time Series of Hydrographic, Chemical and Primary Production Variables for a Shelf Station off A Coruña (NW Spain): 1989–2016. PANGEA. Available online at: https://doi.pangaea.de/10.1594/PANGAEA.885413
Bode, A., Álvarez, M., Ruíz-Villarreal, M., and Varela, M. (2019). Changes in phytoplankton production and upwelling intensity off A Coruña (NW Spain) for the last 28 years. Ocean Dynam. 69, 861–873. doi: 10.1007/s10236-019-01278-y
Bode, A., Álvarez-Ossorio, M. T., Barquero, S., Lorenzo, J., Louro, A., and Varela, M. (2003). Seasonal variations in upwelling and in the grazing impact of copepods on phytoplankton off A Coruña (Galicia, NW Spain). J. Exp. Mar. Biol. Ecol. 297, 85–105. doi: 10.1016/S0022-0981(03)00370-8
Bode, A., Álvarez-Ossorio, M. T., Cabanas, J. M., Miranda, A., and Varela, M. (2009). Recent trends in plankton and upwelling intensity off Galicia (NW Spain). Prog. Oceanogr. 83, 342–350. doi: 10.1016/j.pocean.2009.07.025
Bode, A., Álvarez-Ossorio, M. T., Miranda, A., López-Urrutia, A., and Valdés, L. (2012). Comparing copepod time-series in the north of Spain: spatial autocorrelation of community composition. Prog. Oceanogr. 97/100, 108–119. doi: 10.1016/j.pocean.2011.11.013
Bode, A., Estévez, M. G., Varela, M., and Vilar, J. A. (2015). Annual trend patterns of phytoplankton species abundance belie homogeneous taxonomical group responses to climate in the NE Atlantic upwelling. Mar. Env. Res. 110, 81–91. doi: 10.1016/j.marenvres.2015.07.017
Breton, E., Christaki, U., Bonato, S., Didry, M., and Artigas, L. F. (2017). Functional trait variation and nitrogen use efficiency in temperate coastal phytoplankton. Mar. Ecol. Prog. Ser. 563, 35–49. doi: 10.3354/meps11974
Cadotte, M. W. (2017). Functional traits explain ecosystem function through opposing mechanisms. Ecol. Lett. 20, 989–996. doi: 10.1111/ele.12796
Cardinale, B. J., Duffy, J. E., Gonzalez, A., Hooper, D. U., Perrings, C., and Venail, P. (2012). Biodiversity loss and its impacts on humanity. Nature 486, 59–67. doi: 10.1038/nature11148
Cardinale, B. J., Gross, K., Fritschie, K., Flombaum, P., Fox, J. W., Rixen, C., et al. (2013). Biodiversity simultaneously enhances the production and stability of community biomass, but the effects are independent. Ecology 94, 1697–1707. doi: 10.1890/12-1334.1
Casas, B., Varela, M., Canle, M., González, N., and Bode, A. (1997). Seasonal variations of nutrients, seston and phytoplankton, and upwelling intensity off La Coruña (NW Spain). Estuar. Coast. Shelf Sci. 44, 767–778. doi: 10.1006/ecss.1996.0155
Cermeño, P., Chouciño, P., Fernández-Castro, B., Figueiras, F. G., Marañón, E., Marrasé, C., et al. (2016). Marine primary productivity is driven by a selection effect. Front. Mar. Sci. 3:173. doi: 10.3389/fmars.2016.00173
Cermeño, P., Rodríguez-Ramos, T., Dornelas, M., Figueiras, F. G., Marañón, E., Teixeira, I. G., et al. (2013). Species richness in marine phytoplankton communities is not correlated to ecosystem productivity. Mar. Ecol. Prog. Ser. 488, 1–9. doi: 10.3354/meps10443
Cermeño, P., Teixeira, I. G., Branco, M., Figueiras, F. G., and Marañón, E. (2014). Sampling the limits of species richness in marine phytoplankton communities. J. Plank. Res. 36, 1135–1139. doi: 10.1093/plankt/fbu033
Chassot, E., Bonhommeau, S., Dulvy, N. K., Mélin, F., Watson, R., Gascuel, D., et al. (2010). Global marine primary production constrains fisheries catches. Ecol. Lett. 13, 495–505. doi: 10.1111/j.1461-0248.2010.01443.x
Chavez, F. P., Messié, M., and Pennington, J. T. (2011). Marine primary production in relation to climate variability and change. Annu. Rev. Mar. Sci. 3, 227–260. doi: 10.1146/annurev.marine.010908.163917
Craven, D., Eisenhauer, N., Pearse, W. D., Hautier, Y., Roscher, C., Boenisch, A. H., et al. (2018). Multiple facets of biodiversity drive the diversity-stability relationship. Nat. Ecol. Evol. 2, 1579–1587. doi: 10.1038/s41559-018-0647-7
Cusson, M., Crowe, T. P., Araújo, R., Arenas, F., Aspden, R., Bulleri, F., et al. (2015). Relationships between biodiversity and the stability of marine ecosystems: comparisons at a European scale using meta-analysis. J. Sea Res. 98, 5–14. doi: 10.1016/j.seares.2014.08.004
De Vargas, C., Audic, S., Henry, N., Decelle, J., Mahé, F., Logares, R., et al. (2015). Eukaryotic plankton diversity in the sunlit ocean. Science 348:1261605. doi: 10.1126/science.1261605
Duffy, J. E., Cardinale, B. J., France, K. E., McIntyre, P. B., Thébault, E., and Loreau, M. (2007). The functional role of biodiversity in ecosystems: incorporating trophic complexity. Ecol. Lett. 10, 522–538. doi: 10.1111/j.1461-0248.2007.01037.x
Duffy, J. E., Godwin, C. M., and Cardinale, B. J. (2017). Biodiversity effects in the wild are common and as strong as key drivers of productivity. Nature 549, 261–264. doi: 10.1038/nature23886
Edwards, K. F., Thomas, M. K., Klausmeier, C. A., and Litchman, E. (2012). Allometric scaling and taxonomic variation in nutrient utilization traits and maximum growth rate of phytoplankton. Limnol. Oceanogr. 57, 554–566. doi: 10.4319/lo.2012.57.2.0554
Fileman, E., and Burkill, P. (2001). The herbivorous impact of microzooplankton during two short-term Lagrangian experiments off the NW coast of Galicia in summer 1998. Prog. Oceanog. 51, 361–383. doi: 10.1016/S0079-6611(01)00075-1
Filstrup, C. T., Hillebrand, H., Heathcote, A. J., Harpole, W. S., and Downing, J. A. (2014). Cyanobacteria dominance influences resource use efficiency and community turnover in phytoplankton and zooplankton communities. Ecol. Lett. 17, 464–474. doi: 10.1111/ele.12246
Filstrup, C. T., King, K. B. S., and McCullough, I. M. (2019). Evenness effects mask richness effects on ecosystem functioning at macro-scales in lakes. Ecol. Lett. 22, 2120–2129. doi: 10.1111/ele.13407
García, F. C., Bestion, E., Warfield, R., and Yvon-Durocher, G. (2018). Changes in temperature alter the relationship between biodiversity and ecosystem functioning. Proc. Natl. Acad. Sci. U.S.A. 115, 10989–10994. doi: 10.1073/pnas.1805518115
García-Palacios, P., Gross, N., Gaitán, J., and Maestre, F. T. (2018). Climate mediates the biodiversity-ecosystem stability relationship globally. Proc. Natl. Acad. Sci. U.S.A. 115, 8400–8405. doi: 10.1073/pnas.1800425115
Godbold, J. A. (2012). “Effects of biodiversity-environment conditions on the interpretation of biodiversity-function relations,” in Marine Biodiversity and Ecosystem Functioning: Frameworks, Methodologies, and Integration, eds. M. Solan, R. J. Aspden, and D. M. Paterson (Oxford: Oxford University Press), 101–114.
Goebel, N. L., Edwards, C. A., Zehr, J. P., Follows, M. J., and Morgan, S. G. (2013). Modeled phytoplankton diversity and productivity in the California Current System. Ecol. Model. 264, 37–47. doi: 10.1016/j.ecolmodel.2012.11.008
González-Nuevo, G., Gago, J., and Cabanas, J. M. (2014). Upwelling index: a powerful tool for marine research in the NW Iberian upwelling system. J. Operat. Oceanogr. 7, 45–55. doi: 10.1080/1755876X.2014.11020152
Grasshoff, K., Erhardt, M., and Kremling, K. (1983). Methods of Seawater Analysis, 2nd Edn. Weinheim: Verlag Chemie.
Grömping, U. (2006). Relative importance for linear regression in R: The package relaimpo. J. Stat. Soft. 17:1. doi: 10.18637/jss.v017.i01
Hillebrand, H., Bennett, D. M., and Cadotte, M. W. (2008). Consequences of dominance: a review of evenness effects on local and regional ecosystem processes. Ecology 89, 1510–1520. doi: 10.1890/07-1053.1
Hillebrand, H., Langenheder, S., Lebret, K., Lindström, E., Östman, Ö., and Striebel, M. (2018). Decomposing multiple dimensions of stability in global change experiments. Ecol. Lett. 21, 21–30. doi: 10.1111/ele.12867
Hodapp, D., Hillebrand, H., Blasius, B., and Ryabov, A. B. (2016). Environmental and trait variability constrain community structure and the biodiversity-productivity relationship. Ecology 97, 1463–1474. doi: 10.1890/15-0730.1
Hodapp, D., Hillebrand, H., and Striebel, M. (2019). “Unifying” the concept of resource use efficiency in ecology. Front. Ecol. Evol. 6:233. doi: 10.3389/fevo.2018.00233
Hodapp, D., Meier, S., Muijsers, F., Badewien, T. H., and Hillebrand, H. (2015). Structural equation modeling approach to the diversity–productivity relationship of Wadden Sea phytoplankton. Mar. Ecol. Prog. Ser. 523, 31–40. doi: 10.3354/meps11153
Huete-Ortega, M., Marañón, E., Varela, M., and Bode, A. (2010). General patterns in the size scaling of phytoplankton abundance in coastal waters during a 10-year time series. J. Plank. Res. 32, 1–14. doi: 10.1093/plankt/fbp104
Irwin, A. J., and Finkel, Z. V. (2018). “Phytoplankton functional types: a trait perspective,” in Microbial Ecology of the Oceans, eds J. M. Gasol and D. L. Kirchman (Hoboken, NJ: John Wiley & Sons), 435–465.
Ives, A. R., and Carpenter, S. R. (2007). Stability and diversity of ecosystems. Science 317, 58–62. doi: 10.1126/science.1133258
Klais, R., Norros, V., Lehtinen, S., Tamminen, T., and Olli, K. (2017). Community assembly and drivers of phytoplankton functional structure. Funct. Ecol. 31, 760–767. doi: 10.1111/1365-2435.12784
Korhonen, J. J., Wang, J., and Soininen, J. (2011). Productivity-diversity relationship in lake plankton communities. PLoS ONE 6:e22041. doi: 10.1371/journal.pone.0022041
Laliberté, E., and Legendre, P. (2010). A distance-based framework for measuring functional diversity from multiple traits. Ecology 91, 299–305. doi: 10.1890/08-2244.1
Lehtinen, S., Tamminen, T., Ptacnik, R., and Andersen, T. (2017). Phytoplankton species richness, evenness, and production in relation to nutrient availability and imbalance. Limnol. Oceanogr. 62, 1393–1408. doi: 10.1002/lno.10506
Leruste, A., Villéger, S., Malet, N., De Wit, R., and Bec, B. (2018). Complementarity of the multidimensional functional and the taxonomic approaches to study phytoplankton communities in three Mediterranean coastal lagoons of different trophic status. Hydrobiologia 815, 207–227. doi: 10.1007/s10750-018-3565-4
Litchman, E., and Klausmeier, C. A. (2008). Trait-based community ecology of phytoplankton. Annu. Rev. Ecol. Evol. Syst. 39, 615–639. doi: 10.1146/annurev.ecolsys.39.110707.173549
Loreau, M., and de Mazancourt, C. (2013). Biodiversity and ecosystem stability: a synthesis of underlying mechanisms. Ecol. Lett. 16, 106–115. doi: 10.1111/ele.12073
Loreau, M., and Hector, A. (2001). Partitioning selection and complementarity in biodiversity experiments. Nature 412, 72–76. doi: 10.1038/35083573
Lund, J. W. G., Kipling, C., and Le Cren, E. D. (1958). The inverted microscope method of estimating algal numbers and the statistical basis of estimations by counting. Hydrobiologia 11, 143–170. doi: 10.1007/BF00007865
Malej, A., and Harris, R. P. (1993). Inhibition of copepod grazing by diatom exudates: a factor in the development of mucus aggregates? Mar. Ecol. Prog. Ser. 96, 33–42. doi: 10.3354/meps096033
Marañón, E. (2015). Cell size as a key determinant of phytoplankton metabolism and community structure. Annu. Rev. Mar. Sci. 7, 241–264. doi: 10.1146/annurev-marine-010814-015955
Morán, X. A., López-Urrutia, Á., Calvo-Díaz, A., and Li, W. K. W. (2010). Increasing importance of small phytoplankton in a warmer ocean. Glob. Chan. Biol. 16, 1137–1144. doi: 10.1111/j.1365-2486.2009.01960.x
Mouchet, M. A., Villéger, S., Mason, N. W. H., and Mouillot, D. (2010). Functional diversity measures: an overview of their redundancy and their ability to discriminate community assembly rules. Funct. Ecol. 24, 867–876. doi: 10.1111/j.1365-2435.2010.01695.x
Naeem, S. (2012). “Ecological consequences of declining biodiversity: a biodiversity-ecosystem function (BEF) framework for marine systems,” in Marine Biodiversity and Ecosystem Functioning: Frameworks, Methodologies, and Integration, eds M. Solan, R. J. Aspden, and D. M. Paterson (Oxford: Oxford University Press), 34–51.
Napoleón, C., Fiant, L., Raimbault, V., Riou, P., and Claquin, P. (2014). Dynamics of phytoplankton diversity structure and primary productivity in the English channel. Mar. Ecol. Prog. Ser. 505, 49–64. doi: 10.3354/meps10772
Neveux, J., and Panouse, M. (1987). Spectrofluorimetric determination of chlorophylls and pheophytins. Arch. Hydrobiol. 109, 567–581.
O'Connor, M. I., and Byrnes, J. E. K. (2014). “Biodiversity and ecosystem function: Does pattern influence process?,” in Marine Community Ecology and Conservation, eds M. D. Bertness, J. F. Bruno, B. R. Silliman, and J. J. Stachowicz (Sunderland, MA: Sinauer Associates, Inc.), 107–130.
Olli, K., Ptacnik, R., Andersen, T., Trikk, O., Klais, R., Lehtinen, S., et al. (2014). Against the tide: recent diversity increase enhances resource use in a coastal ecosystem. Limnol. Oceanogr. 59, 267–274. doi: 10.4319/lo.2014.59.1.0267
Otero, J., Bode, A., Álvarez-Salgado, X. A., and Varela, M. (2018). Role of functional trait variability in the response of individual phytoplankton species to changing environmental conditions in a coastal upwelling zone. Mar. Ecol. Prog. Ser. 596, 33–47. doi: 10.3354/meps12542
Parsons, T. R., Maita, Y., and Lalli, C. M. (1984). A Manual of Chemical and Biological Methods for Seawater Analysis. Oxford: Pergamon Press.
Pielou, E. C. (1966). The measurement of diversity in different types of biological collections. J. Theor. Biol. 13, 131–144. doi: 10.1016/0022-5193(66)90013-0
Pinheiro, J. C., and Bates, D. M. (2000). Mixed-Effects Models in S and S-Plus. New York, NY: Springer.
Ptacnik, R., Solimini, A. G., Andersen, T., Tamminen, T., Brettum, P., Lepistö, L., et al. (2008). Diversity predicts stability and resource use efficiency in natural phytoplankton communities. Proc. Natl. Acad. Sci. U.S.A. 105, 5134–5138. doi: 10.1073/pnas.0708328105
R Core Team (2020). “R: A language and environment for statistical computing,” in R Foundation for Statistical Computing (Vienna). Available online at: http://R-project.org (accessed October 30, 2020).
Richardson, A. J., and Schoeman, D. S. (2004). Climate impact on plankton ecosystems in the Northeast Atlantic. Science 305, 1609–1612. doi: 10.1126/science.1100958
Sarker, S., Lemke, P., and Wiltshire, K. H. (2018). Does ecosystem variability explain phytoplankton diversity? Solving an ecological puzzle with long-term data sets. J. Sea Res. 135, 11–17. doi: 10.1016/j.seares.2018.02.002
Sarthou, G., Timmermans, K. R., Blain, S., and Tréguer, P. (2005). Growth physiology and fate of diatoms in the ocean: a review. J. Sea Res. 53, 25–42. doi: 10.1016/j.seares.2004.01.007
Schabhüttl, S., Hingsamer, P., Weigelhofer, G., Hein, T., Weigert, A., and Striebel, M. (2013). Temperature and species richness effects in phytoplankton communities. Oecologia 171, 527–536. doi: 10.1007/s00442-012-2419-4
Shurin, J. B., Arnott, S. E., Hillebrand, H., Longmuir, A., Pinel-Alloul, B., Winder, M., et al. (2007). Diversity-stability relationship varies with latitude in zooplankton. Ecol. Lett. 10, 127–134. doi: 10.1111/j.1461-0248.2006.01009.x
Stachowicz, J. J., Bruno, J. F., and Duffy, J. E. (2007). Understanding the effects of marine biodiversity on communities and ecosystems. Annu. Rev. Ecol. Evol. Syst. 38, 739–766. doi: 10.1146/annurev.ecolsys.38.091206.095659
Striebel, M., Behl, S., Diehl, S., and Stibor, H. (2009b). Spectral niche complementarity and carbon dynamics in pelagic ecosystems. Am. Nat. 174, 141–147. doi: 10.1086/599294
Striebel, M., Behl, S., and Stibor, H. (2009a). The coupling of biodiversity and productivity in phytoplankton communities: consequences for biomass stoichiometry. Ecology 90, 2025–2031. doi: 10.1890/08-1409.1
Striebel, M., Singer, G., Stibor, H., and Andersen, T. (2012). “Trophic overyielding”: Phytoplankton diversity promotes zooplankton productivity. Ecology 93, 2719–2727. doi: 10.1890/12-0003.1
Thibaut, L., and Connolly, S. R. (2013). Understanding diversity-stability relationships: towards a unified model of portfolio effects. Ecol. Lett. 16, 140–150. doi: 10.1111/ele.12019
Tilman, D., Isbell, F., and Cowles, J. M. (2014). Biodiversity and ecosystem functioning. Annu. Rev. Ecol. Evol. Syst. 45, 471–493. doi: 10.1146/annurev-ecolsys-120213-091917
UNESCO (1986). “Progress in oceanographic tables and standards 1983–1986, work and recommendations of the UNESCO/SCOR/ICES/IAPSO joint panel,” in UNESCO Technical Papers in Marine Science 50 (Paris: Mar Inf Cent, Div Mar Sci, UNESCO).
Vallina, S. M., Cermeño, P., Dutkiewicz, S., Loreau, M., and Montoya, J. M. (2017). Phytoplankton functional diversity increases ecosystem productivity and stability. Ecol. Model. 361, 184–196. doi: 10.1016/j.ecolmodel.2017.06.020
van der Plas, F. (2019). Biodiversity and ecosystem functioning in naturally assembled communities. Biol. Rev. 94, 1220–1245. doi: 10.1111/brv.12499
Villéger, S., Mason, N. W. H., and Mouillot, D. (2008). New multidimensional functional diversity indices for multifaceted framework in functional ecology. Ecology 89, 2290–2301. doi: 10.1890/07-1206.1
Wiltshire, K. H., Boersma, M., Carstens, K., Kraberg, A. C., Peters, S., and Scharfe, M. (2015). Control of phytoplankton in a shelf sea: determination of the main drivers based on the Helgoland Roads Time Series. J. Sea Res. 105, 42–52. doi: 10.1016/j.seares.2015.06.022
Keywords: coastal upwelling, stability, functional diversity, taxonomic diversity, zooplankton, phytoplankton, nutrients, resource use efficiency
Citation: Otero J, Álvarez-Salgado XA and Bode A (2020) Phytoplankton Diversity Effect on Ecosystem Functioning in a Coastal Upwelling System. Front. Mar. Sci. 7:592255. doi: 10.3389/fmars.2020.592255
Received: 06 August 2020; Accepted: 20 October 2020;
Published: 26 November 2020.
Edited by:
Xosé Anxelu G. Morán, King Abdullah University of Science and Technology, Saudi ArabiaReviewed by:
Francisca C. García, University of Exeter, United KingdomSavvas Genitsaris, International Hellenic University, Greece
Wang Tian, North China Electric Power University, China
Copyright © 2020 Otero, Álvarez-Salgado and Bode. This is an open-access article distributed under the terms of the Creative Commons Attribution License (CC BY). The use, distribution or reproduction in other forums is permitted, provided the original author(s) and the copyright owner(s) are credited and that the original publication in this journal is cited, in accordance with accepted academic practice. No use, distribution or reproduction is permitted which does not comply with these terms.
*Correspondence: Jaime Otero, jotero@iim.csic.es
†Present address: Jaime Otero, Centro Oceanográfico de Vigo, Instituto Español de Oceanografía, Vigo, Spain