 Dimitrios Kiagias
 Giulia Russo
 Giuseppe Sgroi
 Francesco Pappalardo
 Miguel A. Juárez
- 1School of Mathematics and Statistics, University of Sheffield, Sheffield, United Kingdom
- 2Department of Drug Sciences, University of Catania, Catania, Italy
- 3Department of Mathematics and Computer Science, University of Catania, Catania, Italy
We propose a Bayesian hierarchical method for combining in silico and in vivo data onto an augmented clinical trial with binary end points. The joint posterior distribution from the in silico experiment is treated as a prior, weighted by a measure of compatibility of the shared characteristics with the in vivo data. We also formalise the contribution and impact of in silico information in the augmented trial. We illustrate our approach to inference with in silico data from the UISS-TB simulator, a bespoke simulator of virtual patients with tuberculosis infection, and synthetic physical patients from a clinical trial.
1. Introduction
There will always be a push for innovative treatments for medical use—either drugs, devices, or therapies—in order to improve efficacy, cost-effectiveness, i.e., releasing new treatments suitable for public use requires stringent testing; hence, clinical trials must be closely regulated and scrutinised. Currently, this means the average duration of a clinical trial (Phase I–III) is 6–7 years, with a success rate of about 11% and mean cost of about USD 1.3 Billion (1–3). A promising avenue for improving on this issue is the use of formal models (mathematical and engineering) designed to simulate the effect of treatments in patients [see, e.g., (4, 5) and references therein]. A step further is using the information from in silico models to supplement clinical trials to decrease their size and duration, potentially speeding up the commercialisation of new interventions and reducing their cost to the public.
We concentrate on a novel therapeutic vaccination approach for treating tuberculosis (TB). Despite being treatable, TB was the cause of about 1.4M deaths in 2019 (6), the first cause of death by infectious pathogen. It is endemic in some South Asian countries, with a burden of about 40% (7). This is not a localised problem at all, and despite the low burden in the region, Europe has the highest number of new multi-drug resistant TB (MDR-TB) cases in the world1.
Despite continuous efforts, no new effective TB vaccines have been developed for almost a century, Andersen and Scriba (8); however, therapeutic vaccination is a promising treatment alternative (9–11). Within the STriTuVaD project2, we are developing methodology to generate in silico patients treated with RUTI as a coadjuvant in standard TB treatment (12), to supplement the data from a Phase II clinical trial. In this study, we propose a hierarchical Bayesian method, enabling the incorporation of the information from computer simulations onto an augmented in silico Phase II clinical trial investigating the efficacy of this therapeutic vaccination strategy.
2. Materials and Methods
One key complication in the development of new treatments for TB, with serious implications due to its impact on MDR-TB patients, is the rate of non-compliance (7, 13). From a clinical trial standpoint, the issue calls for increased recruitment in order to account for dropout rates, further increasing their cost. The use of in silico technologies has huge potential benefits, both clinical and financial, in these kinds of scenarios.
In section 2.1, we introduce the bespoke simulator of therapeutic RUTI vaccination of patients with TB in a Phase II clinical trial with a binary endpoint; section 2.2 describes the models used for the in silico and in vivo data sources, and section 2.3 details a model combining both sources of information to evaluate the end point of the clinical trial.
2.1. UISS-TB
The Universal Immune System Simulator (UISS) is a multi-scale, multi-organ, three-dimensional agent-based model (ABM) of the immune system, capable of simulating the dynamics of specific biological pathways at the molecular level. UISS has been successfully applied to numerous biological scenarios (14–17), with the majority of them including the simulation of vaccination evolution. A recent extension of the capabilities of UISS, the so-called UISS-TB, deals with the immune system at larger scales, enabling simulation of larger organs, such as the lungs, key in effective modelling the behaviour of TB.
Universal Immune System Simulator for Tuberculosis is a unique, bespoke ABM for the evolution of TB in the lung after RUTI vaccination (12, 18, 19), which can be considered as a computational model for RUTI vaccination. As such, under ASME V&V 40-2018 it is necessary to define its Context of Use under the Question of Interest [see, e.g., (20, 21), and references therein]. Based on the taxonomy proposed in Viceconti et al. (22), this process is carefully carried out in Curreli et al. (23) for using UISS-TB in augmented clinical trials. This ABM produces in silico data from a number of biological entities and chemical species (e.g., cytokines) for an individual virtual patient, identified and characterised through an initial vector of 22 features. In order to create cohorts of virtual patients, we use the novel approach from Juárez et al. (24), tailored for UISS-TB. In short, these features can be sampled, either at once or sequentially, and based on the joint distribution of the population characteristics, each virtual patient is then simulated using UISS-TB and the endpoint of the clinical trial recorded.
2.2. Modelling in silico and in vivo Data
Our main focus is to entertain models for the endpoint of the clinical trial with the aim of making them amenable to sharing information with the in silico data produced from the UISS-TB computer experiment. We propose a two layer approach: a layer dealing with the individual sources of information, either in silico or in vivo data, and a second combining the information in an augmented clinical trial.
For the former, we consider standard Bayesian (hierarchical) generalised linear models (hGLM), whereas for the latter we entertain a power prior approach based on the in silico model and a similarity measure, controlling the flow of information from the in silico experiment onto the augmented trial. We implement these Bayesian models using a benchmark prior, but our methodology can accommodate alternative prior specifications.
2.2.1. Individual Sources of Information
For an individual source of information, either from in silico or in vivo data, we use a logistic hGLM. Given the stochastic nature of ABMs, our model (Equation 2) includes an additional source of uncertainty for the in silico data to capture the stochasticity from UISS-TB simulations.
Formally, for each group j = R, C —treatment (RUTI) and control—, each patient i = 1, …, m is identified by their corresponding vector of features, xi = xi1, …, xip, p = 22. We denote the m × p matrix of features by X = [x1, …, xm], and for each patient, we define
with the individual probability of a negative sputum smear count. To control for individual characteristics, we assume
where β the vector of coefficients adjusting for individual features, μj is related to the baseline rate of conversion, and is the random effect accounting for the variability arising from simulating a specific profile i on UISS-TB, with and elicited from repeated measurements of the corresponding profile. This formulation is readily simplified if the underlying simulator is mechanistic instead, by letting .
We can then enable evaluation of the endpoint using both arms, by realising that log-odds ratio,
is the expected log-difference in performance, adjusted for individual characteristics. Thus,
is the endpoint of the trial, our quantity of interest.
2.2.2. Prior Setup
For benchmarking, we propose a conventional Gaussian-Gamma prior,
with the parameters fixed to reflect relative little prior information and use π*η ∝ 1.
2.3. Combining Information From in silico and in vivo Data
In order to enhance the precision in evaluation of the endpoint and reduce the number of real patients needed, we want to combine the information from fitting (Equation 2) to the in silico UISS-TB data with the in vivo data. From our Bayesian approach, it is natural that the posterior distribution from the in silico data to function as the prior for the in vivo data model, with an additional parameter, the so-called power prior, for controlling the amount of information from the in silico data going into the combined model as in Haddad et al. (25). The power parameter is set based on a measure of compatibility between the in silico to the in vivo data, by using a weight function to account for dissimilarities in the distributions, and thus controlling the impact the virtual cohort has on the combined model.
It is worth noting here that, in practise, there will be a subset of features common to both in silico and in vivo experiments, susceptible of information sharing, whereas a number of features will be unique to each experiment. Formally, let βs be the vector of coefficients associated with the in silico data model and βv to the physical data model. Then, βc = βs ∩ βv represents the common parameters to both experiments, and βv−c the parameters from the in vivo model only, so that βv = {βv−c, βc}. The likelihood from the in silico model can be expressed as,
with Ds the in silico data. Hence, the posterior distribution of βs is
Using similar notation, we denote L(βv ; Dv) the likelihood from the physical clinical trial, with Dv the in vivo data, with
the posterior distribution of βv, where π(βc | Ds) is the joint marginal posterior of the common feature coefficients from the in silico data and
with βs−c the set of parameters from the in silico model only.
Summarising, our model in Equation (7) takes into account the information coming only for the in vivo model, i.e., L(βv ; Dv), and draws all prior information for the common parameters to both experiments based on the joint marginal posterior distribution from in silico in Equation (8).
2.3.1. Measure of Similarity
As it stands, π(βv | Ds, Dv) takes the information coming from the in silico model at face value, i.e., the same weight is assigned to the information from the computer experiment and the clinical trial. In order to have a mechanism to control the amount of information shared, we consider a power prior approach (26–28), in which the prior distribution in Equation (8) is weighted based on a measure of compatibility α, with 0 < α < 1, and, therefore, the posterior distribution of βv in Equation (7) updates in,
We follow Haddad et al. (25) and express α = m/M, with M the size of the virtual patient cohort and 0 < m < M the effective size of the in silico trial. To provide a measure of agreement, let π(δs | Ds) and π(δv | Dv) be the posterior distribution of the endpoint from the virtual and the physical cohorts, using the conventional non-informative prior distribution. One would expect p = P(δv < ϕs) to be close to 0 or 1 if the virtual cohort provided dissimilar information to the physical; thus, p can be treated as a measure of agreement. We use a weight function, m = h(p) × mmax, based on p, in such a way that m → 0 if p → 0, 1 and m → mmax if p → 1/2, with mmax the maximum number of virtual patients allowed in the combined trial. Formally, we consider the symmetric weight function around 1/2,
where the parameters λ and κ control the scale and shape of the function, respectively, and hence the stringency of the penalty as p deviates from 1/2. In short, larger values of λ and/or κ provide a faster decrease from the peak of the function, therefore decreasing the effective size m; this behaviour is illustrated in Figure 1 for different combinations of {λ, κ}.
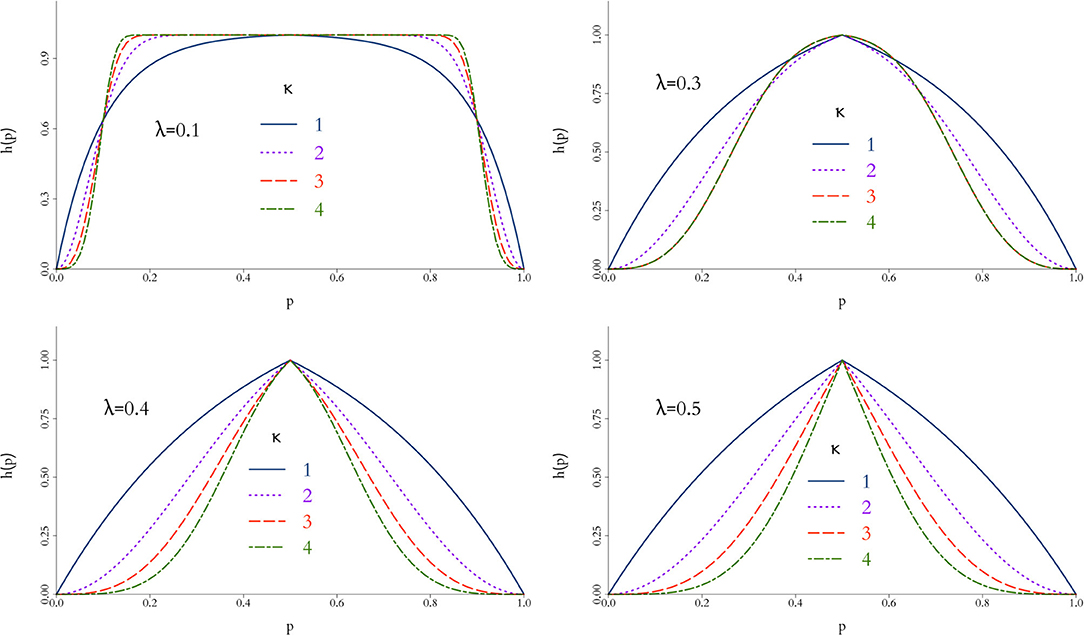
Figure 1. Behaviour of weight function h(p) in Equation 10 for different values of λ and κ. The closer h(p) to 1, the more compatible the simulations are to the physical data and a larger virtual cohort is used in the combined trial. In general, h(p) is rather insensitive for small values of λ and more discriminatory as κ increases.
3. Results
To illustrate our methodology, we simulate a two arm Phase IIb trail to test the efficacy of RUTI in drug-sensitive patients with TB. Both groups start with standard MDR-TB treatment from day 0; additionally, the intervention group is injected with 25 μg RUTI after at day 7. Efficacy is measured as percentage of patients with sputum culture negative at day 15. There are 150 patients in the in vivo cohort, split equally at random to each arm. We generated 150 profiles as in Juárez et al. (24), 75 per arm, and ran 100 UISS-TB simulations per virtual patient. Table 1 displays summary statistics from each group.
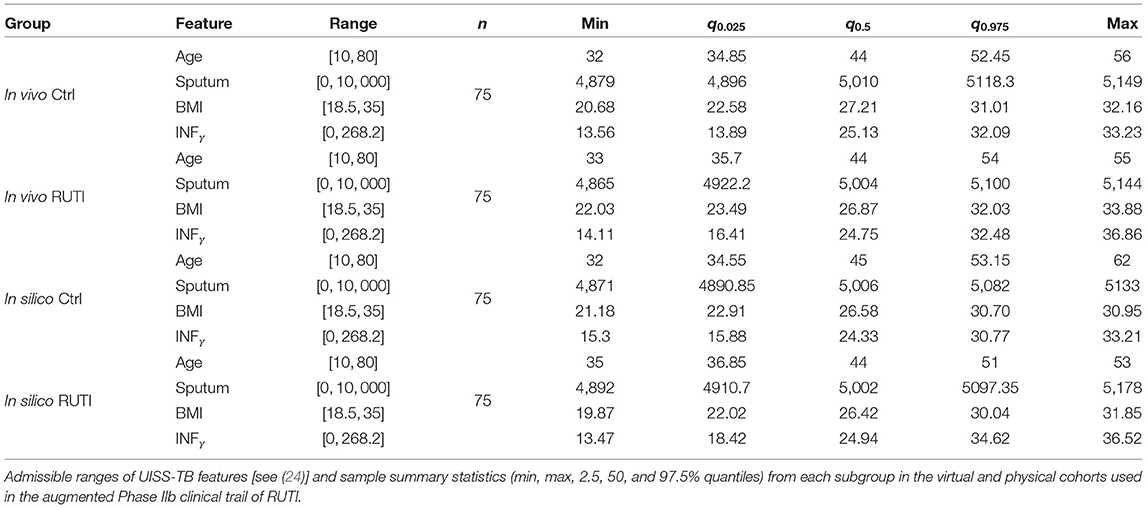
Table 1. Key patient features.
In Figure 2, we plot the time series of sputum culture for arbitrary chosen profiles from a single run of the UISS-TB simulations, also selected at random. Patients in both RUTI and Control groups appear to have high values of sputum culture at the beginning of the trial —days 0 to 7— and seem to show different behaviour at the later stages of the trial, with small bumps at isolated days, specifically the control group in the in vivo cohort. The majority of patients seem to return to a state of negative sputum culture after day 14 on average.
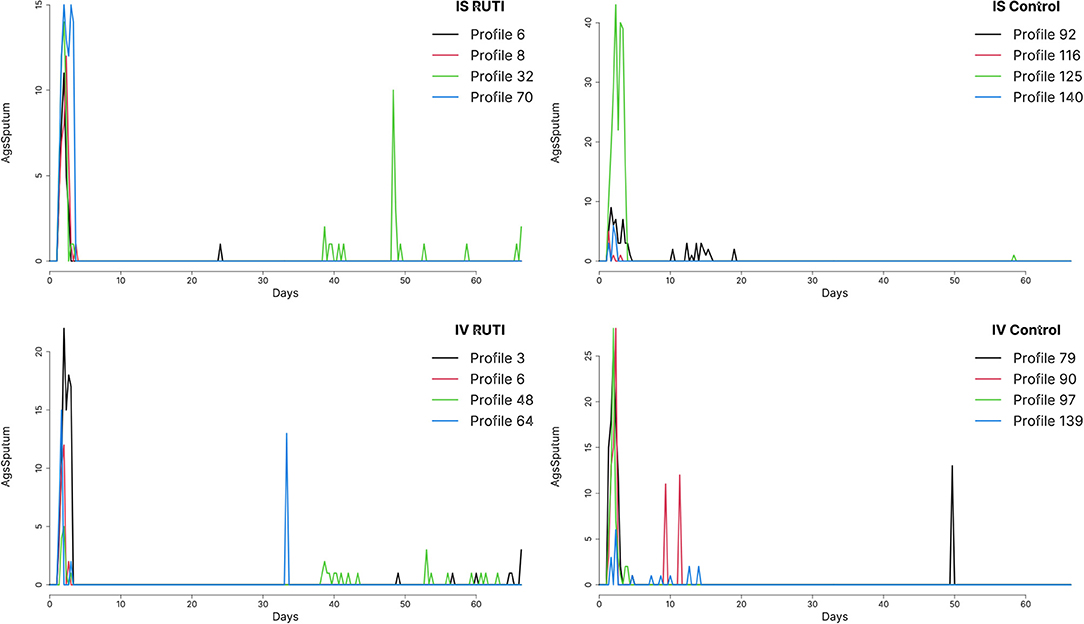
Figure 2. Sputum levels in time from profiles chosen at random from both RUTI and Control groups in the in vivo (IV) and in silico (IS) cohorts, using run 49 out of a 100 available.
In order to obtain a reasonable estimate for each unique profile, we average the sputum culture over the 100 UISS-TB simulations and set a common threshold of 0.05 to obtain in Equation (1) for each patient i = 1, …, 75 and each group j = R, C, where 1 indicates a patient with sputum culture negative and 0 otherwise. The reason for doing so is the variability coming from replicates of a specific profile using UISS-TB, summarised into the random effect term in our model in Equation (2) and analysed in section 3.1.
3.1. Random Effect in the in silico Cohort
In order to measure the simulation uncertainty in the UISS-TB output, i.e., the variability of the output from a patient with the same profile, we first fit (Equation 2) without to both groups using all 75 patients with unique profiles and their 100 runs as individual patients. We then compare the resulting posterior distribution of the odds with the one from using a flat prior for the precision of the random effect.
As illustrated in Figure 3, when the replicates of each profile are treated as individual patients, the posterior distribution of the odds is slightly different compared to the case where we take into account the fact that we do know replicates exist. Overall, the interpretation of the fitting is fundamentally the same; in both RUTI and Control groups, the odds are similar (rightmost panels). However, in the former case there is a clear source of variability missing, even if it is small, evidenced by the posterior distribution of the precision of random effect, , on the leftmost panel. Hence, we use the model with a random effect for the in silico data, eliciting a Gamma prior distribution for τui, depicted in Figure 4.
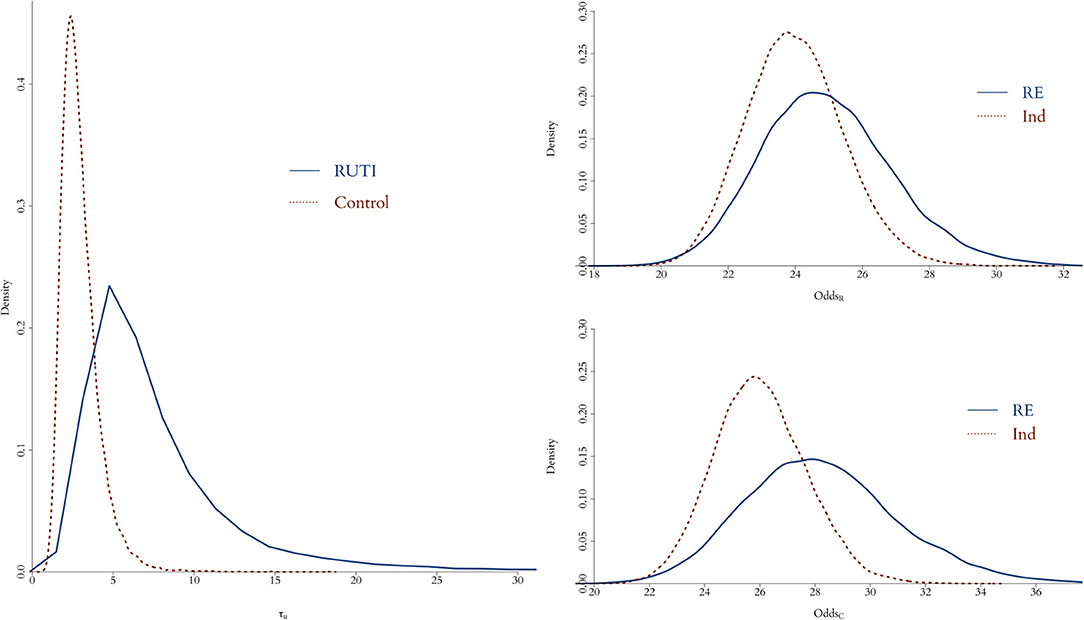
Figure 3. Posterior distribution of odds for both RUTI (top left) and Control (bottom left) groups, when either using profiles with identical initial vector of features as individual patients (red dotted) or taking each profile with its corresponding 100 simulations as a replicate of a specific patient (solid blue). On the left panel, the posterior distributions of the random effect precision from each group is displayed.
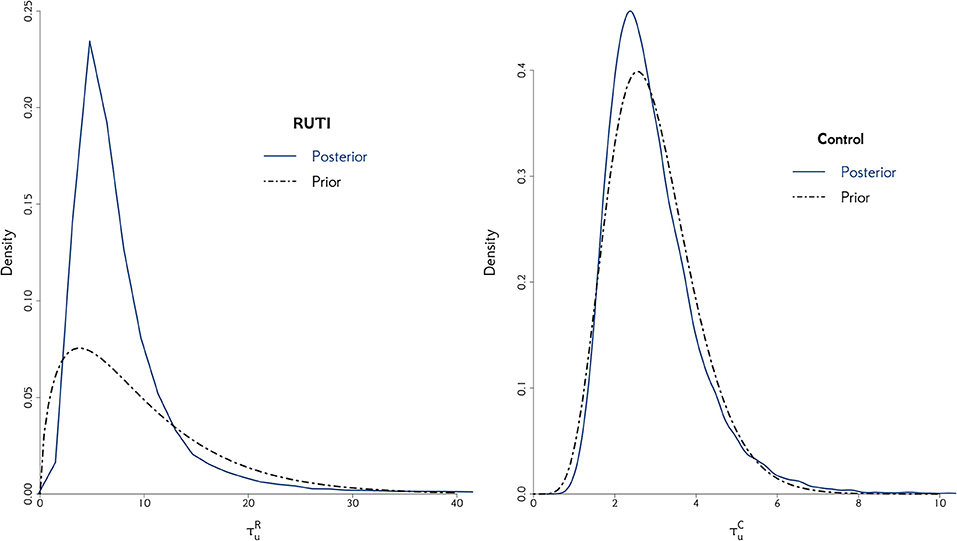
Figure 4. The posterior distribution of the random effect precision is displayed for both RUTI and Control groups, along with their corresponding best gamma distribution fit. In both cases, we elicit the prior distribution for τui from the combined models.
3.2. Determining the Contribution of the in silico Experiment
In order to control the supplemental amount of information from the in silico data into the augmented trial, we perform preliminary runs adding one in silico patient at a time and analyse the behaviour of the weight, α. Ideally, we seek for the point where α is higher, while controlling the discrepancy measured by Equation (10) for different combinations of λ and κ. The behaviour of this penalty function is illustrated in Figure 1, and the resulting weight from adding single in silico patients sequentially to the RUTI and Control cohorts presented in Figures 5, 6, respectively.
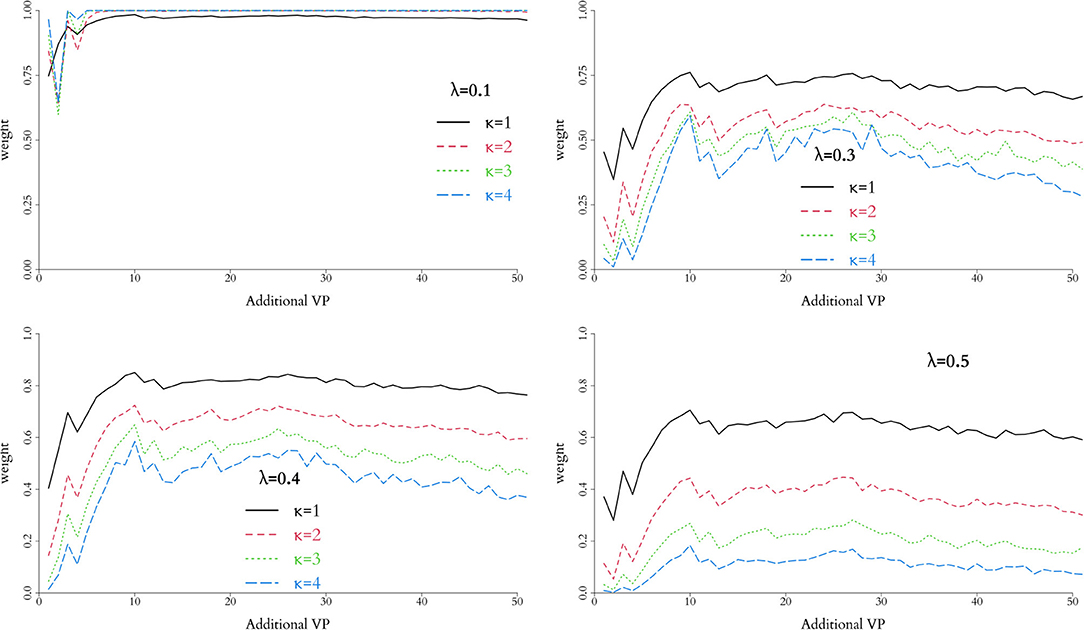
Figure 5. Weight associated with each combination of parameters in the weight function, h(p), for the RUTI group. Relative low values of λ do not provide clear separation, regardless of the potential number of additional virtual patients. For the data observed, λ = 0.4 and κ = 1 provide appropriate separation and suggest adding 12–30 virtual patients to the combined trial.
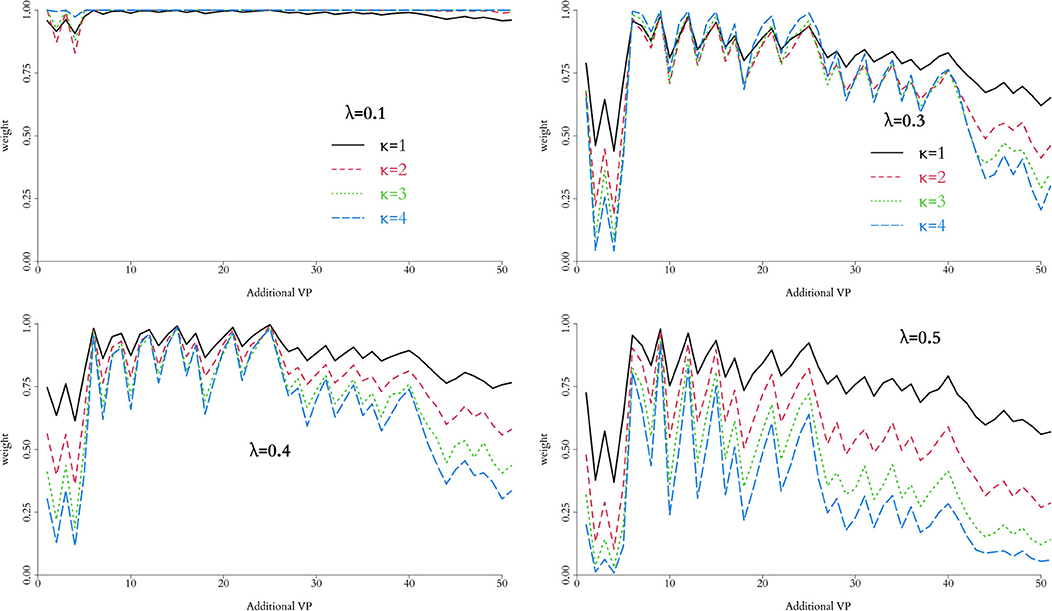
Figure 6. Weight associated with each combination of parameters in the weight function, h(p), for the Control group. Relative low values of λ do not provide clear separation, regardless of the potential number of additional virtual patients. For the data observed, λ = 0.4 and κ = 1 provide a reasonable separation and suggest adding 18-25 virtual patients to the combined trial.
As expected, low values of λ, regardless of κ, yield weights unable to discriminate the information contribution from the in silico experiment, particularly for small numbers of added patients. Larger values, in contrast, allow for better discrimination, which can be fine tuned by varying κ. In our implementation, we use λ = 0.4 and κ = 1 enabling identification of an optimal number of added virtual patients, i.e., a value of α that keeps the similarity of the in silico and in vivo cohorts at an acceptable level, allowing us to increase the sample size of the augmented clinical trial potentially improving the precision in estimation of the end point.
For the RUTI group, the optimal number of added patients appears to be between 12 and 30, whereas for the Control group between 18 and 25. Therefore, for our implementation we will use a batch of and in silico patients to combine with the nv = 75 in vivo patients in the augmented clinical trial. Table 2 summarised some of the key characteristics of the posterior distribution of the odds from both groups with batches of various sizes added. Results from the Control group change ever so slightly with the number of the added virtual patients. In the Control group, adding more than approximately 15 patients and up to 35 seems to keep a similar posterior mean and slightly smaller interquartile range (IQR), whereas, in the RUTI group, adding virtual patients results in a small downward shift on the posterior mean with similar ranges.
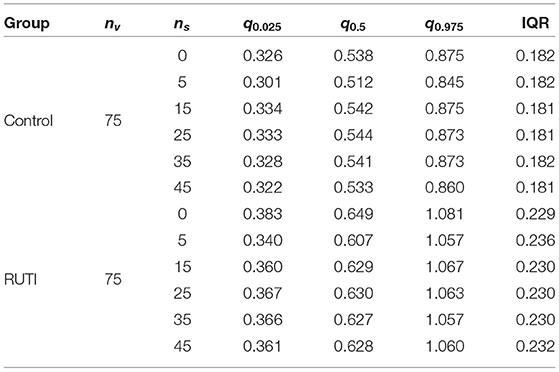
Table 2. Summary statistics (2.5, 50, and 97.5% quantiles) and interquartile range (IQR) of posterior distributions of the odds from each group after adding virtual patient batches of different sizes (ns) to the in vivo cohort (nv).
3.3. An Augmented Clinical Trial
Once the optimal number of added virtual patients for each group, and , is decided, our modelling approach enables the evaluation of the end point in an augmented clinical trial. The posterior distributions of the odds within each group from the in vivo and augmented trials are shown in Figure 7. As displayed on the top panel of the figure, 36% of the patients have negative sputum culture for the Control whereas 41% for the RUTI group. The posterior expected odds of recovery from each trial in the Control group remain quite similar, with a slightly wider equally tailed interval of probability 0.95 from the augmented trial. The addition of patients to the RUTI group does not seem to have a significant impact on inference, with both the posterior mean and 95% interval shifting slightly to the left; numerical summaries can be found in Table 3.
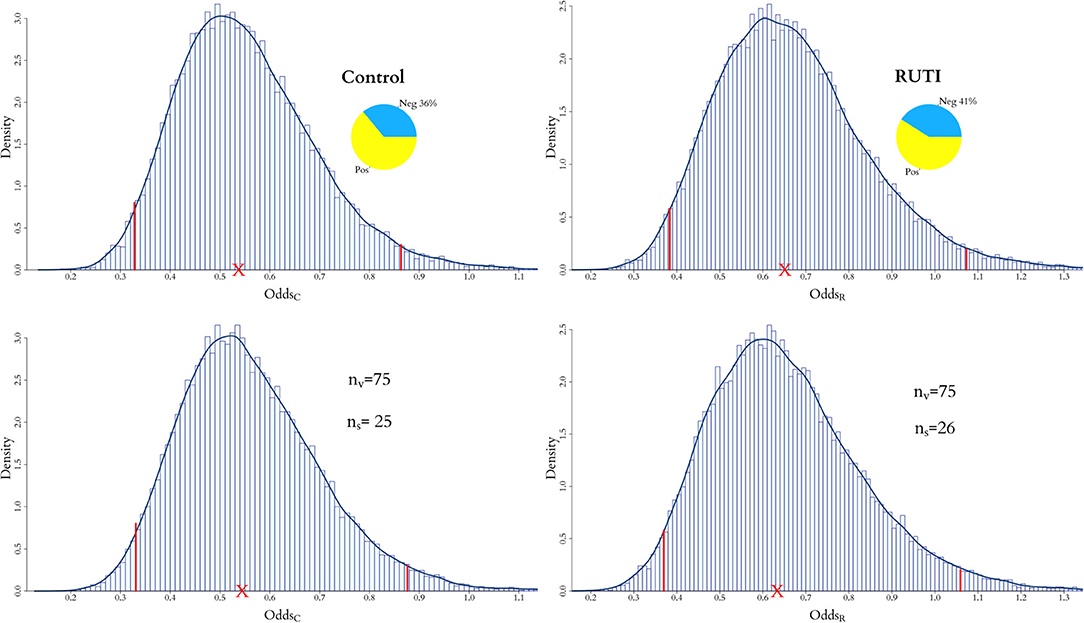
Figure 7. Posterior distribution of odds for both RUTI and Control groups, when only the in vivo cohort is fitted and when both the in vivo and in silico cohorts are combined for the full model. For the latter, the optimal number of virtual patients ns for each group is selected according to the weights in Figures 5, 6.
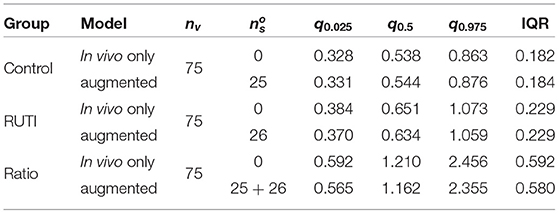
Table 3. Summary statistics (2.5, 50, and 97.5% quantiles) and IQR of the posterior odds of the Control and RUTI groups from the in vivo (nv) and augmented trials after adding the optimal size batch of virtual patients, .
The effect of augmentation to the end point is shown in Figure 8, where the posterior distributions of the odds ratio from the in vivo and augmented clinical trials are plot together. The red dotted line represents the in vivo only and the solid blue line the augmented trial, along with the posterior means (crosses) and equally tailed 0.95 posterior probability intervals. It is apparent that posterior point estimates are quite similar and would lead to the same clinical conclusion, but the width of the posterior interval of the augmented trial is shorter, providing increased precision.
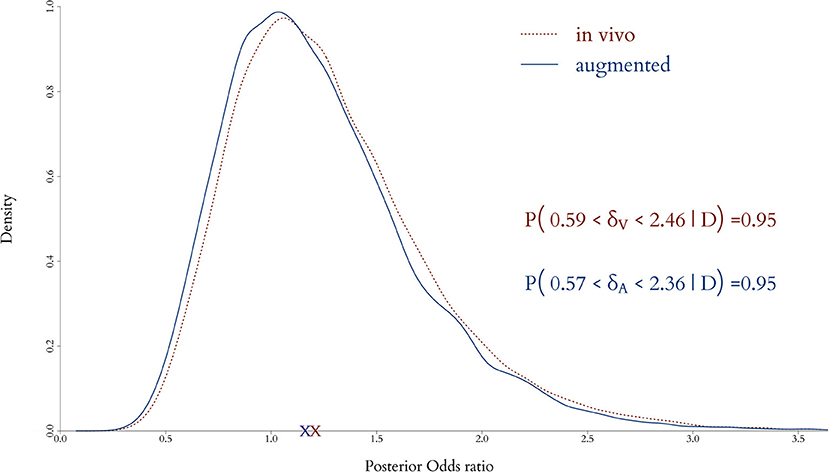
Figure 8. Posterior distributions of odds ratio when only the in vivo cohort is fitted and when both the in vivo and in silico cohorts are combined for the full model. Adding virtual patients does not alter significantly in the posterior expected odds but provides a decrease in the uncertainty in the estimation of the clinical end point.
Our models have been built in RStan (29), which enables straightforward implementation and modification of the prior. The code is available from our GitHub repository3 under request. On average, running our code takes a few minutes for 100s and slightly longer for 1,000s of patients, the individual models with the random effect—i.e., the in silico patients—being the slower. For instance, 750 in vivo patients with 500 in silico patients take a couple of minutes for both independent and combined models, whereas 3,750 in vivo with 2,500 in silico patients runs in about 25 min for the individual model with random effects and in around 10 min for the combined. We should point out that, despite not suffering from scaling issues, our models have been devised for clinical trials with limited number of in vivo patients, augmented with computer simulations to boost the performance with respect to the endpoint of the trial.
4. Discussion
The need for innovative solutions for improving public health is increasingly apparent. Speeding up the delivery of interventions to the market, without compromising safety and effectiveness, can be achieved by adding relevant information to the either clinical trial phase. Our methodology is designed to incorporate relevant information from in silico experiments onto clinical trials data to decrease their size and duration. There are indeed a number of approaches to simulate different aspects of TB, from purely synthetic approaches for designing new multi-epitope subunit vaccine (30) and molecular dynamics (31), to contagion dynamics (32). There are also models able to simulate pharmacokinetics in TB on a population level (33, 34), but none of these produce data relevant to the endpoint of the clinical trial considered in this study. UISS-TB is a bespoke ABM capable of simulating cohorts of TB in silico patients treated with RUTI (12, 24), which has been through ASME V&V 40-2018 (23); to the extent of our knowledge, currently there is no available alternative.
We illustrate our approach within an augmented Phase II clinical trial of a co-adjuvant vaccine for treating patients with TB. Both sources of information, in vivo and in silico, are combined using a novel statistical coherent Bayesian approach capable of propagating the uncertainty from both sources of information onto the posterior distribution of the clinical endpoint. The contribution of the in silico experiment is controlled by a measure of compatibility with the in vivo data and weighted accordingly into the combined trial. The models for the each source of information are tailored to the clinical endpoint, in our case study a GLM due to the binary endpoint, but alternatives can be readily used while adapting the prior structure accordingly.
We use a novel, bespoke simulator for the RUTI clinical trial, but the methodology for sharing information can be applied in a variety of scenarios. In principle, in silico data could be acquired from a number of sources (statistical, machine learning, and artificial intelligence) if relevant, adding the corresponding terms to Equation (2) to account for their different nature. In any case, appropriate choice of the penalty function is key, as it controls the quantity of information from the in silico experiments. This information balance must be considered carefully and may be indeed effected by a regulator by setting the maximum number of virtual patients, mmax. We adapt the approach on Haddad et al. (25) and heuristically set its parameters by inspecting their discrimination power. A potential avenue for future research would be to provide a formal approach for automatic selection, enabling an unsupervised method for deciding the optimal number of virtual patients. Our penalty function is bounded in (0, 1) facilitating weighing in silico information regardless of the underlying distributions or sample sizes. This penalty could also be based on alternative measures of discrepancy between the two endpoint distributions, e.g., Kullback-Leibler, Chernoff, Lm-norm (35), but would require scaling on case-by-case basis. Exploring alternative specifications for the penalty function and comparing relative performances are active part of our research plans.
By incorporating new virtual patients sequentially and re-evaluating their contribution to the augmented trial, the method enables sharing information efficiently without overwhelming the information from in vivo trial and thus improving the precision in the evaluation of the clinical endpoint without biassing the clinical decision. We hypothesise there are large gains to be obtained by using this kind of technology on well-explored diseases, where computer simulations are ripe for use and clinical trials common. For uncommon or rare diseases, this approach offers the possibility to improve on exploratory analyses where costs of recruitment and follow-up are large or even prohibitive.
Data Availability Statement
The original contributions presented in the study are included in the article/supplementary material, further inquiries can be directed to the corresponding author/s.
Author Contributions
DK and MJ developed the Bayesian methodology and carried out the analysis and drafted the manuscript. GR, GS, and FP developed the simulator. All authors participated in the generation of virtual patients, read, and approved the draft.
Funding
The authors acknowledge support from the STriTuVaD project, funded by the European Commission under the contract H2020-SC1-2017- CNECT-2, No. 777123.
Author Disclaimer
The information and views set out in this article are those of the authors and do not necessarily reflect the official opinion of the European Commission. Neither the European Commission institutions and bodies nor any person acting on their behalf may be held responsible for the use, which may be made of the information contained therein.
Conflict of Interest
The authors declare that the research was conducted in the absence of any commercial or financial relationships that could be construed as a potential conflict of interest.
Publisher's Note
All claims expressed in this article are solely those of the authors and do not necessarily represent those of their affiliated organizations, or those of the publisher, the editors and the reviewers. Any product that may be evaluated in this article, or claim that may be made by its manufacturer, is not guaranteed or endorsed by the publisher.
Footnotes
1. ^https://www.euro.who.int/en/health-topics/communicable-diseases/tuberculosis [accessed August 23, 2021].
2. ^In silico trials for tuberculosis vaccine development. Available at: https://www.strituvad.eu/ [accessed August 23, 2021].
References
1. Wouters OJ, McKee M, Luyten J. Estimated research and development investment needed to bring a new medicine to market, 2009-2018. J Am Med Assoc. (2020) 323:844–53. doi: 10.1001/jama.2020.1166
2. Martin L, Hutchens M, Hawkins C, Radnov A. How much do clinical trials cost? Nat Rev Drug Discov. (2017) 16:381–2. doi: 10.1038/nrd.2017.70
3. Martin L, Hutchens M, Hawkins C. Clinical trial cycle times continue to increase despite industry efforts. Nat Rev Drug Discov. (2017) 16:157. doi: 10.1038/nrd.2017.21
4. Carlier A, Vasilevich A, Marechal M, de Boer J, Geris L. In silico clinical trials for paediatric orphan diseases. Sci Rep. (2018) 8:2465. doi: 10.1038/s41598-018-20737-y
5. Pappalardo F, Russo G, Tshinanu FM, Viceconti M. In silico clinical trials: concepts and early adoptions. Brief Bioinform. (2019) 5:1699–708. doi: 10.1093/bib/bby043
6. WHO. Global Tuberculosis Report. World Health Organization (2020). Available online at: https://apps.who.int/iris/rest/bitstreams/1312164/retrieve
7. Basnyat B, Caws M, Udwadia Z. Tuberculosis in South Asia: a tide in the affairs of men. Multidiscip Respir Med. (2018) 13:10. doi: 10.4081/mrm.2018.116
8. Andersen P, Scriba TJ. Moving tuberculosis vaccines from theory to practice. Nat Rev Immunol. (2019) 19:550–62. doi: 10.1038/s41577-019-0174-z
9. Franco AR, Peri F. Developing new anti-tuberculosis vaccines: focus on adjuvants. Cells. (2021) 10:78. doi: 10.3390/cells10010078
10. Prabowo SA, Painter H, Zelmer A, Smith SG, Seifert K, Amat M, et al. RUTI vaccination enhances inhibition of mycobacterial growth ex vivo and induces a shift of monocyte phenotype in mice. Front Immunol. (2019) 10:894. doi: 10.3389/fimmu.2019.00894
11. Nell AS, D'lom E, Bouic P, Sabaté M, Bosser R, Picas J, et al. Safety, tolerability, and immunogenicity of the novel antituberculous vaccine RUTI: randomized, placebo-controlled phase ii clinical trial in patients with latent tuberculosis infection. PLoS ONE. (2014) 9:e89612. doi: 10.1371/journal.pone.0089612
12. Pennisi M, Russo G, Sgroi G, Bonaccorso A, Parasiliti Palumbo GA, Fichera E, et al. Predicting the artificial immunity induced by RUTI®vaccine against tuberculosis using universal immune system simulator (UISS). BMC Bioinformatics. (2019) 20:504. doi: 10.1186/s12859-019-3045-5
13. AlSahafi AJ, Shah HBU, AlSayali MM, Mandoura N, Assiri M, Almohammadi EL, et al. High non-compliance rate with anti-tuberculosis treatment: a need to shift facility-based directly observed therapy short course (DOTS) to community mobile outreach team supervision in Saudi Arabia. BMC Public Health. (2019) 19:1168. doi: 10.1186/s12889-019-7520-8
14. Pappalardo F, Forero IM, Pennisi M, Palazon A, Melero I, Motta S. SimB16: modeling induced immune system response against b16-melanoma. PLoS ONE. (2011) 10:e26523. doi: 10.1371/journal.pone.0026523
15. Pennisi M, Pappalardo F, Palladini A, Nicoletti G, Nanni P, Lollini PL, et al. Modeling the competition between lung metastases and the immune system using agents. BMC Bioinformatics. (2010) 11:S13. doi: 10.1186/1471-2105-11-S7-S13
16. Pennisi M, Russo G, Motta S, Pappalardo F. Agent based modeling of the effects of potential treatments over the blood-brain barrier in multiple sclerosis. J Immunol Methods. (2015) 427:6–12. doi: 10.1016/j.jim.2015.08.014
17. Pennisi M, Russo G, Ravalli S, Pappalardo F. Combining agent based-models and virtual screening techniques to predict the best citrus-derived vaccine adjuvants against human papilloma virus. BMC Bioinformatics. (2017) 18:544. doi: 10.1186/s12859-017-1961-9
18. Russo G, Sgroi G, Parasiliti Palumbo GA, Pennisi M, Juárez MA, Cardona PJ, et al. Moving forward through the in silico modeling of tuberculosis: a further step with UISS-TB. BMC Bioinformatics. (2020) 21:458. doi: 10.1186/s12859-020-03762-5
19. Russo G, Pappalardo F, Juárez MA, Pennisi M, Cardona PJ, Coler R, et al. Evaluation of the efficacy of RUTI and ID93/GLA-SE vaccines in tuberculosis treatment: in silico trial through UISS-TB simulator. In: 2019 IEEE International Conference on Bioinformatics and Biomedicine (BIBM). San Diego, CA: IEEE (2019). p. 2197–201.
20. Bideault G, Scaccia A, Zahel T, Landertinger RW, Daluwatte C. Verification and validation of computational models used in biopharmaceutical manufacturing: potential application of the ASME verification and validation 40 standard and FDA proposed AI/ML model life cycle management framework. J Pharm Sci. (2021) 110:1540–44. doi: 10.1016/j.xphs.2021.01.016
21. Morrison TM, Hariharan P, Funkhouser CM, Afshari P, Goodin M, Horner M. Assessing computational model credibility using a risk-based framework: application to hemolysis in centrifugal blood pumps. ASAIO J. (2019) 65:349–60. doi: 10.1097/MAT.0000000000000996
22. Viceconti M, Pappalardo F, Rodriguez B, Horner M, Bischoff J, Musuamba Tshinanu F. In silico trials: verification, validation and uncertainty quantification of predictive models used in the regulaory evaluation of biomedical products. Methods. (2021) 185:120–7. doi: 10.1016/j.ymeth.2020.01.011
23. Curreli C, Pappalardo F, Russo G, Pennisi M, Kiagias D, Juárez M, et al. Verification of an agent-based disease model of human Mycobacterium tuberculosis infection. Int J Numer Methods Biomed Eng. (2021) 37:e3470. doi: 10.1002/cnm.3470
24. Juárez MA, Pennisi M, Russo G, Kiagias D, Curreli C, Viceconti M, et al. Generation of digital patients for the simulation of tuberculosis with UISS-TB. BMC Bioinformatics. (2020) 21:449. doi: 10.1186/s12859-020-03776-z
25. Haddad T, Himes A, Thompson L, Irony T, Nair R. Incorporation of stochastic engineering models as prior information in Bayesian medical device trials. J Biopharm Stat. (2017) 27:1089–103. doi: 10.1080/10543406.2017.1300907
26. O'Hagan A. Fractional bayes factors for model comparison. J R Stat Soc Ser B. (1995) 57:99–138. doi: 10.1111/j.2517-6161.1995.tb02017.x
27. O'Hagan A. Properties of intrinsic and fractional Bayes factors. Test. (1997) 6:101–18. doi: 10.1007/BF02564428
28. Ibrahim JG, Chen MH. Power prior distributions for regression models. Stat Sci. (2000) 15:46–60. doi: 10.1214/ss/1009212673
30. Bibi S, Ullah I, Zhu B, Adnan M, Liaqat R, Kong WB, et al. In silico analysis of epitope-based vaccine candidate against tuberculosis using reverse vaccinology. Sci Rep. (2021) 11:1249. doi: 10.1038/s41598-020-80899-6
31. Cloete R, Kapp E, Joubert J, Christoffels A, Malan SF. Molecular modelling and simulation studies of the Mycobacterium tuberculosis multidrug efflux pump protein Rv1258c. PLoS One. (2018) 13:1–18. doi: 10.1371/journal.pone.0207605
32. Zwick ED, Pepperell CS, Alagoz O. Representing tuberculosis transmission with complex contagion: an agent-based simulation modeling approach. Med Decis Making. (2021) 41:641–52. doi: 10.1177/0272989X211007842
33. Fors J, Strydom N, Fox WS, Keizer RJ, Savic RM. Mathematical model and tool to explore shorter multi-drug therapy options for active pulmonary tuberculosis. PLoS Comput Biol. (2020) 16:e1008107. doi: 10.1371/journal.pcbi.1008107
34. Lalande L, Bourguignon L, Bihari S, Maire P, Neely M, Jelliffe R, et al. Population modeling and simulation study of the pharmacokinetics and antituberculosis pharmacodynamics of isoniazid in lungs. Antimicrob Agents Chemother. (2015) 59:5181–9. doi: 10.1128/AAC.00462-15
Keywords: Bayesian hierarchical model, clinical trials, information sharing, in silico experiments, power prior, tuberculosis, therapeutic vaccine
Citation: Kiagias D, Russo G, Sgroi G, Pappalardo F and Juárez MA (2021) Bayesian Augmented Clinical Trials in TB Therapeutic Vaccination. Front. Med. Technol. 3:719380. doi: 10.3389/fmedt.2021.719380
Received: 02 June 2021; Accepted: 15 September 2021;
Published: 22 October 2021.
Edited by:
Giancarlo Pennati, Politecnico di Milano, ItalyReviewed by:
Vasileios C. Pezoulas, University of Ioannina, GreeceDaniele E. Schiavazzi, University of Notre Dame, United States
Copyright © 2021 Kiagias, Russo, Sgroi, Pappalardo and Juárez. This is an open-access article distributed under the terms of the Creative Commons Attribution License (CC BY). The use, distribution or reproduction in other forums is permitted, provided the original author(s) and the copyright owner(s) are credited and that the original publication in this journal is cited, in accordance with accepted academic practice. No use, distribution or reproduction is permitted which does not comply with these terms.
*Correspondence: Miguel A. Juárez, bS5qdWFyZXpAc2hlZmZpZWxkLmFjLnVr