 Sriharsha Ramaraju1
 Yujiang Wang1,2,3Nishant Sinha1,3Andrew W. McEvoy2Anna Miserocchi2
 Jane de Tisi2
 John S. Duncan2Fergus Rugg-Gunn2
 Peter N. Taylor1,2,3*
- 1Interdisciplinary Computing and Complex BioSystems Group, CNNP Lab, School of Computing, Newcastle University, Newcastle upon Tyne, United Kingdom
- 2Department of Clinical and Experimental Epilepsy, UCL Queen Square Institute of Neurology, London, United Kingdom
- 3Faculty of Medical Science, Newcastle University, Newcastle upon Tyne, United Kingdom
Objective: To investigate whether MEG network connectivity was associated with epilepsy duration, to identify functional brain network hubs in patients with refractory focal epilepsy, and assess if their surgical removal was associated with post-operative seizure freedom.
Methods: We studied 31 patients with drug refractory focal epilepsy who underwent resting state magnetoencephalography (MEG), and structural magnetic resonance imaging (MRI) as part of pre-surgical evaluation. Using the structural MRI, we generated 114 cortical regions of interest, performed surface reconstruction and MEG source localization. Representative source localized signals for each region were correlated with each other to generate a functional brain network. We repeated this procedure across three randomly chosen one-minute epochs. Network hubs were defined as those with the highest intra-hemispheric mean correlations. Post-operative MRI identified regions that were surgically removed.
Results: Greater mean MEG network connectivity was associated with a longer duration of epilepsy. Patients who were seizure free after surgery had more hubs surgically removed than patients who were not seizure free (AUC = 0.76, p = 0.01) consistently across three randomly chosen time segments.
Conclusion: Our results support a growing literature implicating network hub involvement in focal epilepsy, the removal of which by surgery is associated with greater chance of post-operative seizure freedom.
Introduction
Epilepsy affects 50 million people worldwide, with one third not responding to medication. Neurosurgical treatment is potentially curative in focal epilepsy, if the source of the epilepsy, “the epileptogenic zone” can be identified and removed. The goal of pre-surgical evaluation is to identify the epileptogenic zone using semiology, neuroimaging, and neurophysiology (1). However, despite the abundant data that are used to inform clinical decision making, around 50–70% of patients continue to experience post-operative seizures. The possibility of postoperative seizures, and risks of adverse effects, acts as a significant barrier to surgery as some patients who may benefit do not proceed to operation. The ability to better predict if patients will have favorable post-operative outcomes (in terms of seizure-freedom) would therefore be highly beneficial.
The identification of a measure for accurate outcome prediction is challenging, in part due to the complexity of brain network interactions. Functional brain networks derived from magnetoencephalography (MEG) data can be inferred by computing the pairwise similarity of brain regions. Several studies have shown increased MEG functional connectivity in patients with epilepsy compared to controls, even in inter-ictal periods (2–6). In two separate studies, Jin et al. (7) showed altered MEG network “hubs” —those regions with high network connectivity—in temporal areas in patients with hippocampal sclerosis, and increased network efficiency in patients with focal cortical dysplasia (8). With respect to surgical outcomes, Nissen et al. (9) investigated if MEG network hubs overlapped more with the resection area in seizure-free patients. The authors reported that hubs were localized within the area later resected in 9 of 14 seizure free patients, but none of the patients who had post-operative seizures. A later study from the same group showed in a larger cohort of 94 patients that areas with increased functional connectivity significantly overlapped with tissue that was later resected, but was not associated with outcomes. The study by Englot et al. (10) also demonstrated increased correlations in areas that were later resected in patients with good outcomes. Aydin et al. (11) suggested MEG networks could be used to predict outcome, and Krishan et al. (12) suggested epileptogenic source localization is feasible using MEG connectivity analysis irrespective of the presence/absence of inter-ictal spikes.
In addition to surgical outcomes, MEG network properties have been related to epilepsy duration (i.e., number of years a patient has had epilepsy), or age of onset. For example, Englot et al. (10) showed overall network connectivity to be negatively associated with epilepsy duration whilst in contrast Madhavan et al. (13) showed a positive association. Jin et al. (8) showed a negative association with age of seizure onset.
Taken together the MEG network literature suggests an increased connectivity in patients, particularly in “hub” areas that are later resected, which may be related to outcome and associated with duration. In this study we investigate MEG hubs and their removal in a cohort of 31 patients. Furthermore, since within-patient consistency is a critical step required before clinical application, we assessed the consistency of these results across three different time segments across four different parcellations. We hypothesized that the removal of high strength nodes would result in seizure-freedom. Our findings support earlier literature of being strong involvement of hub nodes in epileptogenic networks (14).
Methods
Patients
We retrospectively analyzed data from 31 patients who underwent pre-operative evaluation and subsequent epilepsy surgery at the National Hospital for Neurology and Neurosurgery, Queen Square, London. Outcomes of seizure freedom were assessed at least 12 months post-operatively according to the ILAE classification (15). In this cohort, 19 of the 31 patients had post-operative seizures (ILAE 2 or greater). All patients had no prior neurosurgery. There was no significant difference between outcome groups in terms of age, sex, or location of resection (Mann-Whitney U-test for age, χ2-test for differences in location, side, and sex) (see Table 1 for a summary and Supplementary Table 1 for detailed patient information).
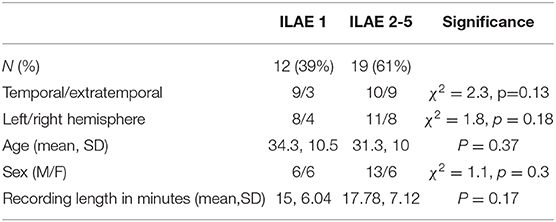
Table 1. Patient demographics and relation to outcome group.
MRI Acquisition and Processing
A T1 weighted MRI was acquired for all patients pre- and within 12 months post-operatively using a 3T GE Signa HDx scanner (General Electric, Waukesha, Milwaukee, WI). Standard imaging gradients with a maximum strength of 40 mTm−1 and slew rate 150 Tm−1 s−1 were used. All data were acquired using a body coil for transmission, and 8- channel phased array coil for reception. The high resolution T1-weighted volumetric image was acquired with 170 contiguous 1.1 mm-thick slices (matrix, 256 × 256; in-plane resolution, 0.9375 × 0.9375 mm).
The preoperative MRI was used to generate cortical regions using the standard FreeSurfer recon-all pipeline (16). In brief, this performs intensity normalization, skull stripping, subcortical volume generation, gray/white segmentation, and parcellation (16–18). Surfaces were visually inspected and manually corrected where necessary. We then generated labels for the cortex from the Lausanne multi-resolution parcellation (https://github.com/mattcieslak/easy_lausanne. (19) using surface-based registration. This resulted in four different parcellations which were later used to generate four networks per subject. These parcellations have different numbers of regions. The most coarse contains 68 regions and is the Desikan-Kiliany parcellation, which is based on anatomical boundaries (18), and the finest containing 448 regions which are subdivisions of lower resolution parcellations.
To identify which regions were affected, and which were completely spared by the resection we linearly registered the post-operative MRI to the pre-operative MRI using the FSL FLIRT tool (6 degrees of freedom) (20, 21). We then overlaid the post-operative MRI on the pre-operative MRI using FSLview and manually drew a mask to delineate which tissue was resected (22). Care was taken to ensure masks were not extended beyond, or reduced in proximity to, boundaries known to be resected (e.g., beyond the sylvian fissure for a temporal lobe resection). Care was also taken to account for any brain shift as in our previous study (22). For one patient (IDP 851), a post-operative MRI was unavailable and the surgery report from the clinical team was therefore used to identify the resected tissue mask. The masks were then overlaid on the volumetric regions of interest from the Lausanne parcellation listed above. Regions overlapping the mask were labeled as removed, and others labeled as spared by surgery. If any overlap was present, then the region was considered as removed.
MEG Acquisition and Processing
MEG data for all experiments were recorded using a 275-channel CTF Omega whole head gradiometer system (VSM MedTech) in a magnetically shielded environment, with a 600-Hz sampling rate. After participants were comfortably seated in the MEG, head localizer coils were attached to the nasion and preauricular regions, 1 cm anterior to the left and right tragus to monitor head movement during the recording sessions. Patients were requested to keep as still as possible during the individual 6-min recording epochs, awake and their eyes closed in resting state. No patient had any overt seizure during the MEG recordings. The total length of MEG recording differed between patients (mean 16.70 min, standard deviation 6.82 min). Although the MEG recording duration was slightly different for each patient, this did not differ significantly between the outcome groups (Table 1).
The MEG sensor data were pre-processed in two steps using the Brainstorm software (23). First, data were notch filtered at 50 Hz (24) (IIR 2nd order zero phase-lag, Brainstorm implementation) followed by bandpass filtering (zero phase-lag even-order linear phase FIR filter, based on a Kaiser window design, Brainstorm implementation) the data between 1 and 55 Hz (broadband) using Brainstorm's pre-processing module (Figure 1A). Second, the band-passed data were decomposed into different components using ICA, followed by removal of eye blink and cardiac components. The co-registration MEG helmet with pre-operative T1w MRI scan was performed using fiducials (anion, nasion, and preauricular points).
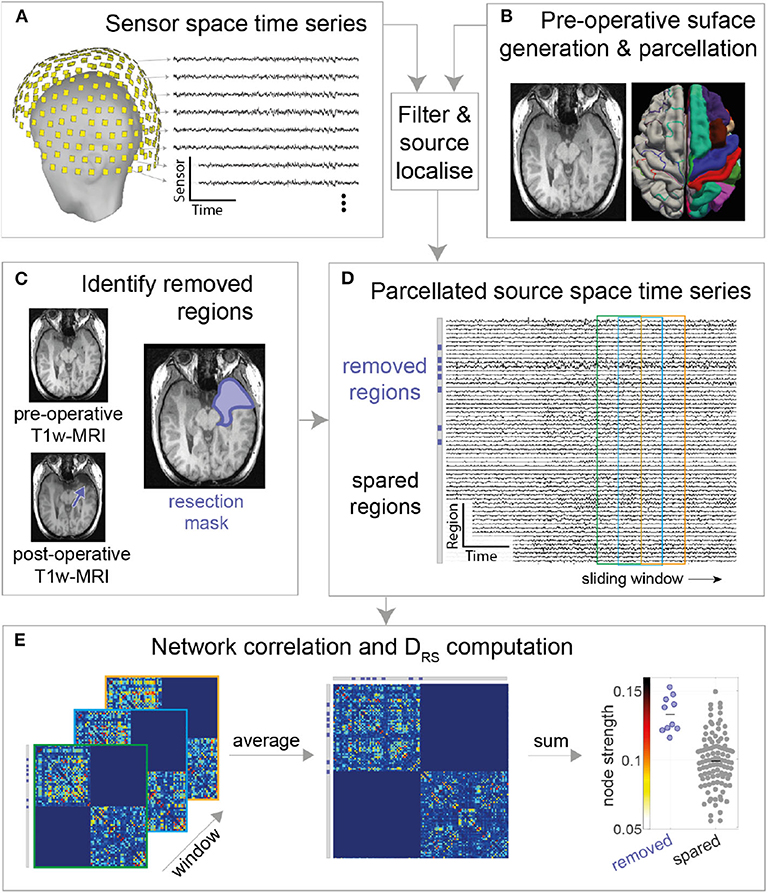
Figure 1. MEG processing pipeline. (A) Resting state MEG sensor data is filtered and (B) source localized using pre-operative MRI followed by parcellation (C) Post-operative T1-weighted MRI is overlaid on pre-operative T1-weighted MRI to obtain resection mask (D) Each parcellated source time series is now labeled as removed or spared using resection mask. A functional connectivity matrix is obtained for every sliding window (2s window with 50% overlap) (E) Functional connectivity matrices are then averaged to obtain a single connectivity matrix. Node strength is obtained from the averaged connectivity matrix, followed by DRS calculation between Spared and Removed regions.
MEG data were source reconstructed using sLORETA, a distributed model with zero localization error (25). The forward model (head model) was built using an overlapping multiple local sphere head model, which has accuracy similar to a boundary element model but is orders of magnitude faster to compute (10, 26), with 15,000 voxels constrained perpendicular to the cortical surface. These 15,000 voxels are divided into cortical regions of interest (ROIs) using the Laussane parcellation schemes. We derived one time series per ROI using a flipped mean approach (23), resulting in, for the scale 114 parcellation, a 114 x number of time points matrix (Figure 1D). The pre-processing pipeline is visually explained in Figure 1.
Network Construction and Analysis
Three one-minute epochs (10), each separated by at least five minutes, were chosen randomly for each patient. Given that some patients had insufficient durations of artifact-free recording our sample size reduced for epochs two and three. The results presented in the main text are for the first epoch, with others shown in Supplementary Materials. A two-second sliding window with 50% overlap was computed over the source reconstructed time series, extracting one functional connectivity (amplitude correlation using Pearson correlation) matrix per 2-s window (Figure 1E; left panel). The time varying functional connectivity matrices were temporally averaged across windows to one matrix, which represents the functional network of the entire epoch. The same was repeated for each of the other two epochs. Figures 1D,E summarizes the methods. The intra-hemispheric node strength, which we defined as the mean correlation of the nodes within hemisphere, was calculated. Nodes with high node strengths (large positive values) were hypothesized to be epileptogenic and thus their subsequent removal hypothesized to result in better patient outcomes.
As all patients had unilateral resections i.e., resection in only one hemisphere, we posited that connectivity ipsilateral to the epileptogenic zone is stronger than connectivity within the contralateral hemisphere. We therefore excluded inter-hemispheric connectivity (Figure 1E) since we expected this to hold less discriminatory information. We note that field spread may lead to spurious correlations; however, since the same methods are applied to all patients we do not expect this to be a confound to explain either outcome or duration.
To quantify the difference in node strengths between removed and spared tissue we used the area under receiver operator statistic curve (AUC) which is equivalent to the normalized non-parametric Mann-Whitney U statistic, we term this measure as DRS (Distinguishability of Removed node strength vs. Spared node strength). A DRS value of 0 or 1 indicates complete distinguishability of resected tissue from spared tissue. A value of 0 indicates that the strength of all resected nodes is higher than all spared nodes. In contrast, a value of 1 indicates that the strength of all spared nodes is higher than all resected nodes. Any value around 0.5 indicates similar rank-ordering of node strengths from both tissue types (27). This is a non-parametric method, which is robust to outliers and is effective even with non-gaussian distributions and generates a single value of DRS per patient (Figure 2 provides an illustrative example). This measure was introduced by Wang et al. (27).
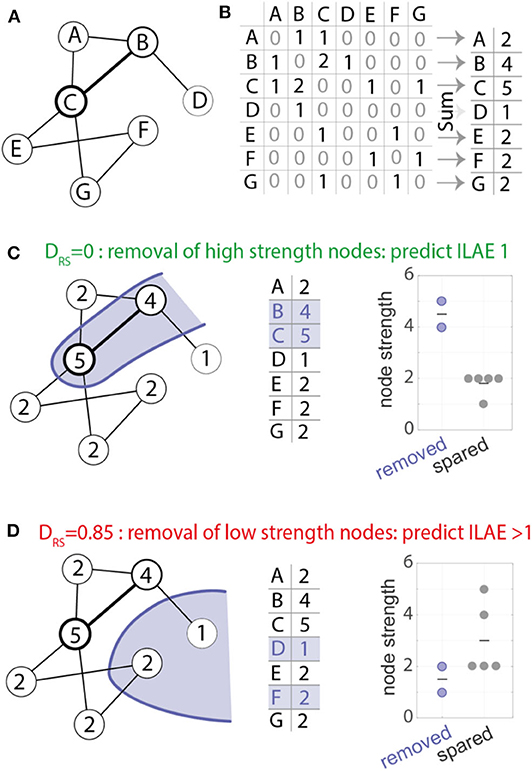
Figure 2. Computation of the DRS measure. (A) example network used for demonstration with seven nodes and eight weighted bidirectional connections. (B) The network in (A) represented as a weighted connectivity matrix. Taking the sum across the rows of the matrix gives a node strength value for each node. (C) The nodes in the network show the node strength. For example, node A has strength 2, node B has strength 4 and so on. An example resection to nodes B and C (shown in blue) would remove the two most strongly connected nodes (respective node strength 4 and 5, middle panel). Removed and spared nodes can be perfectly distinguished from each other—all removed nodes have higher node strength than all spared nodes. (D) Alternative resection scenario where the removal of low strength nodes leads to a DRS value of 0.85. In the scenario where removed and spared nodes have identical strength values a DRS value of 0.5 would be measured.
Statistical Analysis
The area under the receiver operating curve (AUC) measure was used to determine whether DRS distinguishes seizure-free (ILAE 1) from not-seizure-free (ILAE>1) outcomes. If the AUC = 1, or if AUC = 0, then there is the highest separation between good and bad outcomes, on the contrary, if AUC = 0.5, then separation is by chance. Hypothesizing that ILAE 1 patients would have lower DRS values (see Figure 2) (10, 27), we used a one-tailed Mann-Whitney U-test (ranksum) test to compare the difference between outcome groups. We computed 95% confidence intervals of the AUC using a logit transformation (28).
To test associations between the mean of the entire functional connectivity matrix i.e., average of all the connections (mean-FC) and log10 epilepsy duration (DUR), we compared the following two regression models under the likelihood ratio test to obtain a p-value for each time segment:
Model: mean FC ~ 1+ DUR vs Model0: mean FC ~ 1.
This tests if log10 epilepsy duration explains any of the variance in FC across subjects. The regression models were fitted using a robust regression approach.
To test if duration and mean FC were positively associated over all segments, we used a linear mixed effects model, where we modeled the time segment as a random effect:
LME: mean FC ~ 1+ DUR + (1|segment).
To test if duration explained significantly more variance in mean FC, we tested it against the alternative model LME0: mean FC ~ 1 + (1|segment) using a likelihood ratio test again.
Results
High Connectivity in Resected Tissue Is Associated With Favorable Outcome
We hypothesized that the removal of high strength nodes would result in seizure-freedom. Figure 3 shows the pre-operative node strength for two example patients and their later resections overlaid in blue. Patient 1220 (Figure 3A) had a left sided temporal lobe resection, with many non-resected high-strength nodes in parietal and frontal areas. The distinguishability between the resected and spared node strengths (lower panel) is close to 0.5 which suggests the removed nodes are no different to the rest of the network in their strength. This patient had post-operative seizures with an ILAE outcome class 5.
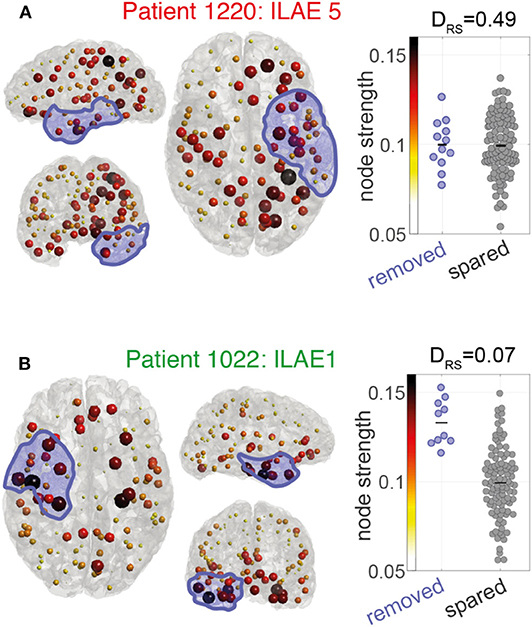
Figure 3. Node strength visualization for two patients (A,B). Left and center panels: Node strength is visualized as the color and size of each ROI marker. Larger (darker) spheres indicate ROIs with higher MEG interictal network node strength. Blue shaded area indicates the surgically removed tissue. Right panels: Beeswarm plot of the MEG interictal network node strength in removed (blue) vs. spared (gray) ROIs. Each data point is the node strength of an individual region. The DRS value is a measure of effect size to indicate differences in the node strengths of removed and spared nodes. A DRS of 0 indicates that the removed ROIs all have larger node strengths than the spared ROIs. A DRS of around 0.5 means that both ROI types have similar levels of node strength.
In contrast, patient 1022 (Figure 3B) had a right sided temporal lobe resection and was seizure-free afterwards. Many of the highest strength “hub” nodes lay within the resection zone meaning they were subsequently removed by surgery. A DRS sore of 0.07 reflects that (i) removed nodes tend to have higher strength than spared nodes and (ii) the difference between removed and spared node is large.
Consistency of Findings
Extending the analysis to include all 31 patients shows significantly lower DRS values (i.e., the resected and spared ROIs are more distinguishable) in patients with post-operative seizure-freedom, compared to those who were not seizure-free (one tailed Wilcoxon rank sum p = 0.01, AUC = 0.76, 95%CI = 0.54–0.90, Figure 4). Confusion matrices for the ROC curve optimized for maximum accuracy are shown In Supplementary Table 2)
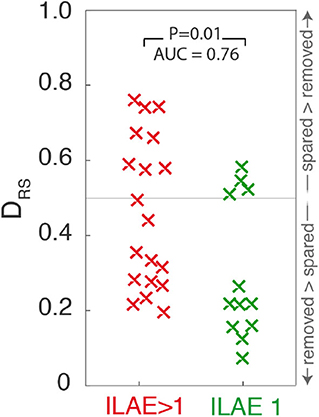
Figure 4. Scatter plot depicting DRS values for ILAE1 and ILAE>1 surgical outcomes. Values close to 0 (1) indicate that high strength nodes are resected (spared). Each “x” marker represents an individual patient.
To test the temporal robustness of this result the entire analysis was repeated for two additional one-minute segments, separated by at least five minutes. Supplementary Table 2 shows these findings for the 28 patients for whom there were sufficient data available to repeat the analysis. For both of those additional segments, ILAE 1 patients still had significantly lower DRS values than those patients with ILAE>1 outcomes (segment 2: p = 0.04, AUC = 0.7, 95%CI = 0.47–0.86, segment 3: p = 0.02, AUC = 0.74, 95%CI = 0.51–0.88).
The networks generated in Figure 4 comprise cortical networks based on 114 ROIs using the Lausanne subparcellation of the original Desikan-Kiliany (DK) atlas (18). Repeating the analysis for higher resolution subparcellations, comprising 219, or 448 regions, the finding of lower DRS values for ILAE1 patients is replicated for this time segment (p < 0.05, Supplementary Table 1), but was not significant for other time segments, or when using the DK parcellation (Supplementary Table 3).
Higher Connectivity Is Associated With Longer Duration
Using a linear regression model robust to outliers we found the duration of epilepsy was positively associated with mean FC in contrast to the negative association reported by Englot et al. (10) (Figure 5) (likelihood ratio test p = 0.03, adjusted R2 = 0.1). The positive association was also present for time segment 3 (likelihood ratio test p ≪ 0.01, adjusted-R2 = 0.17), but was not significant for segment 2 (likelihood ratio test p = 0.1, adjusted R2 < 0.01). Given the conflicting result from segment 2 we applied a linear mixed effects model that incorporates the segment number as a random effect in the analysis, boosting overall statistical power utilizing all available data. This approach found a significant positive association overall between duration and mean FC (likelihood ratio test p = 0.02).
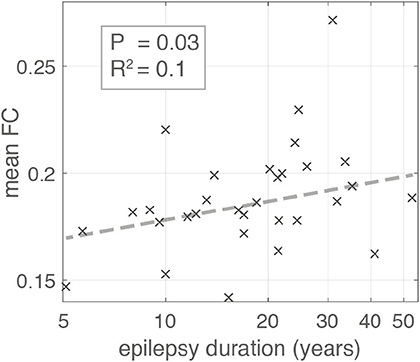
Figure 5. Scatter plot illustrating the relationship between Epilepsy duration in years and mean global functional connectivity. Each “x” marker represents an individual patient. Dashed line represents the line of best fit using bisquare linear regression robust to outliers. The association is significant with p-value = 0.03 (likelihood ratio test) and adjusted R2 = 0.1.
Discussion
In this study we investigated pre-operative functional connectivity networks, constructed in source space, using MEG recordings from 31 patients with refractory focal epilepsy who later underwent epilepsy surgery. Networks were constrained by pre- and post-operative MRI allowing accurate delineation of resected regions. We report three main findings. First, seizure-free patients showed higher preoperative node strength in surgically-removed regions compared to surgically-spared regions. Second, capturing this discrepancy between surgically-removed and surgically-spared regions patient-specifically by our proposed DRS measure, we found significant differences in DRS between outcome groups. Third, overall network connectivity strength showed a weak, but significant, positive association with epilepsy duration.
Our approach builds on our previous work with intracranial EEG, where we show that patients generally have better seizure outcomes when high-strength nodes are surgically removed (27–30). Other groups have reported similar findings from intracranial EEG (31–37). With MEG data, Nissen et al. (9) showed in a cohort of 22 patients, that interictal source localized network hubs overlapped with the resection in seizure-free patients only. There, the authors applied node betweenness centrality (38) as their measure of hubness, as opposed to our measure of node strength. Node strength and betweenness centrality are highly correlated, so our results are in strong agreement. Jin et al. (39) used similar methods (nodal betweenness centrality) applied to source localized interictal MEG and reported altered network hubs in patients, as compared to healthy controls. Englot et al. (10) reported increased connectivity in the resected region to be more frequent in seizure-free patients. Our findings support a strong involvement of hub nodes in epileptogenic networks (14).
We investigated the robustness of our results to the choice of time segment. This is important clinically because it is unknown if there is an optimal time segment, or whether results may vary over time. Our finding of consistent differences in DRS values between outcome groups, regardless of time segment suggests confidence that segments of one-minute duration are sufficient. Other previous studies have also found one minute to be sufficient for consistent predictions in most cases (10, 27), and that short durations are sufficient to capture stationary aspects of the functional connectivity (40).
In contrast to the consistency across time segments, we found some variability associated with the choice of spatial parcellations. Although a trend of increased DRS in poor outcome patients was present in all analyses (Supplementary Table 1), this only consistently met significance across all segments for only the 114 ROI parcellation. This may reflect a compromise between the regions being small enough to not have averaging across large regions (incurring a loss of data), but still large enough to represent independent time series data for our cohort as a whole. However, we recognize that patient-specific parcellations, parcellation-free, or adaptive parcellation approaches may be beneficial (41–44).
Although we typically found high node strength in the resection area in good outcome patients, several high strength nodes were spared by surgery. For example, patient 1022 had multiple high strength nodes even in the contralateral hemisphere (Figure 3B). Given that all brain networks (epileptogenic or otherwise) have a mixture of high and low strength nodes, we interpret that seizures are facilitated by high strength nodes, but that not all high strength nodes are necessarily pathological. The normalization of patient networks against those from controls allows for the identification of pathological “abnormal” nodes (27, 45). Future studies should investigate these relationships between node hubness and node abnormality.
Despite several studies reporting relationships between structural MRI properties and epilepsy duration (46–48), few have investigated this relationship with MEG data. In agreement with our study, Madhaven et al. (13) performed an analysis of MEG data acquired from 12 patients with focal epilepsy and also found a significant positive correlation between connectivity and duration. In contrast to our analysis approach, the authors of that study analyzed only the subnetwork implicated in interictal epileptiform discharges, rather than performing a whole brain analysis as is presented here. Furthermore, that study reported significant findings only in beta band connectivity. However, our finding of increased mean network functional connectivity with increased epilepsy duration did not concur with Englot et al. (10). This may be due to the small size of the effect in our data (R2 < 0.2 for all segments), or the data used by Englot et al. (10) (R2 = 0.229). Other differences of note between the studies include the pre-processing strategies, and network types; specifically, Englot et al. (10) used alpha-band imaginary coherence, whereas our study uses broadband correlation. Given the limited and mixed literature, we conclude that a larger cohort with consistent processing is required to better understand relationships between duration and MEG functional connectivity.
An important limitation of this study is that the networks studied include neocortical areas only, and not deep brain structures including the amygdala or hippocampus. Previous work has demonstrated that MEG signals can be localized in deep brain structures. Pizzo et al. (49) showed that MEG signals could be source localized to spikes detected on concurrently recorded intracranial EEG. However, localization to the hippocampus is challenging (50). Given that our networks are constructed from low amplitude interictal activity, and that our objective was not high amplitude spike localization, we excluded those structures in our analysis. Other limitations of our study include the sample size used, which is in a similar range to previous studies (9), and the retrospective (as opposed to prospective) design of our analysis.
Prospective applications of our approach could involve using a mask of the intended resection overlaid with the patient's network as performed here. Calculation of an expected DRS, for the intended resection, could be made and this information used to alter the resection strategy. Multiple strategies could be computed and optimized for minimal DRS, minimal resection size, and maximal distance to eloquent areas. We envisage such a software tool could be used during pre-surgical evaluation (22).
This study has focussed on functional (MEG derived) network properties. Previous studies suggest that univariate properties (e.g., dominant frequency, inter-ictal spike rate, presence of HFOs) may also hold informative information (51–55). Although interictal spikes may be randomly present in any chosen epoch, their influence on functional connectivity is limited if they are present in only a minority of time windows. This influence is limited because our approach captures stationary aspects of the reconstructed network rather than the transient spikes (40, 56). However, we acknowledge that in circumstances where the majority of the recording contains spikes their influence on functional connectivity may be stronger. As we do not investigate spike counts here, this should be considered as a possible limitation of our work. Our approach as presented can be fully automated, without the need for manual identification of spikes, thus serving as a distinct advantage of our methods. Additional to neurophysiologically-derived networks, structural network information, which underpins functional network dynamics, has also been shown to have predictive value (22, 57, 58). Future studies should integrate univariate properties (such as spikes) with structural, and functional networks in a personalized patient specific manner to better understand the role of abnormal network hubs, maximizing the benefits of all patient data (59–61). Additionally, future studies should investigate robustness' of these results with different connectivity measures such as imaginary coherence or phase locked value (PLV).
Taken together, our study has provided additional evidence that the removal of network hubs can lead to improved patient outcomes from epilepsy surgery and suggested that these findings are temporally robust.
Data Availability Statement
Preprocessed networks are available on reasonable request to the corresponding author. Requests to access the datasets should be directed to peter.taylor@newcastle.ac.uk.
Ethics Statement
The studies involving human participants were reviewed and approved by Newcastle University Research Office Ref: 1804/2020. Written informed consent for participation was not required for this study in accordance with the national legislation and the institutional requirements.
Author Contributions
SR, YW, NS, and PT conceived the presented idea. SR and PT performed the computations. AMc and AMi performed the surgery. JT organized data. FR-G and JD oversaw data collection. All authors provided input into the writing.
Funding
This work was supported by the National Institute for Health Research University College London Hospitals Biomedical Research Center. PT, SR, and YW gratefully acknowledge funding from Wellcome Trust (208940/Z/17/Z and 210109/Z/18/Z). We are grateful to the Epilepsy Society for supporting the Epilepsy Society MRI scanner.
Conflict of Interest
The authors declare that the research was conducted in the absence of any commercial or financial relationships that could be construed as a potential conflict of interest.
Acknowledgments
We thank members of the CNNP lab (www.cnnp-lab.com) for discussions on the analysis and manuscript. We thank Roman Rodionov and Sjoerd Vos for helping with data organization.
Supplementary Material
The Supplementary Material for this article can be found online at: https://www.frontiersin.org/articles/10.3389/fneur.2020.563847/full#supplementary-material
References
1. Rosenow F, Lüders H. Presurgical evaluation of epilepsy. Brain. (2001) 124:1683–700. doi: 10.1093/brain/124.9.1683
2. Chavez M, Valencia M, Navarro V, Latora V, Martinerie J. Functional modularity of background activities in normal and epileptic brain networks. Phys Rev Lett. (2010) 104:118701. doi: 10.1103/PhysRevLett.104.118701
3. Hsiao FJ, Yu HY, Chen WT, Kwan SY, Chen C, Yen DJ, et al. Increased intrinsic connectivity of the default mode network in temporal lobe epilepsy: evidence from resting-state MEG recordings. PLoS ONE. (2015) 10:e0128787. doi: 10.1371/journal.pone.0128787
4. Jeong W, Jin SH, Kim M, Kim JS, Chung CK. Abnormal functional brain network in epilepsy patients with focal cortical dysplasia. Epilepsy Res. (2014) 108:1618–26. doi: 10.1016/j.eplepsyres.2014.09.006
5. Pang EW, Snead Iii OC. From structure to circuits: the contribution of MEG connectivity studies to functional neurosurgery. Front Neuroanat. (2016) 10:67. doi: 10.3389/fnana.2016.00067
6. Beilei W, Meng L. Functional brain network alterations in epilepsy: a magnetoencephalography Study. Epilepsy Res. (2016) 126:62–9. doi: 10.1016/j.eplepsyres.2016.06.014
7. Jin S-H, Chung CK. Electrophysiological resting-state biomarker for diagnosing mesial temporal lobe epilepsy with hippocampal sclerosis. Epilepsy Res. (2017) 129:138–45. doi: 10.1016/j.eplepsyres.2016.11.018
8. Jin S-H, Jeong W, Chung CK. Focal cortical dysplasia alters electrophysiological cortical hubs in the resting-state. Clin Neurophysiol. (2015) 126:1482–92. doi: 10.1016/j.clinph.2014.10.010
9. Nissen IA, Stam CJ, Reijneveld JC, van Straaten IE, Hendriks EJ, Baayen JC, et al. Identifying the epileptogenic zone in interictal resting-state MEG source-space networks. Epilepsia. (2017) 58:137–48. doi: 10.1111/epi.13622
10. Englot DJ, Hinkley LB, Kort NS, Imber BS, Mizuiri D, Honma SM, et al. Global and regional functional connectivity maps of neural oscillations in focal epilepsy. Brain. (2015) 138:2249–62. doi: 10.1093/brain/awv130
11. Aydin Ü, Pellegrino G, Ali OBKb, Abdallah C, Dubeau F, Lina JM, et al. Magnetoencephalography resting state connectivity patterns as indicatives of surgical outcome in epilepsy patients. J. Neural Eng. (2020) 17:035007. doi: 10.1088/1741-2552/ab8113
12. Krishnan B, Vlachos I, Wang ZI, Mosher J, Najm I, Burgess R, et al. Epileptic focus localization based on resting state interictal MEG recordings is feasible irrespective of the presence or absence of spikes. Clin Neurophysiol. (2015) 126:667–74. doi: 10.1016/j.clinph.2014.07.014
13. Madhavan D, Heinrichs-Graham E, Wilson TW. Whole-brain functional connectivity increases with extended duration of focal epileptiform activity. Neurosci Lett. (2013) 542:26–9. doi: 10.1016/j.neulet.2013.02.052
14. Van Mierlo P, Höller Y, Focke NK, Vulliemoz S. Network perspectives on epilepsy using EEG/MEG source connectivity. Front Neurol. (2019) 10:721. doi: 10.3389/fneur.2019.00721
15. Wieser H, Blume W, Fish D, Goldensohn E, Hufnagel A, King D, et al. Proposal for a new classification of outcome with respect to epileptic seizures following epilepsy surgery. Epilepsia. (2001) 42:282–6. doi: 10.1046/j.1528-1157.2001.4220282.x
17. Fischl B, Salat DH, Busa E, Albert M, Dieterich M, Haselgrove C, et al. Whole brain segmentation: automated labeling of neuroanatomical structures in the human brain. Neuron. (2002) 33:341–55. doi: 10.1016/S0896-6273(02)00569-X
18. Desikan RS, Ségonne F, Fischl B, Quinn BT, Dickerson BC, Blacker D, et al. An automated labeling system for subdividing the human cerebral cortex on MRI scans into gyral based regions of interest. NeuroImage. (2006) 31:968–80. doi: 10.1016/j.neuroimage.2006.01.021
19. Hagmann P, Cammoun L, Gigandet X, Meuli R, Honey CJ, Wedeen VJ, et al. Mapping the structural core of human cerebral cortex. PLoS Biol. (2008) 6:e159. doi: 10.1371/journal.pbio.0060159
20. Jenkinson M, Smith S. A global optimisation method for robust affine registration of brain images. Med Image Anal. (2001) 5:143–56. doi: 10.1016/S1361-8415(01)00036-6
21. Jenkinson M, Bannister P, Brady M, Smith S. Improved optimization for the robust and accurate linear registration and motion correction of brain images. NeuroImage. (2002) 17:825–41. doi: 10.1006/nimg.2002.1132
22. Taylor PN, Sinha N, Wang Y, Vos SB, de Tisi J, Miserocchi A, et al. The impact of epilepsy surgery on the structural connectome and its relation to outcome. NeuroImage Clin. (2018) 18:202–14. doi: 10.1016/j.nicl.2018.01.028
23. Tadel F, Baillet S, Mosher JC, Pantazis D, Leahy RM. Brainstorm: a user-friendly application for MEG/EEG analysis. Comput intell Neurosci. (2011) 2011:879716. doi: 10.1155/2011/879716
24. Mitra SK, Kuo Y. Digital Signal Processing: A Computer-Based Approach. (2006). New York, NY: McGraw-Hill.
25. Pascual-Marqui RD. Standardized low-resolution brain electromagnetic tomography (sLORETA): technical details. Methods Find Exp Clin Pharmacol. (2002) 24(Suppl. D):5–12.
26. Huang M, Mosher JC, Leahy R. A sensor-weighted overlapping-sphere head model and exhaustive head model comparison for MEG. Phys Med Biol. (1999) 44:423. doi: 10.1088/0031-9155/44/2/010
27. Wang Y, Sinha N, Schroeder GM, Ramaraju S, McEvoy AW, Miserocchi A, et al. Interictal intracranial EEG for predicting surgical success: the importance of space and time. Epilepsia. (2020) 61:1417–26. doi: 10.1111/epi.16580
28. Qin G, Hotilovac L. (2008). Comparison of non-parametric confidence intervals for the area under the ROC curve of a continuous-scale diagnostic test. Stat Methods Med Res. 17:207–21 doi: 10.1177/0962280207087173
29. Sinha N, Dauwels J, Kaiser M, Cash SS, Brandon Westover M, Wang Y, et al. Predicting neurosurgical outcomes in focal epilepsy patients using computational modelling. Brain. (2017) 140:319–32. doi: 10.1093/brain/aww299
30. Sinha N, Dauwels J, Wang Y, Cash SS, Taylor PN. An in silico approach for pre-surgical evaluation of an epileptic cortex. Conf Proc IEEE Eng Med Biol Soc. (2014) 2014:4884–7. doi: 10.1109/EMBC.2014.6944718
31. Wilke C, Worrell G, He B. Graph analysis of epileptogenic networks in human partial epilepsy. Epilepsia. (2011) 52:84–93. doi: 10.1111/j.1528-1167.2010.02785.x
32. Goodfellow M, Rummel C, Abela E, Richardson M, Schindler K, Terry J. Estimation of brain network ictogenicity predicts outcome from epilepsy surgery. Sci Rep. (2016) 6:29215. doi: 10.1038/srep29215
33. Lagarde S, Roehri N, Lambert I, Trebuchon A, McGonigal A, Carron R, et al. Interictal stereotactic-EEG functional connectivity in refractory focal epilepsies. Brain. (2018) 141:2966–80. doi: 10.1093/brain/awy214
34. Yang C, Luan G, Wang Q, Liu Z, Zhai F, Wang Q. Localization of epileptogenic zone with the correction of pathological networks. Front Neurol. (2018) 9:143. doi: 10.3389/fneur.2018.00014
35. Shah P, Bernabei JM, Kini LG, Ashourvan A, Boccanfuso J, Archer R, et al. High interictal connectivity within the resection zone is associated with favorable post-surgical outcomes in focal epilepsy patients. NeuroImage Clin. (2019) 23:101908. doi: 10.1016/j.nicl.2019.101908
36. Kini LG, Bernabei JM, Mikhail F, Hadar P, Shah P, Khambhati AN, et al. Virtual resection predicts surgical outcome for drug-resistant epilepsy. Brain. (2019) 142:3892–905. doi: 10.1093/brain/awz303
37. Burns SP, Santaniello S, Yaffe RB, Jouny CC, Crone NE, Bergey GK, et al. Network dynamics of the brain and influence of the epileptic seizure onset zone. Proc Natl Acad Sci USA. (2014) 111:E5321–E30. doi: 10.1073/pnas.1401752111
38. Freeman LC. A set of measures of centrality based on betweenness. Sociometry. (1977) 40:35–41. doi: 10.2307/3033543
39. Jin SH, Jeong W, Chung CK. Mesial temporal lobe epilepsy with hippocampal sclerosis is a network disorder with altered cortical hubs. Epilepsia. (2015) 56:772–9. doi: 10.1111/epi.12966
40. Chu CJ, Kramer MA, Pathmanathan J, Bianchi MT, Westover MB, Wizon L, et al. Emergence of stable functional networks in long-term human electroencephalography. J Neurosci. (2012) 32:2703–13. doi: 10.1523/JNEUROSCI.5669-11.2012
41. Besson P, Lopes R, Leclerc X, Derambure P, Tyvaert L. Intra-subject reliability of the high-resolution whole-brain structural connectome. NeuroImage. (2014) 102:283–93. doi: 10.1016/j.neuroimage.2014.07.064
42. Besson P, Bandt SK, Proix T, Lagarde S, Jirsa VK, Ranjeva J-P, et al. Anatomic consistencies across epilepsies: a stereotactic-EEG informed high-resolution structural connectivity study. Brain. (2017) 140:2639–52. doi: 10.1093/brain/awx181
43. Taylor PN, Wang Y, Kaiser M. Within brain area tractography suggests local modularity using high resolution connectomics. Sci Rep. (2017) 7:39859. doi: 10.1038/srep39859
44. Farahibozorg SR, Henson RN, Hauk O. Adaptive cortical parcellations for source reconstructed EEG/MEG connectomes. NeuroImage. (2018) 169:23–45. doi: 10.1016/j.neuroimage.2017.09.009
45. Sinha N, Wang Y, da Silva NM, Miserocchi A, McEvoy AW, de Tisi J, et al. Node abnormality predicts seizure outcome and relates to long-term relapse after epilepsy surgery. bioRxiv [Preprint]. (2019) 747725. doi: 10.1101/747725
46. Owen T.W., de Tisi J., Vos S. B., Winston G. P., Duncan J. S., Wang Y., et al. (2020). Multivariate alterations to white matter integrity are associated with epilepsy duration, arXiv preprint arXiv [Preprint]. 2007.07643
47. Keller SS, Schoene-Bake JC, Gerdes JS, Weber B, Deppe M. Concomitant fractional anisotropy and volumetric abnormalities in temporal lobe epilepsy: cross-sectional evidence for progressive neurologic injury. PLOS ONE. (2012) 7:e46791. doi: 10.1371/journal.pone.0046791
48. Hatton SN, Huynh KH, Bonilha L, Abela E, Alhusaini S, Altmann A, et al. ‘White matter abnormalities across different epilepsy syndromes in adults: an ENIGMA epilepsy study. Brain. (2020) 143:2454–73. doi: 10.1093/brain/awaa200
49. Pizzo F, Roehri N, Medina Villalon S, Trébuchon A, Chen S, Lagarde S, et al. Deep brain activities can be detected with magnetoencephalography. Nat Commun. (2019) 10:971. doi: 10.1038/s41467-019-08665-5
50. Quraan MA, Moses SN, Hung Y, Mills T, Taylor MJ. Detection and localization of hippocampal activity using beamformers with MEG: a detailed investigation using simulations and empirical data. Human Brain Mapping. (2011) 32:812–27. doi: 10.1002/hbm.21068
51. Velmurugan J, Nagarajan SS, Mariyappa N, Mundlamuri RC, Raghavendra K, Bharath RD, et al. Magnetoencephalography imaging of high frequency oscillations strengthens presurgical localization and outcome prediction. Brain. (2019) 142:3514–29. doi: 10.1093/brain/awz284
52. Thomschewski A, Hincapié A-S, Frauscher B. Localization of the epileptogenic zone using high frequency oscillations. Front Neurol. (2019) 10:94. doi: 10.3389/fneur.2019.00094
53. Lee J, Taira T, Pihlaja P, Ransom BR, Kaila K. Effects of CO2 on excitatory transmission apparently caused by changes in intracellular pH in the rat hippocampal slice. Brain Res. (1996) 706:210–6. doi: 10.1016/0006-8993(95)01214-1
54. Dai Y, Zhang W, Dickens DL, He B. Source connectivity analysis from MEG and its application to epilepsy source localization. Brain Topograph. (2012) 25:157–66. doi: 10.1007/s10548-011-0211-0
55. Ebersole JS, Wagner M. Relative yield of MEG and EEG spikes in simultaneous recordings. J Clin Neurophysiol. (2018) 35:443–53. doi: 10.1097/WNP.0000000000000512
56. Hu DK, Mower A, Shrey DW, Lopour BA. Effect of interictal epileptiform discharges on EEG-based functional connectivity networks. Clin Neurophysiol. (2020) 131:1087–98. doi: 10.1101/784298
57. Bonilha L, Jensen JH, Baker N, Breedlove J, Nesland T, Lin JJ, et al. The brain connectome as a personalized biomarker of seizure outcomes after temporal lobectomy. Neurology. (2015) 84:1846–53. doi: 10.1212/WNL.0000000000001548
58. Munsell BC, Wee C-Y, Keller SS, Weber B, Elger C, da Silva LAT, et al. Evaluation of machine learning algorithms for treatment outcome prediction in patients with epilepsy based on structural connectome data. NeuroImage. (2015) 118:219–30. doi: 10.1016/j.neuroimage.2015.06.008
59. Hutchings F, Han CE, Keller SS, Weber B, Taylor PN, Kaiser M. Predicting surgery targets in temporal lobe epilepsy through structural connectome based simulations. PLoS Comput Biol. (2015) 11:e1004642. doi: 10.1371/journal.pcbi.1004642
60. Jirsa VK, Proix T, Perdikis D, Woodman MM, Wang H, Gonzalez-Martinez J, et al. The virtual epileptic patient: individualized whole-brain models of epilepsy spread. NeuroImage. (2017) 145:377–88. doi: 10.1016/j.neuroimage.2016.04.049
Keywords: epilepsy, surgery, network, MEG (magnetoencephalography), outcome prediction
Citation: Ramaraju S, Wang Y, Sinha N, McEvoy AW, Miserocchi A, de Tisi J, Duncan JS, Rugg-Gunn F and Taylor PN (2020) Removal of Interictal MEG-Derived Network Hubs Is Associated With Postoperative Seizure Freedom. Front. Neurol. 11:563847. doi: 10.3389/fneur.2020.563847
Received: 19 May 2020; Accepted: 20 August 2020;
Published: 24 September 2020.
Edited by:
Eliane Kobayashi, McGill University, CanadaReviewed by:
Umit Aydin, King's College London, United KingdomEleonora Tamilia, Boston Children's Hospital and Harvard Medical School, United States
Copyright © 2020 Ramaraju, Wang, Sinha, McEvoy, Miserocchi, de Tisi, Duncan, Rugg-Gunn and Taylor. This is an open-access article distributed under the terms of the Creative Commons Attribution License (CC BY). The use, distribution or reproduction in other forums is permitted, provided the original author(s) and the copyright owner(s) are credited and that the original publication in this journal is cited, in accordance with accepted academic practice. No use, distribution or reproduction is permitted which does not comply with these terms.
*Correspondence: Peter N. Taylor, peter.taylor@newcastle.ac.uk