 Michael A. Woodley of Menie
 Jan te Nijenhuis3
 Raegan Murphy
- 1Department of Psychology, Technische Universität Chemnitz, Chemnitz, Germany
- 2Center Leo Apostel for Interdisciplinary Studies, Vrije Universiteit Brussel, Brussels, Belgium
- 3Work and Organizational Psychology, University of Amsterdam, Amsterdam, Netherlands
- 4School of Applied Psychology, University College Cork, Cork, Republic of Ireland
A commentary on
Factors influencing the latency of simple reaction time
by Woods, D. L., Wyma, J. M., Yund, E. W., Herron, T. J., and Reed, B. (2015). Front. Hum. Neurosci. 9:131. doi: 10.3389/fnhum.2015.00131
Woods et al. (2015) claim that secular Simple Reaction Time (SRT) slowing (Woodley et al., 2013), disappears once modern studies are corrected for software and hardware lag, and once Galton's data are corrected for fastest-response selection. Here, this is challenged with a reanalysis of the secular slowing of SRT in the UK amongst large (N > 500), population-representative age-matched (≊18–30 years) studies.
Starting with Galton's sample, this is assigned the simulated value estimated by Dodonova and Dodonov (2013, who like Woods et al. were critical of secular SRT slowing, owing to measurement issues) on the basis that he collected the fastest of three trials (207.5 ms). The two sexes in Galton's study are combined (as in Woods et al.), raising the weighted sample mean to 208.5 ms.
Next is the Wilkinson and Allison (1989) study, which attempted to replicate Galton's study one century later, collecting SRTs as part of an exhibit in the London Science Museum. An electronic chronoscope recorded SRTs on magnetic tape, and sampled over eight trials with micro-processor-determined variable foreperiods. The mean SRT value for the 1189 participants aged between 20 and 29 is 245 ms. The presence of long and variable foreperiods necessitates a penalty of 10 ms (Dodonova and Dodonov, 2013). Another 10 ms should be deducted based on key-pressing time (Dodonova and Dodonov, 2013), reducing the mean to 225 ms.
The studies of Deary and Der (2005) and Der and Deary (2006) are also included. The first utilized the highly representative Scottish Twenty-07 cohort. Dodonova and Dodonov (2013) identified a 53 ms lag stemming from liquid crystal stimulus onset delay. This is subtracted from the weighted average of the two sexes (300.8 ms), along with another 10 ms for key-pressing time. The resultant mean is 237.8 ms.
Dodonova and Dodonov (2013) cleaned the male data in the Der and Deary (2006) study, collected from the representative UK Health and Lifestyle Survey, by removing cases for which SRT standard deviations exceeded those for choice RT. This reduced the N from 834 to 661, and also reduced the mean from 300 to 284 ms. The estimate was also penalized for LCD onset delay and key-pressing time, reducing the mean to 221 ms. When the SRT value for the female sample is penalized equivalently the resulting value is 239 ms. In order to simulate the female N for the purposes of taking a weighted average of both sexes, the actual female N is reduced in proportion to the male N (79.3% = 881), yielding a weighted mean of 230.9 ms for a combined sample-size of 1472. Table 1 presents the data used in the analysis.
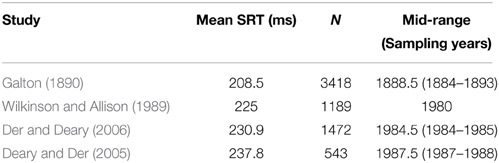
Table 1. SRT means, sample sizes and sampling years for four large, age-matched UK samples.
Consistent with Dodonova and Dodonov (2013), N-weighted regression is employed, as the only data on sample variability is sample size. Figure 1 illustrates the secular trend in British SRT spanning 100 years.
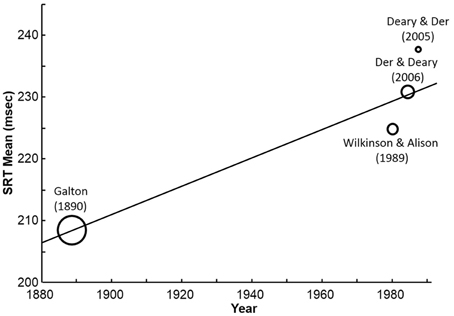
Figure 1. Secular SRT slowing across four large, representative studies from the UK spanning a century. Bubble-size is proportional to sample size. Combined N = 6622.
The secular slowing between UK studies is statistically significant (β = 0.97; 95% CI = 0.969–0.971, N = 6622), at +22.8 ms a century.
Additional evidence for generational SRT slowing comes from Verhaeghen (2014), who suggested that the ratio of longitudinal to cross-sectional age-related slowing might indicate generational changes in processing speed. Verhaeghen reports ratios for two SRT studies (0.91 and 1.15), implying both secular losses and gains. For the study of Deary and Der (2005), the SRT ratios are “censored because they were excessively large” (p. 256). In this study, the ratio of the cross-sectional slowing trend (taking the weighted average of all paired between-cohort differences rescaled in terms of change per decade for males and females), to the weighted average decadal longitudinal slowing trend for both the males and females is 0.73, for an N of 1926 (cf. Woodley et al., 2014, for a detailed reanalysis of this dataset utilizing curve-fitting). The weighted average of the three SRT “Verhaeghen ratios” is 0.9 (N = 4078)—tentatively consistent with generational declines (i.e., a ratio of < 1).
In conclusion, Woods et al. (2015) have undoubtedly made an important contribution to the debate concerning the role of software and hardware lag in the inflation of contemporary estimates of SRT, however, the evidence for generational SRT slowing remains quite compelling.
Conflict of Interest Statement
The authors declare that the research was conducted in the absence of any commercial or financial relationships that could be construed as a potential conflict of interest.
Supplementary Material
The Supplementary Material for this article can be found online at: http://journal.frontiersin.org/article/10.3389/fnhum.2015.00452/full
References
Deary, I. J., and Der, G. (2005). Reaction time, age, and cognitive ability: longitudinal findings from age 16 to 63 years in representative population samples. Aging Neuropsychol. Cogn. 12, 187–213. doi: 10.1080/13825580590969235
Der, G., and Deary, I. J. (2006). Age and sex differences in reaction time in adulthood: results from the United Kingdom health lifestyle survey. Psychol. Aging 21, 62–73. doi: 10.1037/0882-7974.21.1.62
Dodonova, Y. A., and Dodonov, Y. S. (2013). Is there any evidence of historical slowing of reaction time? No, unless we compare apples and oranges. Intelligence 41, 674–687. doi: 10.1016/j.intell.2013.09.001
Galton, F. (1890). Exhibition of instruments (1) for testing the perception of differences of tint, and (2) for determining reaction-time. J. Anthropol. Institute 19, 27–29. doi: 10.2307/2842529
Verhaeghen, P. (2014). The Elements of Cognitive Aging: Meta-analyses of Age-related Differences in Processing Speed and their Consequences. Oxford: Oxford University Press.
Wilkinson, R. T., and Allison, S. (1989). Age and simple reaction time: decade differences for 5,324 subjects. J. Gerontol. 44, 29–35. doi: 10.1093/geronj/44.2.P29
Woodley, M. A., Madison, G., and Charlton, B. G. (2014). Possible dysgenic trends in simple visual reaction time performance in the Scottish Twenty-07 cohort: a reanalysis of Deary and Der (2005). Mankind Q. 55, 110–124.
Woodley, M. A., te Nijenhuis, J., and Murphy, R. (2013). Were the Victorians cleverer than us? The decline in general intelligence estimated from a meta-analysis of the slowing of simple reaction time. Intelligence 41, 843–850. doi: 10.1016/j.intell.2013.04.006
Keywords: secular trend, simple reaction time, methods variance, Galton, processing speed
Citation: Woodley of Menie MA, te Nijenhuis J and Murphy R (2015) The Victorians were still faster than us. Commentary: Factors influencing the latency of simple reaction time. Front. Hum. Neurosci. 9:452. doi: 10.3389/fnhum.2015.00452
Received: 03 May 2015; Accepted: 30 July 2015;
Published: 20 August 2015.
Edited by:
Guillaume A. Rousselet, University of Glasgow, UKReviewed by:
David L. Woods, University of California, Davis and Veterans Affairs Northern California Health Care System, USAStuart J. Ritchie, The University of Edinburgh, UK
Copyright © 2015 Woodley of Menie, te Nijenhuis and Murphy. This is an open-access article distributed under the terms of the Creative Commons Attribution License (CC BY). The use, distribution or reproduction in other forums is permitted, provided the original author(s) or licensor are credited and that the original publication in this journal is cited, in accordance with accepted academic practice. No use, distribution or reproduction is permitted which does not comply with these terms.
*Correspondence: Michael A. Woodley of Menie,bWljaGFlbC53b29kbGV5LW9mLW1lbmllQGhyei50dS1jaGVtbml0ei5kZQ==