 Dalin Yang
 Keum-Shik Hong
 So-Hyeon Yoo
 Chang-Soek Kim
- 1School of Mechanical Engineering, Pusan National University, Busan, South Korea
- 2Department of Cogno-Mechatronics Engineering, Pusan National University, Busan, South Korea
Mild cognitive impairment (MCI), a condition characterizing poor cognition, is associated with aging and depicts early symptoms of severe cognitive impairment, known as Alzheimer’s disease (AD). Meanwhile, early detection of MCI can prevent progression to AD. A great deal of research has been performed in the past decade on MCI detection. However, availability of biomarkers for MCI detection requires greater attention. In our study, we evaluated putative and reliable biomarkers for diagnosing MCI by performing different mental tasks (i.e., N-back task, Stroop task, and verbal fluency task) using functional near-infrared spectroscopy (fNIRS) signals on a group of 15 MCI patients and 9 healthy control (HC). The 15 digital biomarkers (i.e., five means, seven slopes, peak, skewness, and kurtosis) and two image biomarkers (t-map, correlation map) in the prefrontal cortex (PFC) (i.e., left PFC, middle PFC, and right PFC) between the MCI and HC groups were investigated by the statistical analysis, linear discriminant analysis (LDA), and convolutional neural network (CNN) individually. The results reveal that the statistical analysis using digital biomarkers (with a p-value < 0.05) could not distinguish the MCI patients from the HC over 60% accuracy. Therefore, the current statistical analysis needs to be improved to be used for diagnosing the MCI patients. The best accuracy with LDA was 76.67% with the N-back and Stroop tasks. However, the CNN classification results trained by image biomarkers showed a high accuracy. In particular, the CNN results trained via t-maps revealed the best accuracy (90.62%) with the N-back task, whereas the CNN result trained by the correlation maps was 85.58% with the N-back task. Also, the results illustrated that investigating the sub-regions (i.e., right, middle, left) of the PFC for detecting MCI would be better than examining the whole PFC. The t-map (or/and the correlation map) is conclusively recommended as an image biomarker for early detection of AD. The combination of CNN and image biomarkers can provide a reliable clinical tool for diagnosing MCI patients.
Introduction
Alzheimer’s disease (AD) is a degenerative brain disorder of unknown etiology, a common form of dementia, which begins in middle-aged or older adults (Ieracitano et al., 2018). AD results in progressive memory loss, thinking impairment, disorientation, changes in personality and mood (Niu et al., 2013). In the final stages of AD, people lose the ability to communicate or respond to their environment. They need assistance in all their activities of daily living, and they may even lose their ability to swallow. As reported via the Alzheimer’s Association, by 2050 one new case of AD is expected to develop every 33 s resulting in nearly 1 million new cases per year (Alzheimer’s Association, 2018). In addition, in 2017, more than 16 million family members and other unpaid caregivers, a contribution valued at more than $232 billion, were devoting toward the care of Alzheimer’s patients. Such findings highlight the requirement for solutions to prevent dementia-related costs from jeopardizing the health and financial security of the families of people with Alzheimer’s related diseases.
However, there is a relative mild condition of cognitive impairment before the onset of AD, known as mild cognitive impairment (MCI), a stage at which treatment can reduce the chance for developing to AD (Yeung et al., 2016b; Fang et al., 2018; Valenzuela et al., 2018). MCI patients are divided into two categories; amnestic and non-amnestic. In the case of amnestic MCI patients, the memory is affected primarily. For the case of non-amnestic MCI, the patients have difficulty with thought process such as planning and completing complex tasks such as balancing a checkbook or making a judgment in a risky situation (Marmarelis et al., 2017). There are various methods to diagnose an MCI patient. Primarily, the diagnosis in a clinic relies on the patient’s medical history and clinical rating scores, such as clinical dementia rate or Mini-Mental State Examination (MMSE) (Li R. et al., 2018). However, it is known that the MMSE performance is influenced by education and age, and the clinical evaluation and diagnosis through MMSE requires an experienced clinician (Nguyen et al., 2008). To cope with these issues, the biomedical examination methods using brain signals have been introduced, such as the transcranial Doppler ultrasonography (Keage et al., 2012), functional near-infrared spectroscopy (fNIRS) (Vermeij et al., 2017), functional magnetic resonance imaging (fMRI) (Khazaee et al., 2017; Katzorke et al., 2018), and positron emission tomography (Beishon et al., 2017). fNIRS is a relatively new optical imaging technology that uses light in the near infrared range to monitor the hemodynamic responses non-invasively: A neural firing increases blood flow in the neighboring capillary network, and fNIRS measures the concentration changes of the oxyhemoglobin (ΔHbO) and deoxyhemoglobin (ΔHbR) in the cerebral cortex (Boas et al., 2014; Hong et al., 2014; Zafar and Hong, 2018). fNIRS is known for its portability, non-invasiveness, low cost, and high temporal resolution (compared with fMRI) (Ferrari and Quaresima, 2012; Hong and Santosa, 2016; Pinti et al., 2018). Recently, the possibility of improving the spatial and temporal resolutions using a bundled-optodes configuration and the initial dip was demonstrated in the process of brain-computer-interfaces (Nguyen and Hong, 2016; Zafar and Hong, 2017; Hong and Zafar, 2018). Therefore, fNIRS has distinct advantages over other modalities (Ghafoor et al., 2017; Yap et al., 2017).
The difficulty in diagnosing the causes of diseases has a severe frustration on patients if they do not receive an appropriate care in a timely manner. Therefore, robust and sensitive biomarkers for a prompt monitoring of cognitive or biological changes between healthy elderly and MCI patients is required (Nestor et al., 2004). A number of studies have examined the feasibility of using fNIRS to diagnose MCI and other types of dementia using different biomarkers (Niu et al., 2013; Katzorke et al., 2017, 2018; Perpetuini et al., 2017; Vermeij et al., 2017; Yap et al., 2017; Halliday et al., 2018; Stuart et al., 2018). Appropriate biomarkers may provide a reliable diagnosis for patients with MCI before the onset of AD. Table 1 lists the existing biomarkers examined in the previous fNIRS studies.
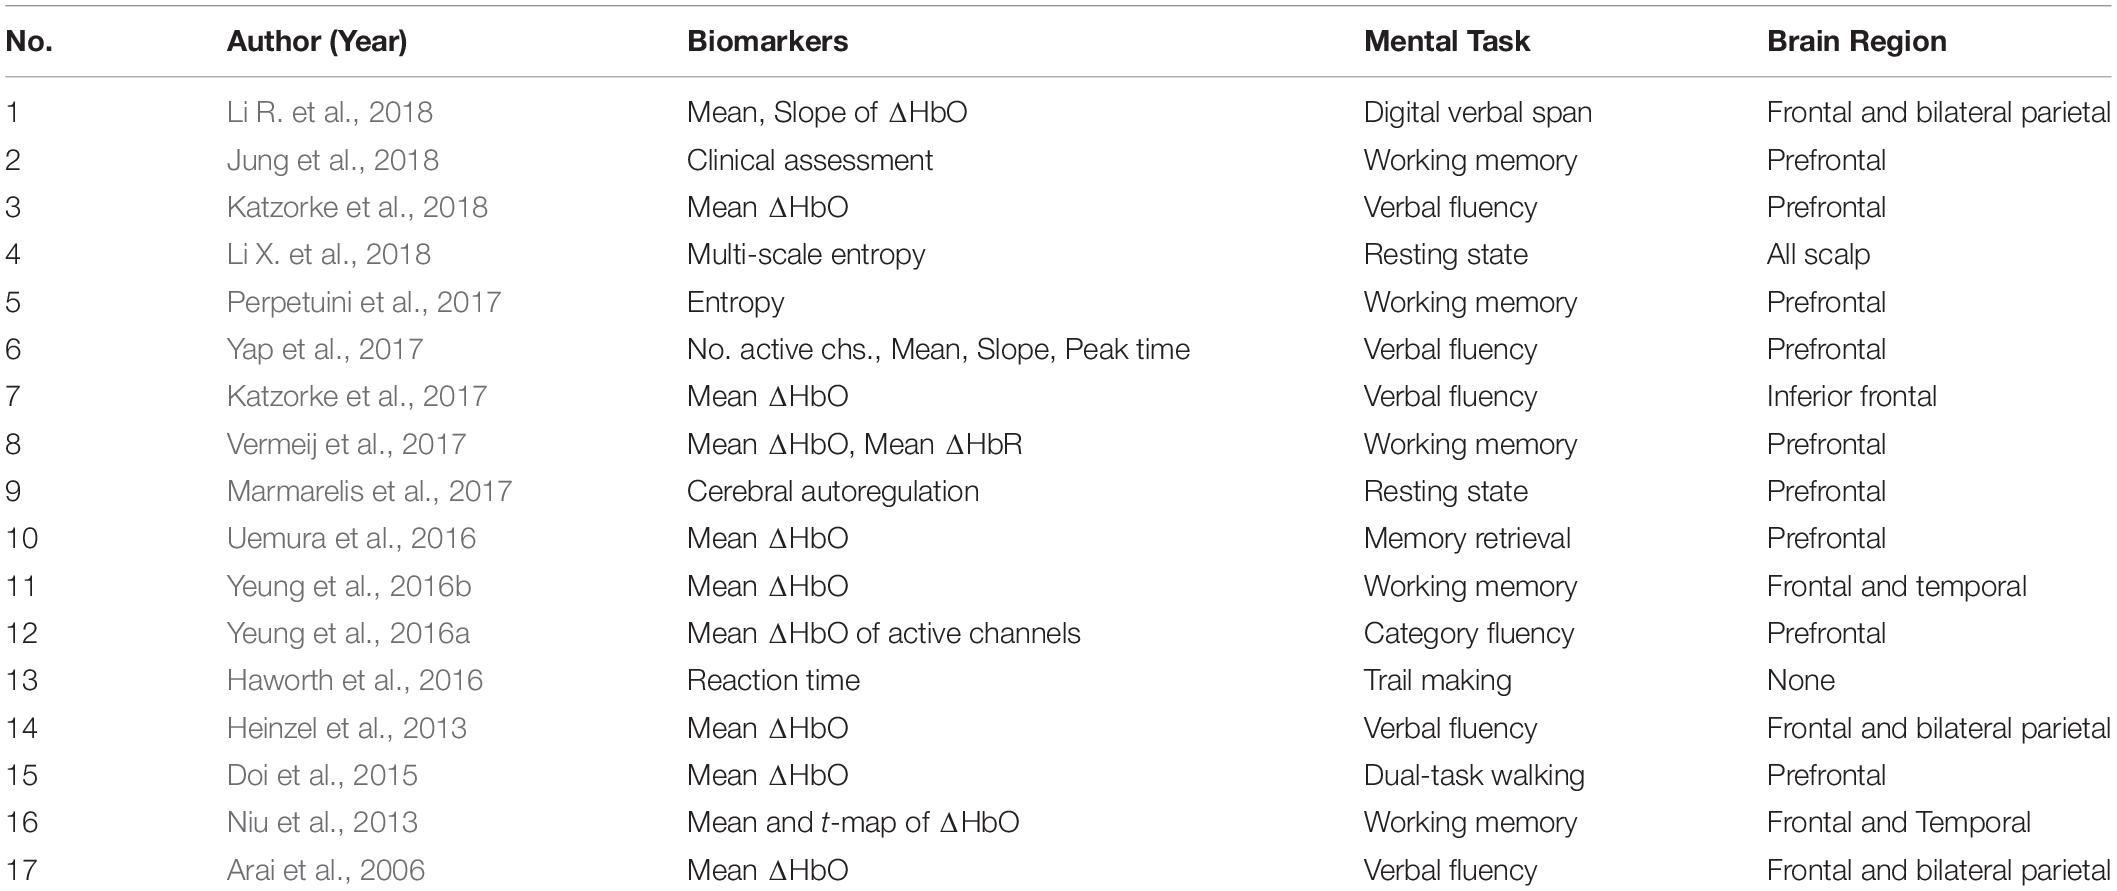
Table 1. List of fNIRS biomarkers, mental tasks, and brain regions used in various studies.
As shown in Table 1, there are a number of studies that have applied different mental tasks in various brain regions to assess meaningful biomarkers. Li R. et al. (2018) asked the subjects to perform a cognitive task (digit verbal span task) while brain signals were measured from the frontal and bilateral lobes. The results showed that the mean value of ΔHbO (i.e., MHbO) and the slope of ΔHbO (i.e., SHbO) were higher in healthy control (HC) than the MCI group during the time window of 3–12 s. Katzorke et al. (2018) also evaluated the biomarker of MHbO and the mean value of ΔHbR (i.e., MHbR) when the subjects performed a verbal fluency task (VFT). A slight decrease in the hemodynamic response was observed in the inferior frontotemporal cortex in the MCI group. Some of the studies have employed a quantitative analysis of multiscale entropy: The results demonstrated that the resting-state brain signal complexity was decreased in the MCI group (Perpetuini et al., 2017; Li X. et al., 2018). Yap et al. (2017) employed biomarkers such as active channels, MHbO, time response of ΔHbO to reach the peak, and SHbO for detecting a patient with MCI or AD. The results illustrated that MCI exhibited a greater mean activation (than AD and HC) for both the right and left prefrontal cortex (PFC) when the subjects performed VFT (see Figure 5B). The results using the time to reach the peak and SHbO presented a meaningful difference between the left and right PFC (see Figures 5C,D). The biomarker of using activated channels did not show a significant difference among various brain regions. The authors also claimed that the difference in the hemoglobin responses in the left and right PFC was caused by neural compensation, and that the capacity for such neural compensation was inversely proportional to the severity of neurodegeneration (Price and Friston, 2002). Figure 1 summarizes the existing biomarkers, categories of mental tasks, and brain regions that have been used in the fNIRS studies for diagnosing the patients with MCI.
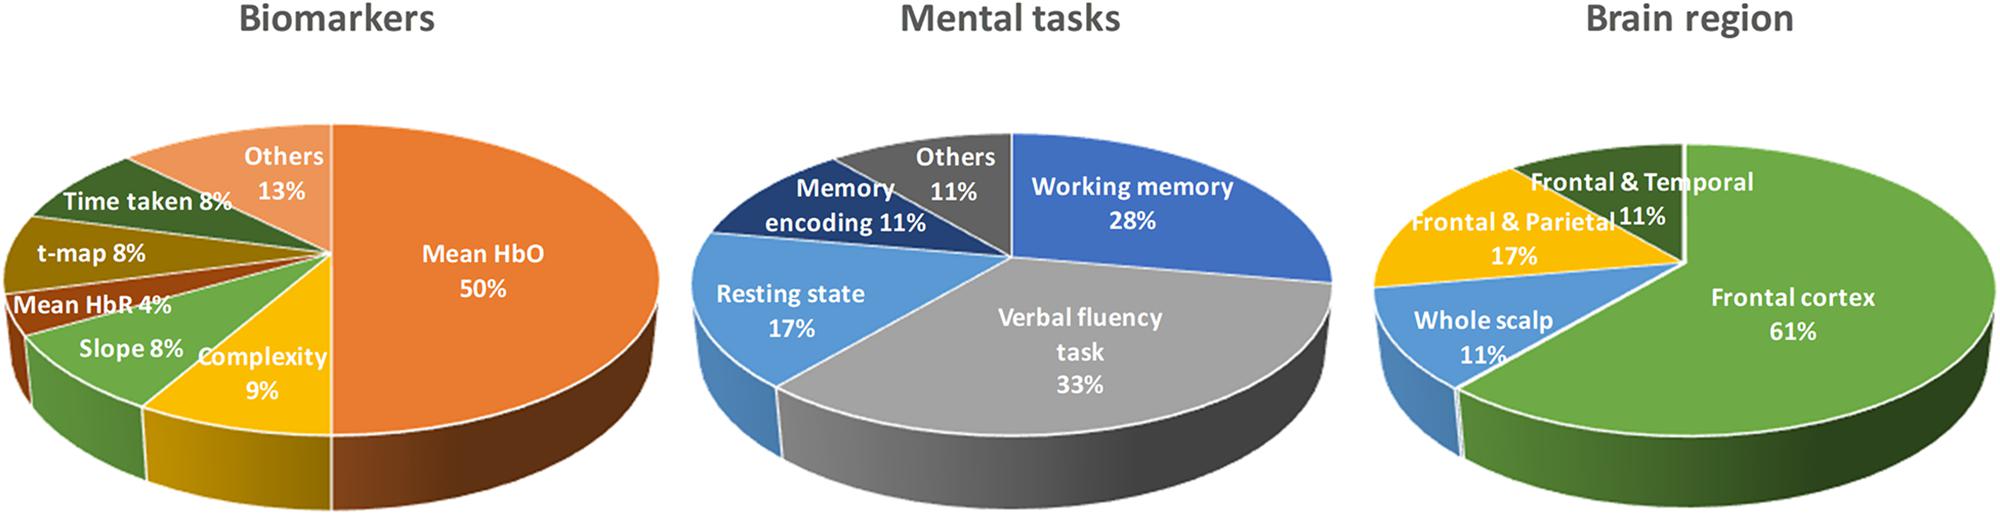
Figure 1. Summary of widely used biomarkers, categories of mental tasks, and brain regions used in various fNIRS studies for diagnosing of MCI patients (the total number of fNIRS articles was 17).
Even there exist a number of biomarkers in the fNIRS area as in Table 1. Most of the studies prefer to conduct the statistical analysis for seeking the group difference between the MCI and HC. However, the high standard deviations (SD) illustrate that the method of using statistical analysis is not useful in establishing a confident diagnosis of individual patients for clinical purposes (Labaer, 2005). To the best of authors’ knowledge, there is no result on the evaluation the existing biomarkers, brain regions, and time durations. Cotelli et al. (2008) and Park and Reuter-Lorenz (2009) suggested the right PFC as one of the functional compensatory regions in cognitively impaired individuals. Additionally, the selection of a proper biomarker will directly influence the results on classification and diagnosis of the disease. Therefore, the evaluation of the digital biomarkers, brain regions, and time intervals in obtaining biomarkers is necessary, and it would become a reference for the future research.
In this study, we investigate 15 digital biomarkers and 2 image biomarkers generated from the fNIRS hemodynamic responses for 15 MCI patients and 9 HC. The digital biomarkers take the form of mean, slope, peak, skewness, and kurtosis for a certain interval of time, and the two image biomarkers include t-map and correlation map. Finally, a conclusive result suggesting how to combine a biomarker and a classification method will be demonstrated, which turns out to be the combination of t-map and CNN classification. In the study, the used headset in Figure 2 covers the entire PFC (i.e., left PFC, middle PFC, and right PFC) making 204 channels. However, only 48 channels with sufficient emitter-detector distances (3 cm) are utilized. The performed three mental tasks include the N-back task, Stroop task, and VFT.
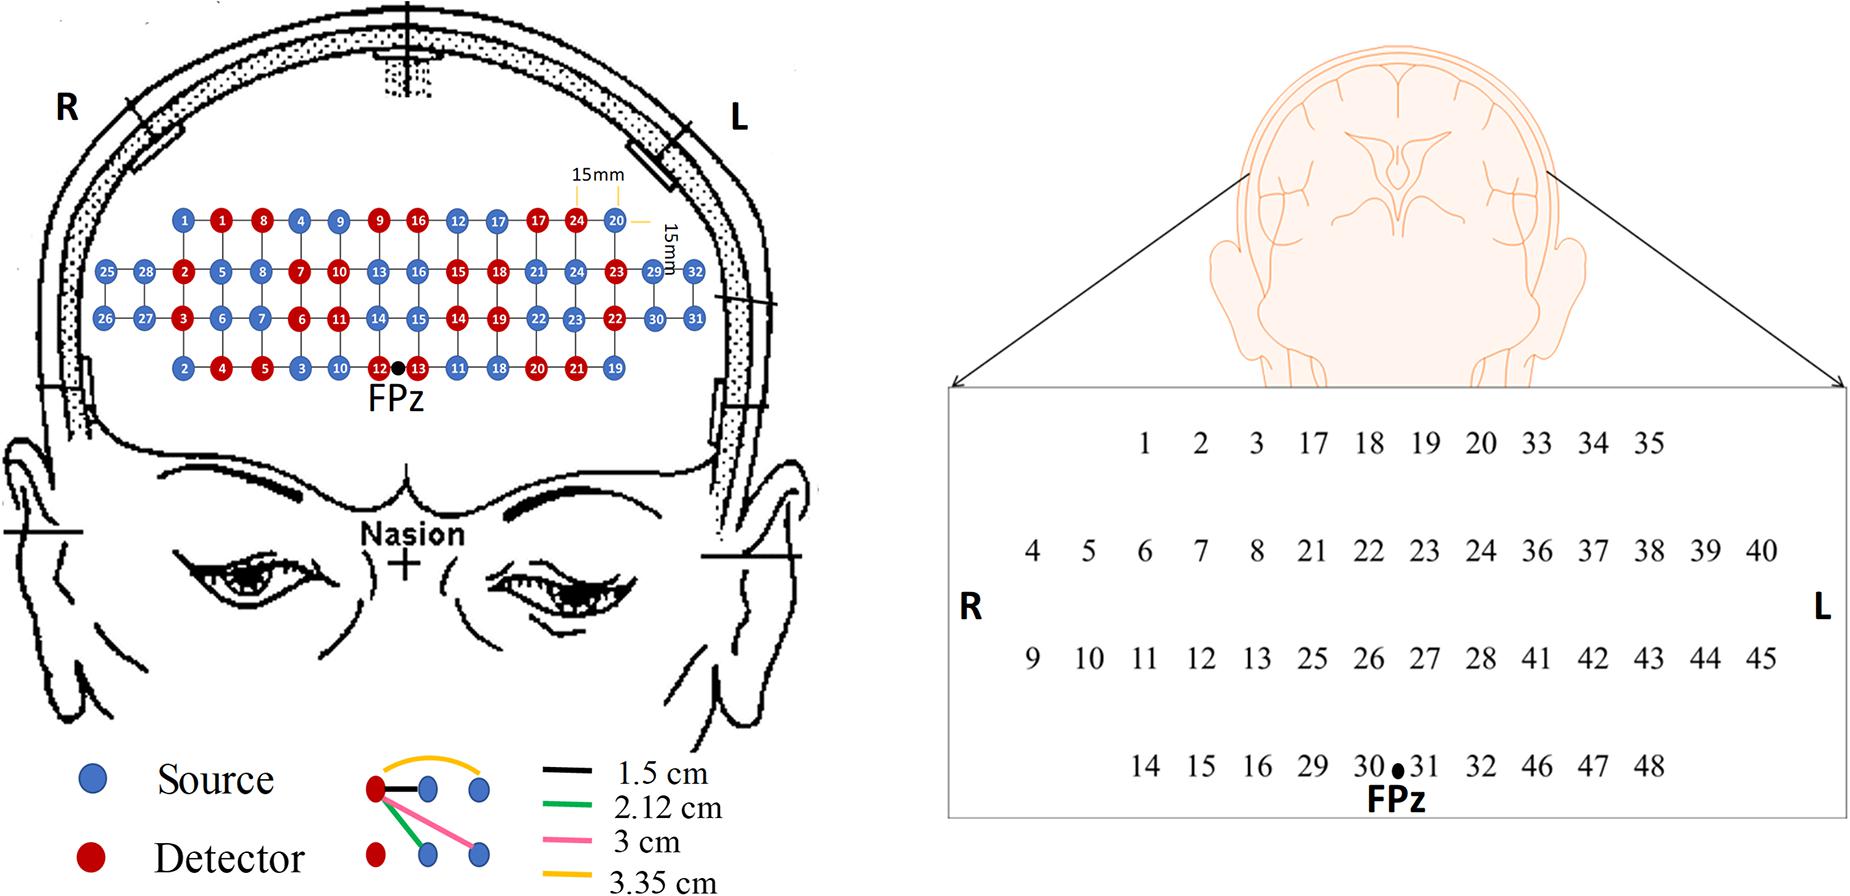
Figure 2. The configuration of the headset employed during the experiment, which consists of 24 emitters and 32 detectors (left) and the channels used in this paper (right).
Materials and Methods
Participants
Twenty-four volunteers, who were right-handed and were able to communicate in Korean, were chosen for this study, comprising of fifteen patients with MCI (1 male and 14 females) and nine HC (2 males and 7 females) of similar age and educational background. MCI patients were recruited from the Pusan National University Hospital, Busan, Republic of Korea. The HC were selected from the local community on a voluntary basis. In addition, the mental state of each subject was examined using a Korean-Mini-Mental State Examination (K-MMSE), which is a 30-points questionnaire providing a quantitative measure of cognitive impairment (Han et al., 2008). The demographic information for all the volunteers including age (mean ± SD), gender, education background (mean ± SD), K-MMSE scores (mean ± SD), and statistical information are summarized in Table 2. This experiment was conducted in accordance with the latest Declaration of Helsinki upon the approval of the Pusan National University Institutional Review Board (General Assembly of the World Medical Association, 2014). All volunteers were given a detailed description of the experimental procedure prior to the beginning of the experiment, and they provided written consent agreeing to the experiments.
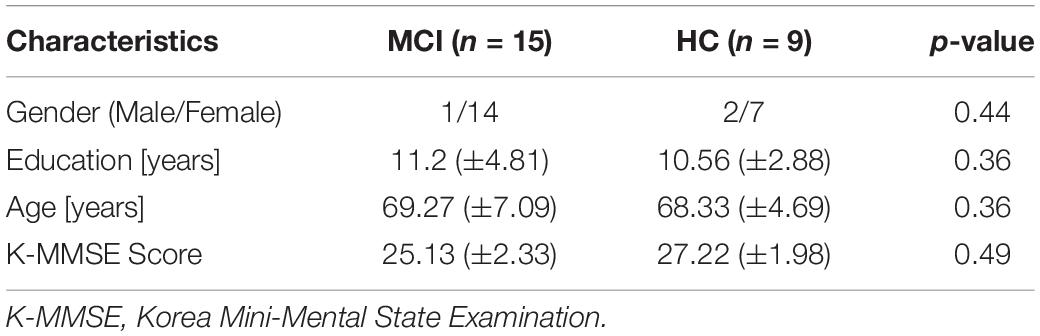
Table 2. The demographic information of all participants.
Channel Configuration
In this study, a near-infrared multi-channel continuous wave system (NIRSIT, OBELAB Inc., Rep. of Korea) with 8.138 Hz sampling rate was employed to measure the brain signals via 24 emitters and 32 detectors. The device has an active detection sensor with a total capacity of 204 channels out of which 48 channels were used in this study, which covered the entire PFC area. Channel 1 to channel 16 were placed in the right PFC, channel 17 to channel 32 in the middle PFC, and channel 33 to channel 48 in the left PFC. Figure 2 shows the locations of emitters and detectors with a reference point FPz (left) and the 48 channels in this study (right). The wavelengths used for detecting two chromophores (HbO, HbR) were 780 and 850 nm, respectively. As reported in Strangman et al. (2013), fNIRS is more sensitive to the gray matter and even a large source detector separation (up to ∼4.5 cm) can be used. Considering the spatial resolution and the differential path length factors into account, the pairs having the source detector distance of 3 cm were used.
Experimental Paradigm
Participants seated on a comfortable chair and were instructed to avoid movement as much as possible. First, all subjects took a 10 min resting state. Subjects in each group participated in three sessions, which consisted of the N-back task, Stroop task, and semantic VFT. Each task took 60 s and was performed three times with a 30 s rest between tasks. Figure 3 illustrates the experimental paradigm for all three tasks. The N-back task evaluates the working memory (Kane et al., 2007) and, in our study, a two-back task was performed and one-digit numbers between 1–9 were displayed on the monitor. The subjects were asked to press the keyboard when the current number on the display matched the second-last number displayed before. The Stroop test is a measurement of widely used executive function and is known as a measurement of mental control and response flexibility. The Stroop task requires new reactions while suppressing the dominant response, such as letter reading conditions and color reading conditions, etc. In this study, the Korean-Color Word Stroop test (K-CWST) was used. The subjects were requested to read the color of letters when letters were written in red, blue, yellow, and black colors within a limited time (Byeon et al., 2017). The semantic VFT is a task to generate as many words (related to the given semantic category) as possible within a limited time (Whiteside et al., 2016). The task measures how much information can be retrieved from the categorization and memory repository of text for 1 min.
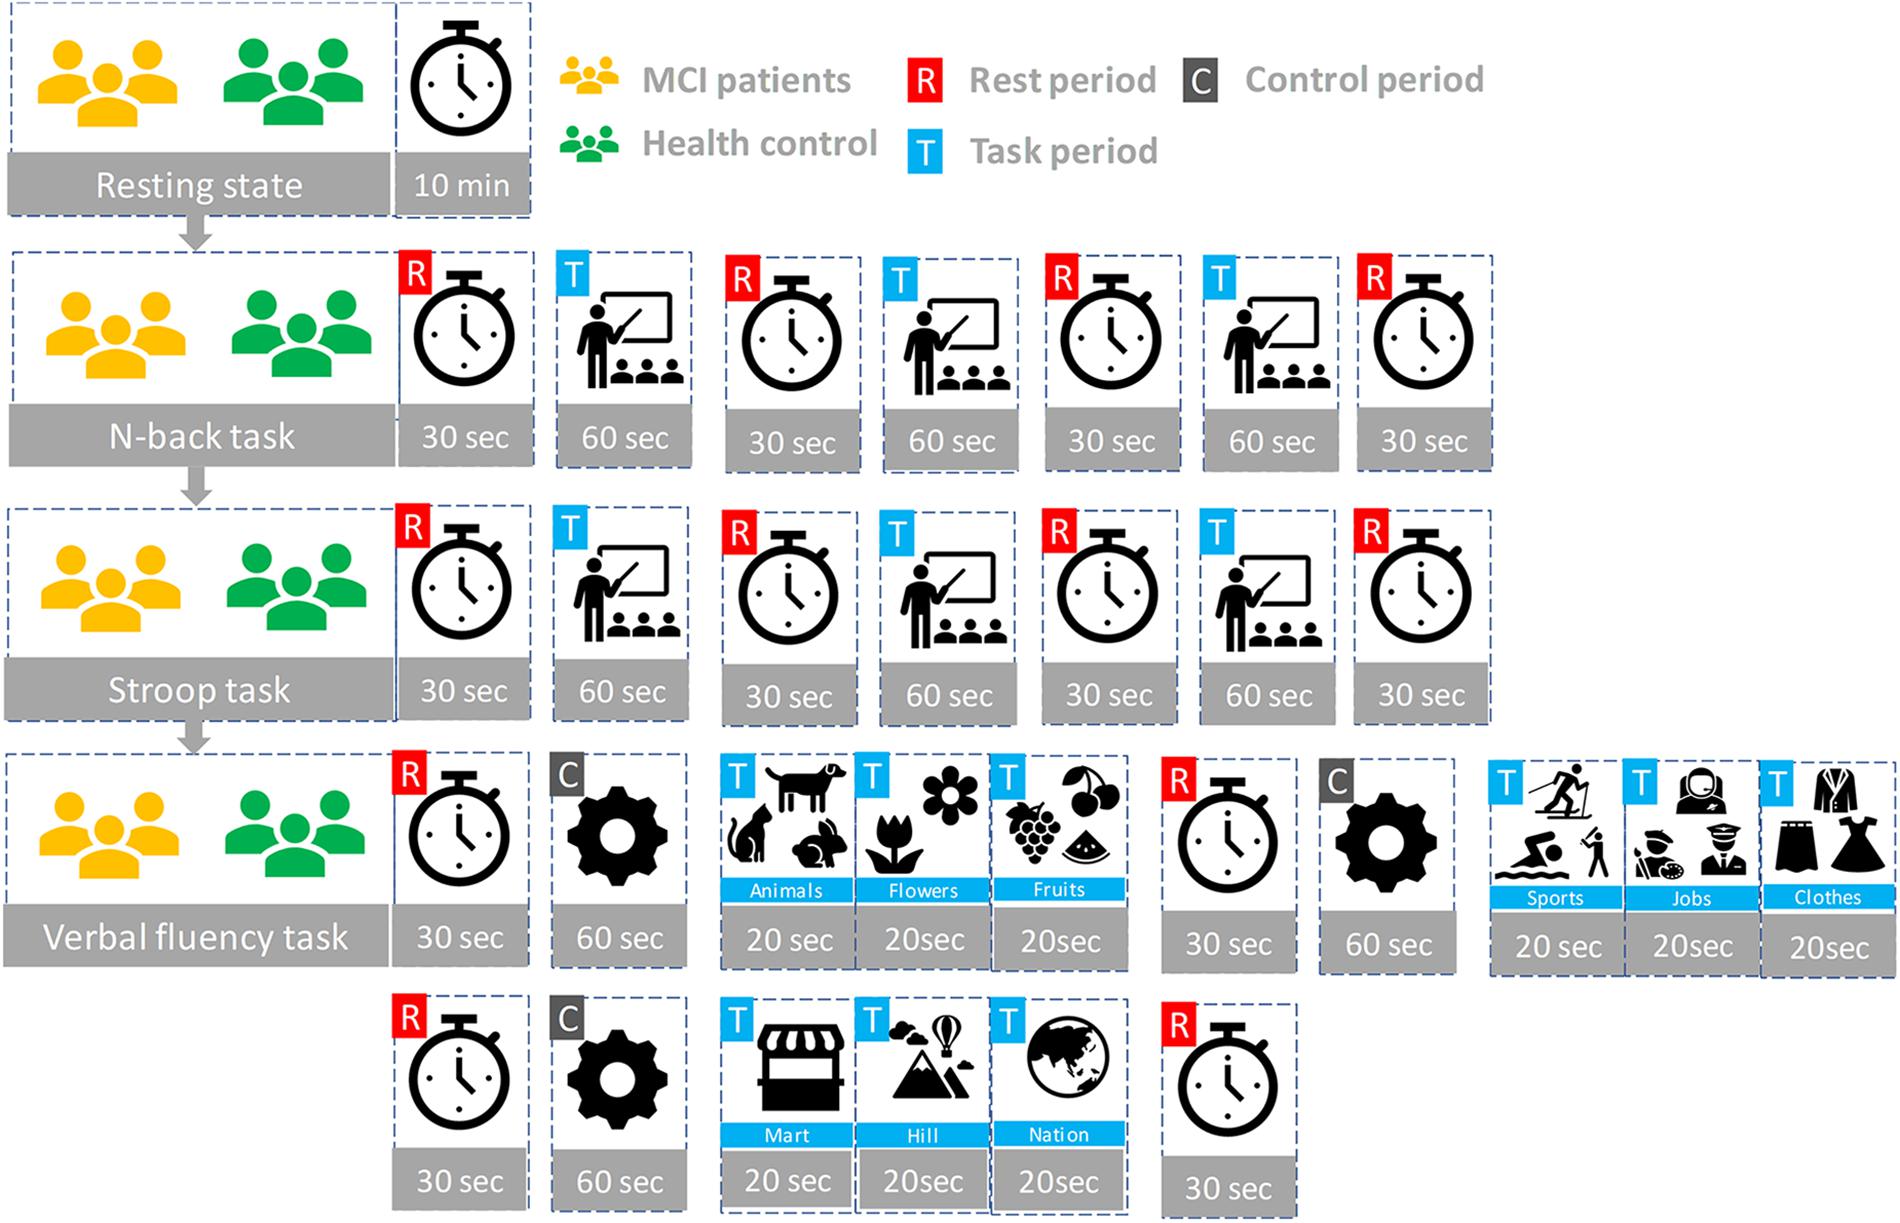
Figure 3. The experiment paradigms: Three tasks (N-back, Stroop, and verbal fluency) having three trials.
Data Pre-processing
The fNIRS data were pre-processed and analyzed for each subject using MATLABTM. The optical intensity signals were first transformed into the time series of HbO and HbR concentration changes using the modified Beer-Lambert law (MBLL) (Sassaroli and Fantini, 2004). The data were digitally bandpass-filtered to remove the physiological noises (respiration, cardiac activity, and low-frequency drift signals): For this, two fourth-order Butterworth filters (low and high-pass) with cutoff frequencies of 0.1 and 0.001 Hz, respectively, were used to filter off the noises from the converted hemodynamic signals (Khan and Hong, 2015, 2017). In this study, we analyzed both ΔHbO and ΔHbR signals for the evaluation of biomarkers, even though HbO signals are robust and more sensitive.
The previous comparison study between MCI and HC investigated by Li R. et al. (2018) indicated that utilizing the region of interest (ROI) strategy could provide the satisfying results with the averaged means and slope changes of ΔHbO. In this study, we implemented two strategies to identify the ROI; (i) t-value analysis and (ii) visual inspection (Privitera and Stark, 2000). In the first case, the active channels (i.e., t > 1.6469 and p-value < 0.05) were selected by using the MATLABTM function (robustfit), which becomes the ROI. In the second case, all the HbO signals were inspected visually, and those signals having the desired pattern were selected manually (i.e., visual inspection).
Feature Extraction
Diverse biomarkers were evaluated, as a possible candidate, for an early identification of MCI. The considered digital biomarkers include the MHbO, SHbO, MHbR, SHbR, time to peak in the hemodynamic response, skewness, and kurtosis. In addition. we considered two image biomarkers: The t-map of all the channels and the correlation map of all the channels.
Digital Biomarkers
The HbO mean value change between the rest and task periods is represented as follows.
where t1 and t2 are the starting and ending time in the selected time window, t = −10 indicates 10 s before the onset time, and t = 0 is the onset time of the task execution. The mean change of HbR concentration is computed as follows.
We employed the polyfit function in MATLABTM to calculate the slope of HbO (i.e., SHbO) and the slope of HbR change (i.e., SHbR). The location of the peak, skewness, and kurtosis were conducted by using MATLABTM functions of findpeaks, skewness, and kurtosis, respectively.
Activation Map (t-Map)
To quantify cortical hemodynamic activities during the mental tasks, the general linear model (GLM, a model-based statistical analysis tool) was utilized (Pinti et al., 2017; Salis-Perales and Barajas-Ramirz, 2017). In GLM, the desired hemodynamic response function (dHRF) is used to serve as a reference to estimate the changes in HbO signals (Yennu et al., 2016). The formula is as follows:
where z(t) represents the temporal profile of the measured ΔHbO or ΔHbR, β is the estimated amplitude of ΔHbO/ΔHbR, and ε represents the residual owing to the difference between the measured signals and the predicted model. f(t) is the stimulation-specific predicated response, which is expected to match the temporal profiles of the measured hemodynamic signal (i.e., dHRF); h(t) represent the canonical hemodynamic response function, and s(t) is the stimulation-specific boxcar function for a given task. Thus, after fitting equation (3), a statistical t-value representing a statistical significance of the brain activation with respect to the baseline at each respective channel was obtained. Moreover, the t-values were derived from robustfit for individual channels and were used to generate the t-map for a topographic image (Liu and Hong, 2017).
Channel-by-Channel Correlation Map
Comparing to fMRI, fNIRS has a significant advantage in temporal resolution. This advantage could provide convenience for investigating the functional connectivity of the prefrontal lobe by exploiting the temporal correlations channel by channel (Tak and Ye, 2014). The correlation map was calculated by using the MATLABTM correlation function (corr).
Classification
In this study, the digital biomarkers were classified using the linear discriminant analysis (LDA) (Naseer et al., 2016) available as classify function in MATLABTM. The tenfold cross validation method was used to estimate the classification performance of the predictive LDA model. The sample size in analyzing each digital biomarker becomes the number of subjects × the number of trials × the number channels in the ROI. The convolutional neural network (CNN) was utilized to conduct the classification of image biomarkers. CNN is highly capable of learning appropriate features automatically from the input data by optimizing the weight parameters in individual layer by using forward and backward propagation to minimize classification errors (Ding et al., 2017; Hamadache and Lee, 2017; Kim et al., 2017; Moon et al., 2018; Trakoolwilaiwan et al., 2019). The networks in this paper consist of four layers, including two convolutional layers and two fully connected layers. In the convolutional layers, a convolutional filter whose width is equal to the dimension of the input, and the kernel size of h is convolved with the input data, where the output of the i’th filter is represented as follows.
where w is the weights of the matrix and x[i:j] is the submatrix of the input from row i to j. Then the output of the first convolutional layer f (output) is converted by an activation function ReLU(x) to build the feature map. To enhance the performance, additional subsampling operation, max-pooling, and dropout (avoiding overfitting) are employed in this subsampling layer. To obtain an appropriate predictive model, the hyper-parameters such as the learning rate, batch size, and the number of epochs should be considered. In our study, the size of input data was 48 × 48. To maintain the original feature completely, we set up the batch size by 4. The grid search (Ou et al., 2019) and Adam optimization algorithm (β1 = 0.9, β2 = 0.1, and ε = 10–8; Tang et al., 2019) were utilized to choose the learning rate and the parameters in gradient descent optimization.
Results
Comparison of Hemodynamic Responses
Figure 4 shows the hemodynamic responses of ΔHbO from three brain regions (i.e., right, middle, and left PFC) of MCI patients and HC for three mental tasks (i.e., N-back task, Stroop task, and VFT). The purpose behind this strategy is to observe any visual differences between the MCI patients and HC. The figures plot the average HbOs of individual groups. MCI Patients are denoted by red color, whereas the corresponding SDs are shown with red shadows. HC are marked with blue color with its respective shadow in blue showing the SD. In the left brain region, the averaged concentration change of HbO for HC group is higher than that of MCI group in all three mental tasks. In addition, HC shows an earlier increase than MCI patients. But the middle and right PFCs do not show such a significant difference between two groups. The plots reveal that the brain regions have unique patterns of ΔHbO fluctuations. However, the averaged hemodynamic responses cannot tell the existence of improvement in cognition for the MCI patients, since their SDs were too large. Thus, the examination of the hemodynamic responses of ΔHbO is not sufficient to distinguish an individual from MCI or HC group. This leads us to the second technique, in which we will evaluate the digital biomarkers at using appropriate time intervals for statistical analysis.
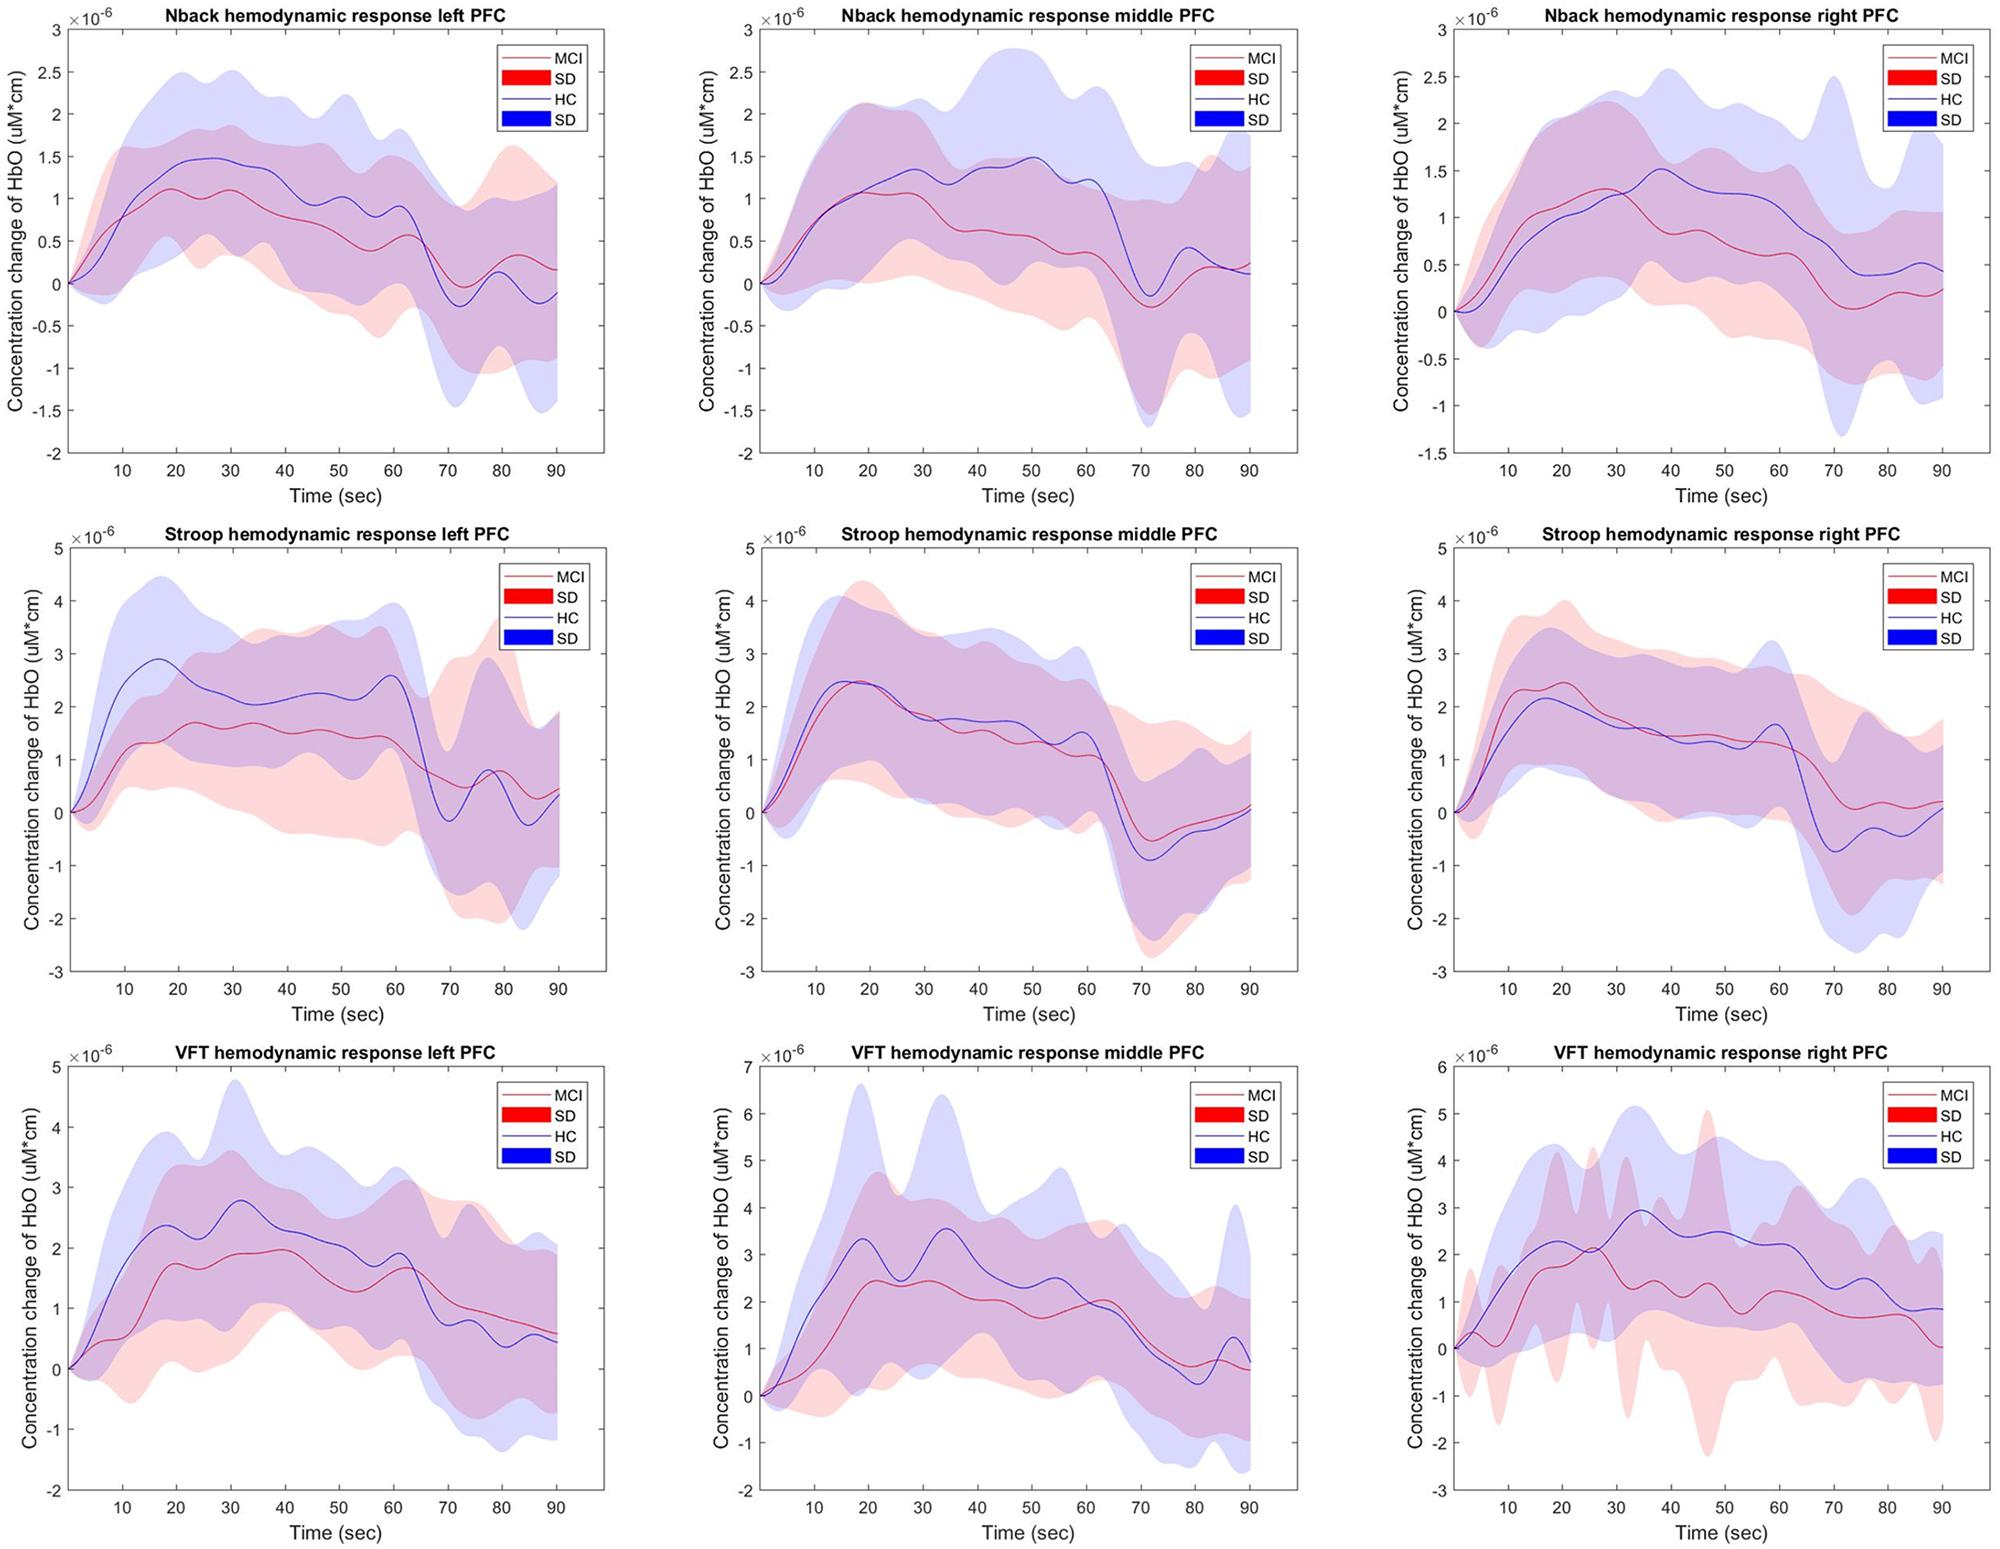
Figure 4. The average HbOs in three brain regions (left, middle, and right PFCs) of MCI patients and HC after performing three mental tasks.
Statistical Analysis of Digital Biomarkers
To evaluate the digital biomarkers such as MHbO/MHbR, SHbO/SHbR, peak location, skewness, and kurtosis for the hemodynamic responses, we divided the PFC into three areas (i.e., left, middle and right PFC) and applied different time intervals for three mental tasks (i.e., N-back, Stroop and VFT), respectively. The statistical values of all the biomarkers obtained from the ROI channels (t > 1.6469) for three mental tasks are shown in Tables 3–5. Tables 6–8 present the statistical information of the biomarkers obtained from those channels selected by visual inspection. In this study, the task duration was set to 60 s. This is to see where the MCI patients can focus on the verbal fluency task for a somewhat long time period of time. Also, for comparison purposes, the task durations for N-back and Stroop tasks were to 60 s as well. The reason, why we considered the time period between 5 and 65 s, was due to the time delay (3–5 s) of the hemodynamic response (Naseer and Hong, 2015). The time interval of 5–25 s was selected since the initial peak time for hemodynamic response is nearly located in the first 20 s period. The slope features (i.e., SHbO/SHbR) were considered from three intervals of the hemodynamic response: First, the initial increasing interval of ΔHbO (i.e., from 5 to 15 s), the plateau period of ΔHbO during the task (i.e., from 20 to 60 s), and the final decreasing interval of ΔHbO (i.e., from 60 to 70 s). We expect that the MCI patients would have a light decline of ΔHbO during the second interval while performing the mental tasks if they cannot focus on the tasks, as seen in Figure 4. The time to peak (i.e., from 0 to the peak time) is to see when the peak value of the hemodynamic response occurs owing to the provided stimulation. Lastly, two biomarkers, skewness (from 5 to 65 s) and kurtosis (from 5 to 65 s) are to examine whether the overall profile of the hemodynamic responses of a MCI patient is different from that of HC. The entire biomarkers are summarized as follows.
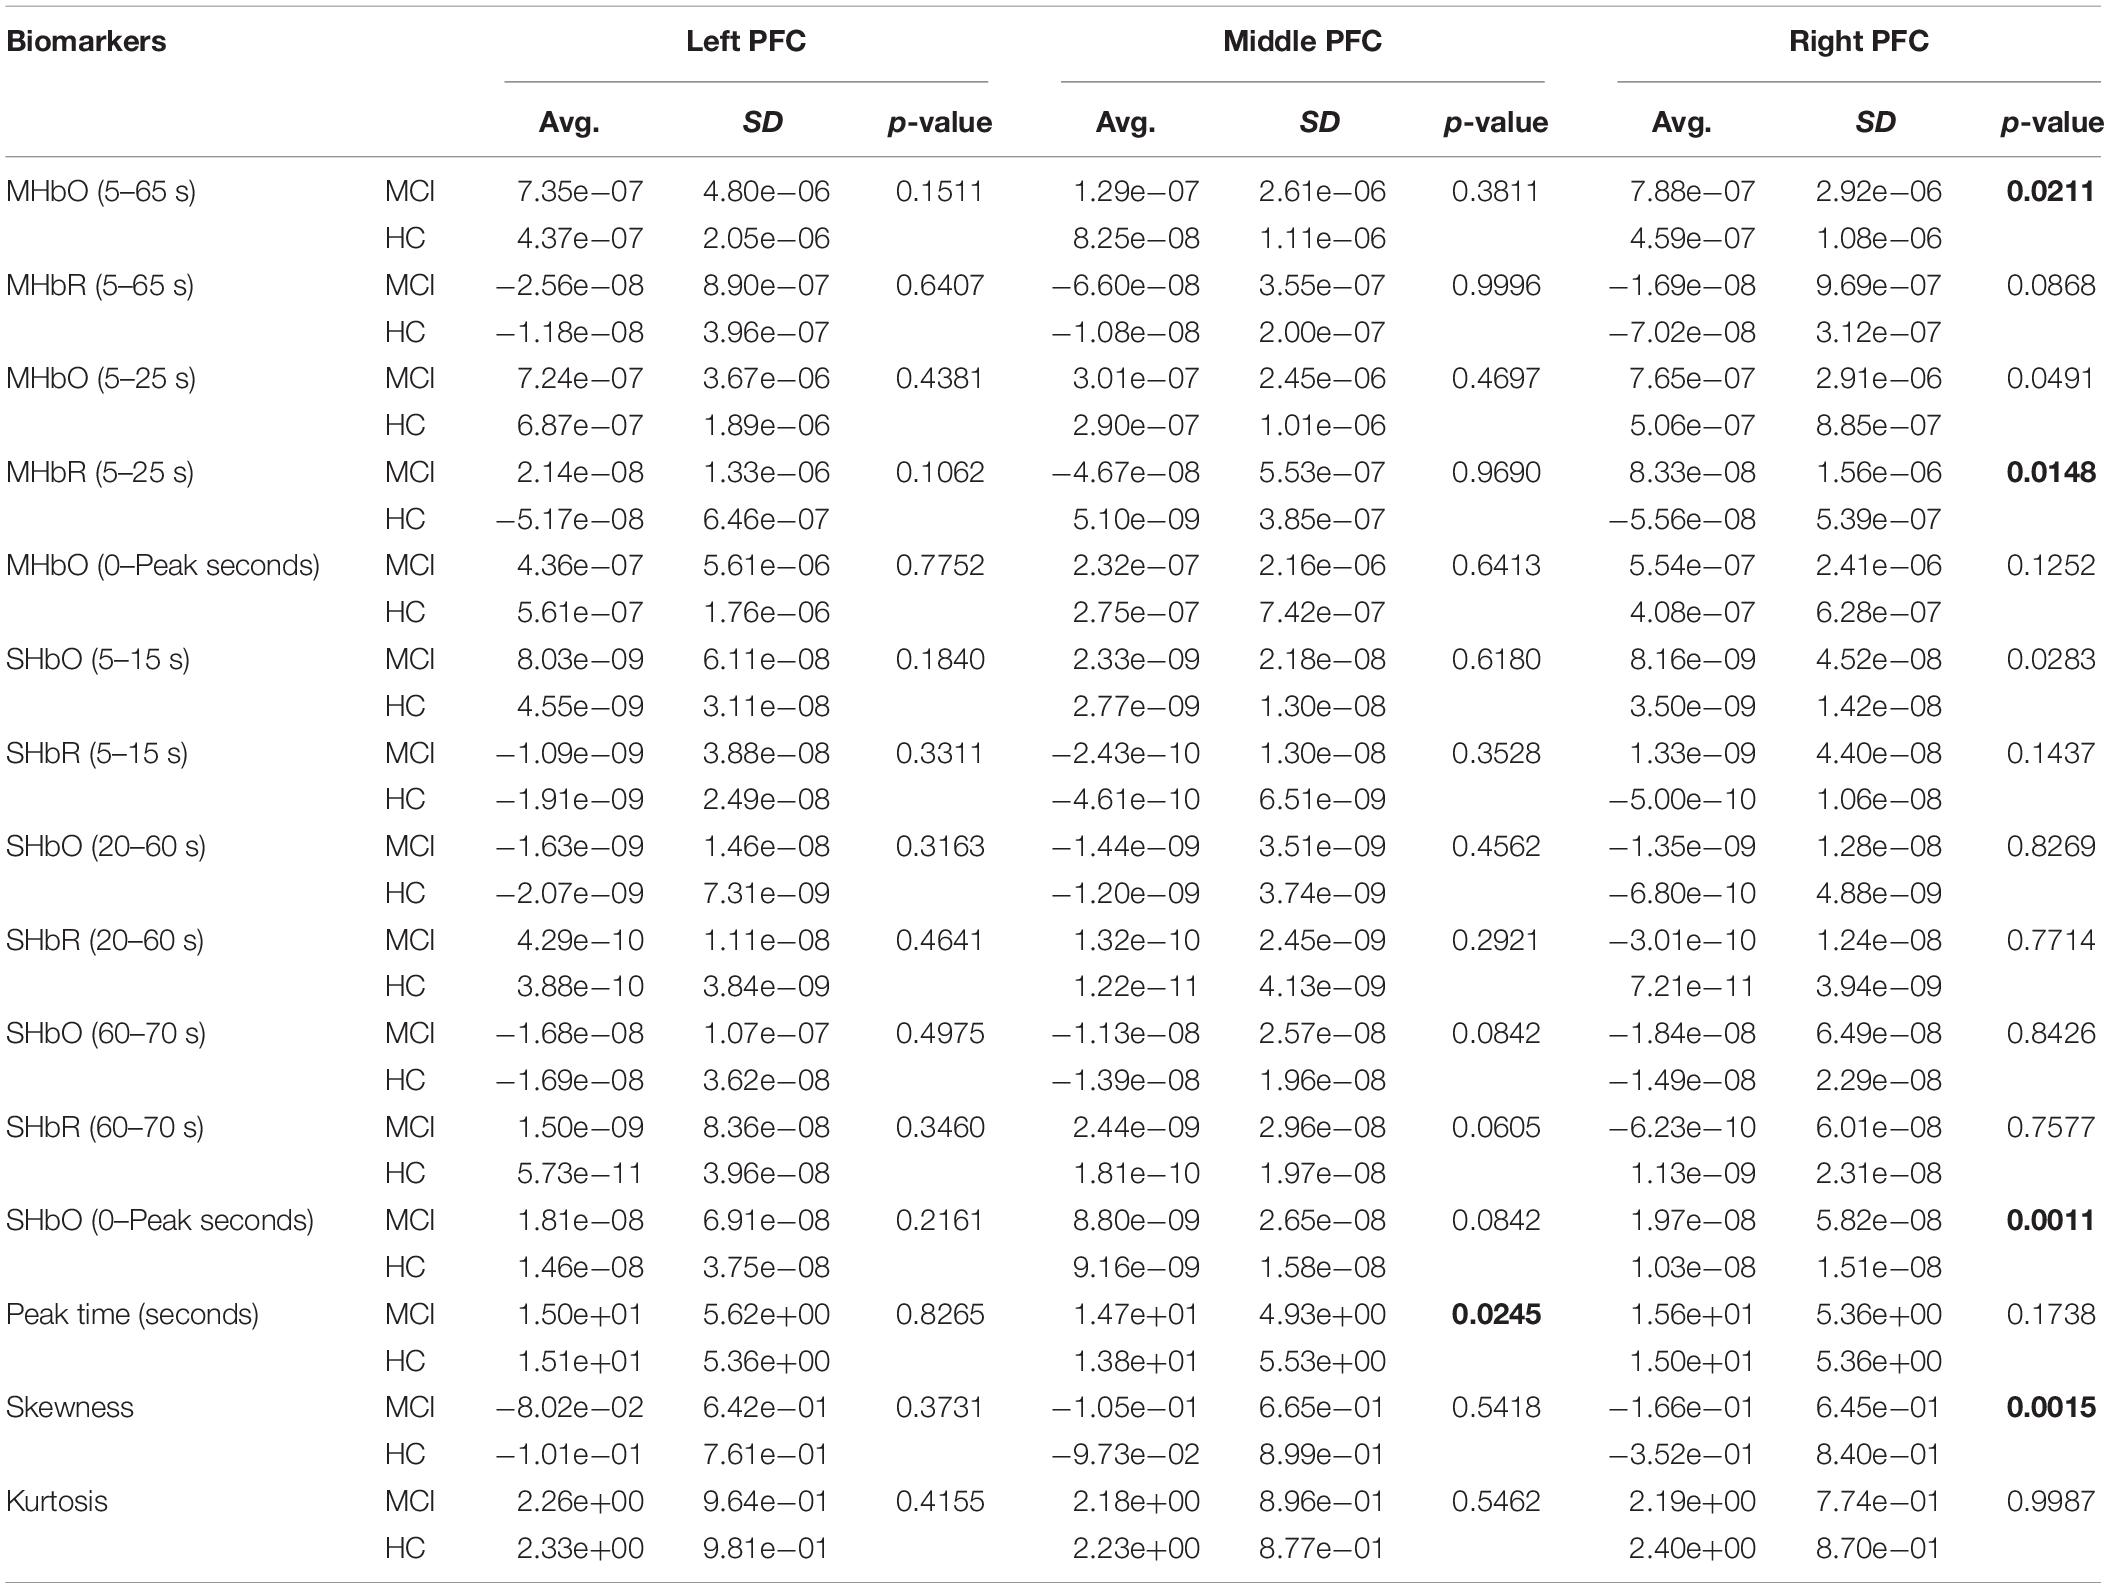
Table 3. Statistical data of N-back task (based upon ROI channels).
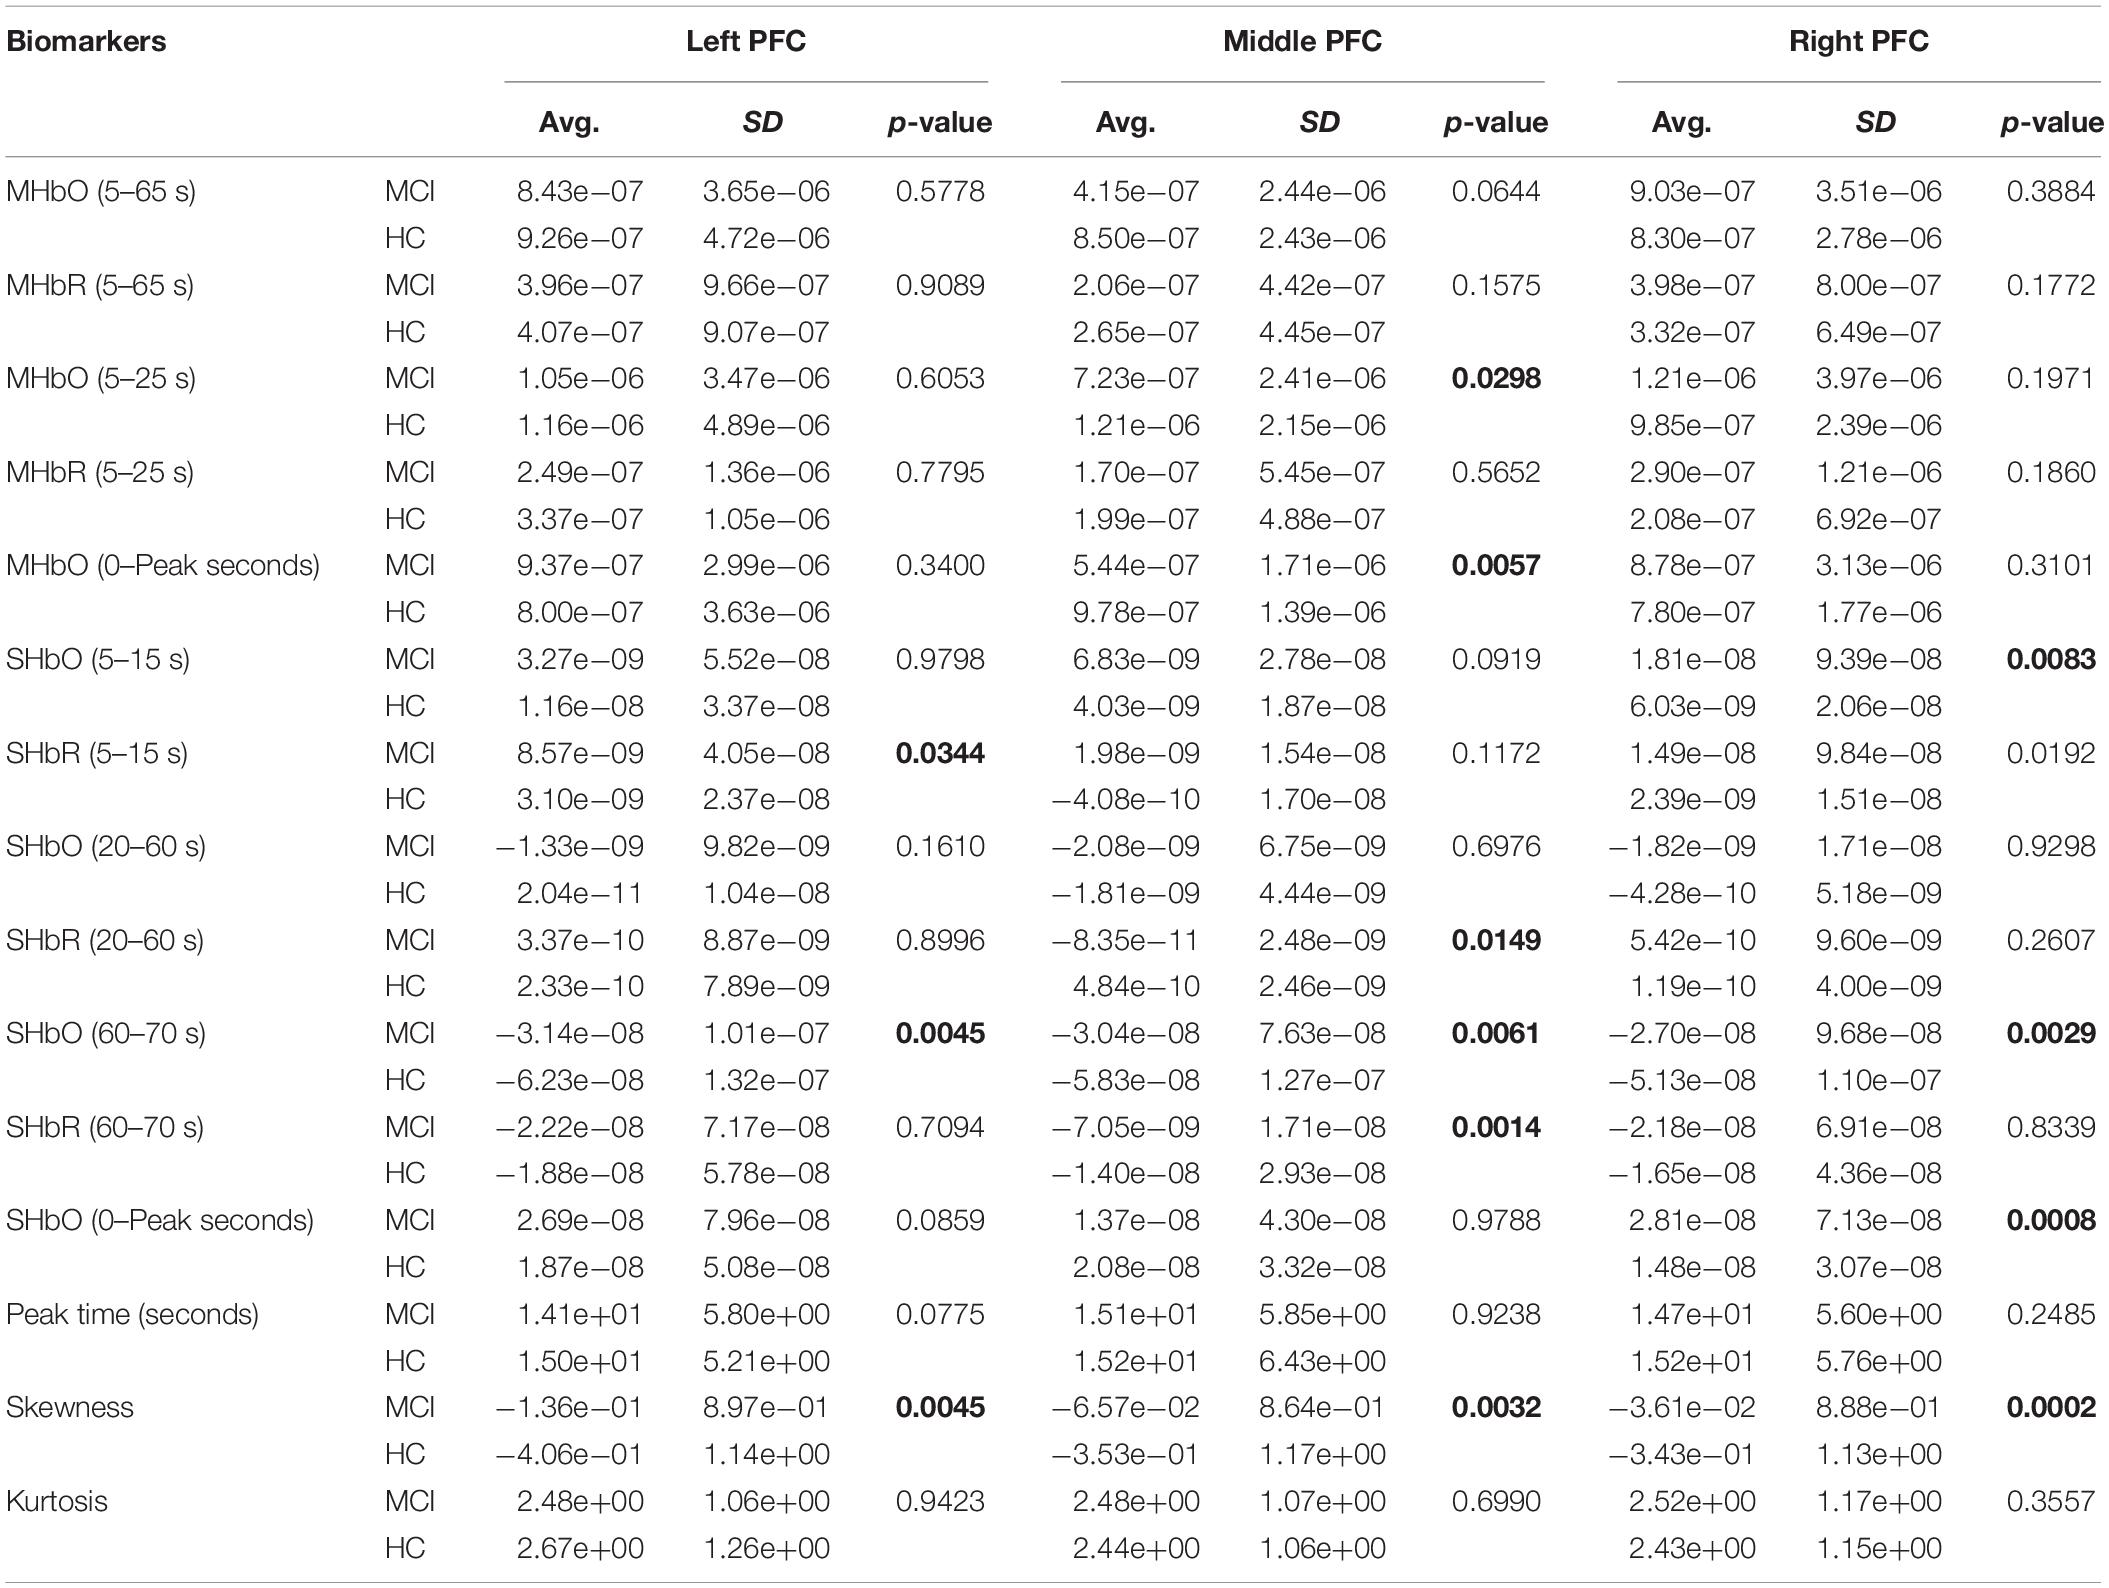
Table 4. Statistical data of Stroop task (based upon ROI channels).
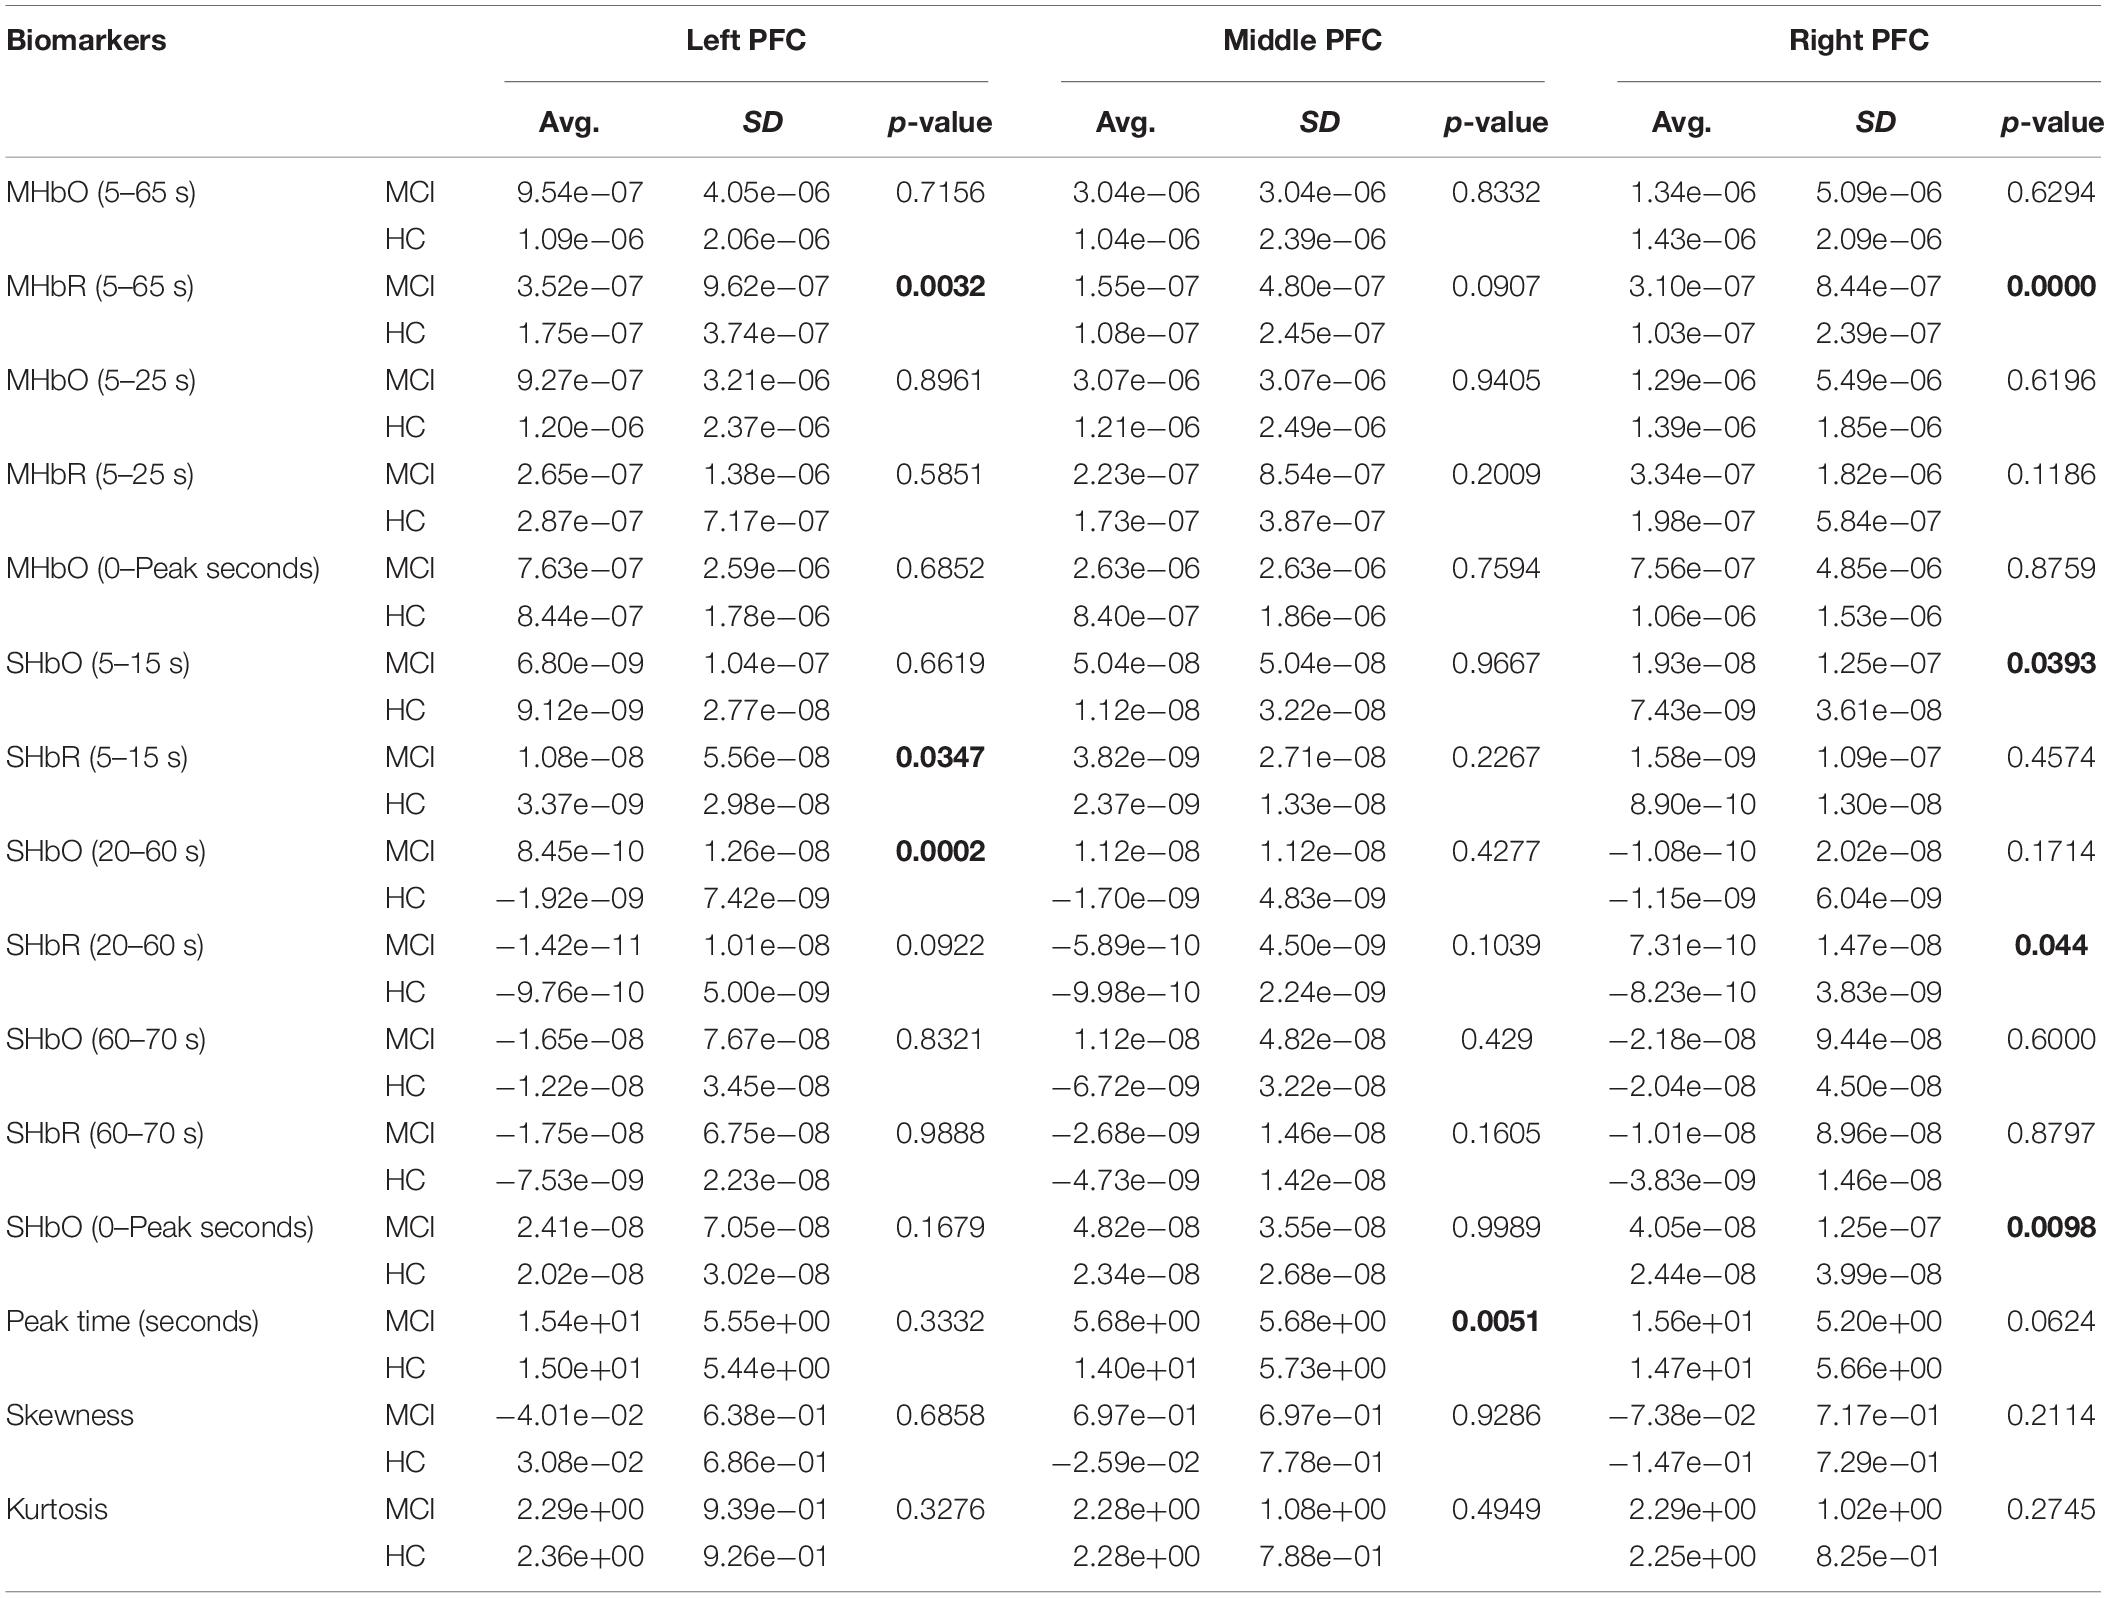
Table 5. Statistical data of VFT (based upon ROI channels).
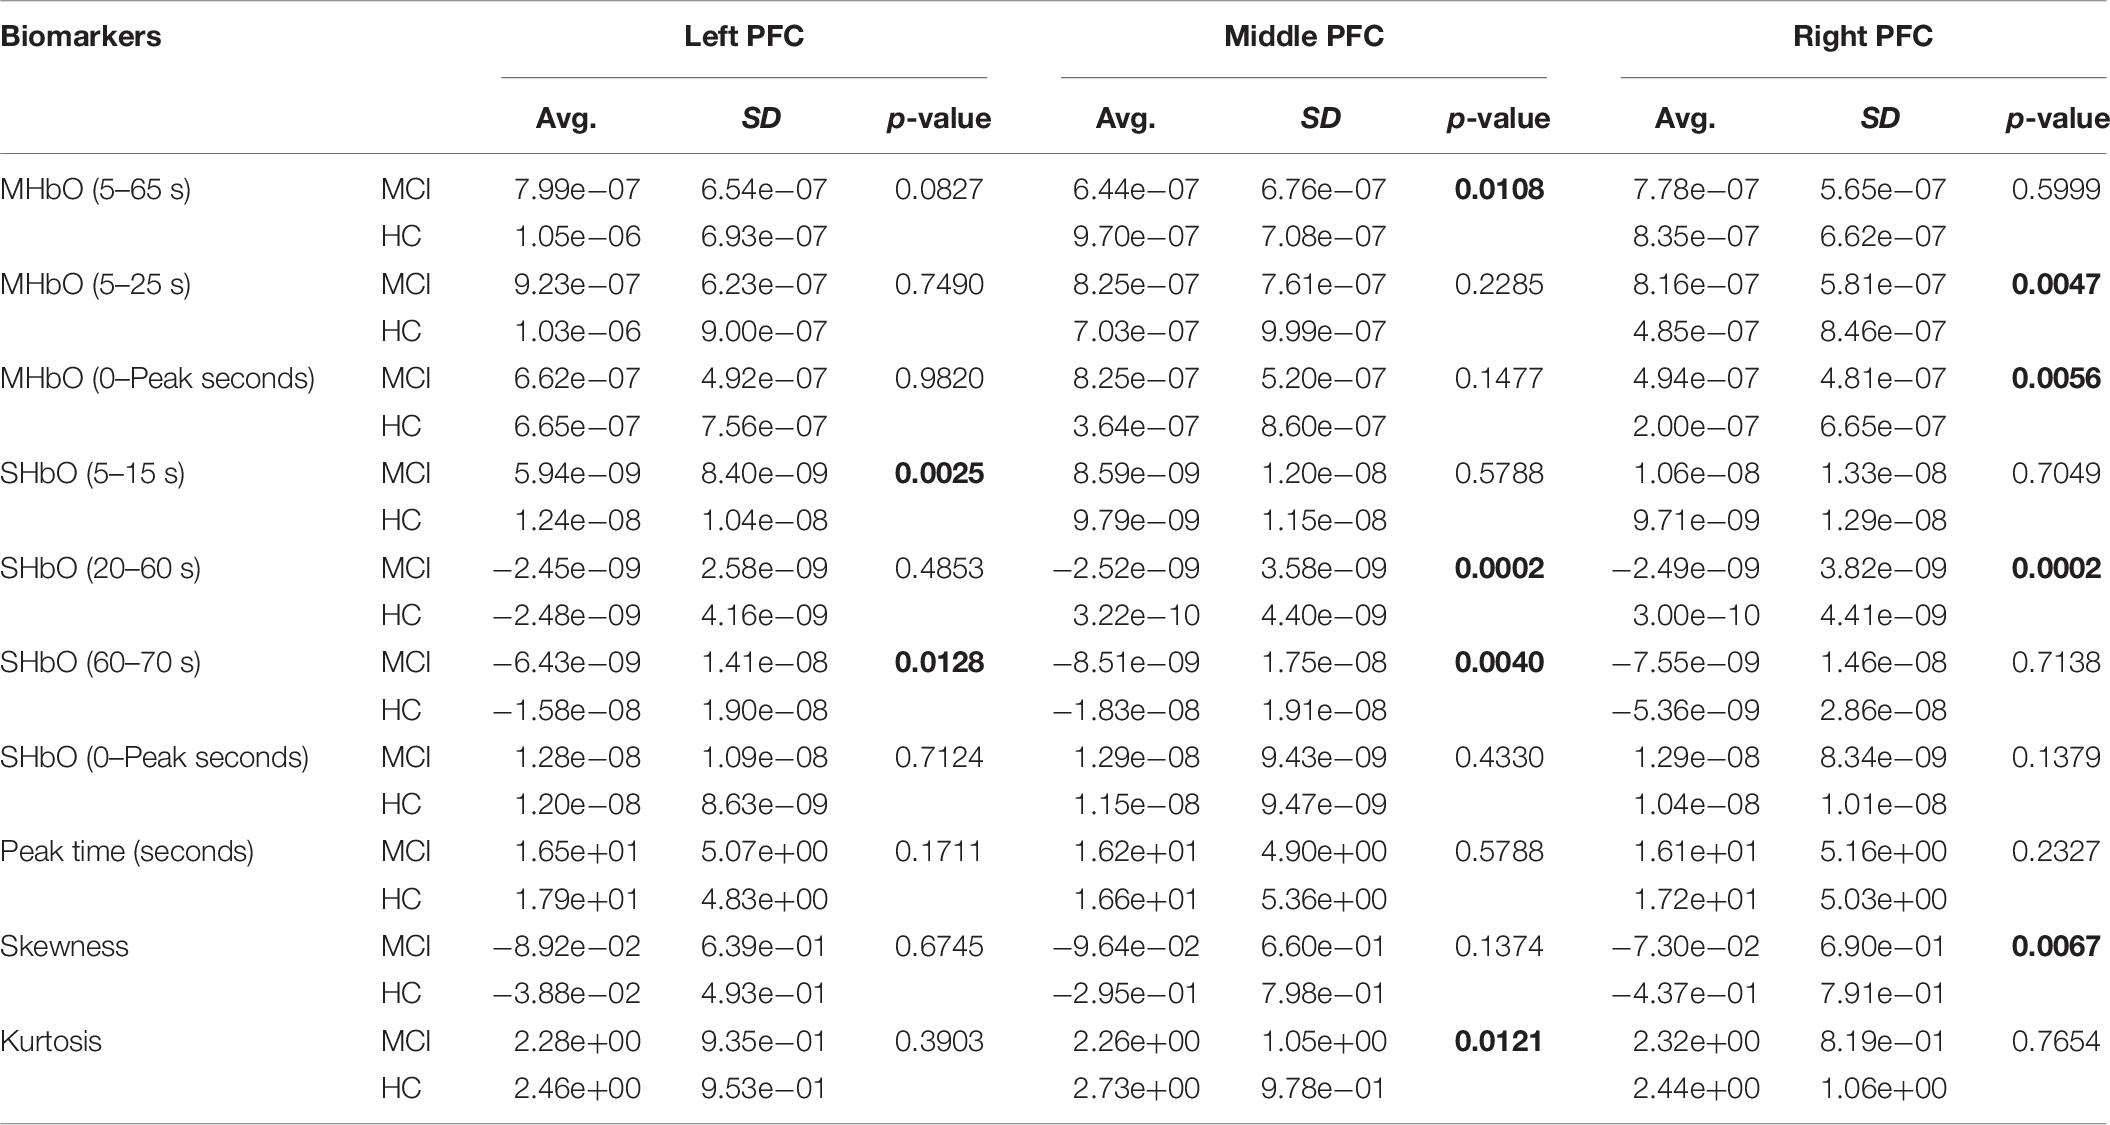
Table 6. Statistical data of N-back task (manually selected channels).
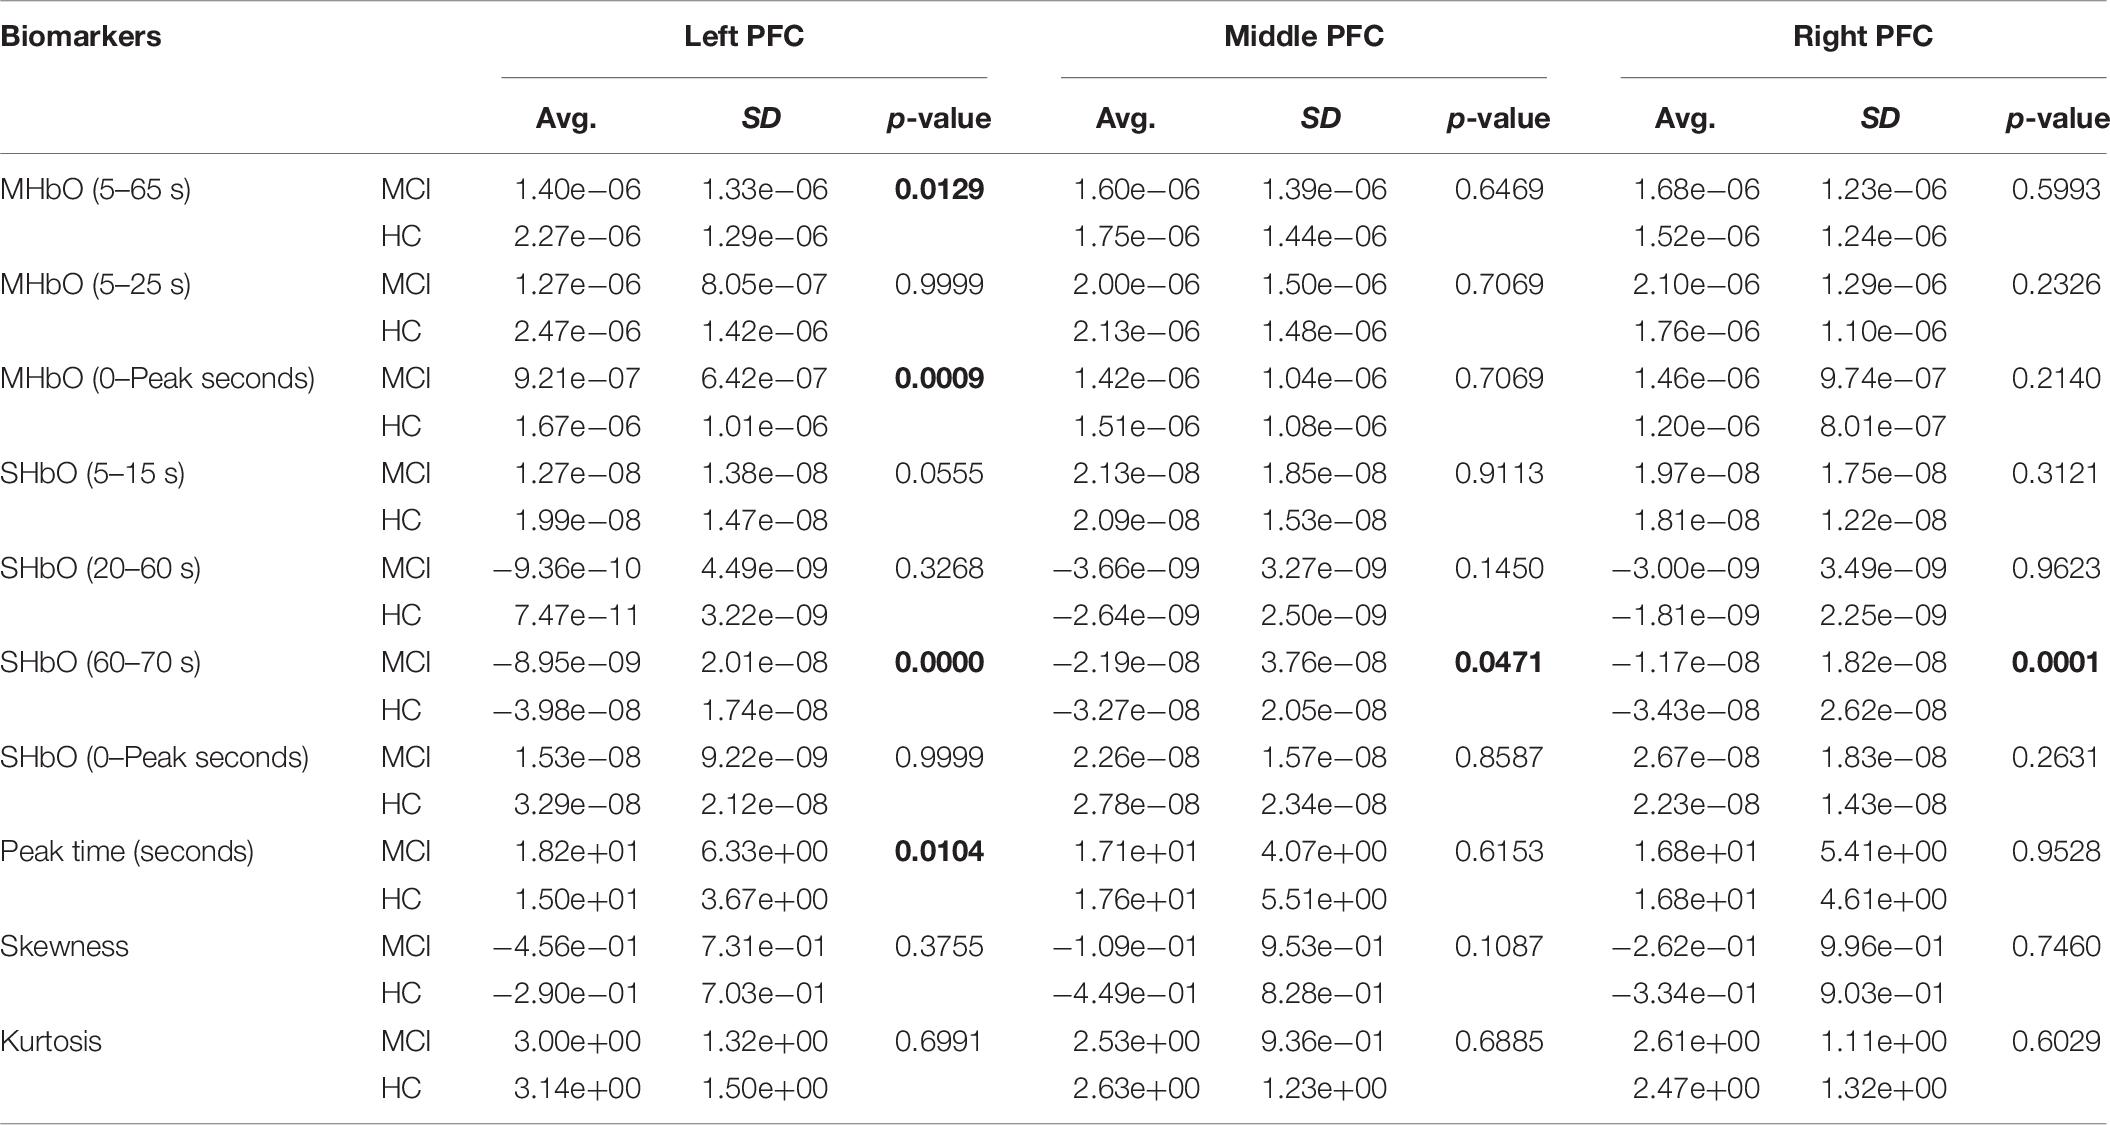
Table 7. Statistical data of Stroop task (manually selected channels).
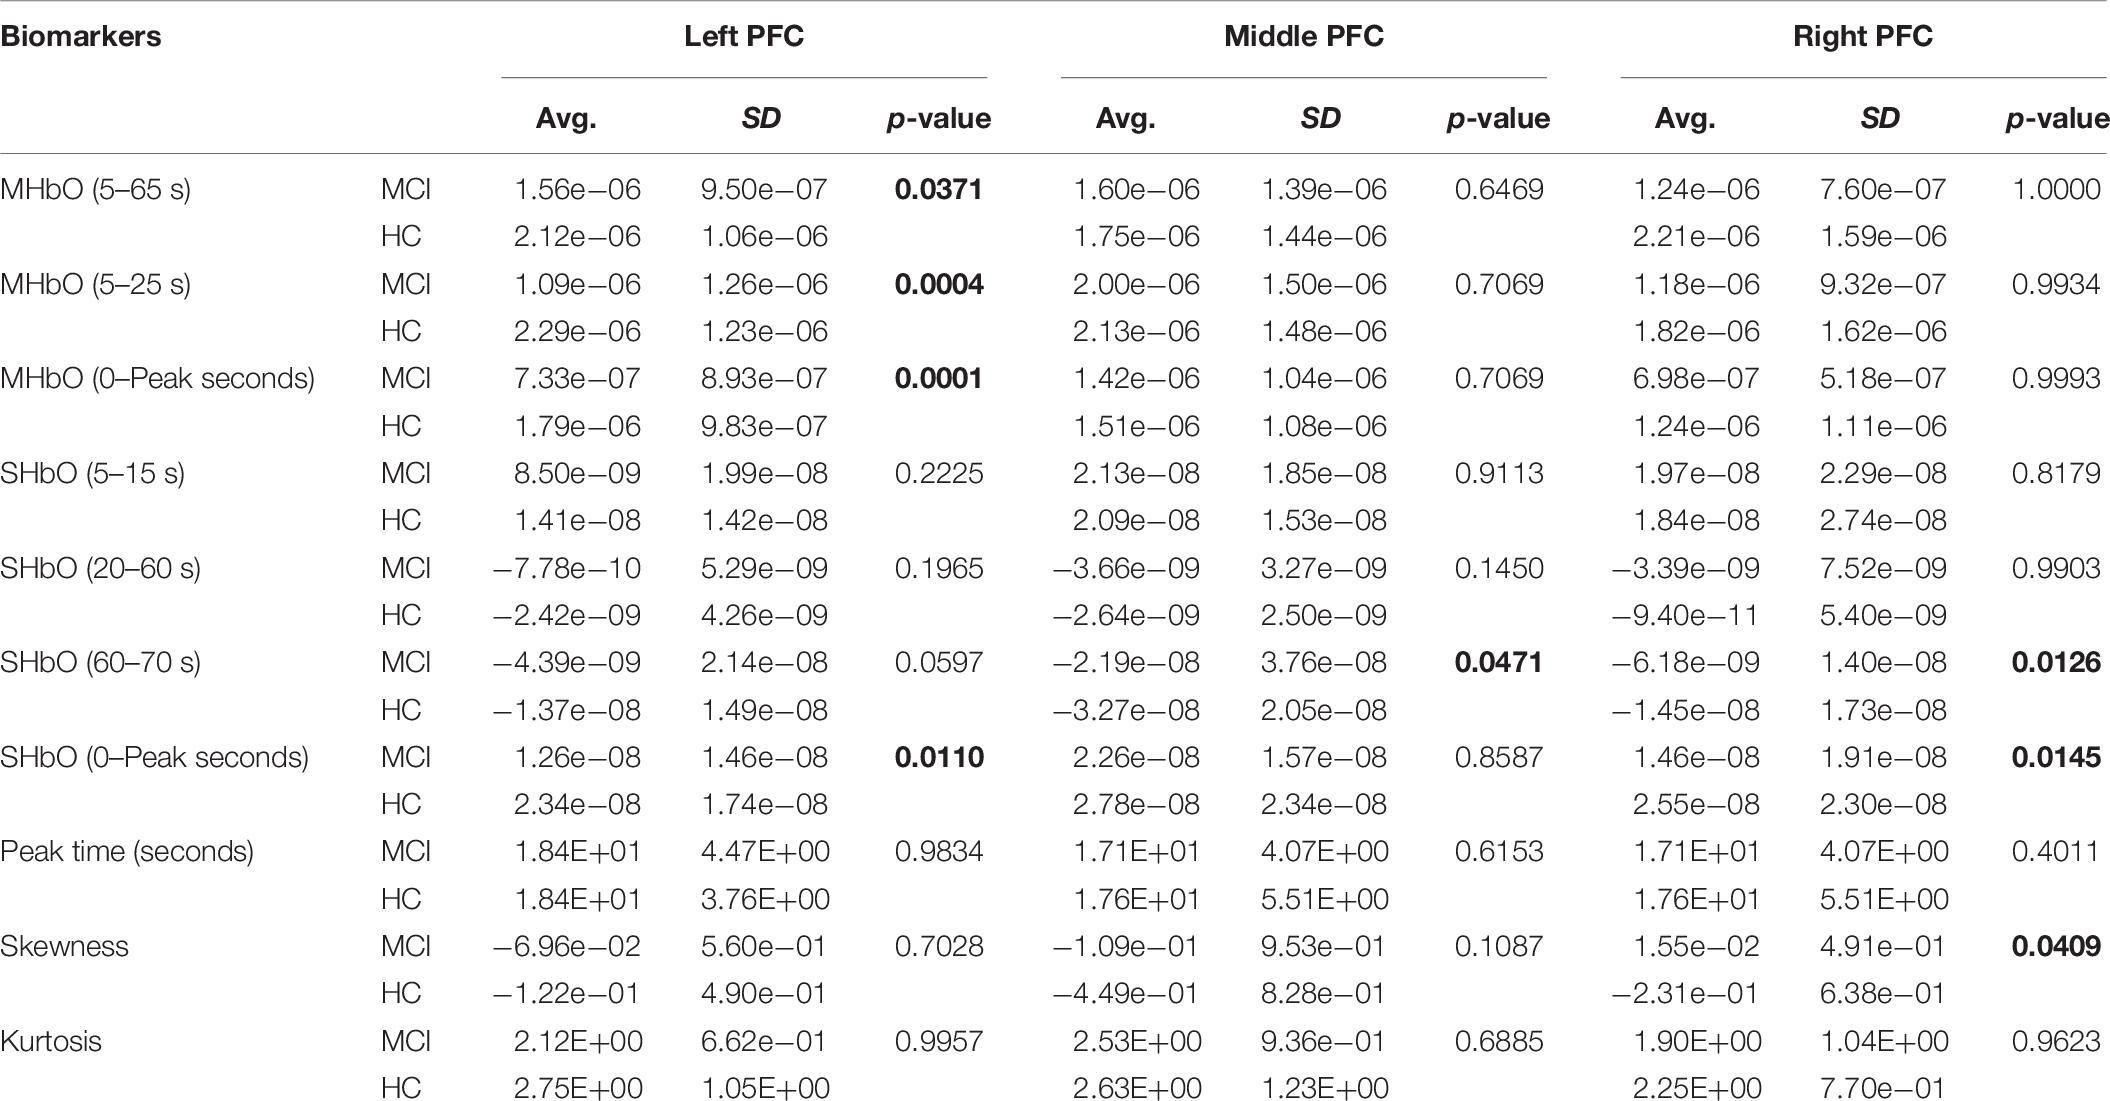
Table 8. Statistical data of VFT (manually selected channels).
Biomarker 1: MHbO in the interval of 5∼65 s
Biomarker 2: MHbR in the interval of 5∼65 s
Biomarker 3: MHbO in the interval of 5∼25 s
Biomarker 4: MHbR in the interval of 5∼25 s
Biomarker 5: MHbO in the interval of 0 – Peak
Biomarker 6: SHbO from 5 to 15 s
Biomarker 7: SHbR from 5 to 15 s
Biomarker 8: SHbO from 20 to 60 s
Biomarker 9: SHbR from 20 to 60 s
Biomarker 10: SHbO from 60 to 70 s
Biomarker 11: SHbR from 60 to 70 s
Biomarker 12: SHbO from 0 to the peak
Biomarker 13: Peak time of ΔHbO
Biomarker 14: Skewness of ΔHbO for the duration of 5 – 65 s
Biomarker 15: Kurtosis of ΔHbO for the duration of 5 – 65 s
This study employed two-sample independent t-test to conduct the statistical analysis with the significance level of 0.05. The p-value lower than 0.05 indicates the existence of significance difference between two groups. As demonstrated in Tables 3–8, the biomarkers with p-value < 0.05 are considered as ones with significant differences between the MCI and HC groups, which are marked bold. The appearance of significant biomarkers was random. It is remarked that the obtained biomarkers were not repeated for all three tasks or brain regions. Only Biomarker 14 (skewness) revealed a significant difference for all three brain regions when performing the Stroop task in the case of ROI channels, see Table 4. Although a few biomarkers showed some difference (similarly to Section “Comparison of Hemodynamic Responses”), the group statistical analysis was difficult to permit a meaningful diagnostic result for the individuals. This leads to our third strategy, Section “Classification of Digital Biomarkers”: Evaluating the individual classification accuracy using digital biomarkers for three mental tasks and different brain regions.
Classification of Digital Biomarkers
The selection of the time intervals for Biomarkers 1–15 has already been discussed in Section “Statistical Analysis of Digital Biomarkers.” Figure 5 depicts the entire classification accuracies between MCI and HC based upon ROI channels for (i) three mental tasks, (ii) three brain regions, and (iii) fifteen biomarkers. LDA was used as a classifier. On the other hand, for the channels manually selected, Figure 6 shows the comparative data for Figure 5. In agreement with the previous results (Yap et al., 2017), ΔHbO shows better classification results compared to ΔHbR (see Biomarkers 1 and 2 of N-back and Stoop tasks in Figures 5A,B). Therefore, in the case of manually selected channels, the analysis of ΔHbR is omitted and only ΔHbO is focused. Surprisingly, Biomarker 1 in the middle PFC when channels were selected manually showed the higher classification result than the case of ROI channels. It is remarked that the biomarkers showing significant difference in Tables 3–8 are not necessarily going to have the same satisfactory classification results with LDA: For instance, Biomarkers 6 and 10 showed a good classification results in Table 6, but it is not so in Figure 6A. Even though the best accuracy of 76.67% (i.e., Biomarker 11 of N-back task and Biomarker 10 of Stroop task) was achieved by using LDA, it is still considered low to be implemented for clinical applications. As previously mentioned, these 15 biomarkers were chosen based on the existing studies and our own experiences. But, the low classification result using LDA necessitates a further pursuit toward a reliable biomarker for MCI patients based on the hemodynamic response. We therefore consider using the whole or selected hemodynamic responses in combination with a machine learning method, CNN.
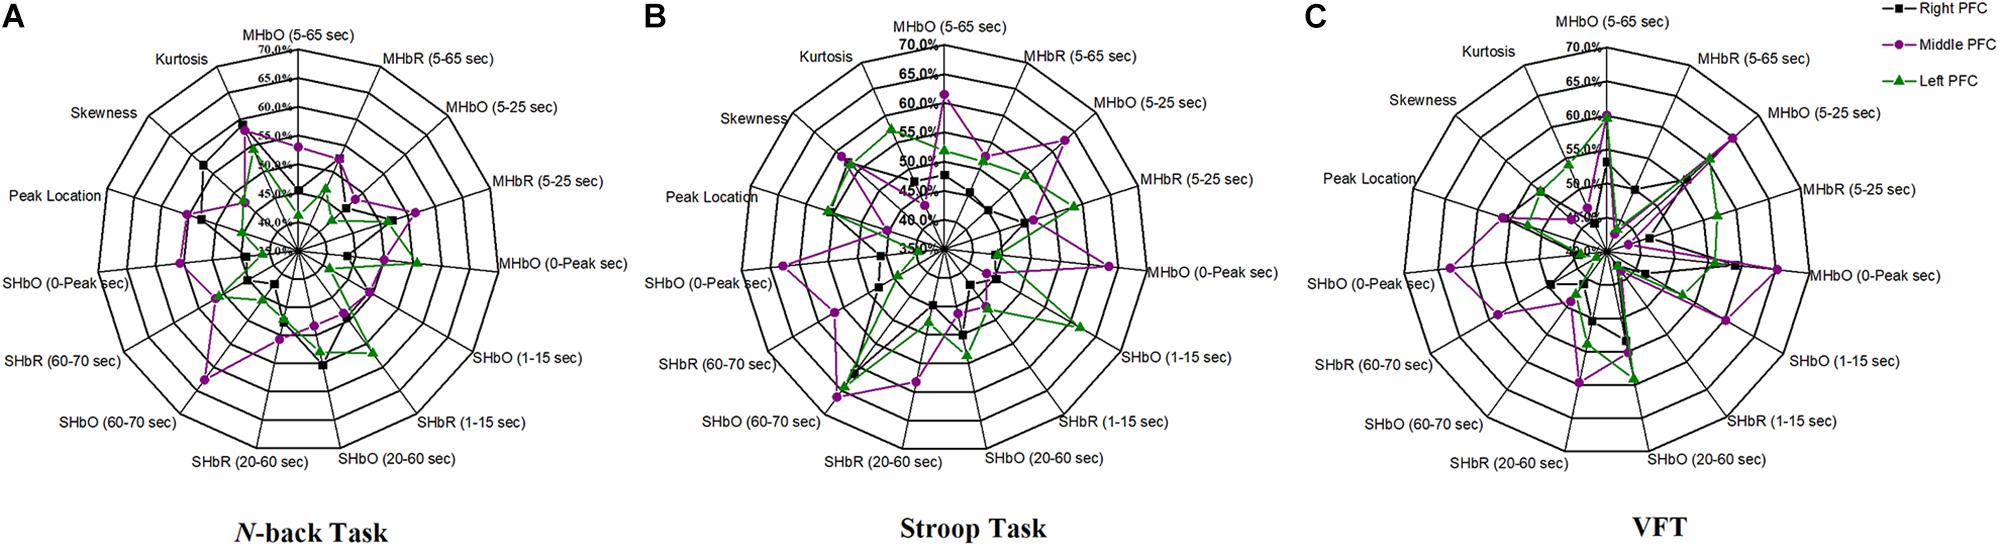
Figure 5. Panels (A–C) are the LDA classification results of 15 digital biomarkers based upon ROI channels with N-back, Stroop, and VFT task, respectively.
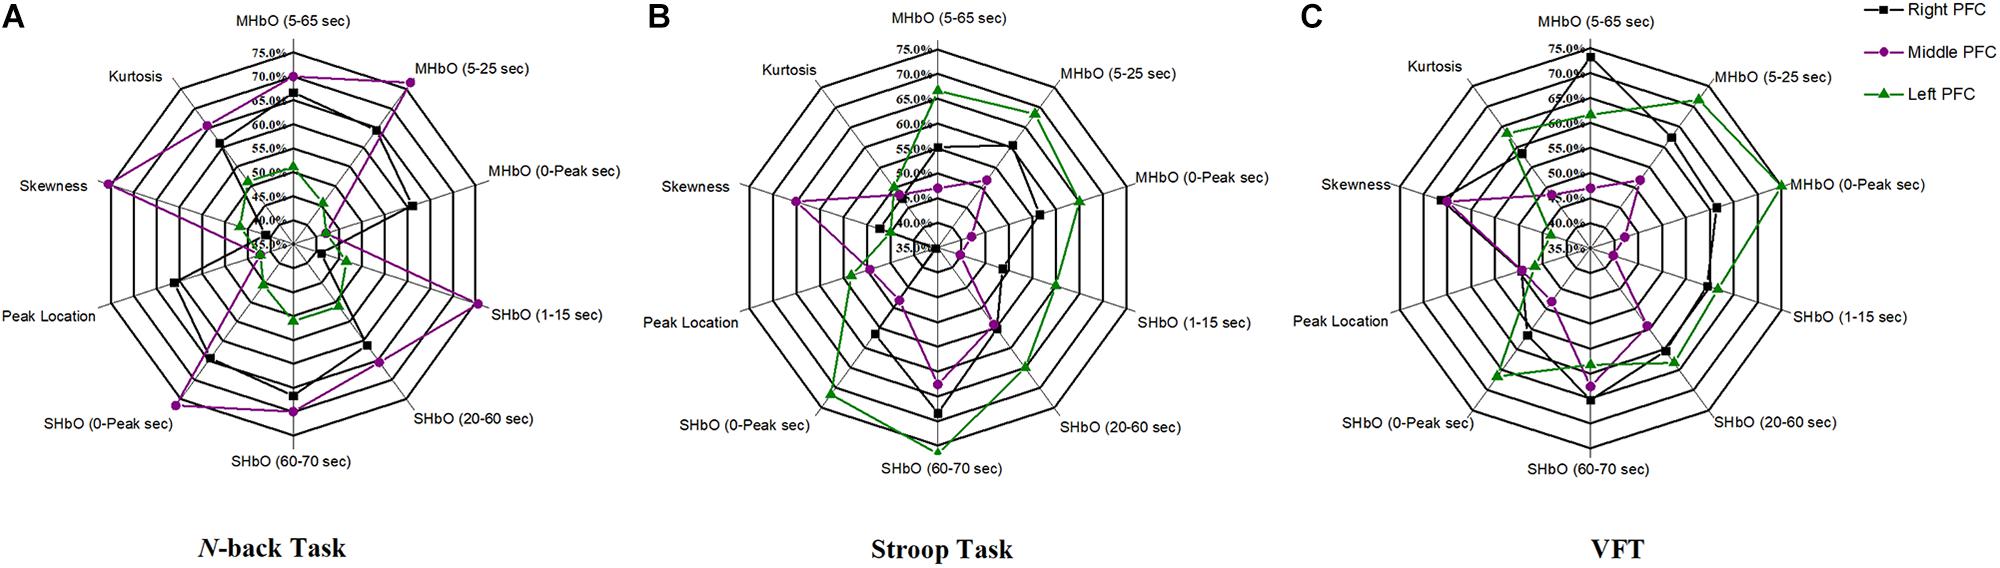
Figure 6. Panels (A–C) are the LDA classification results of 10 digital biomarkers based upon manually selected ROI channels with N-back, Stroop, and VFT task, respectively.
CNN Classification of Hemodynamic Responses
In this section, we investigate the CNN method for automatic learning of the useful features from the hemodynamic responses between MCI and HC. We regard that most of the valuable features appearing in the digital biomarkers are already contained in the non-linear feature form in the CNN model. As demonstrated in Figure 7, the CNN classification results trained by the concentration changes of the ΔHbO of the N-back task show approximately similar accuracies in the three brain regions (i.e., whole PFC: 64.21%, right PFC: 72.46%, and middle PFC 74.03%) except for the left PFC, which has the lowest accuracy than other regions. The classification accuracies with the Stroop task ranged from a minimum of 73.36% (right PFC) to a maximum of 75.77% (left PFC). In the VFT case, the middle PFC obtained a good classification accuracy (78.94%) in comparison to the whole PFC, left PFC, and right PFC. The classification accuracies were improved in comparison to the LDA results obtained by the digital biomarkers. Even the best accuracy in the case of CNN results trained by hemodynamic response was nearly 80% (i.e., 78.94% in Figure 7C), the potential to increase the accuracy still exists. To push the boundary for a better classification accuracy, we employ the t-map and the correlation map as biomarkers for classifying the MCI patients from HC.
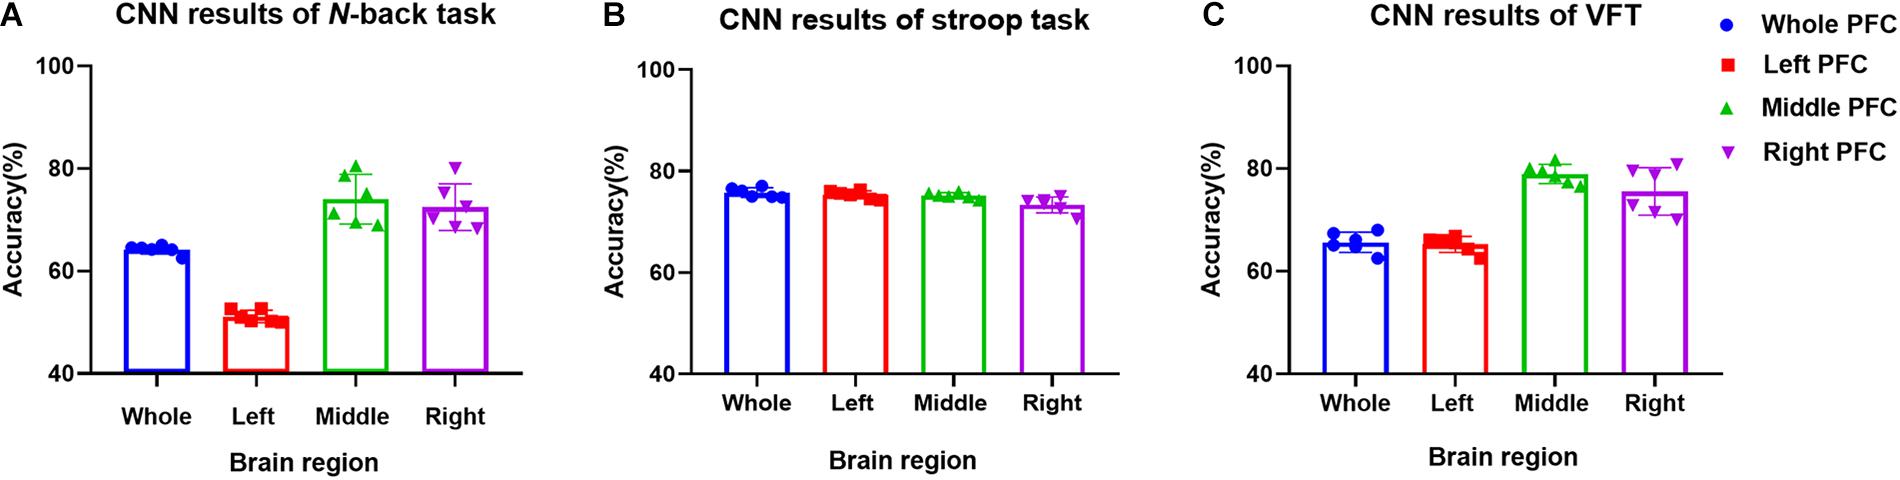
Figure 7. Classification results by CNN (repeated six times) using the HbO data in the ROI.
CNN Classification Results of Imaging Biomarkers
The t-map and correlation map are widely used as an image biomarker in the field of fMRI. Figure 8 shows the group averaged t-maps of three mental tasks. The numbers shown in Figure 8 represent the channel numbers on the PFC. The top three figures in Figure 8 (i.e., A–C) present the t-maps generated by MCI group with the N-back task, Stroop task, and VFT, respectively, and the lower three maps represent those of HC (i.e., Figures 8D–F). The results reveal that the activated regions between MCI patients and HC are different. Figure 9, portrays the correlation maps of three mental tasks for MCI (Figures 9A–C) and HC (Figures 9D–F). Finally, the CNN results trained by t-map and correlation map are compared in Figure 10. All the CNN results (accuracy) trained by both image biomarkers were higher than 82.05%, except for the VFT task and t-map (71.59%). Particularly, the CNN result trained by t-map with the N-back task showed a highest accuracy of 90.62%.
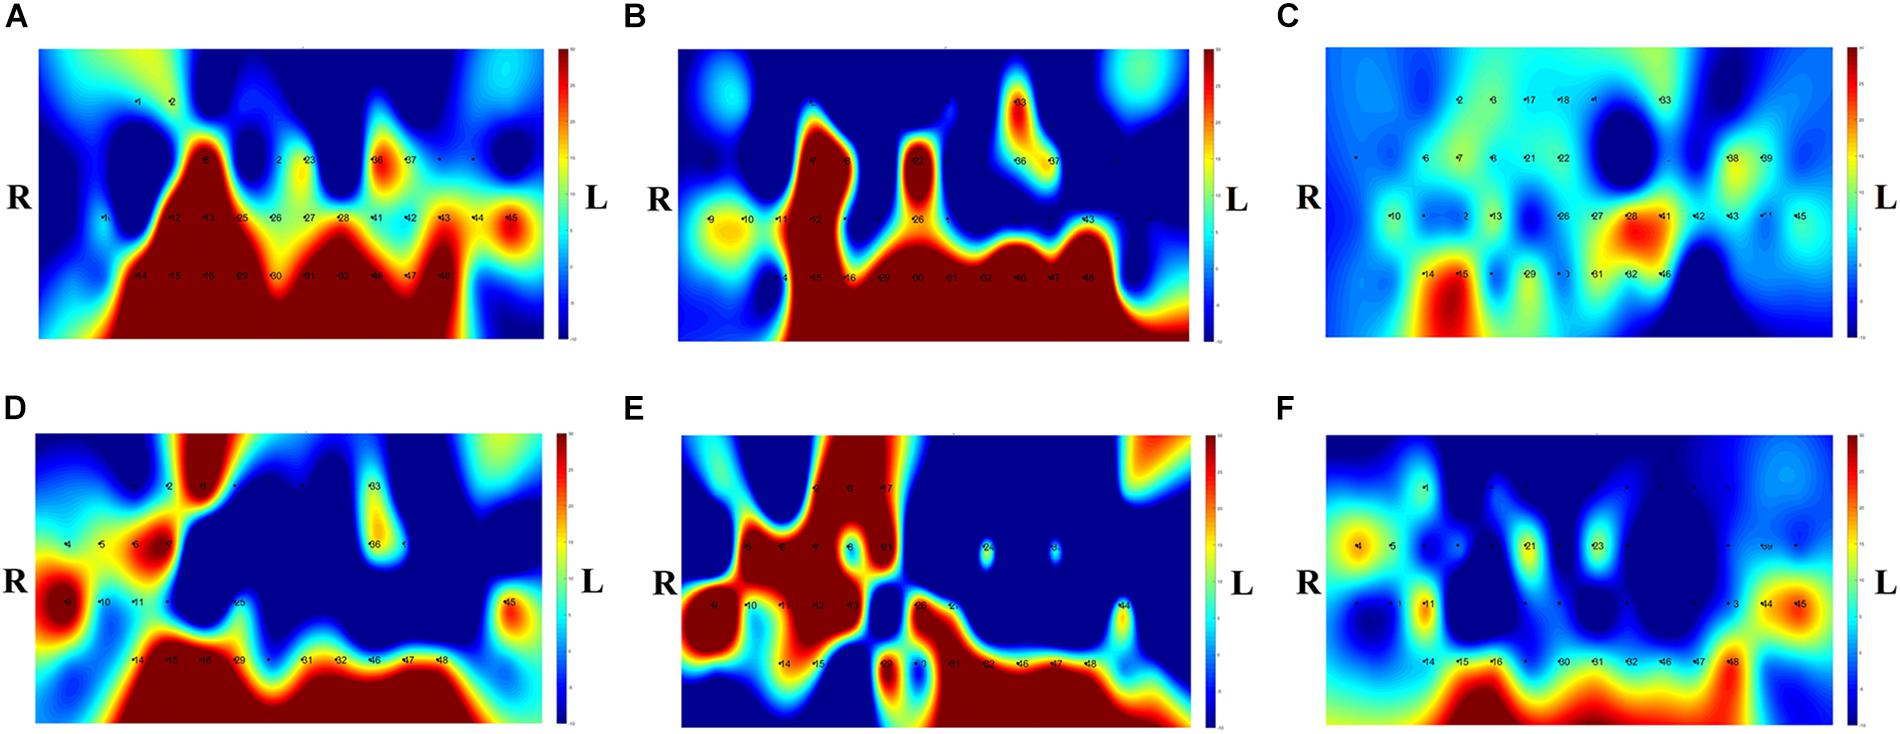
Figure 8. Comparison of average t-maps between MCI and HC for three mental tasks: (A) N-back MCI, (B) Stroop MCI, (C) VFT MCI, (D) N-back HC, (E) Stroop HC, and (F) VFT HC.
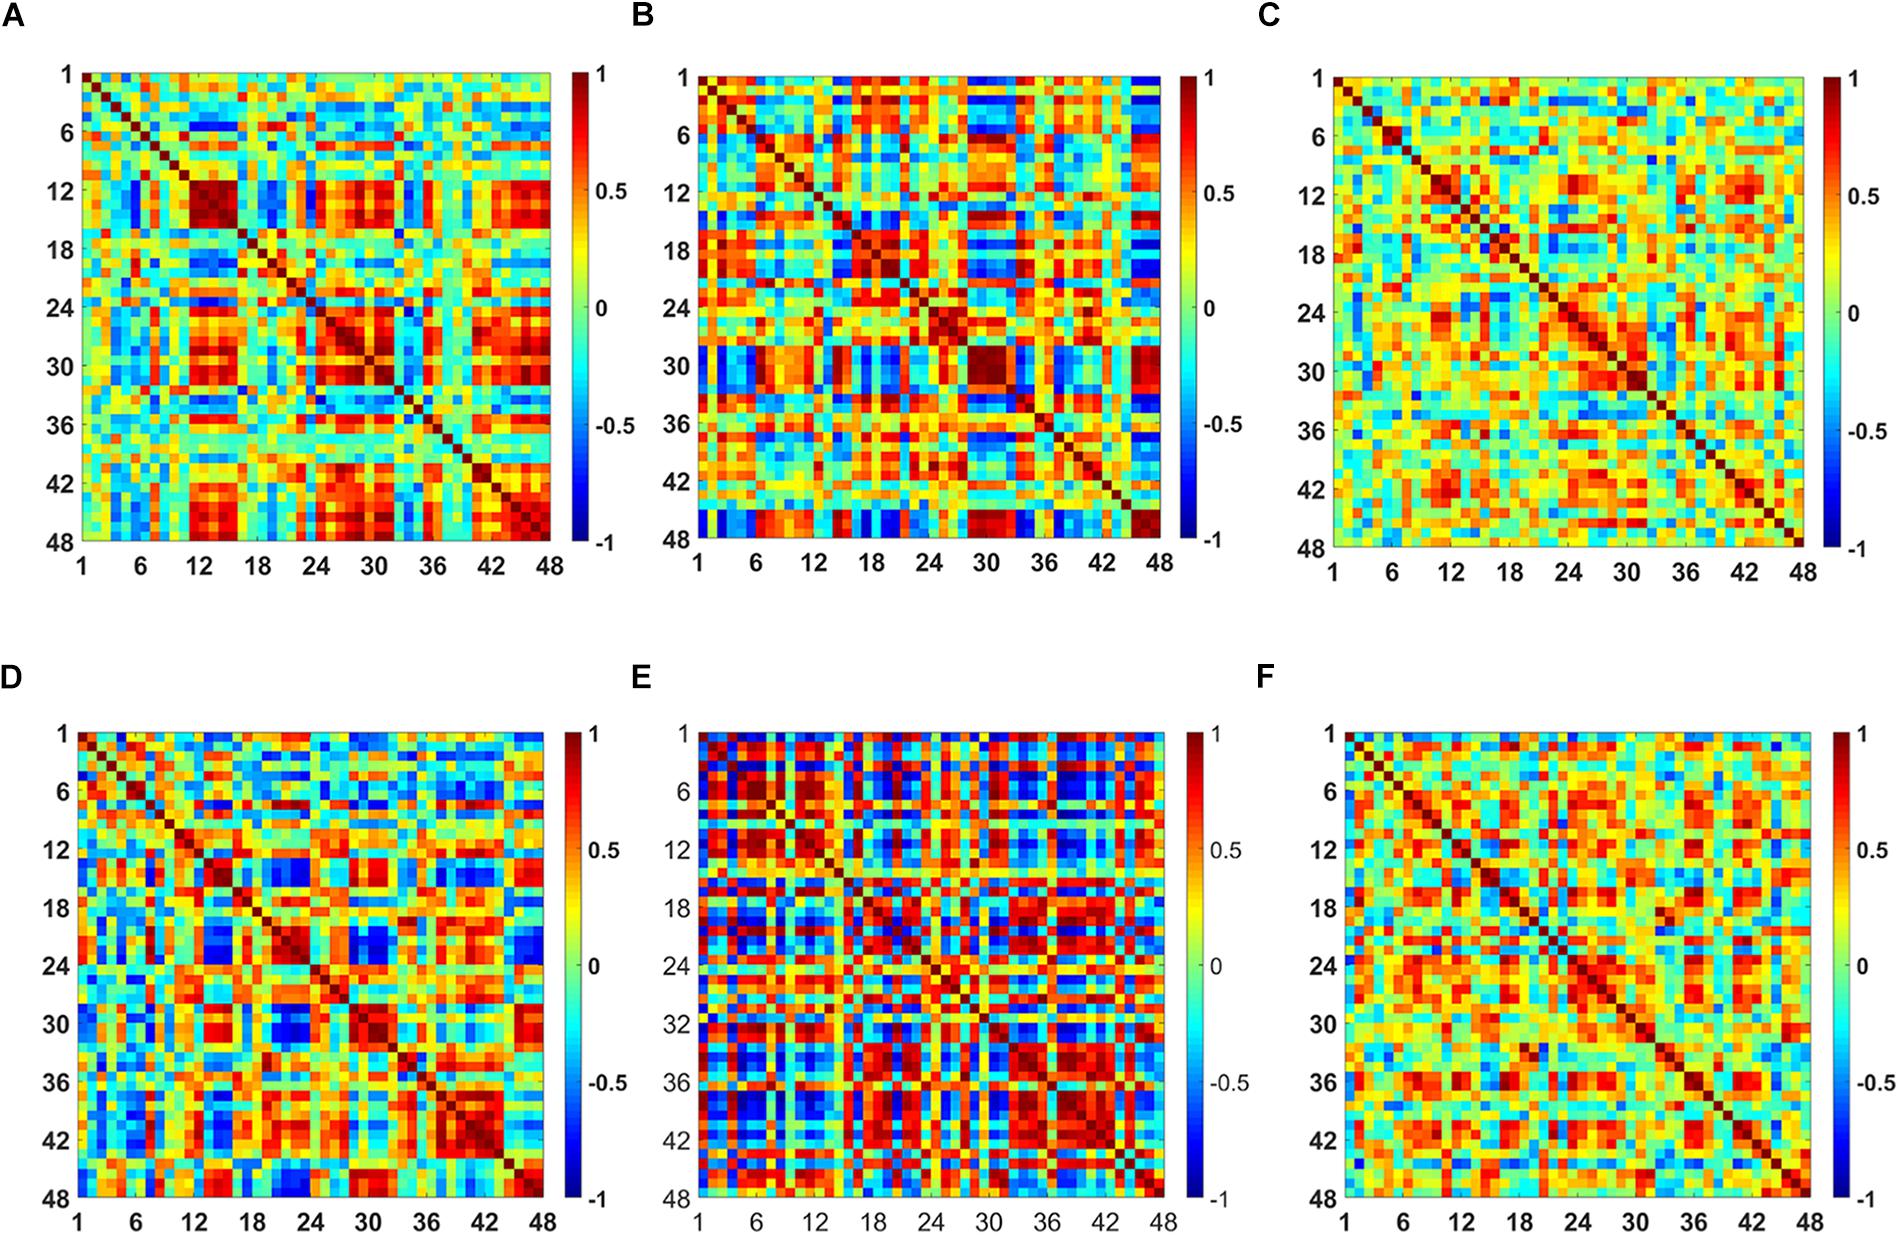
Figure 9. Comparison of the correlation maps between MCI and HC for three mental tasks: (A) N-back MCI, (B) Stroop MCI, (C) VFT MCI, (D) N-back HC, (E) Stroop HC, and (F) VFT HC (the color bar in the right shows the correlation coefficient from –1 to 1).
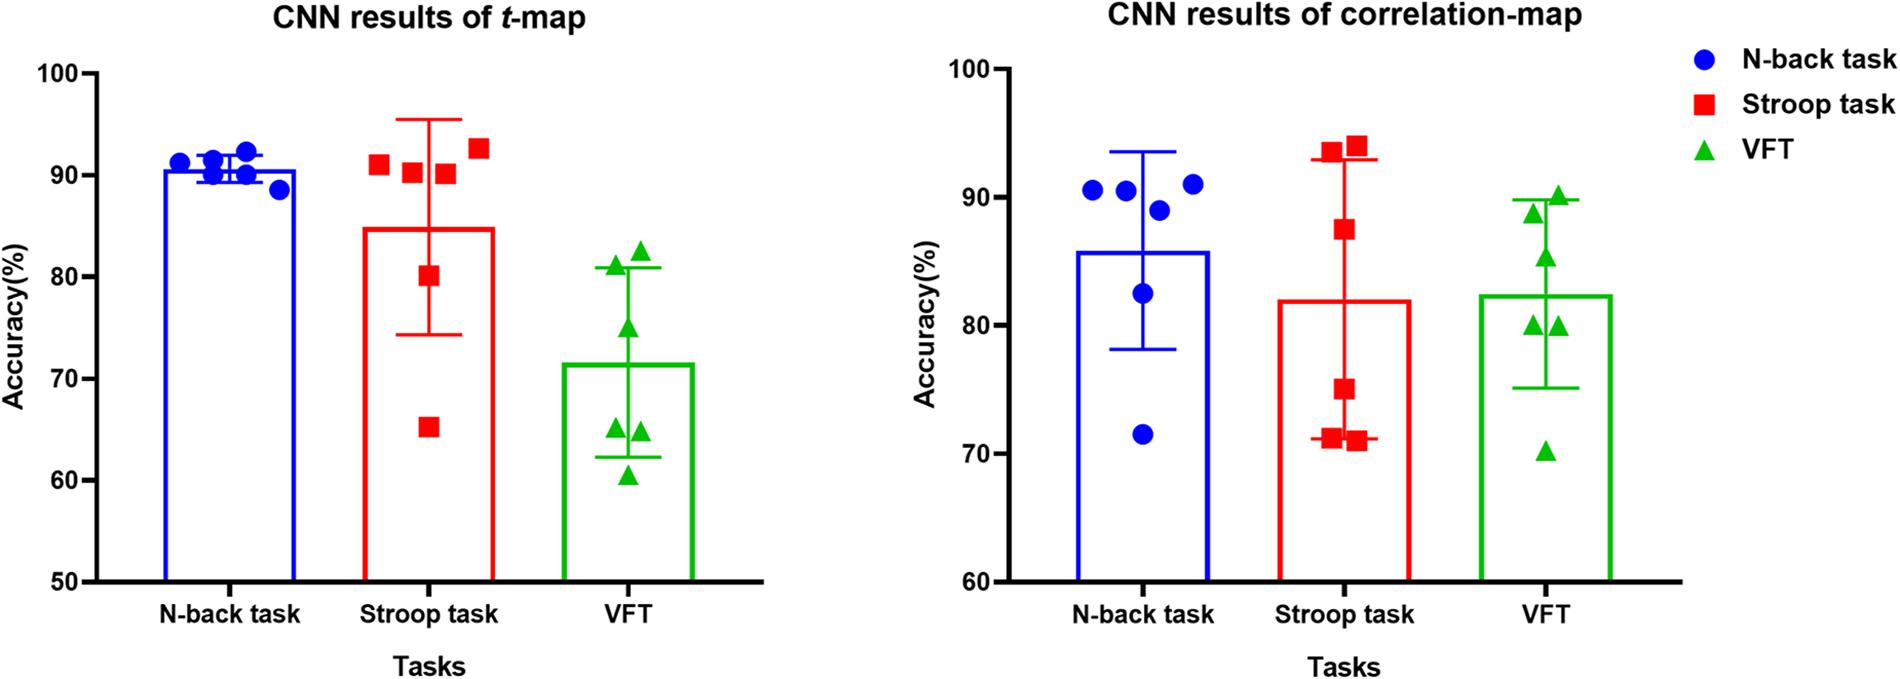
Figure 10. Classification results of t-maps and correlation maps by CNN (repeated six times) for three mental tasks.
Discussion
In this paper, our goal is to propose the best biomarker for diagnosing the MCI patients for clinical usage. For this, 15 digital biomarkers (5 means and 7 slopes of ΔHbO/ΔHbR, peak time, skewness, kurtosis), three PFC regions, and two image biomarkers (t-map, correlation map) were investigated for detecting neural degeneration in the MCI patients. This study also aims at developing a novel method for diagnosing the MCI patients from the elderly in their everyday environment using fNIRS. To the best of the authors’ knowledge, this is the first work for evaluating the digital biomarkers in relation to MCI/AD with fNIRS. The obtained results can become a reference for utilizing appropriate biomarkers for neural information detection, and may provide a new tool to diagnose MCI patients in a harmless, non-invasive and portable manner.
(i) Statistical analysis and individual classification: In Figure 4 and Tables 3–8, the existence of differences of hemodynamic responses between two groups (MCI, HC) is shown. Most biomarkers in Tables 3–8 as well as the differences in HbOs in Figure 4 reveal the existence. This is consistent with the former studies (Katzorke et al., 2017; Vermeij et al., 2017; Yap et al., 2017; Li R. et al., 2018). However, the LDA classification accuracies based up the biomarkers shown in Figure 5 are too low for clinical applications. That means that the statistical analysis approach is not reliable for the detection of an MCI patient clinically. Beyond the current method, a new method of using the averaged hemodynamic responses of MCI patients and HC should be investigated, for instance, adaptive estimation algorithms (Iqbal et al., 2018; Nguyen et al., 2018; Yazdani et al., 2018; Yi et al., 2018) or advanced signal processing (Chen et al., 2018; Hong et al., 2018a).
(ii) Better results in local PFCs: In the literature, Goh and Park (2009) proposed the scaffolding theory for aging and cognition. Similar results (Cabeza et al., 2002; Katzorke et al., 2018) also verified that a neural compensatory mechanism exists and an additional neural passageway is recruited to support the declining brain function if it becomes inefficient. Similar with this compensation theory, the ΔHbO of HC in the left PFC (shown in Figure 3) appeared higher than that of MCI, but this was not obvious in the right and middle PFCs. This result is consistent with the work of Reuter-Lorenz et al. (2000), which claims that the contralateral right PFC of the patients with MCI can increase recruitment of both working memory and episodic encoding. Also, the higher classification result when using the middle PFC, as seen in Figure 7, indicates that the middle brain activity got decreased in the MCI patients. This may coincide with the fact that the gray matter in the middle PFC gets reduced during the process of aging (Minkova et al., 2017).
(iii) ROI strategy: Two strategies for selecting the signals for analysis were evaluated; t-value based selection and manual selection by visual examination. The t-value based ROI selection is widely employed in the bio-signal processing areas (Plichta et al., 2006), since it has the advantage of being convenient and consumes lesser time. However, in this study, we found that the automatic ROI selection with t > tcrit included many data with high noise oscillations. As revealed in Figures 5, 6 and Tables 3–8, the results obtained by using the manually selected active channels showed a better performance than the automatic ROI selection. It reveals that the channel selection is very sensitive to the final result because the poor performance could be caused by the wrong selection of ROI channels algorithmically. In light of the above-mentioned advantage, the automatic ROI selection would be convenient when analyzing a big data set.
(iv) Mental tasks: Three mental tasks (N-back, Stroop, VFT) were employed to classify the MCI patients from HC. Based on the hemodynamic response of ΔHbO, the statistical digital biomarkers analysis, and digital/image biomarkers classification, the N-back task showed a robust and stable performance in contrast to the Stroop task and VFT. Especially, the CNN result using the t-map data obtained the accuracy over 90% by performing the N-back task. This might be an indication that the memory-related neural degeneration is more apparent in the MCI patients when compared with the other mental functions. It will be interesting to apply another deep learning technique such as the recurrent neural network (RNN) (Sanchez et al., 2017; Li X. F. et al., 2018; Liu, 2018).
A number of different time intervals were evaluated in line with the statistical digital biomarkers in this study. As shown in Figures 5, 6 and Tables 3–8, the significant results (i.e., accuracy > 60% or p-value < 0.05) occurred randomly. It was difficult to conclude the best time interval for MCI detection. In addition, most of the studies (as listed in Table 1) prefer to conduct the statistical analysis using the entire task period between the groups of MCI and HC. However, as per the obtained results, the biomarkers were not consistent to make a satisfactory classification result. Therefore, the statistical analysis is not recommended to detect the early stage of AD. Therefore, as shown in Figure 9, the combined technique (deep learning and an imaging biomarker) shows a promising advantage for detecting the MCI patients from HC in the fNIRS field.
Since the present study accessed a relatively small number of MCI patients, no attempt was made to exclude patients based on other criteria. To substantiate the findings, research with a larger sample size would help ensuring that participants with secondary comorbidities can be excluded. In addition, a study with more participants will allow assessing separately, participants with different subtypes of MCI. In this study, we considered only the prefrontal lobes for our investigation, as PFC is widely (>90%) used for diagnosing MCI in the fNIRS area. Another issue for improvement can be found from the used headset. NIRSIT has a specific channel configuration for the PFC. It cannot be used over the entire brain. Meanwhile, several former studies claimed that MCI patients have a reduced activation in the hippocampus and PFC (Johnson et al., 2006; Dannhauser et al., 2008). A broader brain region than the PFC might give the better opportunity for examining more effective biomarkers. In the future, the whole brain with a hybrid technique including EEG and fNIRS (Khan et al., 2014, 2018; Hong et al., 2018b) with a greater number of subjects will be pursued hoping that more effective and reliable biomarkers for diagnosing the early stage of AD are disclosed.
Conclusion
For the purpose of diagnosing MCI patients using fNIRS, we investigated three approaches (statistical analysis, LDA, CNN) in classifying the measured fNIRS signals. Fifteen digital biomarkers (i.e., 5 means and 7 slopes of ΔHbO/ΔHbR, peak time, skewness, kurtosis) in combination of LDA and two image biomarkers (t-map, correlation map) in combination with CNN were analyzed. It appears that the classical statistical analysis method is not reliable for clinical application, because the biomarkers (p < 0.05) that provided good LDA classification results (> 60%) were not consistent throughout the trials. However, the CNN classification result using the t-map input data provided the best classification accuracy (90.62%) between MCI and HC. Secondly, the local analyses in the PFC (left PFC, or middle PFC, or right PFC) provided better classification accuracies than examining the entire PFC. This leads to the conclusion that the task-related brain activity in the PFC may be localized per person, and the use of a few channels of fNIRS may be acceptable for MCI diagnosis. Finally, the N-back task presented a robust and accurate performance than the Stroop or VF tasks when the image biomarkers with CNN were analyzed.
Data Availability
The datasets generated for this study are available on request to the corresponding author.
Ethics Statement
This experiment was conducted in accordance with the latest Declaration of Helsinki upon the approval of the Pusan National University Institutional Review Board. All volunteers were given a detailed description of the experimental procedure prior to the beginning of the experiment, and they provided written consent agreeing to these experiments.
Author Contributions
DY carried out the data processing and wrote the first draft of the manuscript. K-SH suggested the theoretical aspects of the current study, corrected the manuscript, and supervised the entire process leading to the manuscript generation. S-HY participated in collecting experimental data. C-SK has examined the data. All authors have approved the final manuscript.
Funding
This work was supported by the National Research Foundation (NRF) of Korea under the auspices of the Ministry of Science and ICT, Republic of Korea (Grant Nos. NRF-2017R1A2A1A17069430 and NRF-2017R1A4A1015627).
Conflict of Interest Statement
The authors declare that the research was conducted in the absence of any commercial or financial relationships that could be construed as a potential conflict of interest.
References
Alzheimer’s Association, (2018). 2018 Alzheimer’s disease facts and figures. Alzheimers Dement. 14, 367–429. doi: 10.1016/j.jalz.2016.03.001
Arai, H., Takano, M., Miyakawa, K., Ota, T., Takahashi, T., Asaka, H., et al. (2006). A quantitative near-infrared spectroscopy study: a decrease in cerebral hemoglobin oxygenation in Alzheimer’s disease and mild cognitive impairment. Brain Cogn. 61, 189–194. doi: 10.1016/j.bandc.2005.12.012
Beishon, L., Haunton, V. J., Panerai, R. B., and Robinson, T. G. (2017). Cerebral hemodynamics in mild cognitive impairment: a systematic review. J. Alzheimers Dis. 59, 369–385. doi: 10.3233/JAD-170181
Boas, D. A., Elwell, C. E., Ferrari, M., and Taga, G. (2014). Twenty years of functional near-infrared spectroscopy: introduction for the special issue. Neuroimage 85, 1–5. doi: 10.1016/J.NEUROIMAGE.2013.11.033
Byeon, H., Jin, H., and Cho, S. (2017). Development of Parkinson’s disease dementia prediction model based on verbal memory, visuospatial memory, and executive function. J. Med. Imag. Heal. Inform. 7, 1517–1521. doi: 10.1166/jmihi.2017.2196
Cabeza, R., Anderson, N. D., Locantore, J. K., and McIntosh, A. R. (2002). Aging gracefully: compensatory brain activity in high-performing older adults. Neuroimage 17, 1394–1402. doi: 10.1006/nimg.2002.1280
Chen, H. T., Jiang, B., and Lu, N. Y. (2018). A multi-mode incipient sensor fault detection and diagnosis method for electrical traction systems. Int. J. Control Autom. Syst. 16, 1783–1793. doi: 10.1007/s12555-017-0533-0
Cotelli, M., Manenti, R., Cappa, S. F., Zanetti, O., and Miniussi, C. (2008). Transcranial magnetic stimulation improves naming in Alzheimer disease patients at different stages of cognitive decline. Eur. J. Neurol. 15, 1286–1292. doi: 10.1111/j.1468-1331.2008.02202.x
Dannhauser, T. M., Shergill, S. S., Stevens, T., Lee, L., Seal, M., Walker, R. W., et al. (2008). An fMRI study of verbal episodic memory encoding in amnestic mild cognitive impairment. Cortex 44, 869–880. doi: 10.1016/j.cortex.2007.04.005
Ding, Z. Y., Chen, Y. M., Chen, Y. L., and Wu, X. Y. (2017). Similar hand gesture recognition by automatically extracting distinctive features. Int. J. Control Autom. Syst. 15, 1770–1778. doi: 10.1007/s12555-015-0403-6
Doi, T., Shimada, H., Park, H., Makizako, H., Tsutsumimoto, K., Uemura, K., et al. (2015). Cognitive function and falling among older adults with mild cognitive impairment and slow gait. Geriatr. Gerontol. int. 15, 1073–1078. doi: 10.1111/ggi.12407
Fang, C., Li, C. F., Cabrerizo, M., Barreto, A., Andrian, J., Rishe, N., et al. (2018). Gaussian discriminant analysis for optimal delineation of mild cognitive impairment in Alzheimer’s disease. Int. J. Neural. Syst. 28:1850017. doi: 10.1142/S012906571850017X
Ferrari, M., and Quaresima, V. (2012). A brief review on the history of human functional near-infrared spectroscopy (fNIRS) development and fields of application. Neuroimage 63, 921–935. doi: 10.1016/j.neuroimage.2012.03.049
General Assembly of the World Medical Association, (2014). World medical association declaration of helsinki: ethical principles for medical research involving human subjects. JAMA-J. Am. Med. Assoc. 310, 2191–2194. doi: 10.1001/jama.2013.281053
Ghafoor, U., Kim, S., and Hong, K.-S. (2017). Selectivity and longevity of peripheral-nerve and machine interfaces: a review. Front. Neurorobot. 11:59. doi: 10.3389/fnbot.2017.00059
Goh, J. O., and Park, D. C. (2009). Neuroplasticity and cognitive aging: the scaffolding theory of aging and cognition. Restor. Neurol. Neurosci. 27, 391–403. doi: 10.3233/RNN-2009-0493
Halliday, D. W. R., Hundza, S. R., Garcia-Barrera, M. A., Klimstra, M., Commandeur, D., Lukyn, T. V., et al. (2018). Comparing executive function, evoked hemodynamic response, and gait as predictors of variations in mobility for older adults. J. Clin. Exp. Neuropsychol. 40, 151–160. doi: 10.1080/13803395.2017.1325453
Hamadache, M., and Lee, D. (2017). Principal component analysis-based signal-to-noise ratio improvement for inchoate faulty signals: application to ball bearing fault detection. Int. J. Control Autom. Syst. 15, 506–517. doi: 10.1007/s12555-015-0196-7
Han, C., Jo, S., Jo, I., Kim, E., Park, M., Kang, Y., et al. (2008). An adaptation of the korean mini-mental state examination (K-MMSE) in elderly koreans: demographic influence and population-based norms (the AGE study). Arch. Gerontol. Geriatr. 47, 302–310. doi: 10.1016/j.archger.2007.08.012
Haworth, J., Phillips, M., Newson, M., Rogers, P. J., Torrens-Burton, A., and Tales, A. (2016). Measuring information processing speed in mild cognitive impairment: clinical versus research dichotomy. J. Alzheimers Dis. 51, 263–275. doi: 10.3233/JAD-150791
Heinzel, S., Haeussinger, F. B., Hahn, T., Ehlis, A.-C., Plichta, M. M., and Fallgatter, A. J. (2013). Variability of (functional) hemodynamics as measured with simultaneous fNIRS and fMRI during intertemporal choice. Neuroimage 71, 125–134. doi: 10.1016/j.neuroimage.2012.12.074
Hong, K.-S., Khan, M. J., and Hong, M. J. (2018b). Feature extraction and classification methods for hybrid fNIRS-EEG brain-computer interfaces. Front. Hum. Neurosci. 12:246. doi: 10.3389/fnhum.2018.00246
Hong, K.-S., Aziz, N., and Ghafoor, U. (2018a). Motor-commands decoding using peripheral nerve signals: a review. J. Neural. Eng. 15:031004. doi: 10.1088/1741-2552/aab383
Hong, K.-S., Naseer, N., and Kim, Y. H. (2014). Classification of prefrontal and motor cortex signals for three-class fNIRS-BCI. Neurosci. Lett. 587, 87–92. doi: 10.1016/j.neulet.2014.12.029
Hong, K.-S., and Santosa, H. (2016). Decoding four different sound-categories in the auditory cortex using functional near-infrared spectroscopy. Hear. Res. 333, 157–166. doi: 10.1016/j.heares.2016.01.009
Hong, K.-S., and Zafar, A. (2018). Existence of initial dip for BCI: an illusion or reality. Front. In Neurorobot. 12:69. doi: 10.3389/fnbot.2018.00069
Ieracitano, C., Mammone, N., Bramanti, A., Hussain, A., and Morabito, F. C. (2018). A convolutional neural network approach for classification of dementia stages based on 2D-spectral representation of EEG recordings. Neurocomputing 323, 96–107. doi: 10.1016/j.neucom.2018.09.071
Iqbal, M., Rehan, M., and Hong, K.-S. (2018). Robust adaptive synchronization of ring configured uncertain chaotic fitzhugh-nagumo neurons under direction-dependent coupling. Front. Neurorobot. 12:6. doi: 10.3389/fnbot.2018.00006
Johnson, S. C., Schmitz, T. W., Moritz, C. H., Meyerand, M. E., Rowley, H. A., Alexander, A. L., et al. (2006). Activation of brain regions vulnerable to Alzheimer’s disease: the effect of mild cognitive impairment. Neurobiol. Aging 27, 1604–1612. doi: 10.1016/j.neurobiolaging.2005.09.017
Jung, E. S., Lee, J. H., Kim, H. T., Park, S. S., Kim, J. E., Kim, J. E., et al. (2018). Effect of acupuncture on patients with mild cognitive impairment assessed using functional near-infrared spectroscopy on week 12 (close-out): a pilot study protocol. Integr. Med. Res. 7, 287–295. doi: 10.1016/j.imr.2018.06.002
Kane, M. J., Conway, A. R. A., Miura, T. K., and Colflesh, G. J. H. (2007). Working memory, attention control, and the n-back task: a question of construct validity. J. Exp. Psychol. Learn. Mem. Cogn. 33, 615–622. doi: 10.1037/0278-7393.33.3.615
Katzorke, A., Zeller, J. B. M., Müller, L. D., Lauer, M., Polak, T., Deckert, J., et al. (2018). Decreased hemodynamic response in inferior frontotemporal regions in elderly with mild cognitive impairment. Neuroimaging 274, 11–18. doi: 10.1016/j.pscychresns.2018.02.003
Katzorke, A., Zeller, J. B. M., Müller, L. D., Lauer, M., Polak, T., Reif, A., et al. (2017). Reduced activity in the right inferior frontal gyrus in elderly APOE-E4 carriers during a verbal fluency task. Front. Hum. Neurosci. 11:46. doi: 10.3389/fnhum.2017.00046
Keage, H. A. D., Churches, O. F., Kohler, M., Pomeroy, D., Luppino, R., Bartolo, M. L., et al. (2012). Cerebrovascular function in aging and dementia: a systematic review of transcranial doppler studies. Dement. Geriatr. Cogn. Dis. Extra. 2, 258–270. doi: 10.1159/000339234
Khan, M. J., Ghafoor, U., and Hong, K.-S. (2018). Early detection of hemodynamic responses using EEG: a hybrid EEG-fNIRS study. Front. Hum. Neurosci. 12:479. doi: 10.3389/fnhum.2018.00479
Khan, M. J., and Hong, K.-S. (2015). Passive BCI based on drowsiness detection: an fNIRS study. Biomed. Opt. Express. 6, 4063–4078. doi: 10.1364/BOE.6.004063
Khan, M. J., and Hong, K.-S. (2017). Hybrid EEG-fNIRS-based eight-command decoding for BCI: application to quadcopter control. Front. Neurorobot. 11:6. doi: 10.3389/fnbot.2017.00006
Khan, M. J., Hong, M. J., and Hong, K.-S. (2014). Decoding of four movement directions using hybrid NIRS-EEG brain-computer interface. Front. Hum. Neurosci. 244:8. doi: 10.3389/fnhum.2014.00244
Khazaee, A., Ebrahimzadeh, A., and Babajani-Feremi, A. (2017). Classification of patients with MCI and AD from healthy controls using directed graph measures of resting-state fMRI. Behav. Brain Res. 322, 339–350. doi: 10.1016/J.BBR.2016.06.043
Kim, H. H., Park, J. K., Oh, J. H., and Kang, D. J. (2017). Multi-task convolutional neural network system for license plate recognition. Int. J. Control Autom. Syst. 15, 2942–2949. doi: 10.1007/s12555-016-0332-z
Labaer, J. (2005). So, you want to look for biomarkers - (Introduction to the special biomarkers issue). J. Proteome Res. 4, 1053–1059. doi: 10.1021/pr0501259
Li, R., Rui, G., Chen, W., Li, S., Schulz, P. E., and Zhang, Y. (2018). Early detection of Alzheimer’s disease using non-invasive near-infrared spectroscopy. Front. Aging Neurosci. 10:366. doi: 10.3389/fnagi.2018.00366
Li, X., Zhu, Z., Zhao, W., Sun, Y., Wen, D., Xie, Y., et al. (2018). Decreased resting-state brain signal complexity in patients with mild cognitive impairment and Alzheimer’s disease: a multi-scale entropy analysis. Biomed. Opt. Express. 9, 1916–1929. doi: 10.1364/BOE.9.001916
Li, X. F., Fang, J. A., and Li, H. Y. (2018). Exponential synchronization of stochastic memristive recurrent neural networks under alternate state feedback control. Int. J. Control Autom. Syst. 16, 2859–2869. doi: 10.1007/s12555-018-0225-4
Liu, P. L. (2018). Further improvement on delay-range-dependent stability criteria for delayed recurrent neural networks with interval time-varying delays. Int. J. Control Autom. Syst. 16, 1186–1193. doi: 10.1007/s12555-016-0359-1
Liu, X., and Hong, K.-S. (2017). Detection of primary RGB colors projected on a screen using fNIRS. J. Innov. Opt. Health Sci. 10:1750006. doi: 10.1142/s1793545817500067
Marmarelis, V. Z., Shin, D. C., Tarumi, T., and Zhang, R. (2017). Comparison of model-based indices of cerebral autoregulation and vasomotor reactivity using transcranial doppler versus near-infrared spectroscopy in patients with amnestic mild cognitive impairment. J. Alzheimers Dis. 56, 89–105. doi: 10.3233/JAD-161004
Minkova, L., Habich, A., Peter, J., Kaller, C. P., Eickhoff, S. B., and Klöppel, S. (2017). Gray matter asymmetries in aging and neurodegeneration: a review and meta-analysis. Hum. Brain Mapp. 38, 5890–5904. doi: 10.1002/hbm.23772
Moon, J., Kim, H., and Lee, B. (2018). View-point invariant 3d classification for mobile robots using a convolutional neural network. Int. J. Control Autom. Syst. 16, 2888–2895. doi: 10.1007/s12555-018-0182-y
Naseer, N., and Hong, K.-S. (2015). fNIRS-based brain-computer interfaces: a review. Front. Hum. Neurosci. 9:172. doi: 10.3389/fnhum.2015.00003
Naseer, N., Noori, F. M., Qureshi, N. K., and Hong, K.-S. (2016). Determining optimal feature-combination for LDA classification of functional near-infrared spectroscopy signals in brain-computer interface application. Front. Hum. Neurosci. 10:237. doi: 10.3389/fnhum.2016.00237
Nestor, P. J., Scheltens, P., and Hodges, J. R. (2004). Advances in the early detection of Alzheimer’s disease. Nat. Med. 10, S34–S41. doi: 10.1038/nrn1433
Nguyen, C. T., Couture, M. C., Alvarado, B. E., and Zunzunegui, M. V. (2008). Life course socioeconomic disadvantage and cognitive function among the elderly population of seven capitals in latin america and the Caribbean. J. Aging Health 20, 347–362. doi: 10.1177/0898264308315430
Nguyen, H.-D., and Hong, K.-S. (2016). Bundled-optode implementation for 3D imaging in functional near-infrared spectroscopy. Biomed. Opt. Express. 7, 3491–3507. doi: 10.1364/BOE.7.003491
Nguyen, Q. C., Piao, M., and Hong, K.-S. (2018). Multivariable adaptive control of the rewinding process of a roll-to-roll system governed by hyperbolic partial differential equations. Int. J. Control Autom. Syst. 16, 2177–2186. doi: 10.1007/s12555-017-0205-0
Niu, H. J., Li, X., Chen, Y. J., Ma, C., Zhang, J. Y., and Zhang, Z. J. (2013). Reduced frontal activation during a working memory task in mild cognitive impairment: a non-invasive near-infrared spectroscopy study. CNS Neurosci. Ther. 19, 125–131. doi: 10.1109/SIBGRAPI.2001.963071
Ou, M., Wei, H., Zhang, Y., and Tan, J. (2019). A dynamic adam based deep neural network for fault diagnosis of oil-immersed power transformers. Energies 12:995. doi: 10.3390/en12060995
Park, D. C., and Reuter-Lorenz, P. (2009). The adaptive brain: aging and neurocognitive scaffolding. Annu. Rev. Psychol. 60, 173–196. doi: 10.1146/annurev.psych.59.103006.093656
Perpetuini, D., Bucco, R., Zito, M., and Merla, A. (2017). Study of memory deficit in Alzheimer’s disease by means of complexity analysis of fNIRS signal. Neurophotonics 5:011010. doi: 10.1117/1.NPh.5.1.011010
Pinti, P., Merla, A., Aichelburg, C., Lind, F., Power, S., Swingler, E., et al. (2017). A novel GLM-based method for the automatic identification of functional events (AIDE) in fNIRS data recorded in naturalistic environments. Neuroimage 155, 291–304. doi: 10.1016/j.neuroimage.2017.05.001
Pinti, P., Tachtsidis, I., Hamilton, A., Hirsch, J., Aichelburg, C., Gilbert, S., et al. (2018). The present and future use of functional near-infrared spectroscopy (fNIRS) for cognitive neuroscience. JPN. Psychol. Res. 60, 347–373. doi: 10.1111/nyas.13948
Plichta, M. M., Herrmann, M. J., Baehne, C. G., Ehlis, A. C., Richter, M. M., Pauli, P., et al. (2006). Event-related functional near-infrared spectroscopy (fNIRS): are the measurements reliable? Neuroimage 31, 116–124. doi: 10.1016/j.neuroimage.2005.12.008
Price, C. J., and Friston, K. J. (2002). Degeneracy and cognitive anatomy. Trends Cogn. Sci. 6, 416–421. doi: 10.1016/S1364-6613(02)01976-9
Privitera, C. M., and Stark, L. W. (2000). Algorithms for defining visual regions-of-lnterest: comparison with eye fixations. IEEE Trans. Pattern Anal. Mach. Intell. 22, 970–982. doi: 10.1109/34.877520
Reuter-Lorenz, P. A., Jonides, J., Smith, E. E., Hartley, A., Miller, A., Marshuetz, C., et al. (2000). Age differences in the frontal lateralization of verbal and spatial working memory revealed by PET. J. Cogn. Neurosci. 12, 174–187. doi: 10.1162/089892900561814
Salis-Perales, G., and Barajas-Ramirz, J. G. (2017). Activation of neuronal ensembles via controlled synchronization. Int. J. Control Autom. Syst. 15, 122–128. doi: 10.1007/s12555-015-0203-z
Sanchez, E. N., Rodriguez-Castellanos, D. I., Chen, G., and Ruiz-Cruz, R. (2017). Pinning control of complex network synchronization: a recurrent neural network approach. Int. J. Control. Autom. Syst. 15, 1405–1414. doi: 10.1007/s12555-016-0364-4
Sassaroli, A., and Fantini, S. (2004). Comment on the modified Beer–Lambert law for scattering media. Phys. Med. Biol. 49, N255–N257. doi: 10.1088/0031-9155/49/14/N07
Strangman, G. E., Li, Z., and Zhang, Q. (2013). Depth sensitivity and source-detector separations for near infrared spectroscopy based on the colin27 brain template. PLoS One 8:e66319. doi: 10.1371/journal.pone.0066319
Stuart, S., Vitorio, R., Morris, R., Martini, D. N., Fino, P. C., and Mancini, M. (2018). Cortical activity during walking and balance tasks in older adults and in people with Parkinson’s disease: a structured review. Maturitas 113, 53–72. doi: 10.1016/j.maturitas.2018.04.011
Tak, S., and Ye, J. C. (2014). Statistical analysis of fNIRS data: a comprehensive review. Neuroimage 85, 72–91. doi: 10.1016/J.NEUROIMAGE.2013.06.016
Tang, W., Cha, H., Wei, M., Tian, B., and Ren, X. (2019). An atmospheric refractivity inversion method based on deep learning. Results Phys. 12, 582–584. doi: 10.1016/j.rinp.2018.12.014
Trakoolwilaiwan, T., Lee, J., Choi, J., Trakoolwilaiwan, T., Behboodi, B., Lee, J., et al. (2019). Convolutional neural network for high-accuracy functional near- infrared spectroscopy in a brain – computer interface: three-class classification of rest, right-, and left- hand motor execution functional near-infrared spectroscopy in. Neurophotonics 5:011008. doi: 10.1117/1.NPh.5.1.011008
Uemura, K., Doi, T., Shimada, H., Makizako, H., Park, H., and Suzuki, T. (2016). Age-related changes in prefrontal oxygenation during memory encoding and retrieval. Geriatr Gerontol Int. 16, 1296–1304. doi: 10.1111/ggi.12642
Valenzuela, O., Jiang, X. J., Carrillo, A., and Rojia, I. (2018). Multi-objective genetic algorithms to find most relevant volumes of the brain related to Alzheimer’s disease and mild cognitive impairment. Int. J. Neural Syst. 28:1850022. doi: 10.1142/S0129065718500223
Vermeij, A., Kessels, R. P. C., Heskamp, L., Simons, E. M. F., Dautzenberg, P. L. J., and Claassen, J. A. H. R. (2017). Prefrontal activation may predict working-memory training gain in normal aging and mild cognitive impairment. Brain Imaging Behav. 11, 141–154. doi: 10.1007/s11682-016-9508-7
Whiteside, D. M., Kealey, T., Semla, M., Luu, H., Rice, L., Basso, M. R., et al. (2016). Verbal fluency: language or executive function measure? Appl. Neuropsychol. Adult 23, 29–34. doi: 10.1080/23279095.2015.1004574
Yap, K. H., Ung, W. C., Ebenezer, E. G. M., Nordin, N., Chin, P. S., Sugathan, S., et al. (2017). Visualizing hyperactivation in neurodegeneration based on prefrontal oxygenation: a comparative study of mild Alzheimer’s disease, mild cognitive impairment, and healthy controls. Front. Aging Neurosci. 9:287. doi: 10.3389/fnagi.2017.00287
Yazdani, M., Salarieh, H., and Foumani, M. S. (2018). Bio-inspired decentralized architecture for walking of a 5-link biped robot with compliant knee joints. Int. J. Control Autom. Syst. 16, 2935–2947. doi: 10.1007/s12555-017-0578-0
Yennu, A., Tian, F., Gatchel, R. J., and Liu, H. (2016). Prefrontal hemodynamic mapping by functional near-infrared spectroscopy in response to thermal stimulations over three body sites. Neurophotonics 3:045008. doi: 10.1117/1.NPh.3.4.045008
Yeung, M. K., Sze, S. L., Woo, J., Kwok, T., Shum, D. H. K., Yu, R., et al. (2016b). Reduced frontal activations at high working memory load in mild cognitive impairment: near-infrared spectroscopy. Dement. Geriatr. Cogn. Disord. 42, 278–296. doi: 10.1159/000450993
Yeung, M. K., Sze, S. L., Woo, J., Kwok, T., Shum, D. H. K., Yu, R., et al. (2016a). Altered frontal lateralization underlies the category fluency deficits in older adults with mild cognitive impairment: a near-infrared spectroscopy study. Front. Aging Neurosci. 8:59. doi: 10.3389/fnagi.2016.00059
Yi, G., Mao, J. X., Wang, Y. N., Guo, S. Y., and Miao, Z. Q. (2018). Adaptive tracking control of nonholonomic mobile manipulators using recurrent neural networks. Int. J. Control Autom. Syst. 16, 1390–1403. doi: 10.1007/s12555-017-0309-6
Zafar, A., and Hong, K.-S. (2017). Detection and classification of three-class initial dips from prefrontal cortex. Biomed. Opt. Express. 8, 367–383. doi: 10.1364/BOE.8.000367
Keywords: functional near-infrared spectroscopy (fNIRS), mild cognitive impairment (MCI), linear discriminant analysis (LDA), convolutional neural network (CNN), neural degeneration
Citation: Yang D, Hong K-S, Yoo S-H and Kim C-S (2019) Evaluation of Neural Degeneration Biomarkers in the Prefrontal Cortex for Early Identification of Patients With Mild Cognitive Impairment: An fNIRS Study. Front. Hum. Neurosci. 13:317. doi: 10.3389/fnhum.2019.00317
Received: 08 May 2019; Accepted: 26 August 2019;
Published: 06 September 2019.
Edited by:
Chang-Hwan Im, Hanyang University, South KoreaReviewed by:
Hendrik Santosa, University of Pittsburgh, United StatesYingchun Zhang, University of Houston, United States
Copyright © 2019 Yang, Hong, Yoo and Kim. This is an open-access article distributed under the terms of the Creative Commons Attribution License (CC BY). The use, distribution or reproduction in other forums is permitted, provided the original author(s) and the copyright owner(s) are credited and that the original publication in this journal is cited, in accordance with accepted academic practice. No use, distribution or reproduction is permitted which does not comply with these terms.
*Correspondence: Keum-Shik Hong, a3Nob25nQHB1c2FuLmFjLmty