 Artemis Zavaliangos-Petropulu1†,
  Talia M. Nir1†,
  Sophia I. Thomopoulos1,
  Robert I. Reid2, Matt A. Bernstein3, Bret Borowski3, Clifford R. Jack Jr.3, Michael W. Weiner4,
  Neda Jahanshad1,
  Paul M. Thompson1* and the Alzheimer’s Disease Neuroimaging Initiative (ADNI)‡
- 1Imaging Genetics Center, Mark & Mary Stevens Neuroimaging & Informatics Institute, Keck School of Medicine, University of Southern California, Marina del Rey, CA, United States
- 2Department of Information Technology, Mayo Clinic and Foundation, Rochester, MN, United States
- 3Department of Radiology, Mayo Clinic, Rochester, MN, United States
- 4Department of Radiology, School of Medicine, University of California, San Francisco, San Francisco, CA, United States
Brain imaging with diffusion-weighted MRI (dMRI) is sensitive to microstructural white matter (WM) changes associated with brain aging and neurodegeneration. In its third phase, the Alzheimer’s Disease Neuroimaging Initiative (ADNI3) is collecting data across multiple sites and scanners using different dMRI acquisition protocols, to better understand disease effects. It is vital to understand when data can be pooled across scanners, and how the choice of dMRI protocol affects the sensitivity of extracted measures to differences in clinical impairment. Here, we analyzed ADNI3 data from 317 participants (mean age: 75.4 ± 7.9 years; 143 men/174 women), who were each scanned at one of 47 sites with one of six dMRI protocols using scanners from three different manufacturers. We computed four standard diffusion tensor imaging (DTI) indices including fractional anisotropy (FADTI) and mean, radial, and axial diffusivity, and one FA index based on the tensor distribution function (FATDF), in 24 bilaterally averaged WM regions of interest. We found that protocol differences significantly affected dMRI indices, in particular FADTI. We ranked the diffusion indices for their strength of association with four clinical assessments. In addition to diagnosis, we evaluated cognitive impairment as indexed by three commonly used screening tools for detecting dementia and AD: the AD Assessment Scale (ADAS-cog), the Mini-Mental State Examination (MMSE), and the Clinical Dementia Rating scale sum-of-boxes (CDR-sob). Using a nested random-effects regression model to account for protocol and site, we found that across all dMRI indices and clinical measures, the hippocampal-cingulum and fornix (crus)/stria terminalis regions most consistently showed strong associations with clinical impairment. Overall, the greatest effect sizes were detected in the hippocampal-cingulum (CGH) and uncinate fasciculus (UNC) for associations between axial or mean diffusivity and CDR-sob. FATDF detected robust widespread associations with clinical measures, while FADTI was the weakest of the five indices for detecting associations. Ultimately, we were able to successfully pool dMRI data from multiple acquisition protocols from ADNI3 and detect consistent and robust associations with clinical impairment and age.
Introduction
Alzheimer’s disease (AD) is the most common type of dementia, affecting approximately 10% of the population over age 65 (Alzheimer’s Association, 2018). As life expectancy increases, there is an ever-increasing need for sensitive biomarkers of AD—to better understand the disease, and to serve as surrogate markers of disease burden for use in treatment and prevention trials. The Alzheimer’s Disease Neuroimaging Initiatve (ADNI) is an ongoing large-scale, multi-center, longitudinal study designed to improve methods for clinical trials by identifying brain imaging, clinical, cognitive, and molecular biomarkers of AD and aging. Now in its third phase (ADNI3), ADNI continues to incorporate newer technologies as they become established (Jack et al., 2015); data from ADNI, collected at participating sites across the U.S. and Canada, is publicly available and has been used in a diverse range of publications (Veitch et al., 2019).
ADNI’s second phase (ADNI2) introduced to the initiative the use of diffusion-weighted MRI (dMRI) as an additional approach for tracking AD progression (Jack et al., 2015). dMRI has since been used in numerous studies to understand the effects of AD on white matter (WM) microstructure and brain connectivity (Daianu et al., 2013a,b; Nir et al., 2013; Prasad et al., 2013). Some of these approaches use scalar dMRI measures to evaluate microstructural WM changes not detectable with anatomical T1-weighted images (Giulietti et al., 2018), while others use tractography and graph-theory analysis to study abnormalities in structural brain networks (Nir et al., 2015; Hu et al., 2016; Maggipinto et al., 2017; Sulaimany et al., 2017; Powell et al., 2018; Sanchez-Rodriguez et al., 2018). In aggregate, these studies point to WM abnormalities in AD, which may play a key role in early pathogenesis and diagnosis (Sachdev et al., 2013).
ADNI2 acquired dMRI data with one acquisition protocol from approximately one third of enrolled participants at the subset of ADNI sites that used 3 tesla General Electric (GE) scanners. To ensure that dMRI could be collected from all enrolled participants, ADNI3 developed new dMRI protocols for all GE, Siemens and Philips scanners used across ADNI sites. Now, data is being acquired with seven different dMRI acquisition protocols (see “Materials and Methods” section for details1). ADNI3 began in October 2016, and has already acquired data from over 300 participants. dMRI spatial resolution was improved between ADNI2 and ADNI3 by reducing the voxel size from 2.7 × 2.7 × 2.7 mm to 2.0 × 2.0 × 2.0 mm. While voxel size (i.e., spatial resolution) remains consistent across all seven ADNI3 protocols, angular resolution (the number of gradient directions) varies across protocols to accommodate scanner restrictions and to ensure that the multi-modal scanning session is completed in under 60 min. Although many large-scale multi-site DTI studies have obtained consistent results even when acquisition protocols across sites are not harmonized in advance (Jahanshad et al., 2013; Kochunov et al., 2014; Acheson et al., 2017; Kelly et al., 2018), differences in dMRI acquisition parameters, including vendor, voxel size, and angular resolution, are known to affect derived dMRI measures (Alexander et al., 2001; Cercignani et al., 2003; Zhan et al., 2010; Zhu et al., 2011). As a result, improved harmonization of multi-site diffusion data is of great interest (Grech-Sollars et al., 2015; Pohl et al., 2016; Palacios et al., 2017). For example, ComBat—originally developed to model and remove batch effects from genomic microarray data (Johnson et al., 2007)—was one of the most effective methods for harmonizing DTI measures in a recent comparison of such techniques (Fortin et al., 2017).
Here, we tested whether standard diffusion tensor imaging (DTI)-derived anisotropy and diffusivity indices, calculated from multiple imaging protocols in ADNI3, can be pooled and harmonized to show robust associations with age and four clinical assessments. In addition to diagnosis, cognitive impairment was assessed with three commonly used screening tools for detecting dementia and AD: the Alzheimer’s Disease Assessment Scale (ADAS-cog; Rosen et al., 1984), the Mini-Mental State Examination (MMSE; Folstein et al., 1975), and the Clinical Dementia Rating scale sum-of-boxes (CDR-sob; Berg, 1988). For the rest of the article we refer to these tools as “cognitive measures”. In addition to standard DTI indices—fractional anisotropy (FADTI), mean diffusivity (MDDTI), radial diffusivity (RDDTI), and axial diffusivity (AxDDTI)—we also evaluated a modified measure of FA, derived from the tensor distribution function (FATDF; Leow et al., 2009) which can be more sensitive to neurodegenerative disease-related WM abnormalities than FADTI across high- and low-angular resolution dMRI (Nir et al., 2017). The TDF model addresses well-established limitations of the standard single-tensor diffusion model—which cannot resolve complex profiles of WM architecture such as crossing or mixing fibers, present in up to 90% of WM voxels (Tournier et al., 2004; Descoteaux et al., 2007, 2009; Jeurissen et al., 2013).
In 24 WM regions of interest (ROIs), we ranked these five anisotropy and diffusivity indices, in terms of their strength of association with key clinical measures, to identify dMRI indices that may help understand and track AD progression. We hypothesized that the diffusion indices from ADNI2 (Nir et al., 2013, 2017) would still be associated with clinical measures of disease burden in ADNI3—despite the variation in protocols. We hypothesized that when data were pooled across ADNI3 protocols: (1) higher diffusivity and lower anisotropy in the temporal lobe WM would be most sensitive to cognitive impairment, with highest effect sizes for associations with CDR-sob; and (2) FATDF would detect associations with clinical impairment with larger effect sizes than FADTI.
Materials and Methods
ADNI Participants
Baseline MRI, DTI, diagnosis, demographics, and cognitive measures were downloaded from the ADNI database2. This analysis was performed when data collection for ADNI3 was still ongoing (May 2018), and reflects the data available on April 30, 2018. Of the 381 participants scanned to date, 55 were excluded after quality assurance: this included ensuring complete clinical and demographic information, and image-level quality control (removing scans with severe motion, missing volumes, or corrupt files). To ensure sufficient statistical power to assess differences in data collected with different protocols, we evaluated only those protocols with complete available data for at least 10 participants at the time of download; we did not assess protocol GE36, for which scans from 9 of 12 participants passed quality assurance. Details on excluded participants are outlined in Supplementary Table S1.
Three-hundred and seventeen remaining participants—from 47 scanning sites—were included in the analysis (mean age: 75.4 ± 7.9 years; 143 men, 174 women; Table 1): 211 were elderly cognitively normal (CN) controls (mean age: 74.5 ± 7.3 years; 84 men, 127 women), 84 were diagnosed with mild cognitive impairment (MCI); mean age: 76.3 ± 8.1 years; 48 men, 36 women), and 22 were diagnosed with AD (mean age: 80.6 ± 10.5 years; 11 men, 11 women). We note that two of the ADNI2 diagnostic categories—CN and significant memory concern (SMC)—are combined and identified as CN in ADNI3. ADNI2’s early and late MCI categories are combined and identified as MCI in ADNI3.
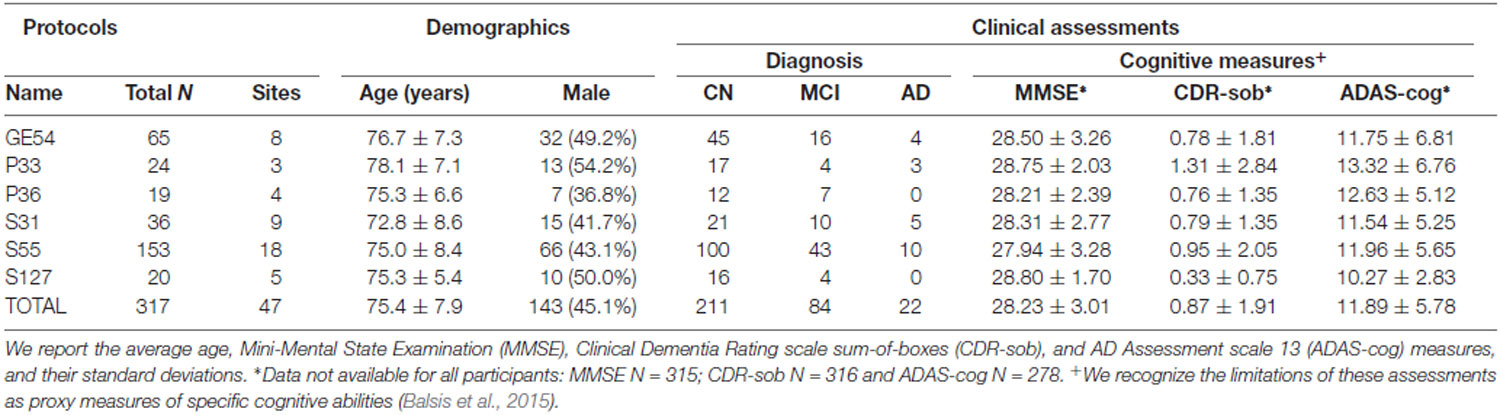
Table 1. Demographic and clinical measures for participants in Alzheimer’s Disease Neuroimaging Initiative (ADNI3), subdivided by diffusion-weighted MRI (dMRI) protocol.
Clinical Assessments
In addition to diagnosis, we indexed cognitive impairment using total scores from commonly used screening tools for detecting dementia and AD (Table 1): the Alzheimer’s Disease Assessment Scale 13 (ADAS-cog), the Mini-Mental Status Examination (MMSE), and the Clinical Dementia Rating scale sum-of-boxes (CDR-sob). We refer to these tools as “cognitive measures”, but recognize the limitations of these assessments as proxy measures of specific cognitive abilities (Balsis et al., 2015). The ADAS-cog is frequently used in pharmaceutical trials, with scores ranging from 0 to 70; higher scores represent more severe cognitive dysfunction (Rosen et al., 1984). MMSE is more often used by clinicians and researchers in assessing cognitive aging. Scores for MMSE range from 0 to 30; lower scores typically indicate greater cognitive dysfunction (Folstein et al., 1975). CDR-sob is used primarily in clinical trials and in clinical practice for evaluating disease severity including the mild and early symptomatic stages of dementia. It is calculated based on the sum of severity ratings in six domains (“boxes”)—memory, orientation, judgment and problem solving, community affairs, home and hobbies, and personal care. Scores range from 0 (no dementia) to 3 (severe dementia; Berg, 1988). These evaluations are among the measures used in diagnosing ADNI participants. Not all cognitive measures were available for every participant (MMSE, N = 315; CDR-sob, N = 316, and ADAS-cog, N = 278; Supplementary Table S2 lists these by protocol).
Diffusion MRI Acquisition Protocols
ADNI3 incorporated dMRI protocols for 3 tesla Siemens, Philips, and GE scanners. ADNI2, the first phase of ADNI to include diffusion MRI, only prescribed dMRI protocols for GE scanners. The available scanners span a wide range of software capabilities, such as support (or the lack of it) for custom diffusion gradient tables and/or simultaneous multi-slice acceleration. Including additional scanners while staying in a 7–10-min scan duration resulted in data acquired with seven different acquisition protocols—of which six had sufficient sample sizes to be evaluated here. Protocols varied in the number of diffusion weighted imaging (DWI) directions (i.e., angular resolution), and the number of non-diffusion sensitized gradients (b0 images), which serve as a reference to assess diffusion-related decay of the MR signal. Voxel size across all ADNI3 protocols was 2.0 × 2.0 × 2.0 mm and 2.7 × 2.7 × 2.7 mm in ADNI2. Table 2 summarizes the different protocols.
There is currently one multi-shell multiband protocol for Siemens Advanced Prisma scanners (S127). As ADNI3 is still in its early stages, GE and Philips protocols for multi-shell acquisition have not yet been finalized, so only 20 multi-shell scans were available for analysis at the time of writing. Here our goal was to evaluate single-shell dMRI indices across protocols, so we used a subsample of the 127 DWI volumes from the S127 multi-shell protocol to include only 13 b = 0 and 48 b = 1,000 s/mm2 DWI volumes (removing 6 b = 500 s/mm2 and 60 b = 2,000 s/mm2 volumes).
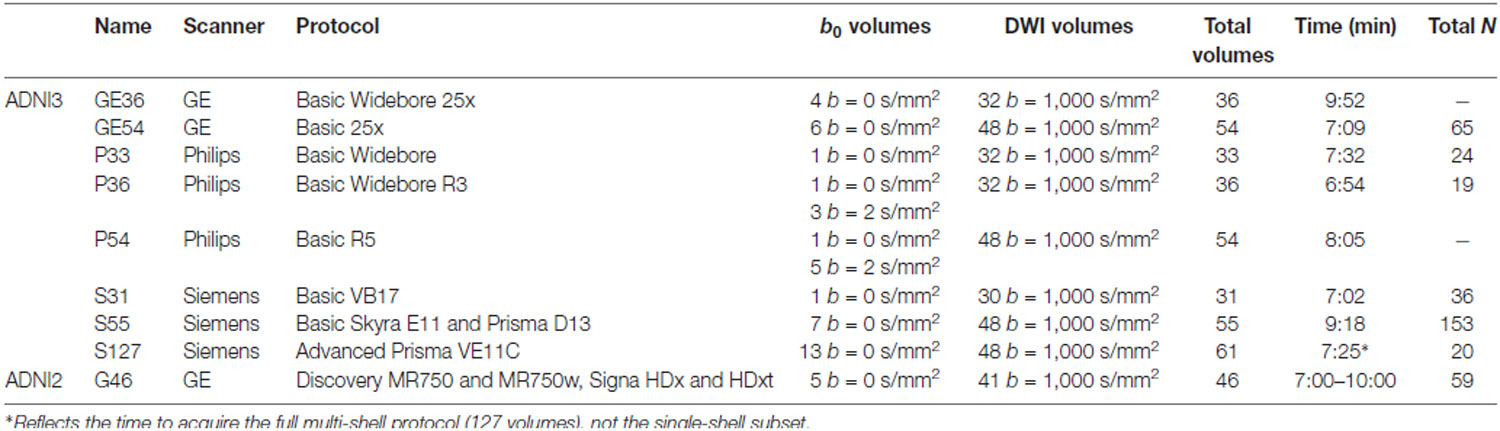
Table 2. ADNI diffusion MRI acquisition protocols.
The Philips Basic Widebore R3 protocol (P36) included three b = 2 s/mm2 volumes and one b = 0 s/mm2, because Philips scanners cannot acquire more than one b = 0 s/mm2. The Philips Basic Widebore (P33) was not a prescribed protocol, but rather acquired from Philips sites with a software version less than 5.0 that could not acquire the b = 2 s/mm2 volumes.
dMRI Preprocessing and Scalar Indices
All DWI were preprocessed using the ADNI2 DTI analysis protocol as in Nir et al. (2013). Briefly, we corrected for head motion and eddy current distortion, removed extra-cerebral tissue, and registered each participant’s DWI to the respective T1-weighted brain to correct for echo planar imaging (EPI) distortion. Details of the preprocessing steps may be found here3. All DWI and T1-weighted images were visually checked for quality assurance.
Scalar dMRI indices were derived from two reconstruction models: the single-tensor model (DTI; Basser et al., 1994) and the tensor distribution function (TDF; Leow et al., 2009). From the single-tensor model, FADTI, AxDDTI, MDDTI, and RDDTI scalar maps were generated. In contrast to DTI, the TDF represents the diffusion profile as a probabilistic mixture of tensors that optimally explain the observed diffusion data, allowing for the reconstruction of multiple underlying fibers per voxel, together with a distribution of weights, from which the TDF-derived form of FA (FATDF) was calculated (Nir et al., 2017).
White Matter Tract Atlas ROI Summary Measures
ROI measures were generated as reported previously (Nir et al., 2013). Briefly, the FA image from the Johns Hopkins University single-subject Eve atlas (JHU-DTI-SS4) was registered to each participant’s corrected FA image using an inverse consistent mutual information based registration (Leow et al., 2007); the transformation was then applied to the atlas WM parcellation map (WMPM) ROI labels (Mori et al., 2008) using nearest neighbor interpolation. Mean anisotropy and diffusivity indices were extracted from 24 WM ROIs total (Table 3): 22 ROIs averaged bilaterally, the full corpus callosum, and a summary across all ROIs (full WM).
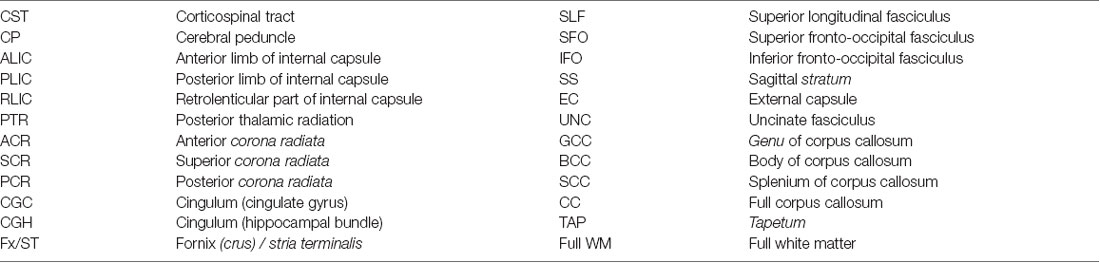
Table 3. The following 24 regions of interest (ROIs) from the Johns Hopkins University (JHU) atlas (Mori et al., 2008) were analyzed.
Comparing the ADNI2 and ADNI3 Protocols in Cognitively Normal Participants
Sample Sizes for the ADNI2 and ADNI3 Cognitively Normal Participants
We evaluated the six ADNI3 protocols and the ADNI2 protocol using scans from CN participants only. Of 85 CN participants in ADNI2 with dMRI, 30 rolled over to ADNI3. To avoid duplication, and boost the number of scans available for each protocol, we did not include all these roll-over participants in the ADNI3 group. Twenty-six CN roll-over participants were included in the ADNI3 group. Four CN roll-over participants were scanned with the S55 protocol, and due to the larger sample size already available for that protocol (N = 156), we included these four in the ADNI2 group. In total, 59 out of 85 ADNI2 CN participants were included in the ADNI2 group and the remaining 26 were kept in the ADNI3 group for a total of 207 ADNI3 CN participants (see Supplementary Table S3 for CN demographics by ADNI phase and protocol).
Assessing Age Effects
In CN participants, multivariate random-effects linear regressions were used to assess whether dMRI indices from each ADNI protocol individually were associated with age, controlling for sex and age*sex interactions as fixed variables, and acquisition site as a random variable. dMRI indices for the CN group were subsequently pooled across ADNI3 protocols (N = 207), or ADNI3 and ADNI2 protocols (N = 266) and tested for associations with age using an analogous model, but with protocol and acquisition site as nested random variables (e.g., eight sites used protocol GE54, and three sites used protocol P33, so the acquisition site grouping variable is nested within the protocol grouping variable). We used the false discovery rate (FDR) procedure to correct for multiple comparisons (q = 0.05; Benjamini and Hochberg, 1995) across the 24 ROIs assessed for each dMRI index. Regions that survive a more stringent Bonferroni correction at an alpha of 0.05 (p ≤ 0.05/24 = 0.0021) are also shown in the Supplements.
Effect of Protocol on dMRI Indices
In CN participants, we tested for significant differences in dMRI indices between the seven ADNI protocols using analyses of covariance (ANCOVAs), adjusting for age, sex, and age*sex interactions as fixed variables, and acquisition site as a random variable. For each dMRI index, we used FDR to correct for multiple comparisons across the 24 ROIs assessed. Pairwise tests were performed to directly compare protocols. In total, there were 504 tests per dMRI index: 24 ROIs * 21 pairs of protocol comparisons (protocol 1 vs. 2, protocol 1 vs. 3, etc). As before, we used FDR to account for multiple comparisons.
dMRI Harmonization With ComBat
ComBat uses an empirical Bayes framework to reduce unwanted variation in multi-site data due to differences in acquisition protocol, while preserving the desired biological variation in the data (Fortin et al., 2017). In the CN participants from ADNI2 and ADNI3, we ran ComBat on each of the dMRI indices, including age, sex, age*sex, and information from all 24 ROIs to inform the statistical properties of the protocol effects. Random-effects regressions tested for dMRI microstructural associations with age, covarying for sex and age*sex as fixed variables and site as a random variable; ANCOVAs and pairwise tests of dMRI differences between protocols were repeated for the harmonized ROI data.
Clinical Assessments and Their Relation to Pooled ADNI3 Diffusion Indices
Multivariate random-effects linear regressions were used to test associations between five dMRI indices in each of the 24 WM ROIs and the three cognitive measures (ADAS, MMSE, CDR-sob), and with diagnosis. Due to the limited available sample size of AD participants (N = 22), and their uneven distribution across the acquisition protocols tested here, we compared only groups of people with CN and MCI diagnoses. Age, sex, and age*sex interactions were controlled for as fixed effects, and the protocol and acquisition site were modeled as nested random variables. FDR was again used to correct for 24 ROI tests (q = 0.05; Benjamini and Hochberg, 1995). Bonferroni corrections (p ≤ 0.05/24 = 0.0021) are available in the Supplements. Effect sizes for associations were determined using the d-value standardized coefficient (Rosenthal and Rosnow, 1991).
Results
ADNI2 and ADNI3 Protocols in Cognitively Normal Participants
Age Effects in Cognitively Normal Participants From ADNI2 and ADNI3 Protocols
When data were pooled across ADNI2 and ADNI3, significant associations with age were detected throughout the WM. Figure 1A shows effect sizes for ROIs significantly associated with age after FDR multiple comparisons correction (tabulated results and more stringent Bonferroni thresholds are shown in Supplementary Table S4). Lower FATDF and higher diffusivity indices were significantly associated with older age in all 24 ROIs. For FADTI, 22 ROIs were significantly associated with age. The largest effect size was detected with FATDF in the fornix (crus)/stria terminalis (Fx/ST; d = −1.459; p = 5.07 × 10⁻²¹). The Fx/ST, genu of corpus callosum (GCC) and full WM consistently showed one of the 10 largest effect sizes across dMRI indices.
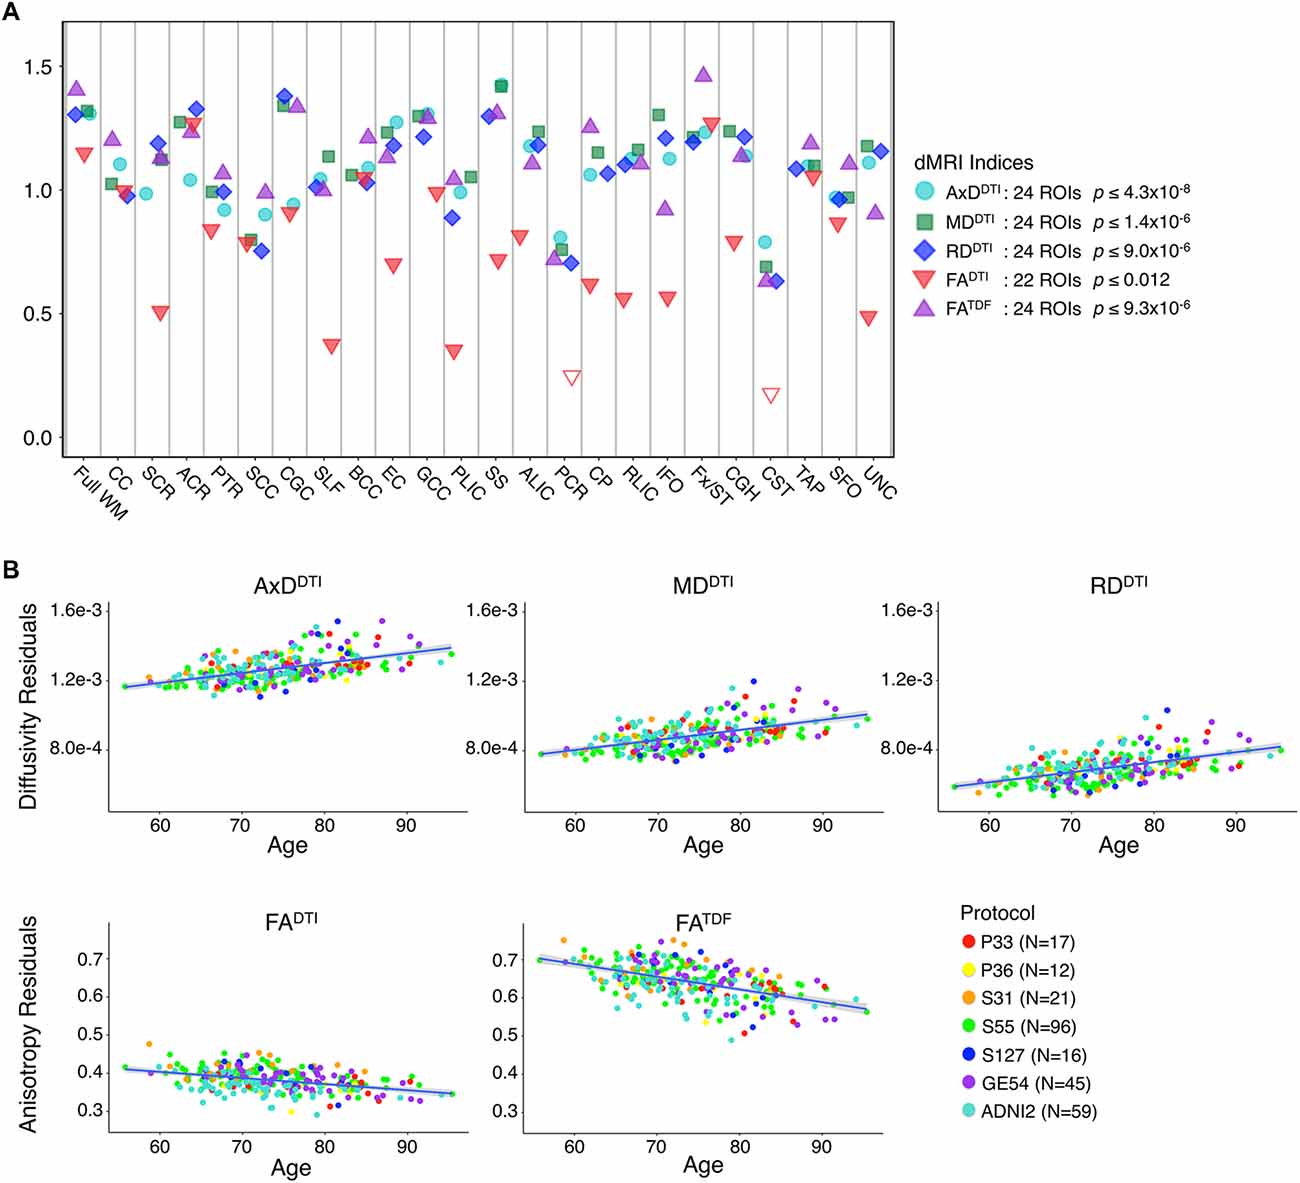
Figure 1. (A) For each diffusion-weighted MRI (dMRI) index, the absolute values of effect sizes (d-value) are plotted for regional white matter (WM) microstructural associations with age when all ADNI3 dMRI data are pooled, adjusting for any site or protocol effects. For each test, we note the number of significant regions of interest (ROIs), as indicated by filled shapes, and the corresponding false discovery rate (FDR) significance p-value threshold (q = 0.05). See Supplementary Table S4 for complete tabulated results. (B) Here, we plot the residuals of diffusivity and anisotropy indices in the full WM (y-axis) against age (x-axis) after regressing out the effects of sex in cognitively normal (CN) participants from each protocol separately. Individual level residuals from each protocol are plotted with a different color. Despite protocol differences, age effects are evident across protocols.
The mean ages of the CN participants assessed in the two phases of ADNI were significantly different (p = 0.049; ADNI2 mean age: 72.4 ± 6.6 years; ADNI3 mean age: 74.5 ± 7.4 years; demographics in Supplementary Table S3). Pairwise tests comparing the mean age of CN participants scanned with each protocol also showed significant differences between those scanned with S31 and two other protocols: GE54 and S31 (p = 0.026); P33 and S31 (p = 0.0037). Due to differences in age and sample size between protocols and phases, effect sizes could not be directly compared (Button et al., 2013), but the directions of associations with age were largely consistent for ADNI2 and ADNI3 phases separately, and each ADNI3 protocol (Figures 1, 2). Each ADNI protocol showed directionally consistent associations in more than 89% of tests (24 ROIs * 5 dMRI indices), except for P36 which was consistent in 81%, but had the smallest sample size (N = 12; Figure 2B; Supplementary Tables S5–S11). FATDF and all three diffusivity indices were consistent in ≥96% of tests (24 ROIs * 8 protocols/phases), while FADTI was only consistent in 88% of tests. Most of the associations detected in the unexpected direction for each protocol were driven by FADTI. None of the associations in the unexpected direction were significant after multiple comparisons correction, and only two had a p ≤ 0.05.
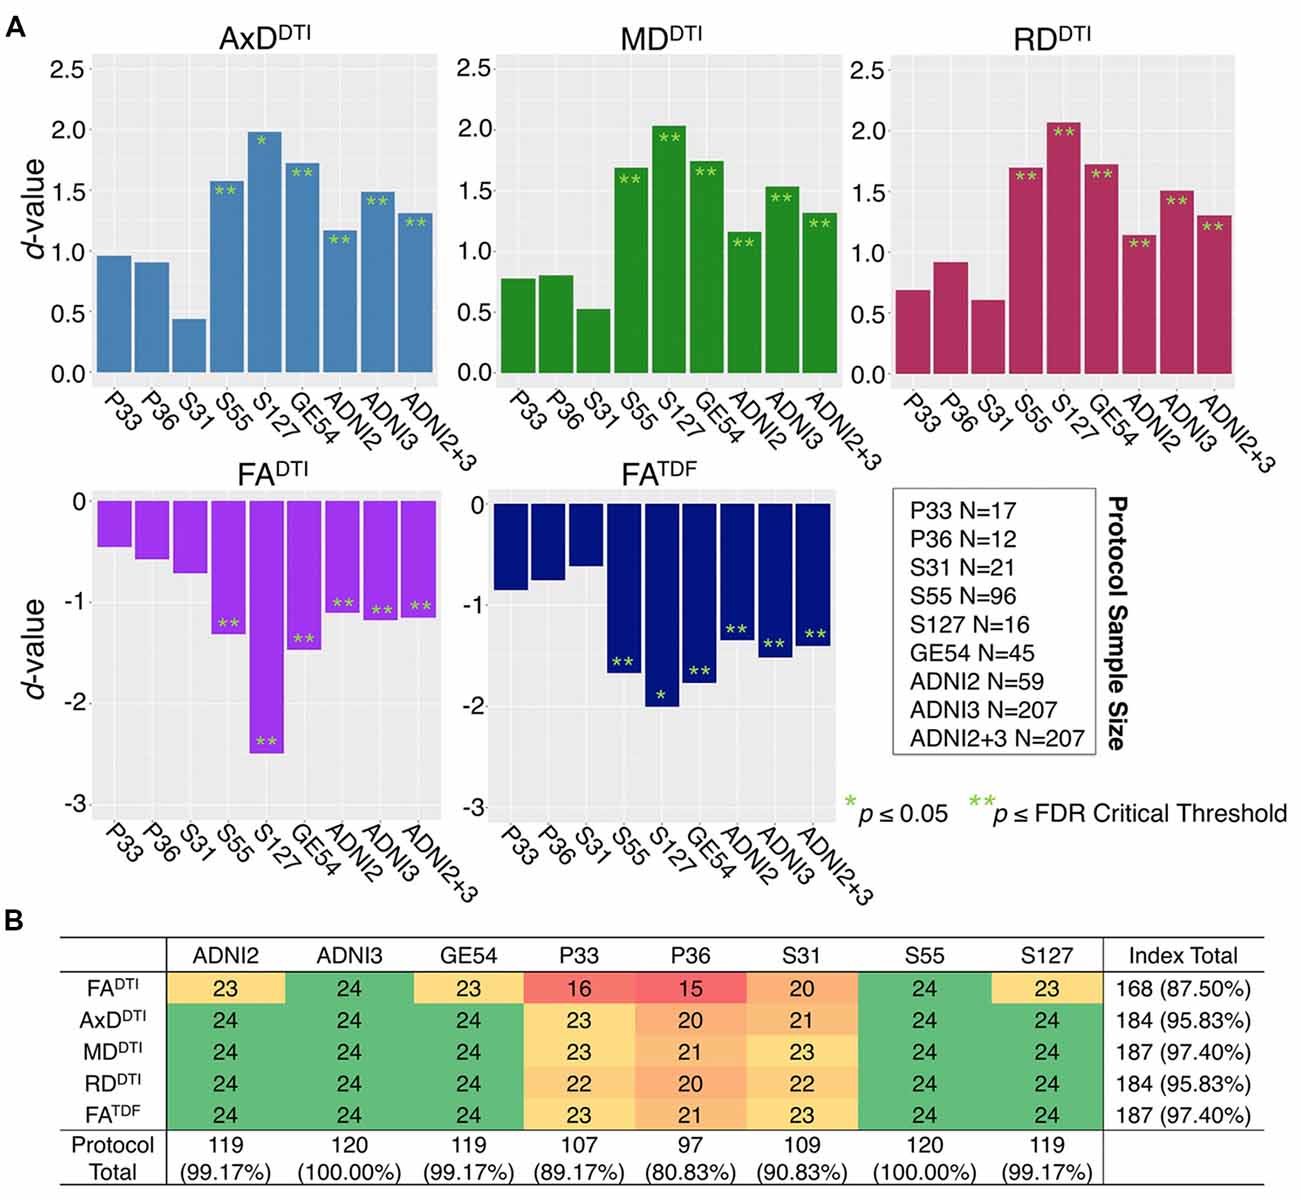
Figure 2. (A) Effect sizes (d-value) for each ADNI protocol and phase show the direction of dMRI associations with age in the full WM are consistent. Due to differences in age and sample size between protocols and phases, effect sizes could not be directly compared. (B) For each protocol and phase, the number of ROIs (out of 24), that show the expected association direction, regardless of significance, are reported for each dMRI index; consistent associations were detected across tests, except for protocol P36 which had the smallest sample size, and FADTI, which showed the smallest effect sizes and fewest significant associations across protocols when pooled.
Figure 2 shows consistent associations in the full WM by protocol. As demographic and sample size variability between protocols affect detected effect sizes, we also evaluated full WM dMRI associations with age in an age- and sex-matched subset of 12 participants from each protocol (total N = 84; demographics in Supplementary Table S3). A comparison of the effect sizes between protocols suggests that the protocols with greatest total number of diffusion-weighted (b = 1,000 s/mm2) and non-diffusion sensitized (b0) gradients may detect larger effects (S127 followed by S55; Supplementary Figure S1).
Effect of Protocol on dMRI Indices From Cognitively Normal Controls
The influence of dMRI acquisition protocol on mean values of the diffusion indices is evident in boxplots of dMRI indices in the full WM for each protocol (Figure 3). When modeling the mean full WM values for each diffusion index, the residuals of the statistical model become closer to 0 after fitting the effect of protocol and site (nested as a random variable with age, sex, and age*sex interactions as fixed effects) than when we plot the residuals of just age, sex, and age*sex interactions (Figure 3).
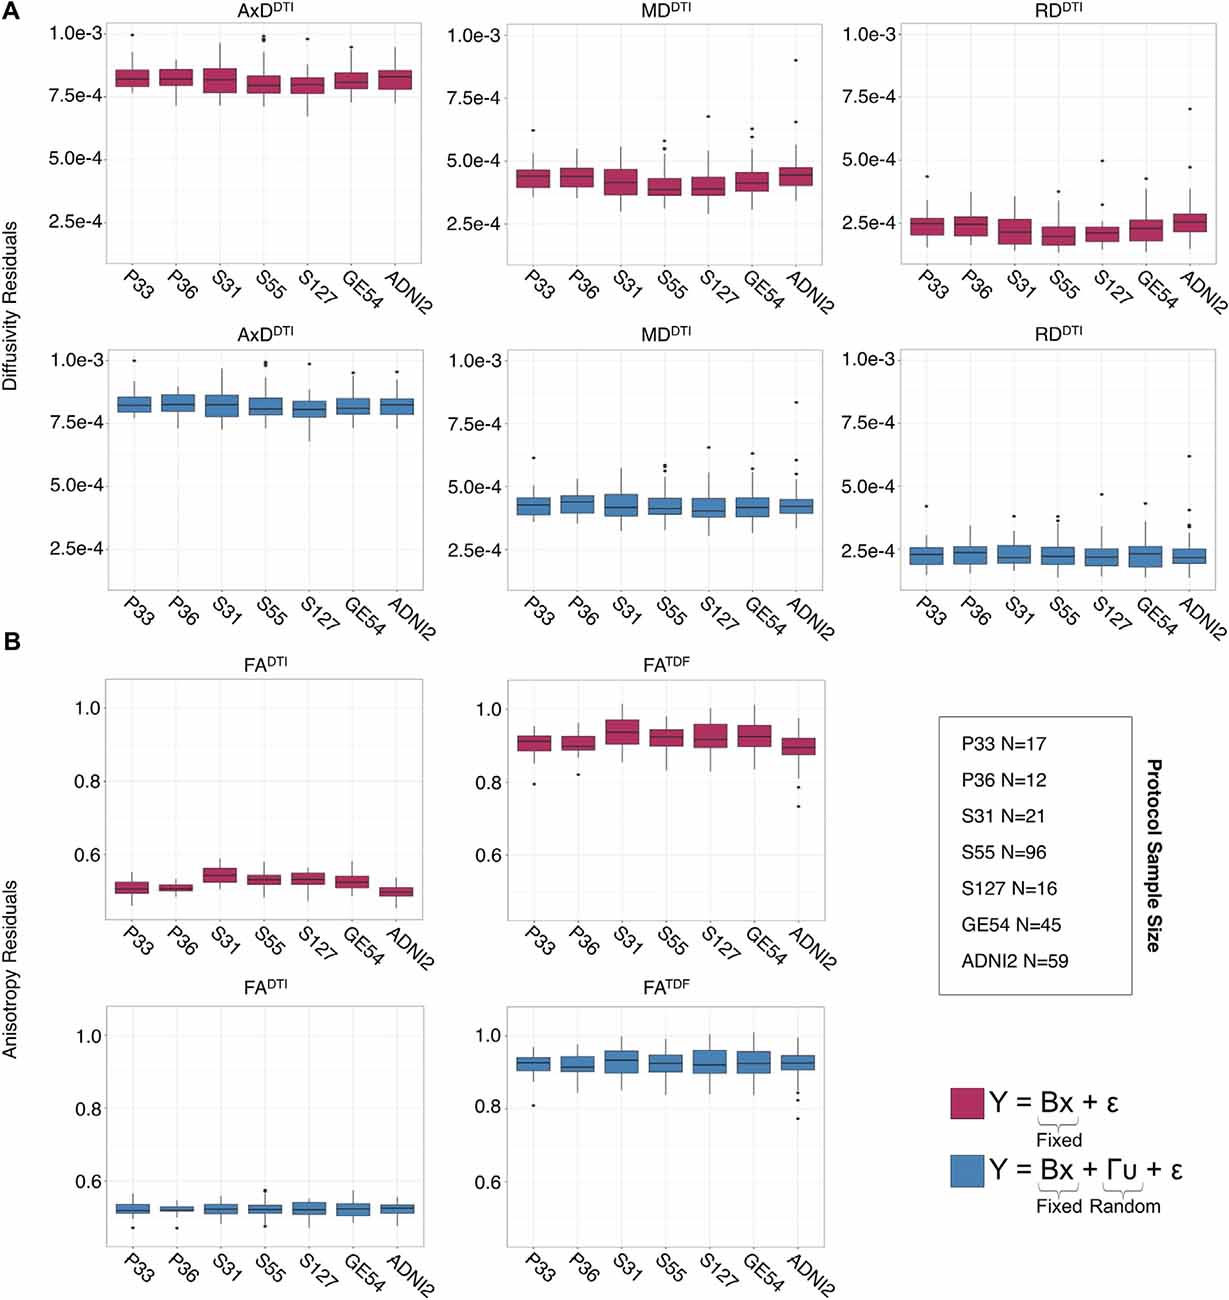
Figure 3. Full WM mean (A) AxDDTI, MDDTI, and RDDTI and (B) FADTI and FATDF residuals for each protocol, after fitting effects of age, sex, and age*sex interactions, are plotted here in the top rows (red). Protocol has an effect on anisotropy and diffusivity measures. The lower panels (blue) show residuals after additionally fitting protocol and site as nested random-effects, after which the residuals across protocols are closer to 0.
ANCOVAs and pairwise tests for each ROI suggest there are significant differences between protocols for all 5 dMRI indices across most ROIs (Figure 4). ANCOVAs revealed significant protocol differences for 22 ROIs for FADTI and FATDF, with the highest overall effect size detected in the anterior limb of the internal capsule (ALIC) and the external capsule (EC) for FADTI (ALIC: d = 0.648; EC: d = 0.652). AxDDTI had the smallest effect size, overall, in the splenium of the corpus callosum (SCC; d = 0.106), and only 13 ROIs showed significant AxDDTI differences between protocols.
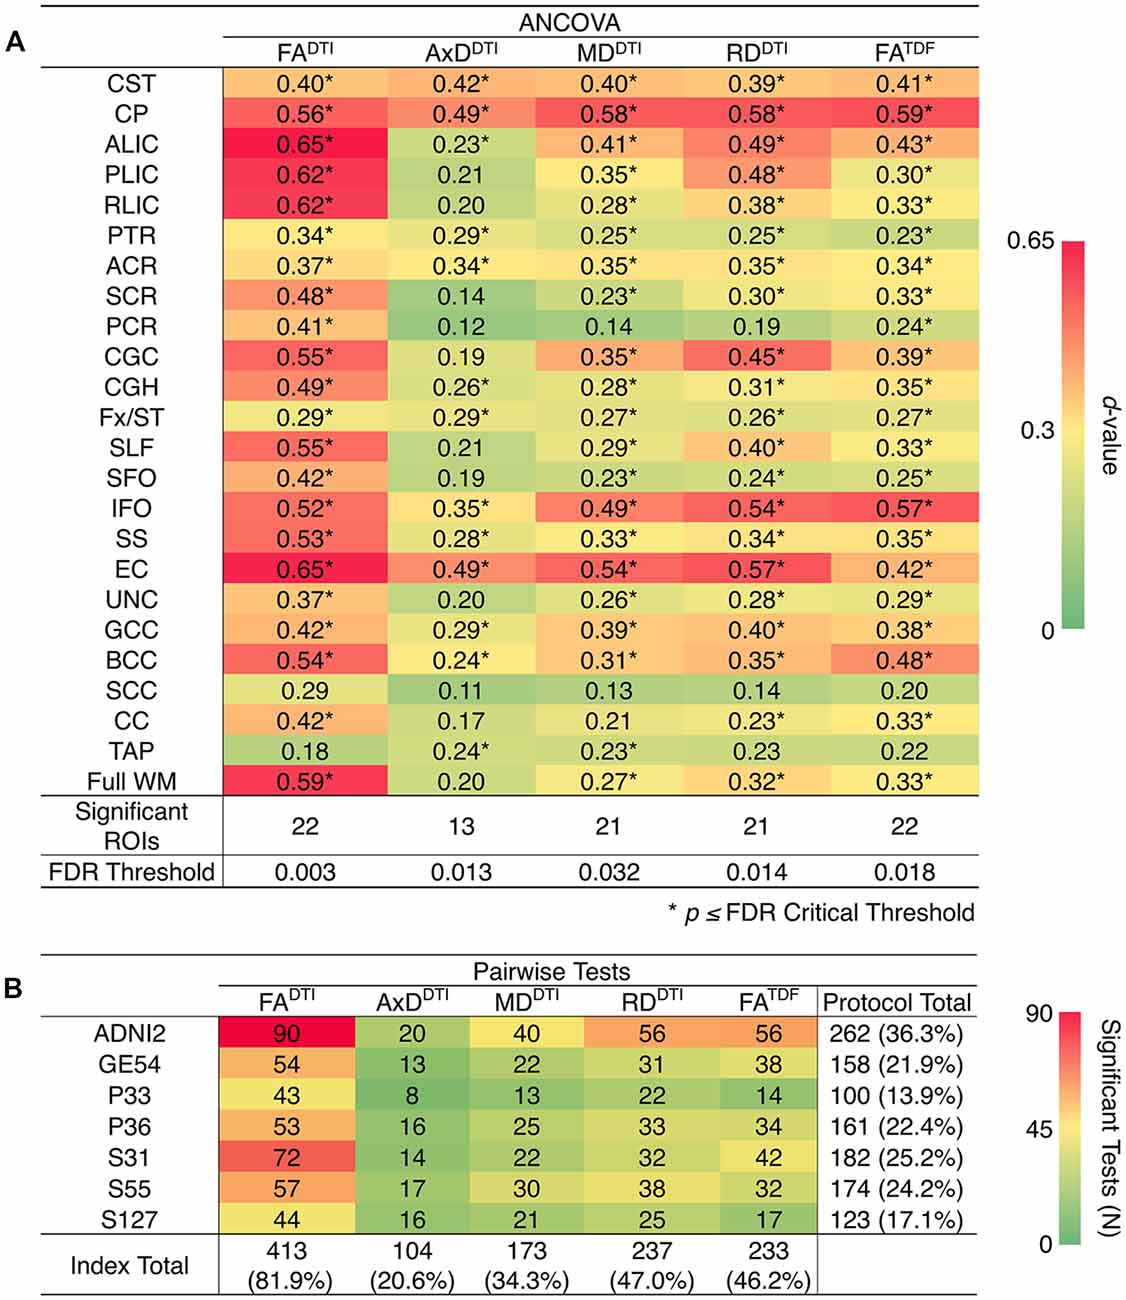
Figure 4. (A) d-values from the analyses of covariance (ANCOVAs) assessing differences in dMRI indices between protocols, for each of the 24 ROIs; FADTI showed the greatest significant differences (largest d-values; dark red) between protocols and AxDDTI the fewest (dark green). (B) We report the number of times each protocol and each dMRI index showed significant differences in pairwise tests between protocols (out of 504 tests per index and 720 tests per protocol); AxDDTI was the most stable dMRI index across protocols, while FADTI was the least stable.
In pairwise analyses, AxDDTI was the most stable index across protocols, as significant protocol differences were detected in only 20.6% of pairwise tests (24 ROIs * 21 pairwise tests), compared to FADTI, the most variable index, which showed significant protocol differences in 81.9% of tests (Figure 4B). ADNI2 was the most divergent protocol across dMRI indices, showing differences in 36.3% of tests.
Diffusion MRI Harmonization With ComBat
After using ComBat to harmonize dMRI indices across protocols, ANCOVAs revealed that significant protocol differences in dMRI indices were all but eliminated across ROIs (Supplementary Figure S2A); significant protocol differences were detected only in the CST, for each of the dMRI indices. The number of pairwise tests for which each protocol showed significant differences in dMRI indices decreased by 93.8% with ComBat (Supplementary Figure S2B).
After harmonization, we still detected significant associations between age and dMRI indices from ADNI2 and ADNI3 pooled in the same number of ROIs (Supplementary Table S12). ComBat correction did not significantly change effect sizes, while correcting for effects of protocol (Supplementary Figure S3). In Figure 5 we show effect sizes before and after harmonization with ComBat in the full WM, Fx/ST, and GCC, the three ROIs that consistently showed one of the 10 largest effect sizes for associations with age across all five diffusion indices (for changes by protocol see Supplementary Figures S4–S6). As harmonization with ComBat did not improve or change results found with random-effect linear regressions, we proceeded to test clinical associations without applying the ComBat transformation.
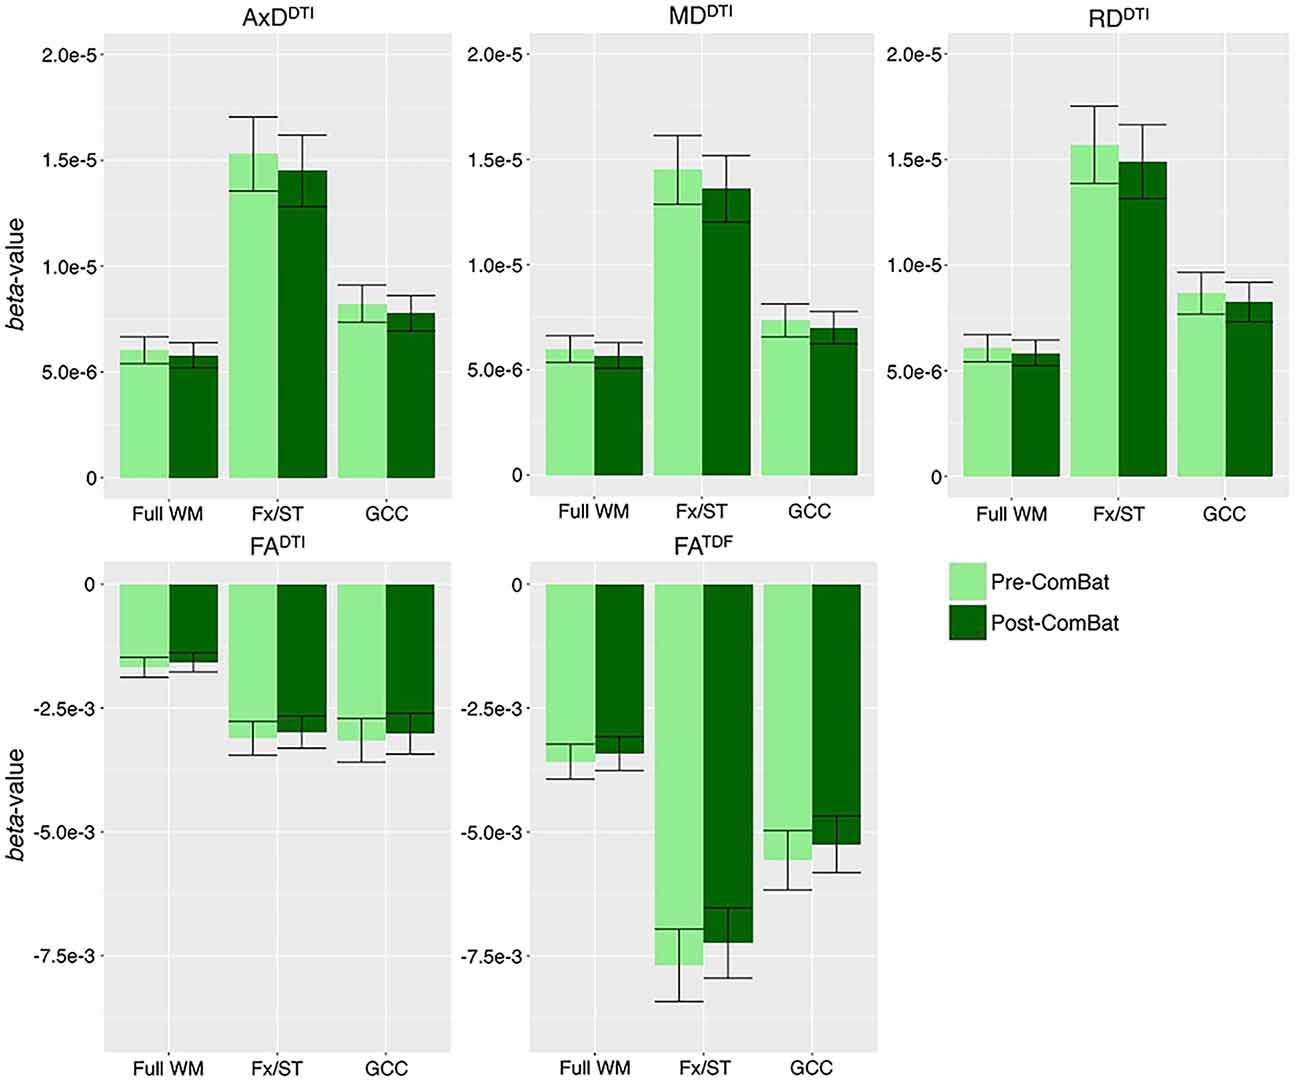
Figure 5. Beta-values and error bars representing standard error from the association between each diffusion index and age in CN participants, before and after ComBat harmonization. We show the three ROIs that consistently showed one of the 10 largest effect sizes for associations with age across all five diffusion indices (see Supplementary Figure S3 for all ROIs). Compared to pre-ComBat analyses, effect sizes are marginally different across indices, but still within the standard error.
Cognitive Measure Associations With Pooled ADNI3 dMRI Indices
Pooling data across ADNI3, we detected significant associations between all three cognitive measures and regional dMRI indices throughout the WM. Greater cognitive impairment was associated with lower anisotropy and higher diffusivity. Figures 6A–C shows effect sizes for ROIs significantly associated with each cognitive measure after FDR multiple comparisons correction (for tabulated results and more stringent Bonferroni corrections, please see Supplementary Tables S13–S15). Across tests (5 dMRI indices * 3 cognitive measures), the hippocampal-cingulum (CGH), fornix (crus)/stria terminalis region (Fx/ST), and the full WM consistently showed one of the 10 largest effect sizes (see Supplementary Figures S7–S9 for associations with indices in the CGH, Fx/ST, and full WM, by protocol). In 14 of 15 tests, the CGH consistently showed one of the top two largest effect sizes (CGH FADTI association with CDR-sob was the third largest), along with the uncinate fasciculus (UNC), which was top two in 12 of 15 tests (while significant, cognitive associations with UNC FADTI never showed one of the largest effect sizes).
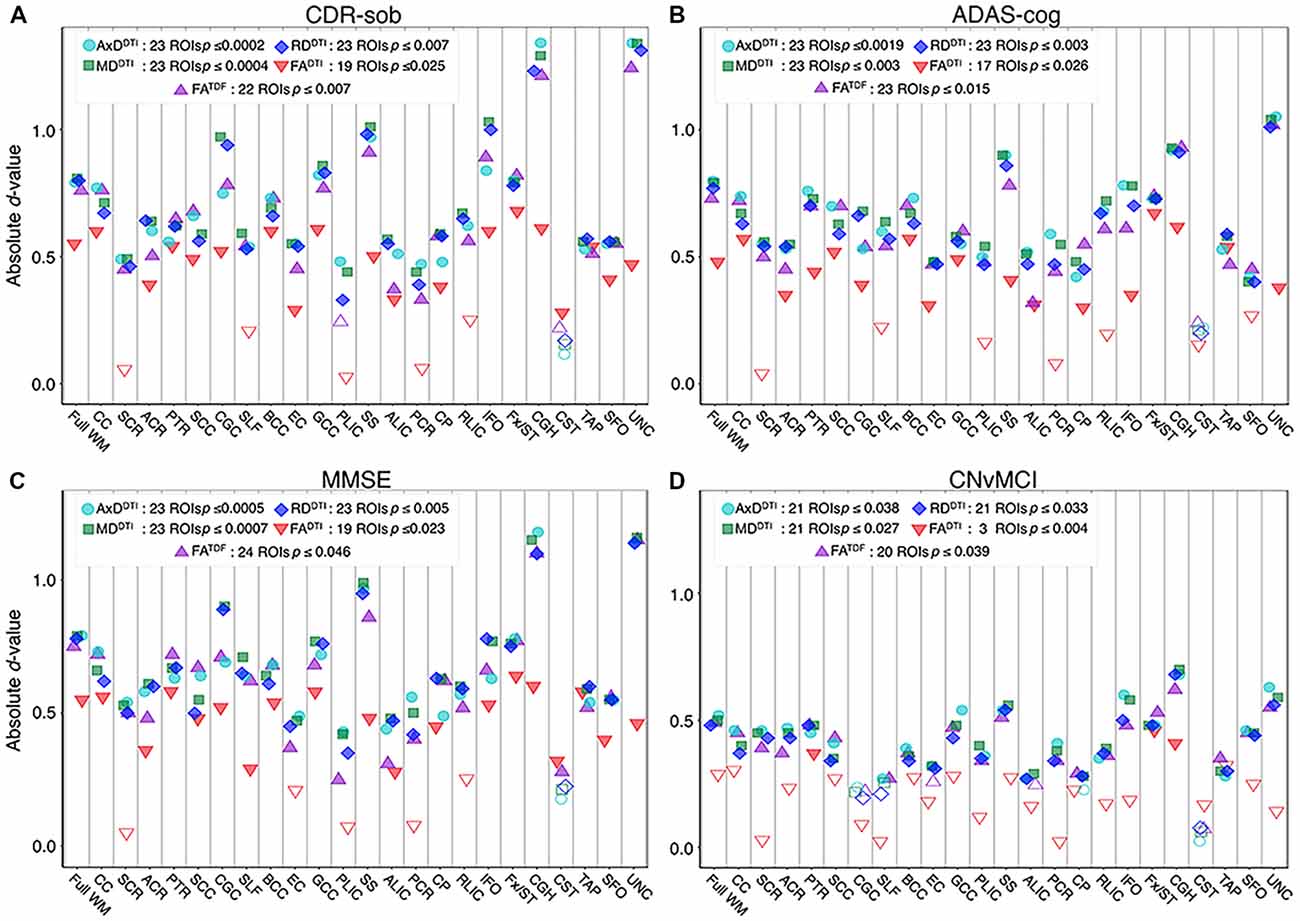
Figure 6. For each dMRI index, the absolute values of effect sizes (d-value) are plotted for regional WM microstructural associations with clinical measures. Lower anisotropy and higher diffusivity were significantly associated with (A) higher CDR-sob, (B) lower MMSE, (C) higher ADAS-cog, and (D) an MCI diagnosis, when all ADNI3 dMRI data are pooled, adjusting for any site or protocol effects. For each test, we note the number of significant ROIs, as indicated by filled shapes, and the corresponding FDR significance p-value threshold (q = 0.05). See Supplementary Tables S13–S16 for complete tabulated results.
FADTI showed significant associations in the fewest ROIs: 55 out of 72 tests (76.4%; 24 ROIs * 3 cognitive measures) were significant. FATDF showed more widespread associations with cognitive measures throughout WM ROIs: 69 out of 72 tests (94.4%) were significant. Effect sizes were consistently lower for FADTI than for the other dMRI indices, across all three cognitive measures; the largest FADTI effect sizes were most consistently found in the Fx/ST, followed by the CGH or the GCC. The strongest FADTI association overall was in the Fx/ST with CDR-sob (d = −0.681, p = 7.01 × 10⁻⁸). Compared to FADTI, FATDF showed larger effect sizes; across cognitive tests, the strongest FATDF associations were detected in the UNC with CDR-sob (d = −1.244; p = 1.39 × 10⁻²⁰), followed by the CGH (d = −1.213; p = 8.86 × 10⁻²⁰). CDR-sob effect sizes for FADTI and FATDF in the CGH, UNC, Fx/ST, and full WM are depicted by protocol in Supplementary Figure S10, revealing consistently larger effect sizes for FATDF across protocols.
Cognitive associations with all of the diffusivity indices were widespread: significant associations were detected in 207 out of 216 tests (95.8%; 24 ROIs * 3 cognitive measures * 3 diffusivity indices). Regional measures of AxDDTI consistently showed the largest effect sizes across all cognitive measures (CDR-sob and the UNC: d = 1.344, p = 3.13 × 10⁻²³; MMSE and the CGH: d = −1.178, p = 7.87 × 10⁻¹⁹; ADAS-cog and the UNC: d = 1.048, p = 1.09 × 10⁻¹³).
Of the three cognitive measures, CDR-sob associations showed the largest effect sizes across dMRI indices (in the UNC followed by the CGH for all indices except FADTI); the largest effect sizes across all tests were detected with AxDDTI (UNC: d = 1.344) and MDDTI (UNC: d = 1.342, p = 3.47 × 10⁻²³). Figure 7 shows the distribution of the effect sizes for CDR-sob throughout the brain. Temporal lobe regions (UNC, CGH, IFO, SS) frequently showed greatest effect sizes (for ADAS-cog and MMSE figures, see Supplementary Figures S11, S12). Effect size was not correlated with ROI size (Supplementary Figure S13), consistent with prior studies of other disorders (Kelly et al., 2018).
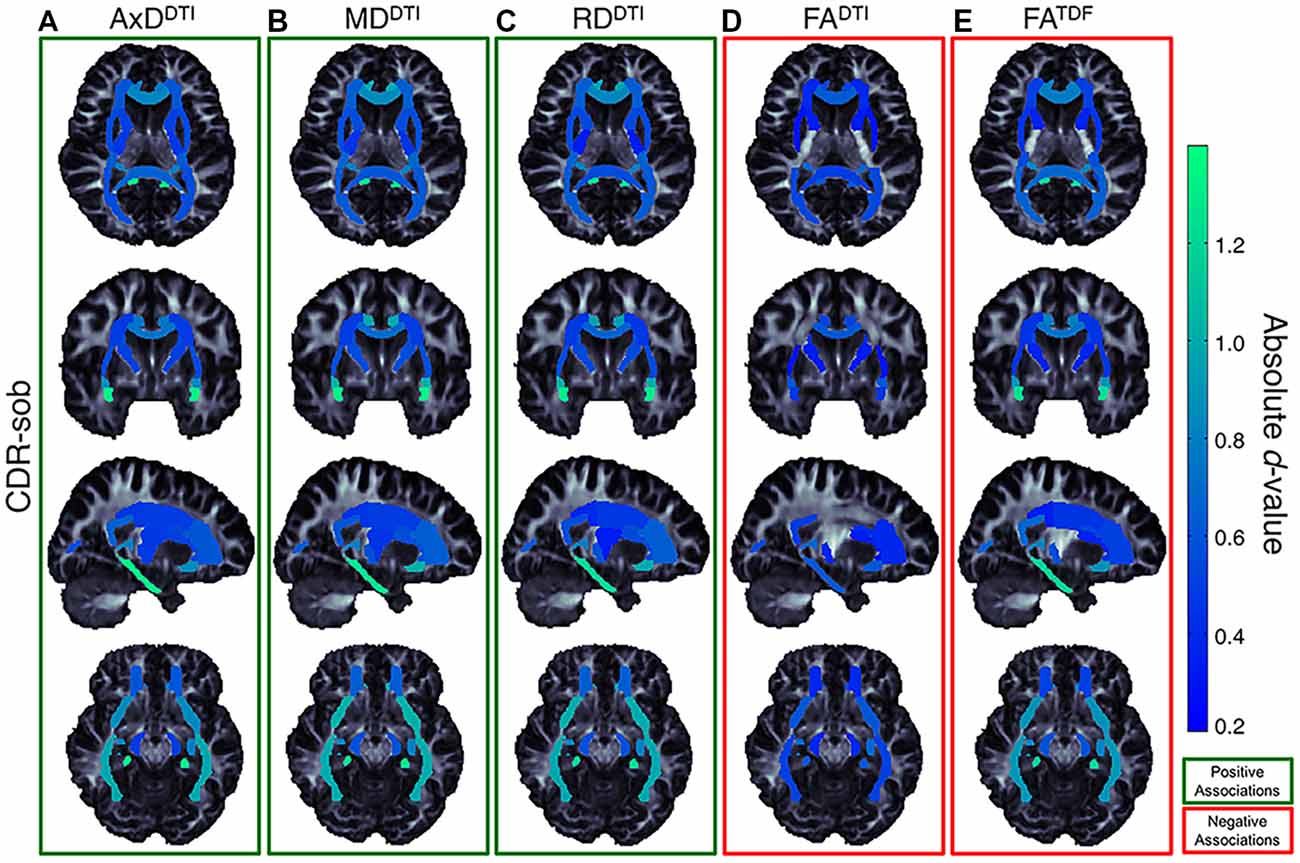
Figure 7. Effect size (absolute d-value) maps of WM regions that show significant associations with CDR-sob—the cognitive measure with the largest effect sizes—reveal widespread associations throughout the WM, with particularly strong associations in the temporal lobes (SS, IFO, UNC, and CGH; light green regions show the largest effect sizes). As expected, positive associations were detected between CDR-sob and (A) AxDDTI (FDR critical threshold p = 1.78 × 10⁻⁴; B) MDDTI (FDR critical threshold p = 3.64 × 10⁻⁴) and (C) RDDTI (FDR critical threshold p = 6.92 × 10⁻³); higher diffusivity was associated with greater cognitive impairment. Lower (D) FADTI (FDR critical threshold p = 0.025) and (E) FATDF (FDR critical threshold p = 7.73 × 10⁻³) were also associated with greater impairment, but FADTI associations were detected in fewer regions with weaker effect sizes compared to FATDF.
CN vs. MCI Diagnosis Associations With Pooled ADNI3 dMRI Indices
For each diffusion index, Figure 6D shows the significant regional effect sizes for differences between CN and MCI participants. Widespread diffusivity differences were detected, with significantly higher diffusivity in MCI participants in 21 out of 24 ROIs (Supplementary Table S16 and Supplementary Figure S14). Only three regions showed significantly lower FADTI in MCI participants—Fx/ST (d = −0.460; p = 3.89 × 10⁻⁴), CGH (d = −0.410; p = 1.53 × 10⁻³), and the posterior thalamic radiation (PTR; d = 0.367; p = 4.55 × 10⁻³). On the other hand, FATDF was significant in 20 out of 24 ROIs, similar to diffusivity indices. FATDF and diffusivity indices in the CGH showed the largest effect sizes overall (AxDDTI d = 0.681; p = 2.26 × 10⁻⁷, MDDTI d = 0.700; p = 1.15 × 10⁻⁷; RDDTI d = 0.679; p = 2.41 × 10⁻⁷; FATDF d = −0.622; p = 2.00 × 10⁻⁶).
For all three cognitive measures, and in the comparison between CN and MCI participants, the CGH and Fx/ST were the only regions that survived multiple comparisons correction across all dMRI indices. The Fx/ST always had the largest effect size in FADTI tests. The UNC showed either the first or second largest effect size (alternating with CGH) across diffusivity indices and FATDF tests, but was significant only for cognitive measure associations with FADTI (i.e., three of four clinical tests).
Discussion
This study has three main findings: (1) when data were pooled from the six available diffusion MRI protocols used in ADNI3, anisotropy and diffusivity indices showed robust associations with MCI diagnosis, and with three common cognitive measures: MMSE, ADAS-cog, and CDR-sob; (2) when using a higher-order diffusion model, the derived measure of anisotropy (FATDF) showed stronger and more widespread associations with clinical impairment than the standard DTI anisotropy measure (FADTI); and (3) despite significant differences in protocols, for each dMRI index, we were able to detect consistent associations with clinical measures in ADNI3 participants, and age in ADNI2 and ADNI3 CN participants.
Accumulation of amyloid plaques and neurofibrillary tangles (NFTs) in the brain (Braak and Braak, 1991, 1996; Frank et al., 2003; Shaw et al., 2007) can directly impact WM (Lee et al., 2004; Roth et al., 2005), promoting myelin degeneration and axonal loss (Braak and Braak, 1996; Kneynsberg et al., 2017). While many factors drive anisotropy and diffusivity measures from DTI, higher anisotropy values may indicate, in part, more coherent intact axons, while lower anisotropy and higher diffusivity may reflect factors such as axonal injury and demyelination, among other factors (Beaulieu, 2002; Song et al., 2003, 2005; Harsan et al., 2006; Le Bihan and Johansen-Berg, 2012; Kantarci et al., 2017; Moore et al., 2018). In this article, lower anisotropy values and higher diffusivity values were correlated with clinical impairment most strongly in the hippocampal-cingulum and uncinate. Along with the full WM, reflecting global WM effects, the largest effect sizes were most frequently detected in the hippocampal-cingulum and fornix (crus)/stria terminalis, WM bundles connecting hippocampal and parahippocampal regions to the rest of the brain, consistent with patterns of AD pathology. The histopathological validity of these findings has been supported, specifically in a recent study that compared NFT stages in ante-mortem MRI and post-mortem tissue; elevated MDDTI and lower FADTI significantly correlated with higher postmortem NFT stage, particularly in the crus of the fornix, the ventral cingulum tracts, the precuneus, and entorhinal WM (Kantarci et al., 2017).
The participants recruited for ADNI3 tend to be younger and healthier, on average, than those in ADNI2, as they were recruited with the intention of studying the transition from CN to AD (Jack et al., 2015). With few AD patients enrolled so far in ADNI3, the primary focus of this article was to assess three cognitive assessments (ADAS-cog, CDR-sob, and MMSE), and to compare CN to MCI participants. MCI is now the focus of intense research; it is essential to find ways to clinically categorize the transitional stages between normal aging and AD to evaluate targeted treatments, as pathophysiological mechanisms may differ or change throughout the course of AD (Mueller et al., 2005). As in our prior analysis of ADNI2 (Nir et al., 2013), FADTI was the least sensitive DTI measure. In ADNI3, AxDDTI and MDDTI showed the largest effect sizes. Lower FADTI and higher MDDTI are most frequently reported in studies of AD (Kavcic et al., 2008; Clerx et al., 2012; Nir et al., 2013; Maggipinto et al., 2017; Mayo et al., 2017), but AxDDTI may be more sensitive to unspecific microscopic cellular loss earlier in the disease (O’Dwyer et al., 2011), perhaps making it more sensitive in the healthier participants of the ADNI3 dataset. Similarly, in ADNI2, AxDDTI was the most sensitive to differences between CN and MCI diagnosis (Nir et al., 2013).
Among the three cognitive assessments, CDR-sob showed the strongest correlations with dMRI indices, in line with prior ADNI brain imaging studies (Hua et al., 2009; Nir et al., 2013). The largest of these effects were found in temporal WM tracts including the hippocampal-cingulum, uncinate, sagittal stratum, and inferior fronto-occipital fasciculus. These are all regions that show early degenerative changes in MCI and AD (Mielke et al., 2009; Nir et al., 2013; Maggipinto et al., 2017; Powell et al., 2018). While associations with clinical impairment were detected throughout the WM, the region that most frequently showed the lowest effect sizes and was significant in only 3 of the 20 clinical tests, was the corticospinal tract (CST). However, the CST ROI from the JHU WMPM atlas is limited to a small region in the inferior portion of the brain and has been shown to be the least reliable and reproducible ROI (Jahanshad et al., 2013; Acheson et al., 2017), suggesting alternate approaches, such as tractography-based evaluations (Jin et al., 2017), or the use of the probabilistic JHU atlas (Hua et al., 2008), may be more appropriate for studying the CST. Our analysis focused on WM microstructure, but future work assessing tract geometry and properties of anatomical brain networks using tractography may reveal more detailed information. The validation and harmonization of tractography methods and derived network metrics is a vast field of research with active ongoing work (Maier-Hein et al., 2017).
DTI is widely recognized as a useful tool for studying neurodegenerative disorders such as AD (Oishi et al., 2011; Müller and Kassubek, 2013; Abhinav et al., 2014; Acosta-Cabronero and Nestor, 2014; Maggipinto et al., 2017). However, at the spatial resolutions now used, a single voxel typically captures partial volumes of different tissue compartments–e.g., the intra- and extra-cellular compartments, the vascular compartment, the CSF and myelin; each affects water diffusion and the MR signal. The DTI model cannot differentiate these components or even crossing fibers (Tuch et al., 2002; Jbabdi et al., 2010), which are estimated to occur in up to 90% of WM voxels at the typical dMRI resolution (Descoteaux et al., 2009; Jeurissen et al., 2013). In healthy tissue with crossing fibers, the DTI model may show low FA. FADTI may paradoxically appear to increase in regions where crossing fibers deteriorate in neurodegenerative diseases such as AD (Douaud et al., 2011). FATDF addresses this limitation even in low angular resolution data (Nir et al., 2017). Here, compared to FADTI, FATDF showed more widespread associations with cognitive measures and diagnosis throughout WM ROIs: FATDF was significant in 89 of the 96 tests (92.7%; 24 ROIs * 4 clinical tests), while FADTI was only significant in 58 (60.4%). The greatest difference was seen for diagnostic associations (CN vs. MCI): FATDF was significant in 20 out of 24 ROIs while FADTI was only significant in three. FATDF also showed stronger effect sizes across the protocols, suggesting that tensor limitations have likely confounded previous diffusion studies of cognitive decline that have found little or no effects with FA (Acosta-Cabronero et al., 2010). Recently proposed biophysical models of brain tissue may help to relate diffusion signals directly to underlying microstructure and different tissue compartments (Harms et al., 2017). We may be able to further disentangle questions of orientation coherence (dispersing and “kissing” fibers), fiber diameter, fiber density, membrane permeability, and myelination, which all influence classic anisotropy and diffusivity measures derived from DTI. Several AD studies have already used multi-shell protocols to compute diffusion indices from models that do not assume mono-exponential decay, such as diffusion kurtosis imaging (DKI; Jensen et al., 2005; Chen et al., 2017; Cheng et al., 2018; Wang M.-L. et al., 2018), and multi-compartment models such as neurite orientation dispersion and density imaging (NODDI; Zhang et al., 2012; Colgan et al., 2016; Slattery et al., 2017; Parker et al., 2018). To date, approximately 20 participants in ADNI have been scanned with multi-shell diffusion protocols; in a future report, we will relate multi-shell measures to those examined here.
Large-scale, multi-site neuroimaging studies can increase the power of statistical analyses and establish greater confidence and generalizability for findings. Most multi-site neuroimaging studies are susceptible to variability across sites. Variability in dMRI studies is due in part to heterogeneity in acquisition protocols, scanning parameters, and scanner manufacturers (Zhu et al., 2009, 2011, 2018). Anisotropy and diffusivity maps are affected by angular and spatial resolution (Alexander et al., 2001; Kim et al., 2006; Zhan et al., 2010), the number of DWI directions (Giannelli et al., 2009), and the number of acquired b-values (Correia et al., 2009). All five dMRI indices were significantly different between protocols; AxDDTI was the most stable index, while FADTI was the least stable, reflective of their performance in detecting associations with cognitive measures. ADNI2 was the most divergent protocol across dMRI indices, perhaps due to the larger voxel size in ADNI2 (2.7 mm3 vs. 2.0 mm3 isotropic voxels used in ADNI3). This is consistent with the notion that DTI measures vary with voxel size due to partial voluming (Zhan et al., 2013). Despite differences in protocols, the directions of associations were consistent across protocols.
ADNI3 extends dMRI acquisitions across scanner manufacturers and platforms to maximize the number of participants scanned with dMRI; this makes it necessary to account for site-related heterogeneities and confounds in analytical models where data are pooled. Multi-site dMRI studies are becoming increasingly common, and new data harmonization methods to adjust for site and acquisition protocol are being developed and tested. A thorough investigation of dMRI harmonization methods is now possible with ADNI3, one of the few publicly available multi-site datasets acquired with multiple protocols. As regional dMRI measures are available for download as part of the ADNI database, we highlight two ways that the data may be pooled across sites: (1) performing statistical analyses with nested random-effects models to account for site and acquisition protocol differences; and (2) harmonizing the derived regional measures before aggregating the data across sites. In a preliminary analysis, we showed that one harmonization method performed on these regional measures, ComBat, reduced cross-site differences in dMRI indices, while preserving biological relationships with age in CN controls. The only region where differences remained after ComBat, was the CST, the ROI with the weakest associations with clinical measures, and previously identified as least reliable (Acheson et al., 2017). In Fortin et al. (2017), compared to other harmonization methods, ComBat increased the number of voxels where significant associations between age and FADTI or MDDTI were detected. Here, the number of significant ROIs and the magnitude of effect sizes were comparable for ComBat and nested random-effects model approaches. This discrepancy between our findings and that of Fortin et al. (2017), may be due to several differences between studies: (1) ADNI3 includes more sites and protocols; (2) in contrast to the number of voxels, the number of ROIs is far less than the number of participants; and (3) the age effects in the elderly populations tested here are stronger than the effects tested in adolescents in Fortin et al. (2017). When effects are more readily detected, one harmonization approach may not be more advantageous than others. In addition to exploring additional harmonization techniques, future work should evaluate voxel-wise ComBat approaches and the effects of harmonization beyond CN participants (i.e., across the entire ADNI cohort).
In addition to ComBat, a number of harmonization approaches have recently been proposed at various stages of analysis (Tax et al., 2018; Zhu et al., 2018). Site differences can be accounted for at the time of overall group inference, such as with the random-effects regression level correction used here, or by using a meta-analysis approach in lieu of pooling data (Thompson et al., 2014). The data may also be transformed prior to multi-site group-level statistics. Some methods, such as ComBat and RAVEL, use the distribution of derived features, such as diffusivity and anisotropy measures (Fortin et al., 2016, 2017). Alternatively, several proposed methods use information from the raw image to adjust for acquisition variability (Zhu et al., 2018). For example, Kochunov et al. (2018) calculated the signal to noise ratio for each protocol and include it in their regression models. Mirzaalian et al. (2018) use voxel-wise spherical harmonic residual networks to derive local correction parameters. Finding the best method to harmonize dMRI data is an active topic at “hackathons” and technical challenges; in 2017 and 2018, the International Conference on Medical Image Computing and Computer Assisted Intervention (MICCAI) hosted a computational diffusion MRI challenge to explore approaches for data harmonization. With so many available approaches, the preliminary random-effects regression and ComBat results from this article serve as a first step towards future work establishing robust approaches for combining data in ADNI3 and other multi-site studies.
The current study is limited in that the sample sizes and sample demographics available for each protocol vary, complicating direct comparison of the protocols (Button et al., 2013). A matched comparison might be possible if a group of participants or a phantom were scanned using every protocol. Even so, separating protocol differences from differences in scanner manufacturer is difficult. We also could not directly compare all diagnostic groups in ADNI3, as few participants with AD were scanned.
A more complete picture of brain changes in aging and AD would include imaging metrics from other modalities, such as perfusion imaging, resting state functional MRI (Wang et al., 2017), and radiotracer methods such as FDG-PET (Popuri et al., 2018), or amyloid- and tau-sensitive PET (Grothe et al., 2017; Phillips et al., 2018). Genetic and other “omics” data could be analyzed as well, and may help to predict diagnostic classification and brain aging, when combined with other neuroimaging markers (Ding et al., 2018; Kauppi et al., 2018). While these data are all being collected as part of ADNI3 and other studies of brain aging, our focus here was on the variety of available dMRI measures, calculated using different protocols. With this in mind, the optimal dMRI indices to include in a multimodal study may be those that contribute the greatest independent information beyond that available from anatomical MRI and other standard imaging modalities. Multivariate methods—such as machine learning (Zhou et al., 2017; Wang X. et al., 2018) and even deep learning (Liu et al., 2017)—may also help to extract and capitalize on features that predict clinical decline beyond those studied here.
In addition to providing a roadmap for the new ADNI3 dMRI data, these preliminary analyses show that despite differences in the updated dMRI protocols, diffusion indices can be pooled to detect WM microstructural differences associated with aging and AD.
Author Contributions
RR, MB, BB, CJ, PT and MW designed the ADNI3 diffusion MRI study. ST, AZ-P and TN performed the image analysis. TN, AZ-P, NJ and PT conceived and designed the image analysis study. TN, AZ-P, ST, NJ and PT drafted the manuscript. All authors contributed to interpreting the results and critically revised the manuscript for intellectual content.
Funding
Data collection and sharing for ADNI was funded by National Institutes of Health Grant U01 AG024904 and the DOD (Department of Defense award number W81XWH-12–2–0012). Additional support was provided by National Institute on Aging (NIA) grants RF1 AG04191, P01 AG026572-13, R56AG058854, RF1AG051710, and P41 EB015922. ADNI is funded by the NIA, the National Institute of Biomedical Imaging and Bioengineering, and through generous contributions from the following: AbbVie, Alzheimer’s Association; Alzheimer’s Drug Discovery Foundation; Araclon Biotech; BioClinica, Inc.; Biogen; Bristol-Myers Squibb Company; CereSpir, Inc.; Cogstate; Eisai Inc.; Elan Pharmaceuticals, Inc.; Eli Lilly and Company; EuroImmun; F. Hoffmann-La Roche Ltd. and its affiliated company Genentech, Inc.; Fujirebio; GE Healthcare; IXICO Ltd.; Janssen Alzheimer Immunotherapy Research and Development, LLC.; Johnson and Johnson Pharmaceutical Research and Development LLC.; Lumosity; Lundbeck; Merck and Co., Inc.; Meso Scale Diagnostics, LLC.; NeuroRx Research; Neurotrack Technologies; Novartis Pharmaceuticals Corporation; Pfizer Inc.; Piramal Imaging; Servier; Takeda Pharmaceutical Company; and Transition Therapeutics. The Canadian Institutes of Health Research provided funds to support ADNI clinical sites in Canada. Private sector contributions are facilitated by the Foundation for the National Institutes of Health (www.fnih.org). The grantee organization is the Northern California Institute for Research and Education, and the study is coordinated by the Alzheimer’s Therapeutic Research Institute at the University of Southern California. ADNI data are disseminated by the Laboratory for Neuro Imaging at the University of Southern California. Samples from the National Centralized Repository for AD and Related Dementias (NCRAD), which receives government support under a cooperative agreement grant (U24 AG21886) awarded by the NIA, were used in this study.
Conflict of Interest Statement
MW has served on the scientific advisory boards for Lilly, Araclon, and Institut Catala de Neurociencies Aplicades, Gulf War Veterans Illnesses Advisory Committee, VACO, Biogen Idec, and Pfizer; has served as a consultant for Astra Zeneca, Araclon, Medivation/Pfizer, Ipsen, TauRx Therapeutics Ltd., Bayer Healthcare, Biogen Idec, Exonhit Therapeutics, SA, Servier, Synarc, Pfizer, and Janssen; has received funding for travel from NeuroVigil, Inc., CHRU-Hopital Roger Salengro, Siemens, AstraZeneca, Geneva University Hospitals, Lilly, University of California, San Diego–ADNI, Paris University, Institut Catala de Neurociencies Aplicades, University of New Mexico School of Medicine, Ipsen, CTAD (Clinical Trials on AD), Pfizer, AD PD meeting, Paul Sabatier University, Novartis, Tohoku University; has served on the editorial advisory boards for Alzheimer’s and Dementia and MRI; has received honoraria from NeuroVigil, Inc., Insitut Catala de Neurociencies Aplicades, PMDA/Japanese Ministry of Health, Labour, and Welfare, and Tohoku University; has received commercial research support from Merck and Avid; has received government research support from DOD and VA; has stock options in Synarc and Elan; and declares the following organizations as contributors to the Foundation for NIH and thus to the NIA funded AD Neuroimaging Initiative: Abbott, Alzheimer’s Association, Alzheimer’s Drug Discovery Foundation, Anonymous Foundation, AstraZeneca, Bayer Healthcare, BioClinica, Inc. (ADNI 2), Bristol-Myers Squibb, Cure Alzheimer’s Fund, Eisai, Elan, Gene Network Sciences, Genentech, GE Healthcare, GlaxoSmithKline, Innogenetics, Johnson and Johnson, Eli Lilly and Company, Medpace, Merck, Novartis, Pfizer Inc., Roche, Schering Plough, Synarc, and Wyeth. CJ has provided consulting services for Janssen Research & Development, LLC., and Eli Lilly. MB is a former employee of GE Medical Systems and receives pension payment. CJ consults for Lily and serves on an independent data monitoring board for Roche but he receives no personal compensation from any commercial entity. CJ receives research support from NIH and the Alexander Family Alzheimer’s Disease Research Professorship of the Mayo Clinic.
The remaining authors declare that the research was conducted in the absence of any commercial or financial relationships that could be construed as a potential conflict of interest.
The reviewer NZ and handling editor declared their shared affiliation at time of review.
Acknowledgments
This study builds on preliminary findings in a conference article entitled, Ranking Diffusion Tensor Measures of Brain Aging and Alzheimer’s Disease, which may be found in the conference proceedings from the 14th International Symposium on Medical Information Processing and Analysis (SIPAIM; Zavaliangos-Petropulu et al., 2018). We thank contributors who collected samples used in this study, as well as patients and their families, whose help and participation made this work possible.
Footnotes
- ^ http://adni.loni.usc.edu/methods/documents/mri-protocols/
- ^ https://ida.loni.usc.edu/
- ^ https://adni.bitbucket.io/reference/docs/DTIROI/DTI-ADNI_Methods-Thompson-Oct2012.pdf
- ^ http://cmrm.med.jhmi.edu/cmrm/atlas/human_data/file/AtlasExplanation2.htm
Supplementary Material
The Supplementary Material for this article can be found online at: https://www.frontiersin.org/articles/10.3389/fninf.2019.00002/full#supplementary-material
References
Abhinav, K., Yeh, F.-C., Pathak, S., Suski, V., Lacomis, D., Friedlander, R. M., et al. (2014). Advanced diffusion MRI fiber tracking in neurosurgical and neurodegenerative disorders and neuroanatomical studies: a review. Biochim. Biophys. Acta 1842, 2286–2297. doi: 10.1016/j.bbadis.2014.08.002
Acheson, A., Wijtenburg, S. A., Rowland, L. M., Winkler, A., Mathias, C. W., Hong, L. E., et al. (2017). Reproducibility of tract-based white matter microstructural measures using the ENIGMA-DTI protocol. Brain Behav. 7:e00615. doi: 10.1002/brb3.615
Acosta-Cabronero, J., and Nestor, P. J. (2014). Diffusion tensor imaging in Alzheimer’s disease: insights into the limbic-diencephalic network and methodological considerations. Front. Aging Neurosci. 6:266. doi: 10.3389/fnagi.2014.00266
Acosta-Cabronero, J., Williams, G. B., Pengas, G., and Nestor, P. J. (2010). Absolute diffusivities define the landscape of white matter degeneration in Alzheimer’s disease. Brain 133, 529–539. doi: 10.1093/brain/awp257
Alexander, A. L., Hasan, K. M., Lazar, M., Tsuruda, J. S., and Parker, D. L. (2001). Analysis of partial volume effects in diffusion-tensor MRI. Magn. Reson. Med. 45, 770–780. doi: 10.1002/mrm.1105
Alzheimer’s Association. (2018). 2018 Alzheimer’s disease facts and figures. Alzheimers Dement. 14, 367–429. doi: 10.1016/j.jalz.2018.02.001
Balsis, S., Benge, J. F., Lowe, D. A., Geraci, L., and Doody, R. S. (2015). How do scores on the ADAS-Cog, MMSE, and CDR-SOB correspond? Clin. Neuropsychol. 29, 1002–1009. doi: 10.1080/13854046.2015.1119312
Basser, P. J., Mattiello, J., and LeBihan, D. (1994). MR diffusion tensor spectroscopy and imaging. Biophys. J. 66, 259–267. doi: 10.1016/s0006-3495(94)80775-1
Beaulieu, C. (2002). The basis of anisotropic water diffusion in the nervous system—a technical review. NMR Biomed. 15, 435–455. doi: 10.1002/nbm.782
Benjamini, Y., and Hochberg, Y. (1995). Controlling the false discovery rate: a practical and powerful approach to multiple testing. J. R. Stat. Soc. Ser. B 57, 289–300. doi: 10.1111/j.2517-6161.1995.tb02031.x
Braak, H., and Braak, E. (1991). Neuropathological stageing of Alzheimer-related changes. Acta Neuropathol. 82, 239–259. doi: 10.1007/bf00308809
Braak, H., and Braak, E. (1996). Evolution of the neuropathology of Alzheimer’s disease. Acta Neurol. Scand. Suppl. 94, 3–12. doi: 10.1111/j.1600-0404.1996.tb05866.x
Button, K. S., Ioannidis, J. P. A., Mokrysz, C., Nosek, B. A., Flint, J., Robinson, E. S. J., et al. (2013). Power failure: why small sample size undermines the reliability of neuroscience. Nat. Rev. Neurosci. 14, 365–376. doi: 10.1038/nrn3475
Cercignani, M., Bammer, R., Sormani, M. P., Fazekas, F., and Filippi, M. (2003). Inter-sequence and inter-imaging unit variability of diffusion tensor MR imaging histogram-derived metrics of the brain in healthy volunteers. Am. J. Neuroradiol. 24, 638–643. Available online at: http://www.ajnr.org/content/24/4/638.long
Chen, Y., Sha, M., Zhao, X., Ma, J., Ni, H., Gao, W., et al. (2017). Automated detection of pathologic white matter alterations in Alzheimer’s disease using combined diffusivity and kurtosis method. Psychiatry Res. Neuroimaging 264, 35–45. doi: 10.1016/j.pscychresns.2017.04.004
Cheng, J.-X., Zhang, H.-Y., Peng, Z.-K., Xu, Y., Tang, H., Wu, J.-T., et al. (2018). Divergent topological networks in Alzheimer’s disease: a diffusion kurtosis imaging analysis. Transl. Neurodegener. 7:10. doi: 10.1186/s40035-018-0115-y
Clerx, L., Visser, P. J., Verhey, F., and Aalten, P. (2012). New MRI markers for Alzheimer’s disease: a meta-analysis of diffusion tensor imaging and a comparison with Medial temporal lobe measurements. J. Alzheimers Dis. 29, 405–429. doi: 10.3233/JAD-2011-110797
Colgan, N., Siow, B., O’Callaghan, J. M., Harrison, I. F., Wells, J. A., Holmes, H. E., et al. (2016). Application of neurite orientation dispersion and density imaging (NODDI) to a tau pathology model of Alzheimer’s disease. Neuroimage 125, 739–744. doi: 10.1016/j.neuroimage.2015.10.043
Correia, M. M., Carpenter, T. A., and Williams, G. B. (2009). Looking for the optimal DTI acquisition scheme given a maximum scan time: are more b-values a waste of time? Magn. Reson. Imaging 27, 163–175. doi: 10.1016/j.mri.2008.06.011
Daianu, M., Dennis, E. L., Jahanshad, N., Nir, T. M., Toga, A. W., Jack, C. R., et al. (2013a). “Alzheimer’s disease disrupts rich club organization in brain connectivity networks,” in Proceedings of the 2013 IEEE 10th International Symposium on Biomedical Imaging (San Francisco, CA: IEEE), 266–269.
Daianu, M., Jahanshad, N., Nir, T. M., Toga, A. W., Jack, C. R. Jr., Weiner, M. W., et al. (2013b). Breakdown of brain connectivity between normal aging and Alzheimer’s disease: a structural k-core network analysis. Brain Connect. 3, 407–422. doi: 10.1089/brain.2012.0137
Descoteaux, M., Angelino, E., Fitzgibbons, S., and Deriche, R. (2007). Regularized, fast, and robust analytical Q-ball imaging. Magn. Reson. Med. 58, 497–510. doi: 10.1002/mrm.21277
Descoteaux, M., Deriche, R., Knösche, T., and Anwander, A. (2009). Deterministic and probabilistic tractography based on complex fiber orientation distributions. IEEE Trans. Med. Imaging 28, 269–286. doi: 10.1109/tmi.2008.2004424
Ding, L., Zhu, A. H., Saremi, A., Faskowitz, J. I., Håberg, A., Thompson, P. M., et al. (2018). “Voxelwise meta-analysis of brain structural associations with genome-wide polygenic risk for Alzheimer’s disease,” in Proceedings of the 14th International Symposium on Medical Information Processing and Analysis, Mazatlán, Mexico. doi: 10.1117/12.2506660
Douaud, G., Jbabdi, S., Behrens, T. E. J., Menke, R. A., Gass, A., Monsch, A. U., et al. (2011). DTI measures in crossing-fibre areas: increased diffusion anisotropy reveals early white matter alteration in MCI and mild Alzheimer’s disease. Neuroimage 55, 880–890. doi: 10.1016/j.neuroimage.2010.12.008
Folstein, M. F., Folstein, S. E., and McHugh, P. R. (1975). “Mini-mental state”: a practical method for grading the cognitive state of patients for the clinician. J. Psychiatr. Res. 12, 189–198. doi: 10.1016/0022-3956(75)90026-6
Fortin, J.-P., Parker, D., Tunç, B., Watanabe, T., Elliott, M. A., Ruparel, K., et al. (2017). Harmonization of multi-site diffusion tensor imaging data. Neuroimage 161, 149–170. doi: 10.1016/j.neuroimage.2017.08.047
Fortin, J.-P., Sweeney, E. M., Muschelli, J., Crainiceanu, C. M., and Shinohara, R. T. (2016). Removing inter-subject technical variability in magnetic resonance imaging studies. Neuroimage 132, 198–212. doi: 10.1016/j.neuroimage.2016.02.036
Frank, R. A., Galasko, D., Hampel, H., Hardy, J., de Leon, M. J., Mehta, P. D., et al. (2003). Biological markers for therapeutic trials in Alzheimer’s disease: proceedings of the biological markers working group; NIA initiative on neuroimaging in Alzheimer’s disease. Neurobiol. Aging 24, 521–536. doi: 10.1016/S0197-4580(03)00002-2
Giannelli, M., Cosottini, M., Michelassi, M. C., Lazzarotti, G., Belmonte, G., Bartolozzi, C., et al. (2009). Dependence of brain DTI maps of fractional anisotropy and mean diffusivity on the number of diffusion weighting directions. J. Appl. Clin. Med. Phys. 11, 176–190. doi: 10.1120/jacmp.v11i1.2927
Giulietti, G., Torso, M., Serra, L., Spanò, B., Marra, C., Caltagirone, C., et al. (2018). Whole brain white matter histogram analysis of diffusion tensor imaging data detects microstructural damage in mild cognitive impairment and Alzheimer’s disease patients. J. Magn. Reson. Imaging 48, 767–779. doi: 10.1002/jmri.25947
Grech-Sollars, M., Hales, P. W., Miyazaki, K., Raschke, F., Rodriguez, D., Wilson, M., et al. (2015). Multi-centre reproducibility of diffusion MRI parameters for clinical sequences in the brain. NMR Biomed. 28, 468–485. doi: 10.1002/nbm.3269
Grothe, M. J., Barthel, H., Sepulcre, J., Dyrba, M., Sabri, O., and Teipel, S. J. (2017). In vivo staging of regional amyloid deposition. Neurology 89, 2031–2038. doi: 10.1212/WNL.0000000000004643
Harms, R. L., Fritz, F. J., Tobisch, A., Goebel, R., and Roebroeck, A. (2017). Robust and fast nonlinear optimization of diffusion MRI microstructure models. Neuroimage 155, 82–96. doi: 10.1016/j.neuroimage.2017.04.064
Harsan, L. A., Poulet, P., Guignard, B., Steibel, J., Parizel, N., de Sousa, P. L., et al. (2006). Brain dysmyelination and recovery assessment by noninvasive in vivo diffusion tensor magnetic resonance imaging. J. Neurosci. Res. 83, 392–402. doi: 10.1002/jnr.20742
Hu, C., Hua, X., Ying, J., Thompson, P. M., Fakhri, G. E., and Li, Q. (2016). Localizing sources of brain disease progression with network diffusion model. IEEE J. Sel. Top. Signal Process. 10, 1214–1225. doi: 10.1109/jstsp.2016.2601695
Hua, X., Lee, S., Yanovsky, I., Leow, A. D., Chou, Y.-Y., Ho, A. J., et al. (2009). Optimizing power to track brain degeneration in Alzheimer’s disease and mild cognitive impairment with tensor-based morphometry: an ADNI study of 515 subjects. Neuroimage 48, 668–681. doi: 10.1016/j.neuroimage.2009.07.011
Hua, K., Zhang, J., Wakana, S., Jiang, H., Li, X., Reich, D. S., et al. (2008). Tract probability maps in stereotaxic spaces: analyses of white matter anatomy and tract-specific quantification. Neuroimage 39, 336–347. doi: 10.1016/j.neuroimage.2007.07.053
Jack, C. R. Jr., Barnes, J., Bernstein, M. A., Borowski, B. J., Brewer, J., Clegg, S., et al. (2015). Magnetic resonance imaging in Alzheimer’s disease neuroimaging initiative 2. Alzheimers Dement. 11, 740–756. doi: 10.1016/j.jalz.2015.05.002
Jahanshad, N., Kochunov, P. V., Sprooten, E., Mandl, R. C., Nichols, T. E., Almasy, L., et al. (2013). Multi-site genetic analysis of diffusion images and voxelwise heritability analysis: a pilot project of the ENIGMA-DTI working group. Neuroimage 81, 455–469. doi: 10.1016/j.neuroimage.2013.04.061
Jbabdi, S., Behrens, T. E. J., and Smith, S. M. (2010). Crossing fibres in tract-based spatial statistics. Neuroimage 49, 249–256. doi: 10.1016/j.neuroimage.2009.08.039
Jensen, J. H., Helpern, J. A., Ramani, A., Lu, H., and Kaczynski, K. (2005). Diffusional kurtosis imaging: the quantification of non-Gaussian water diffusion by means of magnetic resonance imaging. Magn. Reson. Med. 53, 1432–1440. doi: 10.1002/mrm.20508
Jeurissen, B., Leemans, A., Tournier, J.-D., Jones, D. K., and Sijbers, J. (2013). Investigating the prevalence of complex fiber configurations in white matter tissue with diffusion magnetic resonance imaging. Hum. Brain Mapp. 34, 2747–2766. doi: 10.1002/hbm.22099
Jin, Y., Huang, C., Daianu, M., Zhan, L., Dennis, E. L., Reid, R. I., et al. (2017). 3D tract-specific local and global analysis of white matter integrity in Alzheimer’s disease. Hum. Brain Mapp. 38, 1191–1207. doi: 10.1002/hbm.23448
Johnson, W. E., Li, C., and Rabinovic, A. (2007). Adjusting batch effects in microarray expression data using empirical Bayes methods. Biostatistics 8, 118–127. doi: 10.1093/biostatistics/kxj037
Kantarci, K., Murray, M. E., Schwarz, C. G., Reid, R. I., Przybelski, S. A., Lesnick, T., et al. (2017). White-matter integrity on DTI and the pathologic staging of Alzheimer’s disease. Neurobiol. Aging 56, 172–179. doi: 10.1016/j.neurobiolaging.2017.04.024
Kauppi, K., Fan, C. C., McEvoy, L. K., Holland, D., Tan, C. H., Chen, C.-H., et al. (2018). Combining polygenic hazard score with volumetric MRI and cognitive measures improves prediction of progression from mild cognitive impairment to Alzheimer’s disease. Front. Neurosci. 12:260. doi: 10.3389/fnins.2018.00260
Kavcic, V., Ni, H., Zhu, T., Zhong, J., and Duffy, C. J. (2008). White matter integrity linked to functional impairments in aging and early Alzheimer’s disease. Alzheimers Dement. 4, 381–389. doi: 10.1016/j.jalz.2008.07.001
Kelly, S., Jahanshad, N., Zalesky, A., Kochunov, P., Agartz, I., Alloza, C., et al. (2018). Widespread white matter microstructural differences in schizophrenia across 4322 individuals: results from the ENIGMA schizophrenia DTI working group. Mol. Psychiatry 23, 1261–1269. doi: 10.1038/mp.2017.170
Kim, M., Ronen, I., Ugurbil, K., and Kim, D.-S. (2006). Spatial resolution dependence of DTI tractography in human occipito-callosal region. Neuroimage 32, 1243–1249. doi: 10.1016/j.neuroimage.2006.06.006
Kneynsberg, A., Combs, B., Christensen, K., Morfini, G., and Kanaan, N. M. (2017). Axonal degeneration in tauopathies: disease relevance and underlying mechanisms. Front. Neurosci. 11:572. doi: 10.3389/fnins.2017.00572
Kochunov, P., Dickie, E. W., Viviano, J. D., Turner, J., Kingsley, P. B., Jahanshad, N., et al. (2018). Integration of routine QA data into mega-analysis may improve quality and sensitivity of multisite diffusion tensor imaging studies. Hum. Brain Mapp. 39, 1015–1023. doi: 10.1002/hbm.23900
Kochunov, P., Jahanshad, N., Sprooten, E., Nichols, T. E., Mandl, R. C., Almasy, L., et al. (2014). Multi-site study of additive genetic effects on fractional anisotropy of cerebral white matter: comparing meta and mega-analytical approaches for data pooling. Neuroimage 95, 136–150. doi: 10.1016/j.neuroimage.2014.03.033
Le Bihan, D., and Johansen-Berg, H. (2012). Diffusion MRI at 25: exploring brain tissue structure and function. Neuroimage 61, 324–341. doi: 10.1016/j.neuroimage.2011.11.006
Lee, J.-T., Xu, J., Lee, J.-M., Ku, G., Han, X., Yang, D.-I., et al. (2004). Amyloid-β peptide induces oligodendrocyte death by activating the neutral sphingomyelinase-ceramide pathway. J. Cell Biol. 164, 123–131. doi: 10.1083/jcb.200307017
Leow, A. D., Yanovsky, I., Chiang, M. C., Lee, A. D., Klunder, A. D., Lu, A., et al. (2007). Statistical properties of Jacobian maps and inverse-consistent deformations in non-linear image registration. IEEE Trans. Med. Imaging 26, 822–832. doi: 10.1109/TMI.2007.892646
Leow, A. D., Zhu, S., Zhan, L., McMahon, K., de Zubicaray, G. I., Meredith, M., et al. (2009). The tensor distribution function. Magn. Reson. Med. 61, 205–214. doi: 10.1002/mrm.21852
Liu, M., Zhang, J., Adeli, E., and Shen, D. (2017). Deep multi-task multi-channel learning for joint classification and regression of brain status. Med. Image Comput. Comput. Assist. Interv. 10435, 3–11. doi: 10.1007/978-3-319-66179-7_1
Maggipinto, T., Bellotti, R., Amoroso, N., Diacono, D., Donvito, G., Lella, E., et al. (2017). DTI measurements for Alzheimer’s classification. Phys. Med. Biol. 62, 2361–2375. doi: 10.1088/1361-6560/aa5dbe
Maier-Hein, K. H., Neher, P. F., Houde, J. C., Côté, M. A., Garyfallidis, E., Zhong, J., et al. (2017). The challenge of mapping the human connectome based on diffusion tractography. Nat. Commun. 8:1349. doi: 10.1038/s41467-017-01285-x
Mayo, C. D., Mazerolle, E. L., Ritchie, L., Fisk, J. D., and Gawryluk, J. R. (2017). Longitudinal changes in microstructural white matter metrics in Alzheimer’s disease. Neuroimage Clin. 13, 330–338. doi: 10.1016/j.nicl.2016.12.012
Mielke, M. M., Kozauer, N. A., Chan, K. C. G., George, M., Toroney, J., Zerrate, M., et al. (2009). Regionally-specific diffusion tensor imaging in mild cognitive impairment and Alzheimer’s disease. Neuroimage 46, 47–55. doi: 10.1016/j.neuroimage.2009.01.054
Mirzaalian, H., Ning, L., Savadjiev, P., Pasternak, O., Bouix, S., Michailovich, O., et al. (2018). Multi-site harmonization of diffusion MRI data in a registration framework. Brain Imaging Behav. 12, 284–295. doi: 10.1007/s11682-016-9670-y
Moore, E. E., Hohman, T. J., Badami, F. S., Pechman, K. R., Osborn, K. E., Acosta, L. M. Y., et al. (2018). Neurofilament relates to white matter microstructure in older adults. Neurobiol. Aging 70, 233–241. doi: 10.1016/j.neurobiolaging.2018.06.023
Mori, S., Oishi, K., Jiang, H., Jiang, L., Li, X., Akhter, K., et al. (2008). Stereotaxic white matter atlas based on diffusion tensor imaging in an ICBM template. Neuroimage 40, 570–582. doi: 10.1016/j.neuroimage.2007.12.035
Mueller, S. G., Weiner, M. W., Thal, L. J., Petersen, R. C., Jack, C. R., Jagust, W., et al. (2005). Ways toward an early diagnosis in Alzheimer’s disease: the Alzheimer’s disease neuroimaging initiative (ADNI). Alzheimers Dement. 1, 55–66. doi: 10.1016/j.jalz.2005.06.003
Müller, H.-P., and Kassubek, J. (2013). Diffusion tensor magnetic resonance imaging in the analysis of neurodegenerative diseases. J. Vis. Exp. 77:e50427. doi: 10.3791/50427
Nir, T. M., Jahanshad, N., Toga, A. W., Bernstein, M. A., Jack, C. R., Weiner, M. W., et al. (2015). Connectivity network measures predict volumetric atrophy in mild cognitive impairment. Neurobiol. Aging 36, S113–S120. doi: 10.1016/j.neurobiolaging.2014.04.038
Nir, T. M., Jahanshad, N., Villalon-Reina, J. E., Isaev, D., Zavaliangos-Petropulu, A., Zhan, L., et al. (2017). Fractional anisotropy derived from the diffusion tensor distribution function boosts power to detect Alzheimer’s disease deficits. Magn. Reson. Med. 78, 2322–2333. doi: 10.1002/mrm.26623
Nir, T. M., Jahanshad, N., Villalon-Reina, J. E., Toga, A. W., Jack, C. R., Weiner, M. W., et al. (2013). Effectiveness of regional DTI measures in distinguishing Alzheimer’s disease, MCI, and normal aging. Neuroimage Clin. 3, 180–195. doi: 10.1016/j.nicl.2013.07.006
O’Dwyer, L., Lamberton, F., Bokde, A. L. W., Ewers, M., Faluyi, Y. O., Tanner, C., et al. (2011). Multiple indices of diffusion identifies white matter damage in mild cognitive impairment and Alzheimer’s disease. PLoS One 6:e21745. doi: 10.1371/journal.pone.0021745
Oishi, K., Mielke, M. M., Albert, M., Lyketsos, C. G., and Mori, S. (2011). DTI analyses and clinical applications in Alzheimer’s disease. J. Alzheimers Dis. 26, 287–296. doi: 10.3233/JAD-2011-0007
Palacios, E. M., Martin, A. J., Boss, M. A., Ezekiel, F., Chang, Y. S., Yuh, E. L., et al. (2017). Toward precision and reproducibility of diffusion tensor imaging: a multicenter diffusion phantom and traveling volunteer study. Am. J. Neuroradiol. 38, 537–545. doi: 10.3174/ajnr.a5025
Parker, T. D., Slattery, C. F., Zhang, J., Nicholas, J. M., Paterson, R. W., Foulkes, A. J. M., et al. (2018). Cortical microstructure in young onset alzheimer’s disease using neurite orientation dispersion and density imaging. Hum. Brain Mapp. 39, 3005–3017. doi: 10.1002/hbm.24056
Phillips, J. S., Das, S. R., McMillan, C. T., Irwin, D. J., Roll, E. E., Da Re, F., et al. (2018). Tau PET imaging predicts cognition in atypical variants of Alzheimer’s disease. Hum. Brain Mapp. 39, 691–708. doi: 10.1002/hbm.23874
Pohl, K. M., Sullivan, E. V., Rohlfing, T., Chu, W., Kwon, D., Nichols, B. N., et al. (2016). Harmonizing DTI measurements across scanners to examine the development of white matter microstructure in 803 adolescents of the NCANDA study. Neuroimage 130, 194–213. doi: 10.1016/j.neuroimage.2016.01.061
Popuri, K., Balachandar, R., Alpert, K., Lu, D., Bhalla, M., Mackenzie, I. R., et al. (2018). Development and validation of a novel dementia of Alzheimer’s type (DAT) score based on metabolism FDG-PET imaging. Neuroimage Clin. 18, 802–813. doi: 10.1016/j.nicl.2018.03.007
Powell, F., Tosun, D., Sadeghi, R., Weiner, M., Raj, A., and Alzheimer’s Disease Neuroimaging Initiative. (2018). Preserved structural network organization mediates pathology spread in Alzheimer’s disease spectrum despite loss of white matter tract integrity. J. Alzheimers Dis. 65, 747–764. doi: 10.3233/jad-170798
Prasad, G., Nir, T. M., Toga, A. W., and Thompson, P. M. (2013). Tractography density and network measures in Alzheimer’s disease. Proc. IEEE Int. Symp. Biomed. Imaging 2013, 692–695. doi: 10.1109/isbi.2013.6556569
Rosen, W. G., Mohs, R. C., and Davis, K. L. (1984). A new rating scale for Alzheimer’s disease. Am. J. Psychiatry 141, 1356–1364. doi: 10.1176/ajp.141.11.1356
Rosenthal, R., and Rosnow, R. L. (1991). Essentials of Behavioral Research: Methods and Data Analysis. New York, NY: McGraw-Hill.
Roth, A. D., Ramírez, G., Alarcón, R., and Von Bernhardi, R. (2005). Oligodendrocytes damage in Alzheimer’s disease: β amyloid toxicity and inflammation. Biol. Res. 38, 381–387. doi: 10.4067/s0716-97602005000400011
Sachdev, P. S., Zhuang, L., Braidy, N., and Wen, W. (2013). Is Alzheimer’s a disease of the white matter? Curr. Opin. Psychiatry 26, 244–251. doi: 10.1097/YCO.0b013e32835ed6e8
Sanchez-Rodriguez, L. M., Iturria-Medina, Y., Baines, E. A., Mallo, S. C., Dousty, M., Sotero, R. C., et al. (2018). Design of optimal nonlinear network controllers for Alzheimer’s disease. PLoS Comput. Biol. 14:e1006136. doi: 10.1371/journal.pcbi.1006136
Shaw, L. M., Korecka, M., Clark, C. M., Lee, V. M.-Y., and Trojanowski, J. Q. (2007). Biomarkers of neurodegeneration for diagnosis and monitoring therapeutics. Nat. Rev. Drug Discov. 6, 295–303. doi: 10.1038/nrd2176
Slattery, C. F., Zhang, J., Paterson, R. W., Foulkes, A. J. M., Carton, A., Macpherson, K., et al. (2017). ApoE influences regional white-matter axonal density loss in Alzheimer’s disease. Neurobiol. Aging 57, 8–17. doi: 10.1016/j.neurobiolaging.2017.04.021
Song, S.-K., Sun, S.-W., Ju, W.-K., Lin, S.-J., Cross, A. H., and Neufeld, A. H. (2003). Diffusion tensor imaging detects and differentiates axon and myelin degeneration in mouse optic nerve after retinal ischemia. Neuroimage 20, 1714–1722. doi: 10.1016/j.neuroimage.2003.07.005
Song, S.-K., Yoshino, J., Le, T. Q., Lin, S.-J., Sun, S.-W., Cross, A. H., et al. (2005). Demyelination increases radial diffusivity in corpus callosum of mouse brain. Neuroimage 26, 132–140. doi: 10.1016/j.neuroimage.2005.01.028
Sulaimany, S., Khansari, M., Zarrineh, P., Daianu, M., Jahanshad, N., Thompson, P. M., et al. (2017). Predicting brain network changes in Alzheimer’s disease with link prediction algorithms. Mol. Biosyst. 13, 725–735. doi: 10.1039/c6mb00815a
Tax, C. M. W., Grussu, F., Kaden, E., Ning, L., Rudrapatna, U., Evans, J., et al. (2018). Cross-vendor and Cross-protocol harmonisation of diffusion MRI data: a comparative study. Proc. Jt. Annu. Meet. 471. Available online at: https://www.researchgate.net/publication/325737885_Cross-vendor_and_Cross-protocol_harmonisation_of_diffusion_MRI_data_a_comparative_study
Thompson, P. M., Stein, J. L., Medland, S. E., Hibar, D. P., Vasquez, A. A., Renteria, M. E., et al. (2014). The ENIGMA Consortium: large-scale collaborative analyses of neuroimaging and genetic data. Brain Imaging Behav. 8, 153–182. doi: 10.1007/s11682-013-9269-5
Tournier, J.-D., Calamante, F., Gadian, D. G., and Connelly, A. (2004). Direct estimation of the fiber orientation density function from diffusion-weighted MRI data using spherical deconvolution. Neuroimage 23, 1176–1185. doi: 10.1016/j.neuroimage.2004.07.037
Tuch, D. S., Reese, T. G., Wiegell, M. R., Makris, N., Belliveau, J. W., and Wedeen, V. J. (2002). High angular resolution diffusion imaging reveals intravoxel white matter fiber heterogeneity. Magn. Reson. Med. 48, 577–582. doi: 10.1002/mrm.10268
Veitch, D. P., Weiner, M. W., Aisen, P. S., Beckett, L. A., Cairns, N. J., Green, R. C., et al. (2019). Understanding disease progression and improving Alzheimer’s disease clinical trials: recent highlights from the Alzheimer’s disease neuroimaging initiative. Alzheimers Dement. 15, 106–152. doi: 10.1016/j.jalz.2018.08.005
Wang, B., Niu, Y., Miao, L., Cao, R., Yan, P., Guo, H., et al. (2017). Decreased complexity in Alzheimer’s disease: resting-state fMRI evidence of brain entropy mapping. Front. Aging Neurosci. 9:378. doi: 10.3389/fnagi.2017.00378
Wang, M.-L., Wei, X.-E., Fu, J.-L., Li, W., Yu, M.-M., Li, P.-Y., et al. (2018). Subcortical nuclei in Alzheimer’s disease: a volumetric and diffusion kurtosis imaging study. Acta Radiol. 59, 1365–1371. doi: 10.1177/0284185118758122
Wang, X., Zhen, X., Li, Q., Shen, D., and Huang, H. (2018). Cognitive assessment prediction in Alzheimer’s disease by multi-layer multi-target regression. Neuroinformatics 16, 285–294. doi: 10.1007/s12021-018-9381-1
Zavaliangos-Petropulu, A., Nir, T. M., Thomopoulos, S. I., Jahanshad, N., Reid, R. I., Bernstein, M. A., et al. (2018). “Ranking diffusion tensor measures of brain aging and Alzheimer’s disease,” in Proceedings of the 14th International Symposium on Medical Information Processing and Analysis, Mazatlán, Mexico. doi: 10.1117/12.2506694
Zhan, L., Jahanshad, N., Ennis, D. B., Jin, Y., Bernstein, M. A., Borowski, B. J., et al. (2013). Angular versus spatial resolution trade-offs for diffusion imaging under time constraints. Hum. Brain Mapp. 34, 2688–2706. doi: 10.1002/hbm.22094
Zhan, L., Leow, A. D., Jahanshad, N., Chiang, M.-C., Barysheva, M., Lee, A. D., et al. (2010). How does angular resolution affect diffusion imaging measures? Neuroimage 49, 1357–1371. doi: 10.1016/j.neuroimage.2009.09.057
Zhang, H., Schneider, T., Wheeler-Kingshott, C. A., and Alexander, D. C. (2012). NODDI: practical in vivo neurite orientation dispersion and density imaging of the human brain. Neuroimage 61, 1000–1016. doi: 10.1016/j.neuroimage.2012.03.072
Zhou, T., Thung, K.-H., Zhu, X., and Shen, D. (2017). Feature learning and fusion of multimodality neuroimaging and genetic data for multi-status dementia diagnosis. Mach. Learn. Med. Imaging 10541, 132–140. doi: 10.1007/978-3-319-67389-9_16
Zhu, T., Hu, R., Qiu, X., Taylor, M., Tso, Y., Yiannoutsos, C., et al. (2011). Quantification of accuracy and precision of multi-center DTI measurements: a diffusion phantom and human brain study. Neuroimage 56, 1398–1411. doi: 10.1016/j.neuroimage.2011.02.010
Zhu, T., Liu, X., Gaugh, M. D., Connelly, P. R., Ni, H., Ekholm, S., et al. (2009). Evaluation of measurement uncertainties in human diffusion tensor imaging (DTI)-derived parameters and optimization of clinical DTI protocols with a wild bootstrap analysis. J. Magn. Reson. Imaging 29, 422–435. doi: 10.1002/jmri.21647
Keywords: Alzheimer’s disease, ADNI3, white matter, DTI, multi-site, harmonization, TDF, ComBat
Citation: Zavaliangos-Petropulu A, Nir TM, Thomopoulos SI, Reid RI, Bernstein MA, Borowski B, Jack CR Jr., Weiner MW, Jahanshad N, Thompson PM and the Alzheimer’s Disease Neuroimaging Initiative (ADNI) (2019) Diffusion MRI Indices and Their Relation to Cognitive Impairment in Brain Aging: The Updated Multi-protocol Approach in ADNI3. Front. Neuroinform. 13:2. doi: 10.3389/fninf.2019.00002
Received: 20 August 2018; Accepted: 21 January 2019;
Published: 19 February 2019.
Edited by:
Xi-Nian Zuo, Institute of Psychology (CAS), ChinaReviewed by:
Nianming Zuo, Institute of Automation (CAS), ChinaYu Zhang, VA Palo Alto Health Care System, United States
Copyright © 2019 Zavaliangos-Petropulu, Nir, Thomopoulos, Reid, Bernstein, Borowski, Jack, Weiner, Jahanshad, Thompson and the Alzheimer’s Disease Neuroimaging Initiative (ADNI). This is an open-access article distributed under the terms of the Creative Commons Attribution License (CC BY). The use, distribution or reproduction in other forums is permitted, provided the original author(s) and the copyright owner(s) are credited and that the original publication in this journal is cited, in accordance with accepted academic practice. No use, distribution or reproduction is permitted which does not comply with these terms.
*Correspondence: Paul M. Thompson, cHRob21wQHVzYy5lZHU=
† These authors have contributed equally to this work
‡ Data used in preparing this article were obtained from the Alzheimer’s Disease Neuroimaging Initiative (ADNI) database (adni.loni.usc.edu). As such, many investigators within the ADNI contributed to the design and implementation of ADNI and/or provided data but did not participate in analysis or writing of this report. A complete listing of ADNI investigators can be found at: http://adni.loni.usc.edu/wp-content/uploads/how_to_apply/ADNI_Acknowledgement_List.pdf