- 1Department of Clinical Cardiac Surgery, Katholieke Universiteit Leuven, Leuven, Belgium
- 2Institute of Clinical Physiology, National Research Council, Rome, Italy
- 3Medical and Surgical Department of Pediatric Cardiology, Bambino Gesù Children's Hospital, Rome, Italy
The physiological response to physical exercise is now recognized as an important tool which can aid the diagnosis and treatment of cardiovascular diseases. This is due to the fact that several mechanisms are needed to accommodate a higher cardiac output and a higher oxygen delivery to tissues. The aim of the present work is to provide a fully closed loop cardiorespiratory simulator reproducing the main physiological mechanisms which arise during aerobic exercise. The simulator also provides a representation of the impairments of these mechanisms in heart failure condition and their effect on limiting exercise capacity. The simulator consists of a cardiovascular model including the left and right heart, pulmonary and systemic circulations. This latter is split into exercising and non-exercising regions and is controlled by the baroreflex and metabolic mechanisms. In addition, the simulator includes a respiratory model reproducing the gas exchange in lungs and tissues, the ventilation control and the effects of its mechanics on the cardiovascular system. The simulator was tested and compared to the data in the literature at three different workloads whilst cycling (25, 49 and 73 watts). The results show that the simulator is able to reproduce the response to exercise in terms of: heart rate (from 67 to 134 bpm), cardiac output (from 5.3 to 10.2 l/min), leg blood flow (from 0.7 to 3.0 l/min), peripheral resistance (from 0.9 to 0.5 mmHg/(cm3/s)), central arteriovenous oxygen difference (from 4.5 to 10.8 ml/dl) and ventilation (6.1–25.5 l/min). The simulator was further adapted to reproduce the main impairments observed in heart failure condition, such as reduced sensitivity of baroreflex and metabolic controls, lower perfusion to the exercising regions (from 0.6 to 1.4 l/min) and hyperventilation (from 9.2 to 40.2 l/min). The simulator we developed is a useful tool for the description of the basic physiological mechanisms operating during exercise. It can reproduce how these mechanisms interact and how their impairments could limit exercise performance in heart failure condition. The simulator can thus be used in the future as a test bench for different therapeutic strategies aimed at improving exercise performance in cardiopathic subjects.
Introduction
Physical exercise is associated with an increase in metabolic activity to which the cardiovascular system responds by accommodating a cardiac output eightfold its baseline value, or even higher. Several mechanisms are involved, such as: heart rate increase, heart contractility improvement, higher venous return, vascular vasodilation in the exercising regions, deepening of ventilation pattern (Balady et al., 2010).
In the presence of cardiac pathologies, one or more of these mechanisms are impaired so that patients experience exercise intolerance. Even subjects asymptomatic at rest condition, such as heart failure patients with preserved ejection fraction, show a reduced exercise performance. For this reason the exercise test is nowadays recognized to be a valuable diagnostic tool for the early detection, or the evaluation of a patient's cardiac and pulmonary diseases (Balady et al., 2010). Exercise intolerance in heart failure condition (HF) is the result of several physiological impairments involving both central and peripheral mechanisms. HF subjects are characterized by a compromised Frank-Starling mechanism, an impaired autonomic and vascular function and a reduced muscular strength (Mezzani et al., 2009). All these factors reduce exercise performance and quality of life in comparison to healthy condition (Healthy).
The analysis of these limiting factors and how they fail to fully adapt during exercise can greatly benefit from the use of a dedicated simulator. The simulator has the advantage that it can provide a quantitative description and a rational cause-effect relationship of physiological events. As previously stated, exercise is the result of complex and multifactorial phenomena. Their representation therefore requires a general cardiorespiratory model, combined with its main control mechanisms.
Previous simulators modeled exercise physiology (Heldt et al., 2002; Magosso and Ursino, 2002; Wang et al., 2007) but they did not include the gas exchange in lungs and tissues nor the ventilation control. Cardiovascular-respiratory models have been developed (Batzel et al., 2007; Cheng et al., 2010) but they are not focused on the representation of physical activity phenomena. Finally, the HumMod (Hester et al., 2011), a model of integrative human physiology, provides a representation of the response of the human body to exercise but its structure is quite complex, as it has been developed for several other general applications.
A cardiorespiratory simulator specifically developed to reproduce the basic mechanisms occurring during exercise, and especially their impairments in HF, could therefore provide an innovative tool to describe and investigate exercise physiology.
The simulator we present here is a full closed loop cardiorespiratory system. It was developed and used to reproduce cycling activity at different workloads in Healthy. The resulting outputs are discussed in this paper and validated with peer-reviewed physiological literature.
In addition, we further adapted the simulator to reproduce the impairments of control mechanisms in HF and the resulting limited exercise performance. A comparative analysis between Healthy and HF exercise is presented, finally, in terms of hemodynamic and respiratory parameters.
Materials and Methods
General Overview of the Simulator
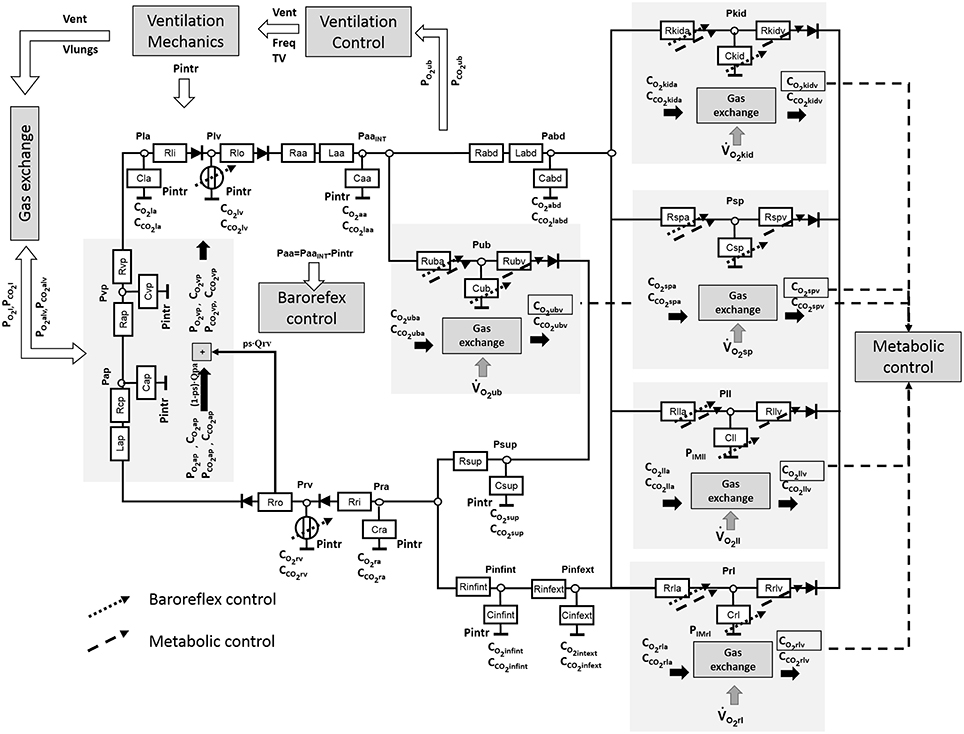
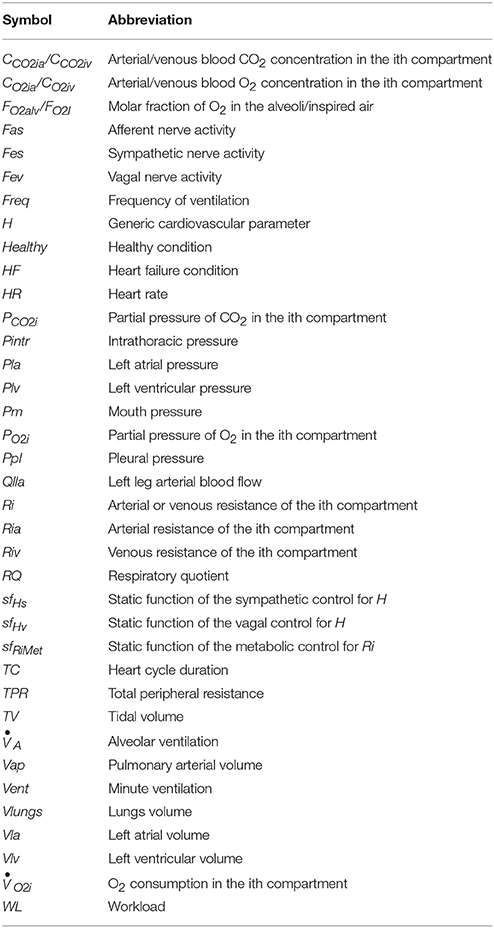
The cardiorespiratory simulator is a lumped parameter model developed in LabVIEW 2014 (National Instrument, Austin, TX, USA). The overview of all its components is provided in Figure 1, the interface is shown in Figure 2. Table 1 reports a list of the main abbreviations used in the text.
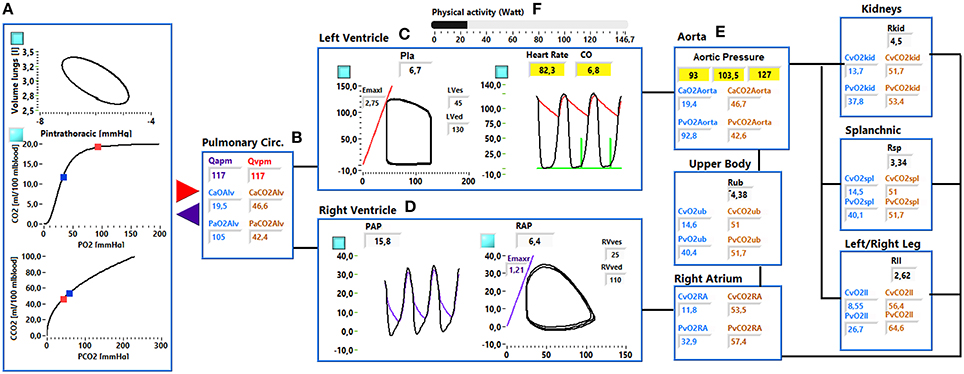
Figure 2. Simulator interface. (A) Shows: the pressure—volume loop of the ventilation system, the O2 and CO2 dissociation curve. Red and blue dots indicate the arterial and venous pulmonary concentration and partial pressures values. (B) Shows the mean arterial and venous pulmonary flows (Qapm, Qvpm) and the CCO2, CO2, PO2, and PCO2 in the alveoli. (C) shows the left ventricular pressure—volume loop (left side) and the systemic arterial and left ventricular pressure waveforms (right side). (D) Shows the right ventricular and pulmonary arterial pressure waveforms (left side) and the right ventricular pressure-volume loop (right side). (E) Shows the arterial resistance (Ri), the CCO2, CO2, PO2, and PCO2 in the ith vascular compartment. (F) Shows the physical activity regulation button.
Cardiovascular Model
The cardiovascular model was already described in Fresiello et al. (2013) and Fresiello et al. (2015). Briefly, atria are represented as passive compliances:
Where Cla represents the elastic properties of the left atrium, Vla and Pla are the left atrial volume and pressure, respectively.
Ventricular contraction is described by the time varying elastance model (Sagawa et al., 1988):
Where Elv is the time varying left ventricular elastance with peak systolic value Elmax, Vlv0 is the left ventricular zero pressure filling volume.
Ventricular filling is represented as a sum of exponential functions:
Where Plv (Vlv) is the left ventricular pressure (volume). The three parameters a, b and c are estimated to reproduce data from Carroll et al. (1983). Similar equations were implemented for the right atrium and ventricle.
The systemic circulation was already presented in Fresiello et al. (2013). It includes the following sections: ascending aorta, descending aorta, upper body, kidneys, splanchnic circulation, left and right legs, superior vena cava, inferior vena cava inside and outside the chest (see Figure 1). For this latter a Starling resistor was introduced to reproduce the effect of ventilation pressures on the collapsible tube (Pedley, 1980). Venous valves are simulated as simple diodes preventing blood flowing backward. The pulmonary circulation is split into arterial and venous sections (see Ferrari et al., 2011 for more details).
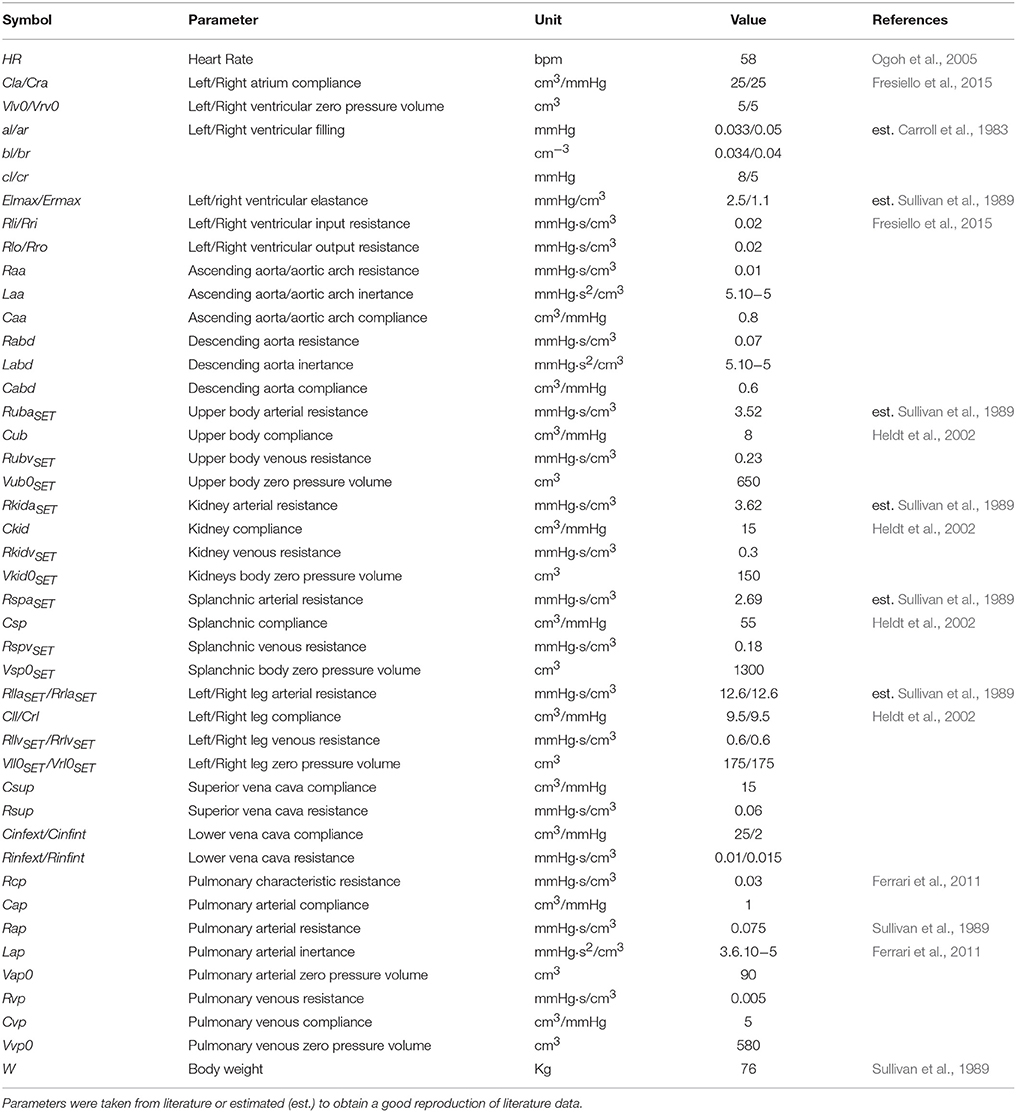
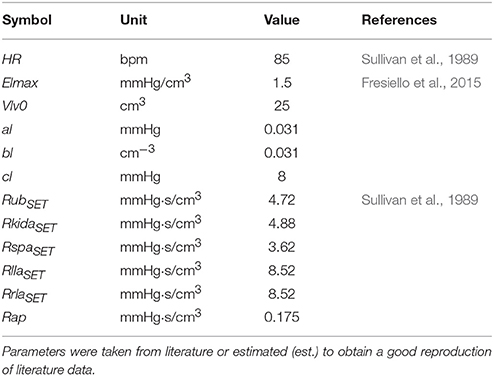
The complete list of cardiovascular parameters is reported in Table 2.
Ventilation Mechanics
The mechanics of the lungs' function were replicated through a simplified model taken from Ben-Tal (2006):
Where R is the resistive element of the airways, whose value was taken from Ben-Tal (2006). E is the elastance element for the lungs whose value was taken from Cross et al. (2012). Vlungs is the lungs volume, Pm is the mouth pressure set equal to the atmospheric pressure and Ppl is the pleural pressure. The latter was reproduced with a sinusoidal function:
Where Freq is the ventilation frequency, TV is the tidal volume and Ppl0 is a constant parameter that represents the mean value of Ppl. The intrathoracic pressure (Pintr) is then calculated as difference between Ppl and the atmospheric pressure and is used for all the compliances of the cardiovascular system inside the chest.
Gas Exchange
Gas exchange in the lung compartment is modeled through a mass balance equation (see Appendix in Supplementary Material):
Where Vap is the pulmonary arterial volume, VEexp(VEinsp) is the alveolar volume at the end of expiration (inspiration), VA is the incremental alveolar volume is the alveolar ventilation over time calculated from dVlungs/dt in equation (4) subtracting the dead space ventilation calculated from equation (12). Qpv is the pulmonary venous blood flow, ps is the pulmonary shunt, CO2ap (CO2vp) is the O2 concentration in the arterial (venous) pulmonary blood, PO2alv (PO2I) is the O2 partial pressure in the alveoli (inspired air).
We assumed that the blood has enough time to be saturated while flowing in the pulmonary circulation, therefore O2 and CO2 partial pressures are equal in the alveoli and in the blood. This assumption is valid unless we consider extreme levels of exercise, which is not the aim of the present work.
The O2 and CO2 concentrations in the blood leaving the lungs are calculated using the dissociation curve developed by Spencer et al. (1979) and Gólczewski (2010), respectively. The O2 and CO2 concentrations in the arterial blood are calculated combining the concentrations of blood leaving the lungs with the mixed venous blood, according to the ps value.
In the tissue compartment, gas exchange is modeled with a mass balance equation:
Where Qia (Qiv) is the arterial (venous) blood flowing inside (outside) the ith compartment, CO2ia is the O2 concentration in the arterial blood stream, CO2iv is the O2 concentration in the venous blood stream, Vi is the blood volume of the ith compartment, is the O2 consumption.
A similar equation was implemented for the CO2 with a production term that takes into account the respiratory quotient (RQ).
We also assume that the diffusion of O2 and CO2 is fast enough to consider that their concentration in the tissue is equal to the one in the venous blood.
Ventilation Control
Ventilation control takes the arterial partial pressure of O2 and CO2 in the upper body (PO2uba and PCO2uba) as input and provides ventilation (Vent) in l/min as output:
Equation (10) is an adaptation of the ventilation control developed by Batzel et al. (2007). PCO2tr is a threshold to start a new ventilation cycle, β is a constant parameter, α and γ are the ventilation control gains for O2 and CO2, respectively. Parameter values were estimated by fitting the data reported by Cormack et al. (1957) and Nunn (1969).
Vent is then expressed as frequency (Freq) and TV:
Where δ and ε are constant parameters obtained by fitting data from seven healthy subjects reported by Weber et al. (1982). TV can be then calculated as the ratio Vent∕Freq and used in Equation (5).
The effective tidal volume used to calculate alveolar ventilation will be then:
Where KDV is the dead volume ratio that takes into account the percentage of dead volume of airways. The value of this parameter was obtained according to the equation reported by Wasserman et al. (1997): dead space/tidal volume = −0.012·(peak O2 uptake) + 0.611. We considered a peak O2 uptake of 34 and 15 ml/min/Kg for Healthy and HF, respectively.
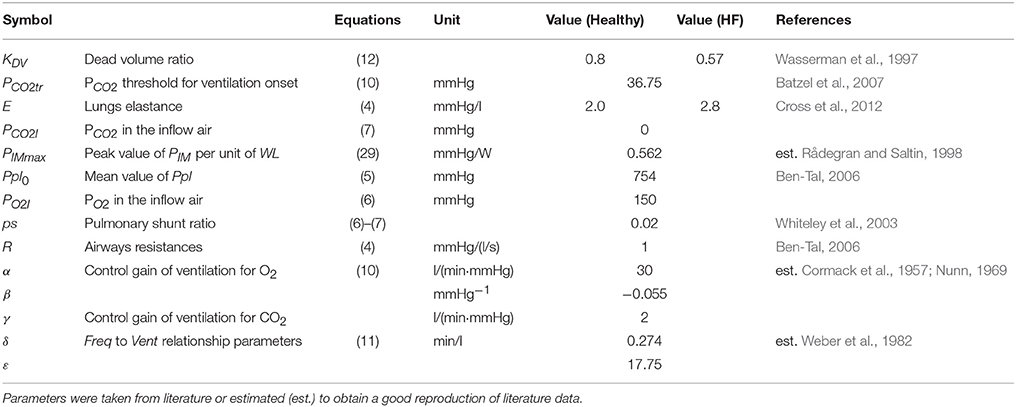
A list of ventilation parameters is reported in Table 3.
Baroreflex Control
The baroreflex model was taken from Ursino (1998) and Fresiello et al. (2013). It provides a representation of the afferent nerve activity, depending on the pressure sensed in the aortic region. In addition, the model reproduces the vagal and sympathetic nerve activity and their effects on cardiovascular parameters. In the model of Ursino (1998) the pressure in the carotid arteries is the input the baroreflex control. Since in the present simulator there is no specific representation of the carotid arteries, the aortic pressure without the effect of the intrathoracic pressure was considered as input pressure for the baroreflex control (Paa). This pressure is used in a linear derivative block:
Where τp and τz are the pole and the real zero. The output variable P(t) has the dimension of a pressure.
To reproduce exercise and the related phenomenon of baroreflex resetting, the model was further changed. Three main mechanisms were implemented: the change of systemic arterial pressure set point PaaSET (strictly related to the operating point of baroreflex), the progressive increment of sympathetic activity (Fes), and the vagal (Fev) withdrawal.
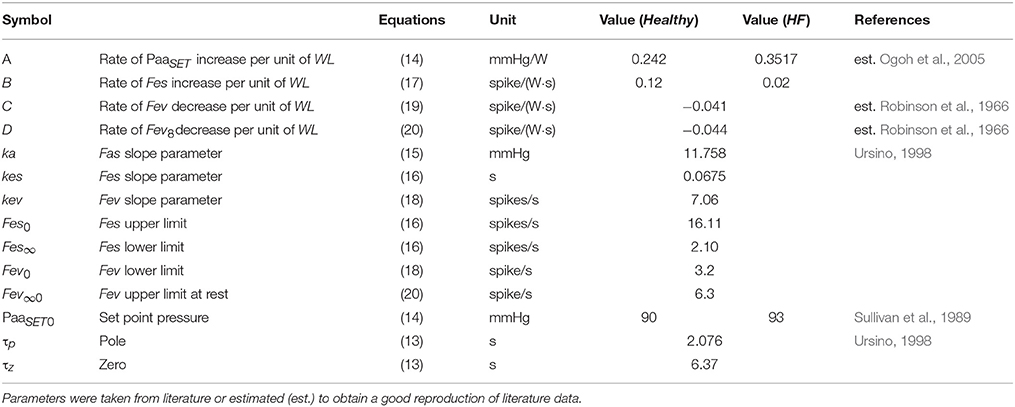
The change of PaaSET was modeled as a function of workload level (WL):
Where PaaSET0 is the set-point pressure at rest condition and A is the rate of increase of PaaSET per workload unit. Its value was estimated to reproduce the data reported by Ogoh et al. (2005).
PaaSET0 is used for the calculation of the afferent sympathetic activity Fas:
Fasmax and Fasmin are constant parameters representing the upper and lower saturation levels of the Fas function, ka is a constant parameter related to the slope of Fas at the central point (obtained for P(t) = PaaSET).
Fas is used to compute the sympathetic nerve activity (Fes):
Where Fes0, Fes∞ and kes are constant parameters, ΔFes is the progressive sympathetic stimulation due to exercise onset. It was implemented as a function of WL:
Where B is the rate of Fes increase per workload unit. Fas is also used to compute the efferent vagal activity (Fev):
Where Fev∞ is the lower limit of vagal nerve activity, kev is a constant parameter related to the slope of the function at the central point (obtained for P(t) = PaaSET). Δfev represents the vagal nerve activity withdrawal and is expressed as a function of WL:
Where C is the rate of Fev increase per workload unit.
Fev∞ in Equation (19) is the upper limit of vagal nerve activity and is also expressed as a function of WL:
Where Fev∞0 is the upper limit of Fev at rest, D is the rate of decrease of Fev∞ so to assure that at intensive exercise levels, Fev = 0, even at higher pressure levels.
The parameters in Equations (17), (19), and (20) were estimated according to the data of Robinson et al. (1966) relative to the sympathetic and parasympathetic controls of HR in humans during exercise. In addition, to estimate the parameters in Equations (19) and (20), we also imposed a nearly complete vagal withdrawal when HR reaches 100 bpm during exercise. This is in agreement with what was reported by Rowell and O'Leary (1990).
Fes and Fev are then used to obtain the static sympathetic and vagal functions (sfHs and sfHv):
Where DHs (DHv) is the sympathetic (vagal) delay, CHs (CHv) is the sympathetic (vagal) control gain for the parameter H. FesSET (FevSET) is the value of Fes (Fev) at the central point (obtained for Paa = PaaSET).
The final control of the cardiovascular parameter H due to sympathetic nerve activity will be:
Where ΔHs is the change of H due to the sympathetic control, HSET is the set-point value of H, and THs is the time constant of the sympathetic control. For the vagal control a similar equation was implemented.
The model is arranged in such a way that for Paa = PaaSET the hemodynamic parameters assume their set-point value (H = HSET). If Paa differs from PaaSET the baroreflex will induce a change of the hemodynamic parameters. In particular the sympathetic control will affect the left and right ventricular contractility, the arterial resistance and the venous tone. For HR both sympathetic and parasympathetic controls are considered so that the final regulation will be:
Where TC is duration of a cardiac cycle, TCSET is the set-point TC, ΔTCs, and ΔTCv are the changes due to sympathetic and vagal nerve activity, respectively.
A list of parameters used for baroreflex resetting and control is reported in Tables 4, 5.
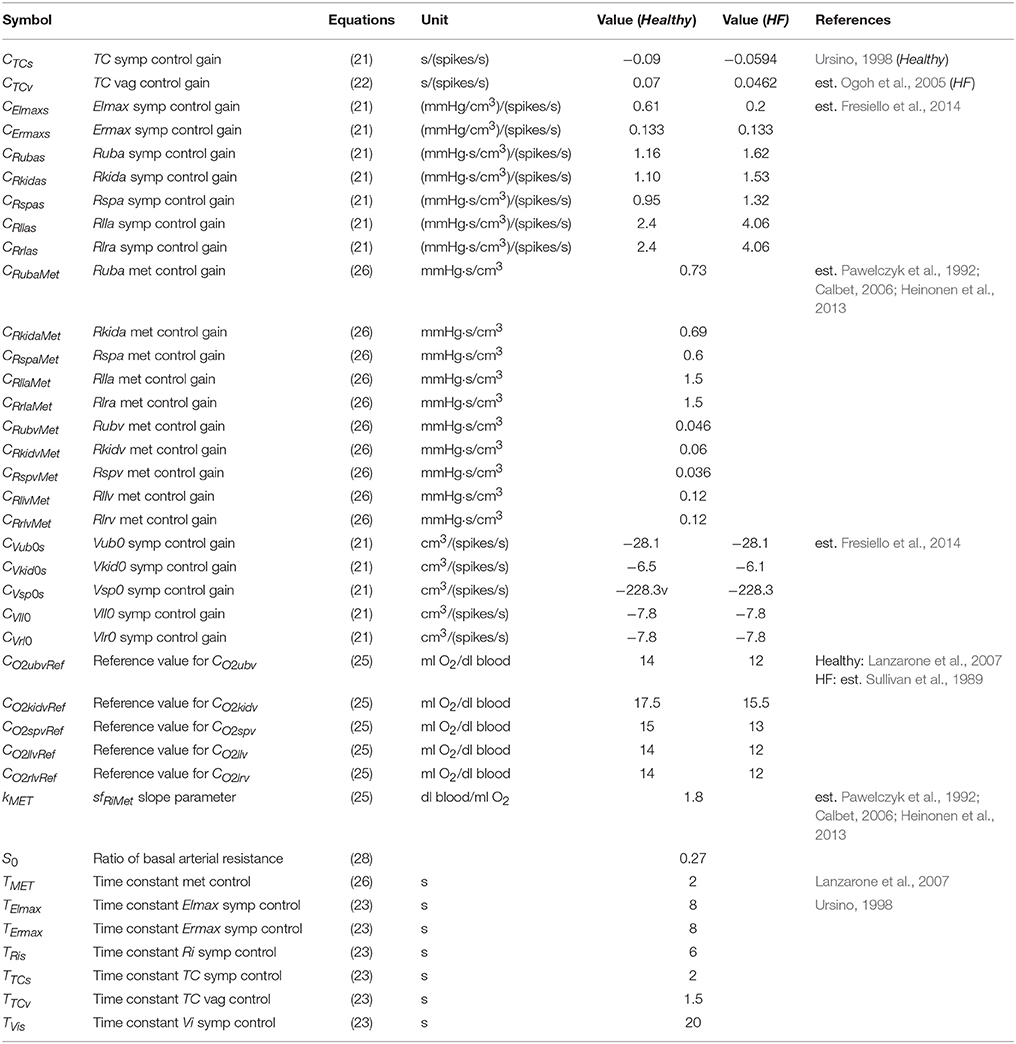
Table 5. List of parameters used for the sympathetic (symp), vagal (vag), and metabolic (met) controls.
Peripheral Metabolic Control
The metabolic control is a sigmoidal function estimated on the basis of data observed in human subjects (Pawelczyk et al., 1992; Calbet, 2006; Heinonen et al., 2013).
Where CO2iv is the venous oxygen concentration in the ith circulatory district and CO2ivRef is its reference value taken from Lanzarone et al. (2007). The static function sfRiMet is then used in the first order dynamic block that controls the peripheral arterial and venous resistance of each circulatory district:
Where ΔRiMet is the change induced by the metabolic control, TMet is the time constant of the metabolic control. CRiMet is the control gain estimated from the data reported by Pawelczyk et al. (1992) and Gonzalez-Alonso et al. (2002). The final control of the venous resistance of the ith vascular compartment (Riv) will be:
Where RivSET is the set-point value of the venous resistance of ith vascular district. The metabolic control is arranged in a way that if CO2iv = CO2ivRef then Riv = RivSET.
The control of the arterial resistances is discussed in the next paragraph. The list of metabolic control parameters is reported in Table 5.
Metabolic and Baroreflex Interaction
An important mechanism during exercise is the sympatholysis which determines the mutual interaction of baroreflex and metabolic systems in the control of peripheral circulation. The metabolic control counteracts sympathetic vasoconstriction in exercising regions, as some local factors and substances reduce the sensitivity of vascular smooth muscle to sympathetic tone (Laughlin et al., 2011). To reproduce the sympatholysis effect we implemented the control of the arterial peripheral resistance as follows:
In Equation (28) the metabolic control sfRiMet(t) affects ΔRias(t) so that when the metabolic vasodilation occurs, the sympathetic effect also reduces. S0 is a constant parameter that reproduces the arterial resistance when the sympathetic vasoconstriction is completely abolished (Pawelczyk et al., 1992; Calbet, 2006; Heinonen et al., 2013). Its use is discussed in more detail in paragraph 3.3.1.
Muscle Contraction
Muscle contraction in the exercising regions is represented by a sinusoidal function. We adapted the one reported by Magosso and Ursino (2002) to reproduce different levels of WL.
PIMll and PIMrl are two sinusoidal functions reproducing the intramuscular pressure of the left and right leg respectively. Their frequency was set to 1 Hz considering a cycling rate of 60 rotations per minute. Their amplitude depends on the value PIMmax and on the workload set on the bicycle. PIMmax was estimated on the basis of data reported by Rådegran and Saltin (1998).
Parameter Assignment
Parameter assignment was performed to characterize the simulator at rest condition for Healthy and HF. Then, the exercise was simulated in both conditions and model output was compared with the data in the literature (see next paragraph).
Cardiovascular parameters were set as reported in Fresiello et al. (2015). Some parameters were taken from Sullivan et al. (1989) referring to average data of 12 healthy subjects and of 30 chronic heart failure patients at rest condition, before starting the exercise test. In particular we set pulmonary resistances, lower limbs' and total systemic arterial resistance and the blood volume on the basis of body weight. A complete list of cardiovascular parameters for Healthy at rest is reported in Table 2.
To reproduce HF condition we changed the left ventricular systolic and diastolic functions. The choice of parameter values was already explained in Fresiello et al. (2015) and will be omitted here for brevity. Vascular parameters were changed according to data reported by Sullivan et al. (1989). The complete list of cardiac and vascular parameters that were changed for HF representation is reported in Table 6.
Baroreflex sub-model parameters are reported in Tables 4, 5. Briefly, gain values of the baroreflex control were characterized as reported in Fresiello et al. (2013). The shift of PaaSET was reproduced according to the data reported by Ogoh et al. (2005). Vagal withdrawal parameters were estimated to reproduce data from Rowell and O'Leary (1990) and Robinson et al. (1966). The sympathetic stimulation parameters were estimated in order to reproduce the data reported by Robinson et al. (1966).
For HF condition the sympathetic stimulation parameters were obtained fitting the data from Sullivan et al. (1989).
The metabolic control function was set so as to obtain a good reproduction of the data in the literature (Pawelczyk et al., 1992; Calbet, 2006; Heinonen et al., 2013). These data refer to the mere metabolic control of peripheral resistance during exercise in the absence of a sympathetic effect. CO2ivRef in Healthy was set according to Lanzarone et al. (2007). For the HF we considered a lower CO2ivRef at rest, as reported in Sullivan et al. (1989). The complete list of metabolic parameters is provided in Table 5. The sympatholysis function described in Equation (28) was estimated on the basis of data from Pawelczyk et al. (1992) and Gonzalez-Alonso et al. (2002) referring to both sympathetic and metabolic control during exercise.
Ventilation control parameters were obtained by fitting data from Cormack et al. (1957) and Nunn (1969). Parameters relative to ventilation frequency and tidal volume in Equation (11) were estimated by fitting data from Weber et al. (1982).
Validation Procedure
After the assignment of parameters at rest, we simulated graded bicycle exercise from rest to 73 watts. To reproduce Healthy exercise we fed the simulator with increasing levels of oxygen consumption:
Where is resting regions O2 uptake, () is left (right) leg O2 uptake expressed as function of workloads. VO2RR is divided among all resting circulatory branches as follows: 30% for the upper body, 32% for kidney and 38% for splanchnic circulation.
For the RQ we used the following formula:
A similar procedure was performed for , () and RQ in HF:
HF is characterized by lower values of oxygen uptake in both exercising and resting regions and by an earlier anaerobic metabolism in comparison to Healthy.
Equations (30) to (35) were obtained by interpolating data from Sullivan et al. (1989).
To reproduce the exercise we initially set the simulator at rest condition and we left the simulator free to evolve and reach the steady condition at 24.5 watts, 49 watts and 73 watts. For each exercise step data were then averaged over 15 heart cycles and reported as mean values. Simulations were then compared to the exercise test data from Sullivan et al. (1989) concerning isokinetic cycling with a graded workload of +24.5 watts/3 min.
Results
Sub-Models
This first part of the results' section is devoted to further illustrating some of the sub-models described in the methods section. We focus on baroreflex, metabolic and ventilation controls.
Figure 3 shows the “baroreflex resetting” described in Equations (13) to (22). We simulated the stimulus-response curve of the baroreflex model in an open-loop configuration, by imposing an aortic pressure ranging from 0 to 200 mmHg. We repeated this procedure at rest condition at three different exercise levels (35, 61, and 87 watts). Figure 3A shows the progressive increase of PaaSET described in Equation (14) and the relative effects on Fas as described in Equation (15). Figure 3B shows the progressive vagal withdrawal with the increasing of the exercise level described in Equations (18)−(20). The effect of vagal withdrawal on HR is shown in Figure 3C. We obtained an increment of HR of +28 bpm (from 57 to 85 bpm), similar to the average increase of +36 bpm reported by Robinson et al. (1966). Figure 3D shows the sympathetic stimulation for increasing levels of exercise as described in Equations (16) and (17). The related effects on HR are shown in Figure 3C. We obtained an average HR increase of +18 bpm (from 58 to 66 bpm), similar to the increase of +16 bpm reported by Robinson et al. (1966). The final control of HR, obtained by combining both Fes and Fev, is shown in Figure 3F. Model results are compared with the data in the literature from Ogoh et al. (2005) relative to rest, 31 watts and 85 watts conditions.
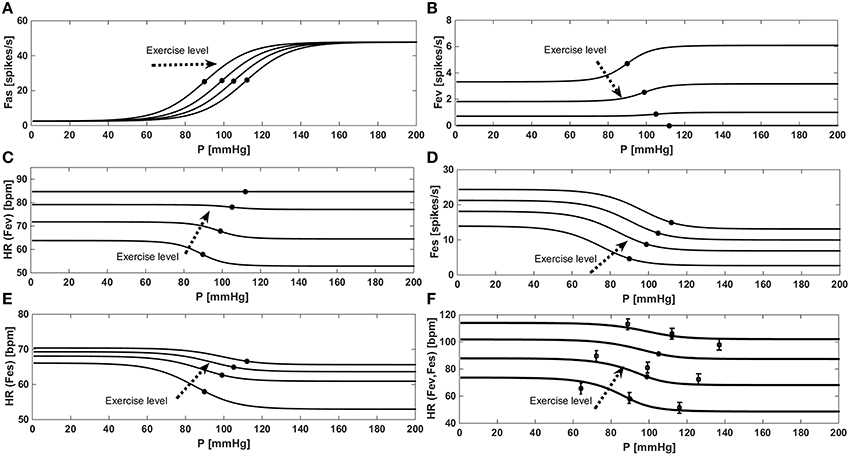
Figure 3. Results of the baroreflex resetting model for different levels of physical activity. Dots represent baroreflex central point (for Paa = PaaSET). (A) Fas as a function of aortic pressure in a baroreflex open loop configuration. (B) Progressive vagal withdrawal for increasing levels of exercise. (C) Effects of vagal withdrawal on HR. (D) Progressive sympathetic stimulation for increasing levels of exercise. (E) Effects of sympathetic stimulation on HR. (F) Overall effects of baroreflex resetting (both Fev and Fes) on HR, comparison between simulations data (continuous line) and the data (■) from Ogoh et al. (2005).
Figure 4 provides a comparison between model results and the data in the literature for the metabolic control. Figure 4A shows a comparison between the model we implemented and the data of Pawelczyk et al. (1992), Calbet (2006) and Heinonen et al. (2013). These data refer to the metabolic control during exercise with a complete suppression of sympathetic vasoconstriction. To reproduce these data we removed the sympathetic contribution to peripheral resistance in Equation (28), obtaining Ria(t) = RiaSET·S0 + ΔRiaMET.
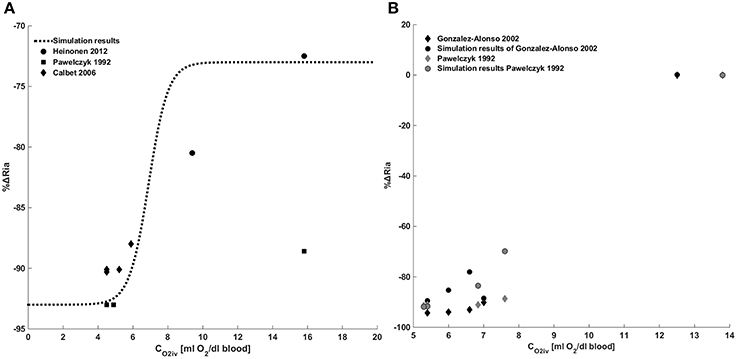
Figure 4. Metabolic control of peripheral resistance. (A) Percentage change of the peripheral resistance due to a change in venous oxygen concentration during exercise in the absence of a sympathetic control. Comparison between simulations output and the data from Pawelczyk et al. (1992) and Gonzalez-Alonso et al. (2002). (B) Percentage change of the peripheral resistance due to a change in venous oxygen concentration during exercise in presence of sympathetic control. Comparison between simulations output and the data from Pawelczyk et al. (1992), Calbet (2006) and Heinonen et al. (2013).
Figure 4B shows a comparison between simulation results and the data in the literature taken from Pawelczyk et al. (1992) and Gonzalez-Alonso et al. (2002). These data refer to the systemic resistance regulation during exercise in the presence of both metabolic and sympathetic controls. Results show that for CO2iv = CO2ivRef no changes of resistances are observed, for CO2iv < CO2ivref a vasodilation is induced by the metabolic control.
Figure 5 shows the ventilation control as implemented in Equation (10). Figure 5A shows the ventilation as a function of PO2 for two constant values of PCO2. Simulations were repeated at rest condition and at WL = 73 watts and compared with data from Cormack et al. (1957). Figure 5B shows the ventilation as a function of PCO2 for two constant values of PO2. In this case also, simulations were repeated at rest condition and at WL = 73 watts, and results were compared with data from Nunn (1969).
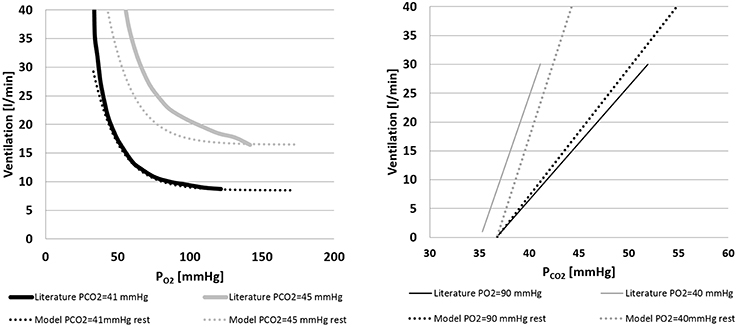
Figure 5. Left panel: ventilation over PO2 for two constant values of PCO2(41 and 45 mmHg). Comparison between literature (Cormack et al., 1957) and model data. Right panel: ventilation over PCO2 for two constant values of PO2(40 and 90 mmHg). Comparison between model output and the data from Nunn (1969) and model output.
Exercise Data
In this second part of the results' section the output of the cardiovascular simulator for graded exercise is shown.
Figures 6, 7 show simulation results for both Healthy and HF at rest, at a workload of 24.5, 49, and 73 watts. In the text we will refer only to results at rest and at 73 watts, for brevity.
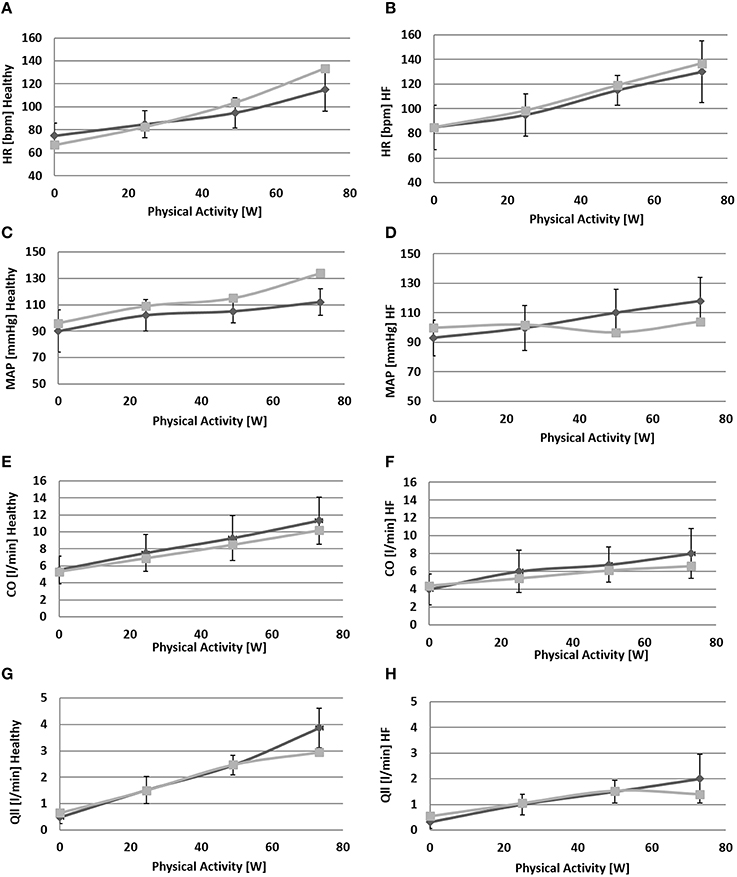
Figure 6. Comparison between simulations output (light gray) and the data (light gray) from Sullivan et al. (1989). Left panels refer to healthy condition and right panels to heart failure condition. From (A) to (H): heart rate (HR), mean arterial pressure (MAP), total cardiac output (CO), single leg flow (Qlla).
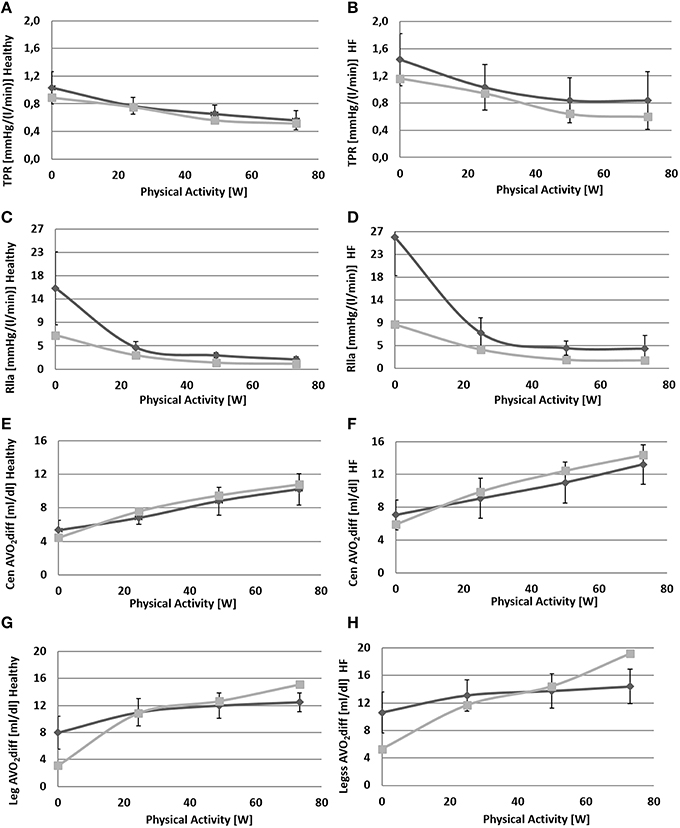
Figure 7. Comparison between simulations output (light gray) and data (dark gray) from Sullivan et al. (1989). Left panels refer to healthy condition and right panels to heart failure condition. From (A) to (H): total peripheral resistance (TPR), single leg resistance (Rlla), central arteriovenous oxygen difference, leg arteriovenous oxygen difference.
Due to baroreflex resetting HR increases for both Healthy (67–134 bpm) and HF (85–137 bpm). Total peripheral resistance decreases from 0.9 to 0.5 mmHg/(cm3/s) in Healthy and from 1.2 to 0.6 mmHg/(cm3/s) in HF. This is mainly due to the vasodilation of the lower limbs induced by the metabolic control. Single leg resistance, in fact, decreases from 6.5 to 1.0 mmHg/(cm3/s) for Healthy and from 8.7 to 1.6 mmHg/(cm3/s) for HF.
All these phenomena contribute to accommodating a higher CO during exercise: from 5.3 to 10.2 l/min in Healthy and from 4.4 to 6.6 l/min in HF. This increase is mostly addressed to better perfuse the legs. Single leg blood flow increases both in Healthy (0.7–3.0 l/min) and in HF (0.6–1.4 l/min). In terms of percentage, the flow of both legs is 26% of CO at rest and 59% during exercise in Healthy. For HF blood flow is 25% at rest and 42% during exercise.
The change in TPR and in CO also affects mean systemic arterial pressure (MAP): we observe an increment of MAP in Healthy (92–134 mmHg) while for HF, pressure attains at a rather constant value.
Figure 7 also provides some data about the ventilation section. The increment of oxygen uptake is reflected in the central arteriovenous oxygen difference that rises from 4.5 ml/dl to 10.8 ml/dl in Healthy and from 5.9 to 14.4 ml/dl in HF. Lower limbs show the highest augmentation in arteriovenous oxygen difference: from 3.1 to 15.1 ml/dl in Healthy and 5.3–19.2 ml/dl in HF.
Ventilation data are shown in Figure 8. In Healthy condition, ventilation increases from 6.1 to 25.5 l/min (Figure 8A), and in HF an even higher increase is observed (9.2–40.2 l/min, Figure 8B).
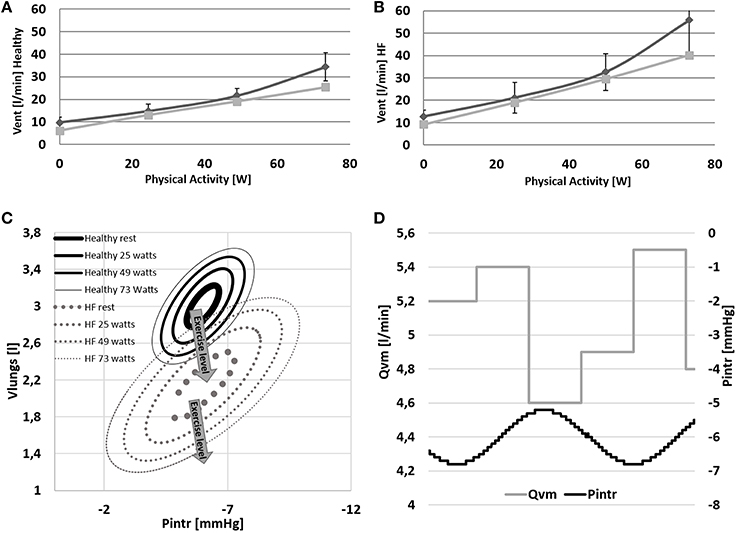
Figure 8. (A,B) Comparison between simulations output (light gray) and data (dark gray) from Sullivan et al. (1989). Data refer to ventilation in Healthy and HF conditions. (C,D) Pressure volume loop of the ventilation system at rest and at 24–48–73 watts of workload. Lower right panel: example of the effect of the intrathoracic pressure profile (Pintr) on mean venous return (Qvm).
The change of ventilation pattern from rest to exercise is shown in Figure 8C. During exercise ventilation raises with a consequent increase of tidal volume and a deepening of Pintr during inspiration.
The mechanical effect of ventilation on venous return is shown in Figure 8D. During inspiration Pintr decreases thus improving venous return, the opposite effect is observed during expiration.
Discussion
The cardiorespiratory simulator is composed of a cardiovascular model (Fresiello et al., 2015) integrated with respiratory and gas exchange models. Exercise was simulated by augmenting O2 uptake in specific regions, differentiating among exercising and non-exercising ones. Three regulations were implemented: the baroreflex, the metabolic and the ventilation controls.
The simulator shares some aspects with the one developed by Magosso and Ursino (2002): it provides a representation of exercise and resting vascular regions, baroreflex and metabolic regulations and the effect of muscle contraction on venous pressure.
The present work includes all these mechanisms plus some others. As we wanted to reproduce HF condition, we implemented a more sophisticated cardiovascular system, further developing some of the elements introduced by Magosso and Ursino (2002). In addition, we included the effect, gas exchange and the ventilation control that permitted the simulation of respiratory patterns and local arteriovenous oxygen differences.
The simulator does not provide a description of the overall human physiology (as in the case of Hester et al., 2011), but focuses only on those mechanisms that play a key role in exercise performance. This reduces the complexity of the overall structure, minimizing the number of equations and parameters. Such a simplification makes the simulator more easily adaptable for future research aimed at representing patients' specific conditions. An example of model personalization was already developed for the cardiovascular system and presented in Fresiello et al. (2015). As a future application, the proposed simulator will be used to reproduce a patient's specific hemodynamic and ventilation status, both at rest and exercise conditions.
The simulator reproduces the main cardiorespiratory changes observed during exercise for both Healthy and HF. The latter required a new parameter assignment for the cardiovascular, respiratory, baroreflex, and metabolic sub-models.
For HF we simulated a systolic impairment by reducing the Elmax parameter. The diastolic impairment, typical in chronic heart failure, was introduced by changing the filling characteristic. We also reproduced systemic and pulmonary hypertension by increasing the corresponding resistances (see Table 6 for more details).
For the baroreflex resetting we implemented the change of set-point pressure, the sympathetic overstimulation and the vagal withdrawal. All these mechanisms provoke heart chronotropy and inotropy and vasoconstriction for concurrent increasing values of aortic pressure. For HF the inotropic effect of baroreflex is less pronounced, since ventricular scar tissue has no capability to improve its contractility. This effect was simulated with a reduced sympathetic control gain on Emaxl (see Table 5, parameter CElmaxs). As a consequence, left ventricular contractility increases less in HF (1.5–1.7 mmHg/cm3) than in Healthy (2.5–2.9 mmHg/cm3). Baroreflex also regulates the amount of blood stored in venous vessels thus contributing to the augmentation of cardiac output. During exercise, the sympathetic nervous system provokes a splanchnic arteriolar vasoconstriction and reduces venous capacity. As a result, a certain amount of blood is transferred from the splanchnic region to the large vessels and then to the heart (Laughlin et al., 2011). This mechanism was represented in our simulator through the sympathetic control of venous tone (Vsp0). As a final result we obtained a blood shift from the splanchnic region to the rest of the circulation of 287 cm3 in Healthy and of 206 cm3 in HF.
The increase in oxygen uptake lowers venous oxygen content such that the arteriovenous oxygen difference increases (see Figures 7E–H). This triggers the metabolic vasodilation especially in the exercising regions, where more blood needs to be supplied. The metabolic control shows a different behavior in Healthy and HF. In HF patients in fact, the chronic exposure of peripheral vessels to lower oxygen saturations makes the metabolic control less efficient. We reproduced this phenomenon by simply setting a lower CO2ivRef in HF. This resulted in a reduced vasodilation during exercise, a lower perfusion, and higher arteriovenous oxygen difference in the exercising regions (see Figures 6H, 7D–H).
We also reproduced the sympatholysis effect, so that when a circulatory district exhibits a higher metabolic activity, the sensitivity of this region to sympathetic control is reduced. The interaction of sympathetic and metabolic regulations is fundamental for blood pressure and CO. The sympathetic outflow evokes peripheral vasoconstriction preventing a hypotension phenomenon, while the metabolic control improves perfusion where it is needed. The balance between these two mechanisms determines the final value of total peripheral resistance and the repartition of CO between exercising and non-exercising regions. Blood flow in the resting end organs is different between Healthy and HF: it stays rather constant in Healthy (4.0–4.2 l/min) and increases in HF (3.3–3.8 l/min). The reason for this opposite phenomenon, penalizing legs perfusion in HF, lies in the different regulation of peripheral resistances in resting regions. Combining upper body, kidneys and splanchnic districts we obtain an overall resistance at rest of 1.2 mmHg·s/cm3 for Healthy and 1.6 mmHg·s/cm3 for HF. At exercise we observe a vasoconstriction in Healthy (1.6 mmHg·s/cm3) while a slight vasodilation is observed for HF (1.4 mmHg·s/cm3).
From the model's point of view, this difference might reside in the lower central arteriovenous oxygen difference observed in HF during exercise (Figures 7E,F). This might have strengthened the metabolic vasodilation response of resting regions, preventing the sympathetic vasoconstriction from reducing oxygen supply. Similarly (Sullivan et al., 1989) report that HF patients, suffering from a low perfusion already at rest, show an increase of resting regions' blood flow to avoid possible ischemia in vital organs.
Some other differences between Healthy and HF are also observed at the different respiratory levels. HF shows a higher ventilation already at rest condition (6.1 l/min for Healthy and 9.2 l/min for HF). This difference increases even further with exercise (25.5 l/min for Healthy and 40.2 l/min for HF). The higher ventilation response in HF is the result of the increased RQ and of the reduced perfusion of ventilated lungs (Wasserman et al., 1997). The first phenomenon is due to the buffering of the accumulated lactic acid during exercise. Its representation goes beyond the aim of the present work but Equations (31) and (34) permit some consideration of this effect (RQ = 1.32 for HF and RQ = 0.96 for Healthy at WL = 73 watts). The reduced perfusion of ventilated lungs in HF was reproduced with a higher dead volume of the airways. This parameter was quantified according to Wasserman et al. (1997) reporting data of both healthy and heart failure subjects. Finally, the higher lungs elastance used for HF simulations, permitted to mimic an increased resistance to volume expansion. As a consequence, in HF a wider change of intrathoracic pressure is needed to obtain similar tidal volumes of Healthy (see Figure 8C).
With regard to the quality of simulations, we obtained a good match between our results and the data in the literature. The highest error was observed for legs parameters in both Healthy and HF. This discrepancy is due to a different value of the initial resistance at rest fed to the simulator (estimated from total peripheral resistance as reported in Fresiello et al., 2015), and the one of Sullivan et al. (1989). The difference between simulated and literature legs arteriovenous O2 difference (see Figure 7H) at WL = 73 is probably due to the anaerobic effect which was not taken into account as it goes beyond the scope of the present work.
In HF condition, all the phenomena described above and the relative impairments lead to a reduced capability to increase cardiac output adequately and to provide a sufficient perfusion to the exercising regions.
The present simulator can reproduce exercise capacity in Healthy and the basic pathophysiological mechanisms, limiting exercise capacity in HF. As a next step the simulator will be used to reproduce some diseases such as valve insufficiency, anemia, muscle tone impairment, chronotropic incompetence etc. The simulator will be used to evaluate how these diseases impair exercise and its related hemodynamic and ventilation parameters. The simulator will be used also to reproduce some therapies used in heart failure condition (i.e., medication, ventricular assist devices) and predict their effects on exercise capacity.
Study Limitations
The present simulator provides an overview of the main mechanisms occurring during aerobic exercise. Some simplifications were introduced to the model, as explained below.
At present the mechanisms leading to baroreflex resetting at the afferent level and their mutual interaction are not completely understood (Bevegård and Shepherd, 1996; Potts and Mitchell, 1998). The authors therefore implemented the resetting phenomenon directly at the efferent level.
The metabolic control model does not take into account the effects of different metabolites (other than hypoxia) on vasodilation during exercise (Pawelczyk et al., 1992). A more detailed metabolic control could better reproduce the arteriovenous oxygen difference in the legs for higher levels of exercise in HF, when anaerobic exercise occurs.
The model of pulmonary circulation is rather simple and does not include O2 and CO2 effects on vascular tone. Its simple structure permits an easy match with the implemented respiratory system which is also a simplified version including only one chamber, with no gravity ventilation-perfusion mismatch effect. Further improvements need to be implemented in order to get better simulation results, especially in terms of ventilation at higher levels of exercise.
Conclusions
The proposed simulator permits the reproduction of the main physiological phenomena occurring during exercise at the level of cardiocirculatory and respiratory systems:
• cardiac output increase and its distribution among exercising and non-exercising regions,
• increase of heart activity and of vascular tone due to baroreflex resetting,
• peripheral resistance changes as a result of the combination of metabolic and baroreflex controls,
• central and local arteriovenous oxygen difference,
• increase of ventilation due to O2 and CO2 partial pressure changes during exercise.
Moreover, the simulator can reproduce heart failure condition, the related impairment of control mechanisms and their effects on exercise performance. The present simulator is suitable for such future applications as the representation of end-stage heart failure patients and the impact of therapies (such as drugs and ventricular assist devices) on their exercise performance.
Author Contributions
LF conception and design of the work, data collection, analysis and interpretation, manuscript drafting, final approval of the version to be published, agreement to be accountable for all aspects of the work in ensuring that questions related to the accuracy or integrity of any part of the work are appropriately investigated and resolved; BM, AD data interpretation, critical revision of the paper, final approval of the version to be published, agreement to be accountable for all aspects of the work in ensuring that questions related to the accuracy or integrity of any part of the work are appropriately investigated and resolved; GF supervision of work organization and development, data interpretation for important intellectual content, final approval of the version to be published, agreement to be accountable for all aspects of the work in ensuring that questions related to the accuracy or integrity of any part of the work are appropriately investigated and resolved.
Conflict of Interest Statement
The authors declare that the research was conducted in the absence of any commercial or financial relationships that could be construed as a potential conflict of interest.
The reviewer WAP and handling Editor declared a common affiliation and the handling Editor states that the process nevertheless met the standards of a fair and objective review.
Acknowledgments
The present work was funded by a FP7 Marie Curie Scholarship (“VAD and exercise”, GA N. PIEF-GA-2013-624296).
Supplementary Material
The Supplementary Material for this article can be found online at: http://journal.frontiersin.org/article/10.3389/fphys.2016.00189
References
Balady, G. J., Arena, R., Sietsema, K., Myers, J., Coke, L., Fletcher, G. F., et al. (2010). Guide to cardiopulmonary exercise testing in adults: a scientific statement from the American Heart Association. Circulation 2, 191–225. doi: 10.1161/CIR.0b013e3181e52e69
Batzel, J. J., Kappel, F., Schneditz, D., and Tran, H. T. (2007). “Respiratory Modeling,” in Cardiovascular and Respiratory Systems. Modelling Analysis and Control, Vol. 63, eds J. J. Batzel, F. Kappel, D. Schneditz, and H. T. Tran (Philadelphia, PA: SIAM Press), 64–91.
Ben-Tal, A. (2006). Simplified models for gas exchange in the human lungs. Theor. J. Biol. 2, 474–495. doi: 10.1016/j.jtbi.2005.06.005
Bevegård, B. S., and Shepherd, J. T. (1996). Circulatory effects of stimulating the carotid arterial stretch receptors in man at rest and during exercise. J. Clin. Invest. 45, 132–142.
Calbet, J. A. L. (2006). Effects of ATP-induced leg vasodilation on VO2 peak and leg O2 extraction during maximal exercise in humans. AM. J. Physical. Regul. Integr. Comp. Physiol. 291, R447–R453. doi: 10.1152/ajpregu.00746.2005
Carroll, J. D., Hess, O. M., Hirzel, H. O., and Krayenbuehl, H. P. (1983). Dynamics of left ventricular filling at rest and during exercise. Circulation 1, 59–67.
Cheng, L., Ivanova, O., Fan, H., and Khoo, C. K. M. (2010). An integrative model of respiratory and cardiovascular control in sleep-disordered breathing. Respir. Physiol. Neurobiol. 174, 4–28. doi: 10.1016/j.resp.2010.06.001
Chiari, L., Avanzolini, G., and Urisno, M. (1997). A comprehensive simulator of the human respiratory system: validation with experimental and simualated data. Anna. Biomed. Eng. 25, 985–999.
Cormack, R. S., Cunningham, D. J., and Gee, J. B. (1957). The effect of carbon dioxide on the respiratory response to want of oxygen in man. Q. J. Exp. Physiol. Cogn. Med. Sci. 3, 303–319.
Cross, T. J., Sabapathy, S., Beck, K. C., Morris, N. R., and Johnson, B. D. (2012). The resistive and elastic work of breathing during exercise in patients with chronic heart failure. Euro. Respir. J. 39, 1449–1457. doi: 10.1183/09031936.00125011
Ferrari, G., Khir, A. W., Fresiello, L., Di Molfetta, A., and Kozarski, M. (2011). Hybrid model analysis of intra-aortic balloon pump performance as a function of ventricular and circulatory parameters. Artif. Organs 9, 902–911. doi: 10.1111/j.1525-1594.2011.01244.x
Fresiello, L., Ferrari, G., Di Molfetta, A., Zieliński, K., Tzallas, A., Jacobs, S., et al. (2015). A cardiovascular simulator tailored for training and clinical uses. J. Biomed. Inform. doi: 10.1016/j.jbi.2015.07.004. [Epub ahead of print].
Fresiello, L., Khir, A. W., Di Molfetta, A., Kozarski, M., and Ferrari, G. (2013). Effects of intra-aortic balloon pump timing on baroreflex activities in a closed-loop cardiovascular hybrid model. Artif. Organs 3, 237–247. doi: 10.1111/j.1525-1594.2012.01540.x
Fresiello, L., Zieliński, K., Jacobs, S., Di Molfetta, A., Pałko, K. J., Bernini, F., et al. (2014). Reproduction of continuous flow left ventricular assist device experimental data by means of a hybrid cardiovascular model with baroreflex control. Artif. Organs 6, 456–468. doi: 10.1111/aor.12178
Gólczewski, T. (2010). “Model of gas transfer and exchange,” in Virtual Respiratory System in Research and Education–Principles and Applications, ed T. Gólczewski (Warsaw: IBBE PAN Works Press), 44.
Gonzalez-Alonso, J., Olsen, D. B., and Saltin, B. (2002). Erythrocyte and the regulation of human skeletal muscle blood flow and oxygen delivery: role of circulating ATP. Circul. Res. 1, 1046–1055. doi: 10.1161/01.RES.0000044939.73286.E2
Heinonen, I., Wendelin-Saarenhovi, M., Kaskinoro, K., Knuuti, J., Scheinin, M., and Kalliokoski, K. K. (2013). Inhibition of –adrenergic tone disturbs the distribution of blood flow in the exercising human limb. Am. J. Physicol. Heart Circul. Physiol. 305, H163–H172. doi: 10.1152/ajpheart.00925.2012
Heldt, T., Shim, E. B., Kamm, R. D., and Mark, R. G. (2002). Computational modeling of cardiovascular response to orthostatic stress. J. Appl. Physiol. 92, 1239–1254. doi: 10.1152/japplphysiol.00241.2001
Hester, R. L., Brown, A. J., Husband, L., Iliescu, R., Pruett, D., Summers, R., et al. (2011). HumMod: a modeling environment for the simulation of integrative human physiology. Front Physiol. 2:12. doi: 10.3389/fphys.2011.00012
Lanzarone, E., Liani, P., Baselli, G., and Costantino, M. L. (2007). Model of arterial tree and peripheral control for the study of physiological and assisted circulation. Med. Eng. Phys. 29, 542–555. doi: 10.1016/j.medengphy.2006.08.004
Laughlin, M. H., Korthuis, R. J., Duncker, D. J., and Bach, R. J. (2011). “Control of blood flow to cardiac and skeletal muscle during exercise,” in Handbook of Physiology, Exercise: Regulation and Integration of Multiple Systems, eds L. B. Rowell and J. T. Shepherd (New York, NY: Oxford University Press, Inc.), 705–769.
Longobardo, G. S., Cherniack, N. S., and Fishman, A. P. (1966). Cheyne-Stokes breathing produced by a model of the human respiratory system. J. Appl. Physiol. 21, 1839–1846.
Magosso, E., and Ursino, M. (2002). Cardiovascular response to dynamic aerobic exercise: a mathematical model. Med. Biol. Eng. Comput. 6, 660–674. doi: 10.1007/BF02345305
Mezzani, A., Agostoni, P., Cohen-Solal, A., Corrà, U., Jegier, A., and Kouidi, E. (2009). Standards for the use of cardiopulmonary exercise testing for the functional evaluation of cardiac patients: a report from the Exercise Physiology Section of the European Association for Cardiovascular Prevention and Rehabilitation. Eur. J. Cardiovasc. Prev. Rehabil. 16, 249–267. doi: 10.1097/HJR.0b013e32832914c8
Nunn, J. F. (1969). “Control of breathing”, in Applied Respiratory Physiology with Special Reference to Anaesthesia, ed J. F Nunn (London: Butterworth & Co Publishers Ltd Press), 31.
Ogoh, S., Fisher, J. P., Dawson, E. A., White, M. J., Secher, N. H., and Raven, P. B. (2005). Autonomic nervous system influence on arterial baroreflex control of heart rate during exercise in humans. J. Physiol. 566 (Pt 2), 599–611. doi: 10.1113/jphysiol.2005.084541
Pawelczyk, J. A., Hanel, B., Pawelczyk, R. A., Warberg, J., and Secher, N. H. (1992). Leg vasoconstriction during dynamic exercise with reduced cardiac output. J. Appl. Physiol. 5, 1838–1846.
Pedley, T. J. (1980). The Fluid Mechanics of Large Blood Vessels. Cambridge Monographs on Mechanics and Applied Mathematics. Cambridge; New York, NY; Melbourne: Cambridge University Press.
Potts, J. T., and Mitchell, J. H. (1998). Rapid resetting of carotid baroreceptor reflex by afferent input from skeletal muscle receptors. Am. J. Physiol. Heart Circ. Physiol. 275:H2000–H2008.
Rådegran, G., and Saltin, B. (1998). Muscle blood flow at onset of dynamic exercise in humans. Am. J. Physiol. 1(Pt 2), H314–H322.
Robinson, B. F., Epstein, S. E., Beiser, G. D., and Braunwald, E. (1966). Control of heart rate by the autonomic nervous system. Studies in man on the interrelation between baroreceptor mechanisms and exercise. Circul. Res. 19, 400–411.
Rowell, L. B., and O'Leary, D. S. (1990). Reflex control of the circulation during exercise: chemoreflexes and mechanoreflexes. J. Appl. Physiol. 69, 407–418.
Sagawa, K., Maughan, L., Suga, H., and Sunagawa, K. (1988). “Chamber pressure–volume relation versus muscle tension-length relaxation,” in Cardiac Contraction and the Pressure-Volume Relationship, eds K. Sagawa, L. Maughan, H. Suga, and K. Sunagawa (New York, NY: Oxford University Press), 61–94.
Spencer, J. L., Firouztale, E., and Mellins, R. B. (1979). Computational expressions for blood oxygen and carbon dioxide concentrations. Ann. Biomed. Eng. 7, 59–66.
Sullivan, M. J., Knight, J. D., Higginbotham, M. B., and Cobb, F. R. (1989). Relation between central and peripheral hemodynamics during exercise in patients with chronic heart failure. Circulation 4, 769–781.
Ursino, M. (1998). Interaction between carotid baroregulation and the pulsating heart: a mathematical model. Am. J. Physiol. Heart Circ. Physiol. 275, 1733–1747.
Wang, L., Su, S. W., Chan, G. S., and Celler, B. G. (2007). “A mathematical model of the cardiovascular system under exercise,” in Conference Proceeding of the IEEE Engineering in Medcine and Biology Society: Proceedings of the 29th Annual International Conference of the, IEEE, 2004 (Lyon), 1014–1017.
Wasserman, K., Zhang, Y. Y., Gitt, A., Belardinelli, R., Koike, A., Lubarsky, L., et al. (1997). Lung function and exercise gas exchange in chronic heart failure. Circulation 96, 2221–2227.
Weber, K. T., Kinasewitz, G. T., Janicki, J. S., and Fishman, S. P. (1982). Oxygen utilization and ventilation during exercise in patients with chronic cardiac failure. Circulation 65, 1213–1223.
Keywords: modeling, cardiorespiratory, baroreflex, ventilation, gas exchanges, vasodilation, heart failure
Citation: Fresiello L, Meyns B, Di Molfetta A and Ferrari G (2016) A Model of the Cardiorespiratory Response to Aerobic Exercise in Healthy and Heart Failure Conditions. Front. Physiol. 7:189. doi: 10.3389/fphys.2016.00189
Received: 08 October 2015; Accepted: 10 May 2016;
Published: 08 June 2016.
Edited by:
Robert Hester, University of Mississippi Medical Center, USAReviewed by:
William Andrew Pruett, University of Mississippi Medical Center, USADaniel Goldman, University of Western Ontario, Canada
Copyright © 2016 Fresiello, Meyns, Di Molfetta and Ferrari. This is an open-access article distributed under the terms of the Creative Commons Attribution License (CC BY). The use, distribution or reproduction in other forums is permitted, provided the original author(s) or licensor are credited and that the original publication in this journal is cited, in accordance with accepted academic practice. No use, distribution or reproduction is permitted which does not comply with these terms.
*Correspondence: Libera Fresiello, bGliZXJhLmZyZXNpZWxsb0BnbWFpbC5jb20=
 Libera Fresiello
 Bart Meyns1
 Arianna Di Molfetta
 Gianfranco Ferrari