 Peng Maoxiao1†
 Li Jiale
- 1Key Laboratory of Exploration and Utilization of Aquatic Genetic Resources, College of Fisheries and Life Science, Shanghai Ocean University, Shanghai, China
- 2Co-Innovation Center of Jiangsu Marine Bio-industry Technology, Huaihai Institute of Technology, Lianyungang, China
In order to clarify the possibility of rearing razor clams (Sinonovacula constricta) in inland saline water (ISW) and to facilitate their breeding under these stressful conditions, we performed semi-static acute and chronic toxicity tests to determine the effects of carbonate alkalinity (CA) and pH on the survival and growth rate, and critical metabolic enzyme activity in juvenile of S. constricta (JSC). (1) Acute toxicity test. As the water CA increased from 1.22 to 45.00 mmol L-1, the survival rate decreased significantly, which was exacerbated by the increase in the pH. When the water CA was set at 2.5 mmol L-1, the 48 h lethal concentration 50% (LC50) for JSCs with respect to pH was 9.86. When the water pH was 9.0, 9.5, and 10.0, the 48 h LC50 values for JSCs with respect to CA were 10.38, 8.79, and 3.11 mmol L-1, respectively. (2) Chronic toxicity test. Four experimental groups comprising the control, CAS, pHS, and CA-pHS were designated according to the target ISW data. After 3 months of stress, the JSC survival rate in each group exceeded 85%, but survival was significantly lower in the CA-pHS group than the control group (p < 0.05) in the first month. For the JSCs in various groups, the shell length growth rate (SGR) and weight gain (WG) rate were significantly lower in the CA-pHS group than the other groups (p < 0.05 for SGR; p < 0.001 for WG) in the first month. However, the difference in the growth rate among groups decreased in the next 2 months. For the JSCs in the CA-pHS group, the oxygen consumption, ammonia-N excretion, Na+/K+-ATPase, aspartate aminotransferase, and superoxide dismutase levels were significantly higher than those in the other groups during the first month, but there were no significant differences between the groups subsequently. The acetylcholinesterase and lysozyme levels did not differ significantly among groups during stress for 3 months. The integrated biomarker response index showed that stressors comprising high pH and CA could be tolerated well by JSCs over long periods of stress. These results indicate that water CA and pH together affect the survival, growth, and physiological activity of JSCs. S. constricta is suitable for culture in ISW.
Introduction
Throughout the world, saline-alkali soils provide low yields (Qadir et al., 2001; Wang et al., 2011). The development and utilization of saline-alkali soil and water resources is a focus of a research. In the 1920s, the former Soviet Union began breeding experiments with fish, shrimp, and shellfish in inland saline water (ISW), but with very little success (Yao et al., 2010). In Israel, inland saline aquaculture, known as “desert aquaculture” began operating commercially in the late 1980s and it is characterized by the raising of finfish in brackish geothermal water from deep aquifers discovered in the 1940s (Allan et al., 2009). In Pakistan and Iran, marine fish and freshwater fish have been considered suitable for cultivation in brackish water, showing a high degree of adaptability to changing water environments (Salati et al., 2014; Rahim et al., 2017; Malik et al., 2018). In New Zealand, marine fish (Fielder et al., 2001; Doupé et al., 2005; Ingram et al., 2015) and crustaceans (Prangnell and Fotedar, 2005; Tantulo and Fotedar, 2006) have been farmed in ISW after selecting the appropriate water quality or improving the water quality (regulate the main ionic components of ISW). This method is also used in Australia (Doroudi et al., 2006) and the United States (Boyd et al., 2007). ISW aquaculture is now practiced worldwide, where it was inspired by the success of Litopenaeus vannamei aquaculture in Thailand using a brine solution (Roy et al., 2010), which expanded worldwide subsequently, including in Brazil, China, Ecuador, Mexico, Thailand, the United States, and Vietnam (Dinh, 2015). However, the cultivation of shellfish in ISW has been only reported sporadically, such as with Mytilus edulis (Dinh and Fotedar, 2016), Haliotis laevigata (Doupé et al., 2003), Trochus niloticus (Lee, 1997), Crassostrea gigas, and Saccostrea glomerata (Ingram et al., 2015).
In China, the saline-alkali land areas comprise 9970 hm2 with 3067 hm2 of inland saline-alkali waters (He et al., 2010), which are characterized by high carbonate alkalinity (CA) and pH, imbalanced ions, and water with a complex chemical composition (Wang et al., 1997; Shentu et al., 2000). Some saline-alkali waters have been used for culture and aquaculture, but most of them have been in a barren state for a long time (Lv et al., 2012). Freshwater fish (Zhang et al., 1999) and seawater shrimp (Fang et al., 1995; Hu et al., 2000; Liu et al., 2008) are cultured the most widely in China’s ISW fisheries. Few studies have investigated the breeding of shellfish in Chinese ISWs, where only one study determined the toxic effects of several saline-alkali factors on Cyclina sinensis (Lin et al., 2012). Utilizing ISW as a water resource for aquaculture in China will help to improve the agricultural ecological environment, adjust the agricultural economic structure, and increase the outputs of farmers.
Sinonovacula constricta (Chinese razor clam) is the fourth most important commercial marine bivalve species and it is widely distributed in the intertidal zones and estuarine areas of the western Pacific Ocean (Xie et al., 2015). S. constricta can adapt to a wide range of temperature and salinity conditions (Lin and Wu, 1984), and it is characterized by a short production cycle, low production costs, and high production efficiency (Wu and Xv, 2000; Niu et al., 2007). Aquaculture research into S. constricta has focused on growth (Niu et al., 2015), development (Niu et al., 2016), and disease control (Feng et al., 2012; Peng et al., 2016). Several studies have focused on water quality factors such as salinity (Lin and Wu, 1990), metal ions (Wu et al., 2003), inorganic pollutants (Chen et al., 1984), organic pollutants (Jiang et al., 2015), and pH (He et al., 2017), whereas none have considered the effects of CA and pH on the survival and growth of S. constricta. In addition, shellfish can fix calcium carbonate and dietary algae in the water to achieve an ecological balance in aquaculture (Shumway et al., 2003; Tolley et al., 2004; Dumbauld et al., 2009; Guo et al., 2017). Therefore, in this study, we investigated the effects of CA and pH (high CO32-, HCO3-, and OH-) on the survival, growth, and physiological characteristics of juvenile S. constricta (JSC), and aims to confirm whether S. constricta is suitable for use as a breeding species in the inland saline-alkali waters of China.
Materials and Methods
Animals were handled according to the guidelines for the care and use of animals for scientific purposes set by the Institutional Animal Care and Use Committee of Shanghai Ocean University, Shanghai, China. The test animals were non-endangered animals and were artificially propagated larvae.
Healthy JSCs were obtained from Donghang Farm, Sanmen City, Zhejiang Province, China. In the experiments, 100 JSCs were randomly selected to measure their weight and length. The average body weight and average shell length of the JSCs were 0.0164 ± 0.0027 g and 0.6184 ± 0.069 cm, respectively. Freshwater mixed with artificial sea salts (Red Sea, Red Sea Fish Pharm Ltd., Israel) was used to prepare different salt concentrations in artificial seawater (ASW) for the experiments. In this study, setting the salinity in 6 ppt. It is based on the meteorological and ISW water quality data in the Jingtai region of Gansu Province, northwestern China, which the salinity of most carbonate water is around 6 ppt (Dou, 2006; Lai et al., 2007; Wang and Shi, 2010; Yao et al., 2010). The water temperature detected in the experiments was 20–22°C. In our experiments, in each group of tests, the CA in the water was adjusted using Na2CO3 and NaHCO3, and the pH was adjusted with 0.1 mol L-1 HCl and 0.1 mol L-1 NaOH. The CA was detected by acid-base titration with phenolphthalein and methyl orange-aniline blue as indicators (Xiao, 2004). Three separate sets of experiments were performed for every group.
Acute Toxicity Test
Test Methods
During the test period, the pH and CA values of the test water varied due to the CO2 in the air and the physiological activities of the JSCs. Therefore, the values were stabilized by changing 100% of the water each day. Petri dishes (9 cm in diameter) and 80 mL of the test water were used for each group, where 6 ppt ASW was set as the control group (Lai et al., 2007; Yao et al., 2010). The JSC survival rate (SR) after 48 h was the test result.
JSCs With Different pH Values Under the Same CA
The normal seawater CA ranges between 2 and 3 mmol L-1, so CA was set at 2.5 mmol L-1 (measured as 3.74 ± 0.12 mmol L-1) in this test. The pH groups were set at 7.5, 8.0, 8.5, 9.0, 9.5, 10.0, and 10.5. The control group was set at 6 ppt ASW, without additional adjusting CA, and the pH was 8.20. Three separate groups (each containing 30 JSCs) were tested at each pH groups.
JSC With Different CA Values at the Same pH
The pH of natural carbonate alkaline water is generally high (Shi, 2009), so in this test, we set the pH at 9.0, 9.5, and 10.0. In preliminary experiments, lower survival occurred at pH 9.0 and CA 20 mm L-1, so the design of each group of experiments is shown in Table 1. Three separate sets of groups (each containing 30 JSCs) were tested.
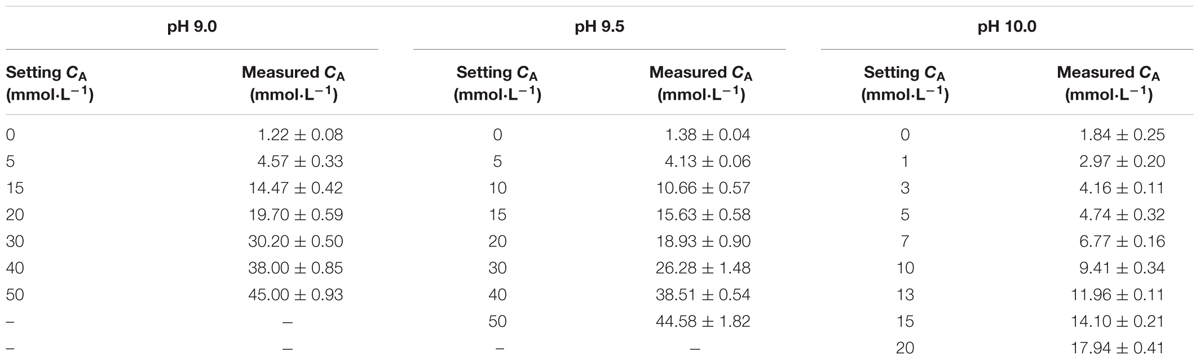
TABLE 1. Designed and actual carbonate alkalinity (CA) levels with different pH values.
Long-Term Toxicity Test
Beach mud was used in the long-term toxicity test. The beach mud was collected from East China Sea, Lingang new city, Shanghai city, China. The collected mud was treated for use in the test, as follows. First, a 2.00-mm grade sieve was used to remove impurities from the mud. Second, the mud was resuspended three times in fresh water (mud:fresh water = 10:40 L); Finally, the mud was dried at 80°C and then dissolved in the test water. After preliminary acclimation for 10 days in ASW (10 ppt), 1200 JSCs were selected randomly and transferred into a tank (40 cm × 40 cm × 65 cm). Each tank contained 10.4 L of test mud, 12 L of test water, and 100 JSCs. Four groups were designed to test the control, pH stress (pHS), CA stress (CAS), and pH plus CA stress (CA-pHS) conditions. In each group, the JSCs were acclimated gradually over 8 days (Table 2). The final stress conditions comprised: control (6 ppt salinity, 1.22 ± 0.08 mmol L-1 CA, 8.23 ± 0.04 pH), pHS (6 ppt salinity, 1.21 ± 0.18 mmol L-1 CA, 10.00 ± 0.03 pH), CAS (6 ppt salinity, 8.34 ± 0.36 mmol L-1 CA, 8.29 ± 0.07 pH), and CA-pHS (6 ppt salinity, 4.98 ± 0.28 mmol L-1 CA, 9.20 ± 0.02 pH). During the test period, 100% of the water was changed each day to avoid CO2 in the air affecting the pH value and CA. The JSCs were fed once each day (16:00) with Chaetoceros calcitrans, where each tank containing 12 L of test water had a concentration of 200–240 C. calcitrans cells μL-1 (Zhu et al., 2010). Before feeding, the C. calcitrans culture solution was subjected to centrifugation (1000 g min-1 for 10 min) and resuspended twice in the test water. Throughout the stress test period of 100 days, each group of JSCs was analyzed to determine the per month survival rate (PMSR), weight gain (WG) rate, shell length growth rate (SGR), oxygen consumption rate, ammonia excretory rate, and enzyme activity on four occasions (days 8, 39, 69, and 100).
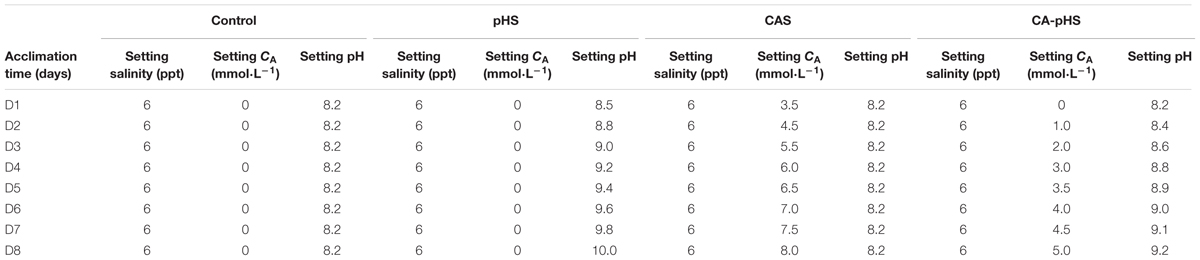
TABLE 2. Design of the gradual acclimation program for the long-term toxicity test.
Analytical Methods
SR, PMSR, WG, SGR, and Lethal Concentration 50% (LC50)
PMSR, WG, and SGR were calculated as follows:
where Ne is the number of JSCs that survived in the end of 48 h acute toxicity test, Ns is the number of JSCs that survived in the start of 48 h acute toxicity test, Nn is the number of JSCs that survived in the n-th month, N(n-1) is the number of JSCs that survived in the (n-1)-th month, Wn and W(n-1) are the average wet body weights of the JSCs in the n-th month and the (n-1)-th month, respectively, Ln and L(n-1) are the average lengths of the JSCs in the n-th month and the (n-1)-th month, and T is the duration of the experiment (months).
The value of LC50 for a substance is the dose required to kill half the members of a tested population after a specified test duration. LC50 was calculated by the linear interpolation method for acute toxicity testing (Stephan, 1977; Yao et al., 2010).
Oxygen Consumption Rate and Ammonia Excretory Rate
The oxygen consumption rate and ammonia excretory rate (Fan et al., 2002) were measured for the JSCs in a sealed conical flask. A dissolved oxygen analyzer (WTW Multi 3420 Set G, Xylem Inc., Germany) was used to determine the dissolved oxygen in the test water. Twenty JSCs in each group were randomly selected to determine the oxygen consumption rate and ammonia excretory rate, which were calculated as follows:
Oxygen consumption rate
Ammonia excretory rate
where A1 and A0 are the final and initial dissolved oxygen concentrations in the test water, respectively, V is the volume of test water, W is the average wet body weight of the JSCs, T is the duration of the test, and E the ammonia nitrogen content of the test water (mg). For better labeling of results, the unit is converted to (μg g-1 h-1) in the figure after calculation.
Enzyme activities
The shells were removed from the JSCs and they were homogenized, before placing in an ice bath to measure the activities of enzymes comprising Na+/K+-ATPase (NKA), acetylcholinesterase (AChE), aspartate aminotransferase (AST), superoxide dismutase (SOD), and lysozyme (LZM). The homogenized tissue samples were diluted with normal saline at a ratio of 1:9 for the tissue weight (g) relative to normal saline (mL). The total protein contents of the tissue samples were determined using a Coomassie Brilliant Blue Total Protein Assay kit (Nanjing Jiancheng Bioengineering Institute, China) based on a previously reported assay (Sedmak and Grossberg, 1977).
The NKA, AChE, AST, SOD, and LZM activities were determined using an Ultra Trace Na+/K+-ATPase Assay kit, Acetylcholine Assay kit, Aspartate Amino transferase Assay kit, Superoxide Dismutase Assay kit, and Lysozyme Assay kit (Nanjing Jiancheng Bioengineering Institute, China), respectively, according to the manufacturers’ instructions. In the NKA assay, the enzyme activity unit (U) was expressed as μmol Pi mg prot-1 h-1. In the AChE assay the enzyme activity unit (U) was expressed on the basis of each mg of tissue protein incubated at 37°C for 6 min, with the hydrolysis reaction system 1 μmol matrix as a viable unit. In the AST assay, the enzyme activity unit (U) is expressed as μmol mg prot-1 min-1. In the SOD assay the enzyme activity unit (U) was expressed as the amount of enzyme corresponding to a 50% SOD inhibition rate in the reaction system.
Integrated Biomarker Response (IBR) Index Calculation
The activities of five enzymes (NKA, AChE, AST, SOD, and LZM) were used to calculate the IBR index, and the IBR data were expressed as a star plot area. For each month of a given test, the data processing method was as follows. For each marker, the result of the assay in each test group was calculated (xii) to determine the total group average ( ) and total group standard deviation (s). Next, the value of xi for each group was normalized as follows: xi′ = (xi -)/s, where, xi′ are normalized data for xi. If the activity of a marker is activated by stress, let Z = xi′; otherwise, let Z = -xi′. Then, let |xmin| = the absolute value of the minimum of the marker homogeneity data in all groups. The score for each biomarker in each group was determined as: Bi = Z+|xmin|. The star plot figure was prepared where the Bi value for each marker in a group was the length of the radiation. The IBR values for each group were obtained by calculating the area of the star plot (the sum of the areas Ai that the triangles surrounded due to the radiation of adjacent biomarkers in the figure):
Where K is the number of biomarkers used in the experiment.
Statistical Analysis
Statistical analyses were performed using SPSS 19.0 statistical software. All data were subjected to Tukey’s test of one-way ANOVA which determines significant differences among treatments. Figures were plotted using Sigmaplot 12.3.
Results
Acute Toxicity Test
Acute Toxicity Test With Different pH Values
After the stress test for 48 h (Figure 1A), the SRs of the JSCs at pH values ranging from 7.5 to 9.0 were nearly 100% at 2.5 mmol L-1 CA, and there were no significant differences compared with the control group. The SRs of the JSCs at pH 9.5 were higher than 90%, but they decreased greatly at pH 9.5–10.0. All of the JSCs died within 24 h when the pH reached 10.5. The 48 h LC50 for this test was pH 9.86 (Table 3).
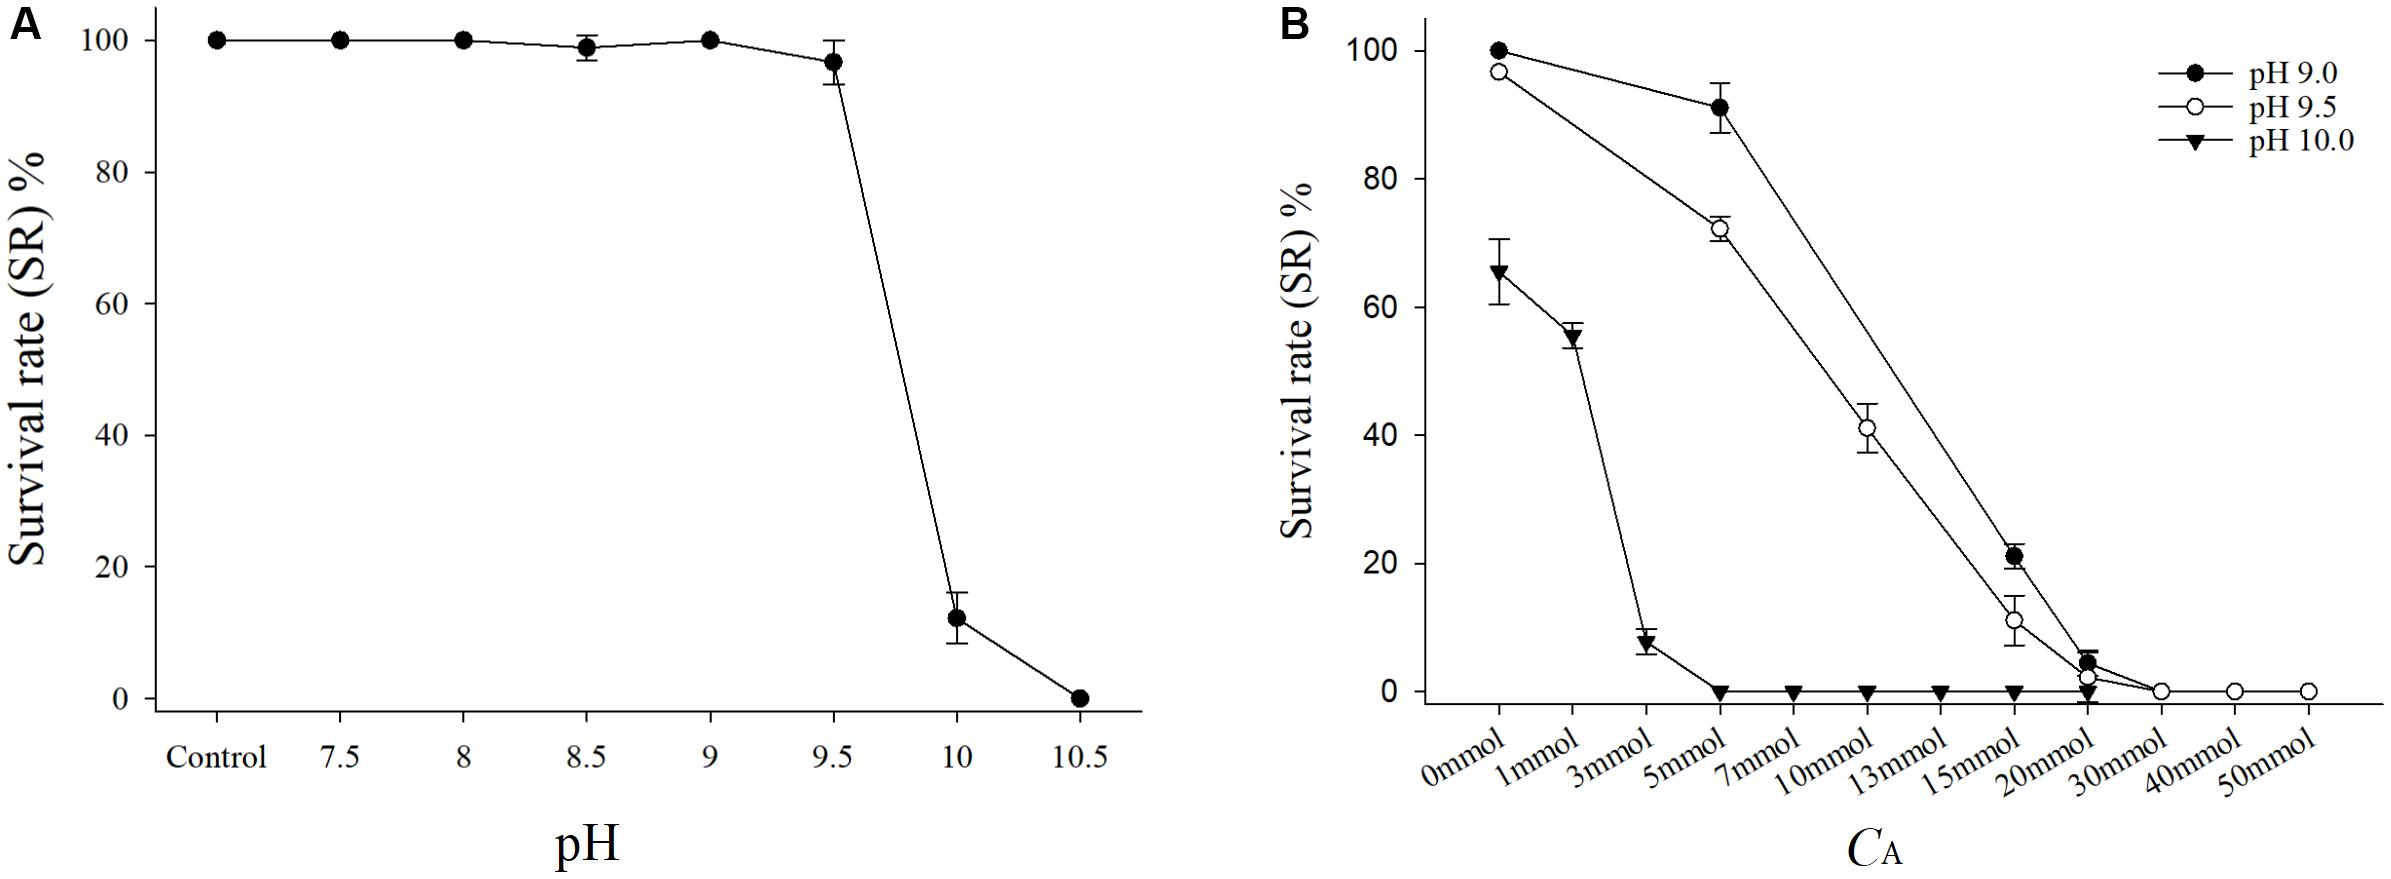
FIGURE 1. (A) Survival rate of juvenile of Sinonovacula constricta (JSCs) with different pH values under the same CA in the acute toxicity test. Bars represent the mean ± SE (n = 3). The control group was normal artificial seawater (ASW) with no adjustments to the pH and CA. (B) Survival rates of JSCs with different CA levels under the same pH in the acute toxicity test. Bars represent the mean ± SE (n = 3).
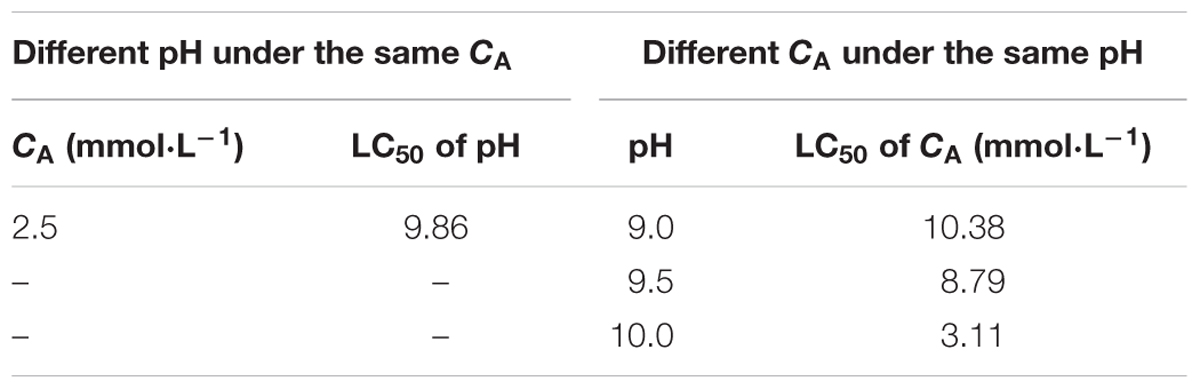
TABLE 3. The 48 h LC50 results for Juvenile of Sinonovacula constricta (JSCs) in the acute toxicity test.
Acute Toxicity Test of JSCs With Different CA Values at the Same pH
Under the same CA conditions, after the stress test for 48 h (Figure 1B), the SRs of the JSC decreased in the groups as the pH increased. In addition, the SRs of the JSCs decreased in the groups as the CA increased under the same pH conditions. In the groups with pH 9.0 and 9.5, the SRs of the JSCs were 0% when CA exceeded the set value of 20 mmol L-1. Moreover, the SR of JSCs was 0% when the pH was 10.0 and CA exceeded the set value of 3 mmol L-1. The 48 h LC50 values with pH 9.0, pH 9.5, and pH 10.0 were 10.38, 8.79, and 3.11 mmol L-1, respectively (Table 3).
Long-Term Toxicity Test
Long-Term Toxicity Test Based on the PMSR of JSCs
During the 100-day long-term stress test, the surviving numbers of JSCs were counted every month (Table 4). The ultimate absolute average survival rates for JSCs after 100 days in each group were 96.67, 89.67, 98.00, and 92.33% for the control, CA-pHS, CAS, and pHS groups, respectively. Survival rate was significantly lower in the CA-pHS group than the control group (p < 0.05), but the survival rates in the other two groups did not differ significantly compared with the control group. According to the PMSR data for each month (Figure 2), the PMSR in the first month differed among groups. The PMSR in the CA-pHS group was significantly lower than that in the control group (p < 0.05). The PMSRs in the other two groups did not differ significantly compared with that in the control group. Four test groups maintained high PMSRs from the second month onwards and there were no significant differences between them.
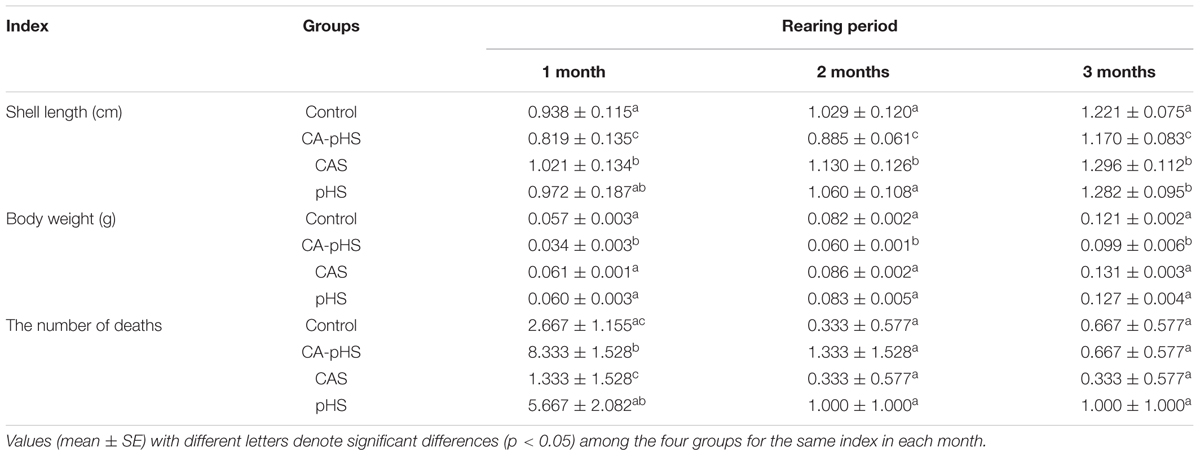
TABLE 4. Growth and death of JSCs in different treatment groups in the long-term toxicity test.
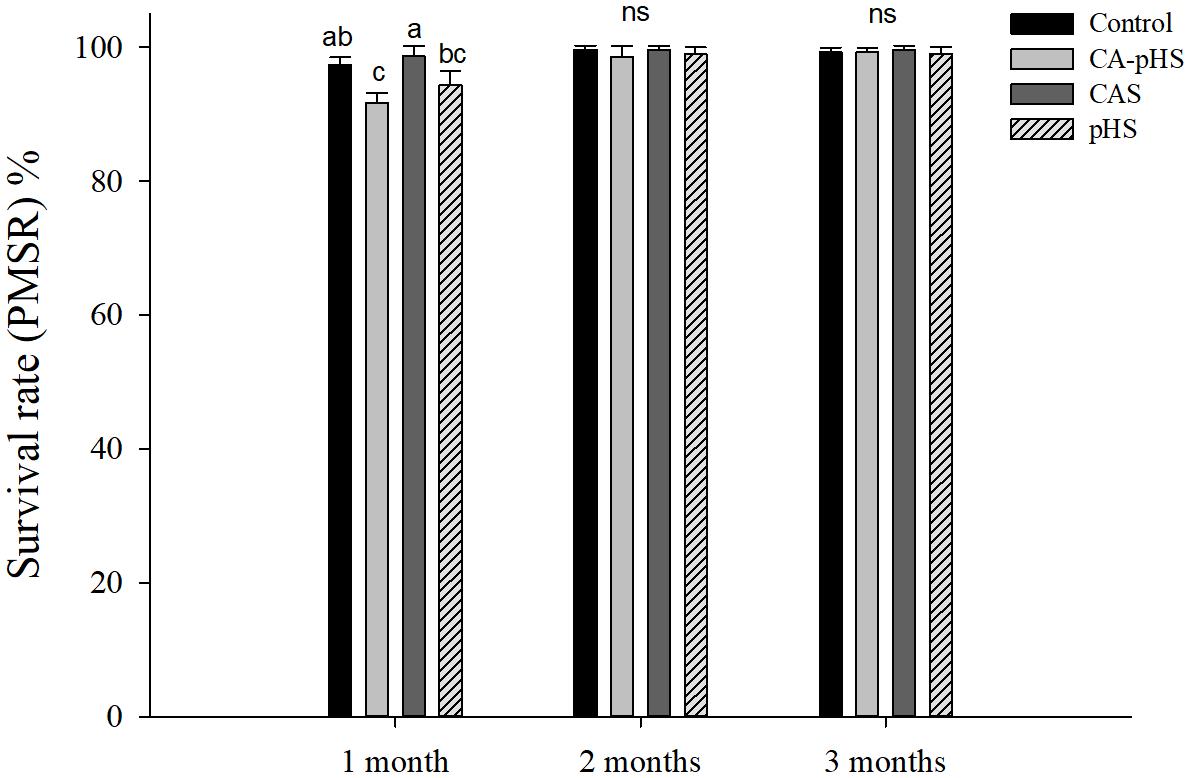
FIGURE 2. Juvenile of S. constricta per month survival rate in the long-term toxicity test. Bars (mean ± SE, n = 3) with different letters indicate significant differences (p < 0.05) among the four groups in each month. The letters “ns” indicate insignificant difference among the four groups in each month.
Long-Term Toxicity Test Based on JSC Growth
Table 4 shows the direct measurements of the body weight and shell length each month. In the long term, the growth rate was calculated based on the increase in the body weight and shell length by JSCs each month. The body weight and shell length in the CA-pHS group were significantly lower than the control group after 100 days stress rearing. The shell length was significantly higher in the CAS group than the control group. Details of the growth rates are shown in Figures 3, 4 as %day-1 for SGR and WG. Figure 3 shows that the SGR in the pHS group did not differ significantly from that in the control group after 3 months, but it was higher than that in the control group during the first month and the third month. The SGR was significantly higher in the CAS group than the control group during the first month, but it did not differ significantly from that in the control group during the second month and the third month. The SGR was significantly lower in the CA-pHS group than the control group during the first month, but it was significantly higher than that in the control group during the third month. Figure 4 shows that the WG was significantly slower in the CA-pHS group than the control group during the first month, but they did not differ significantly during the second and third months. The WG in the control group did not differ significantly from those in the CAS and pHS groups during all months.
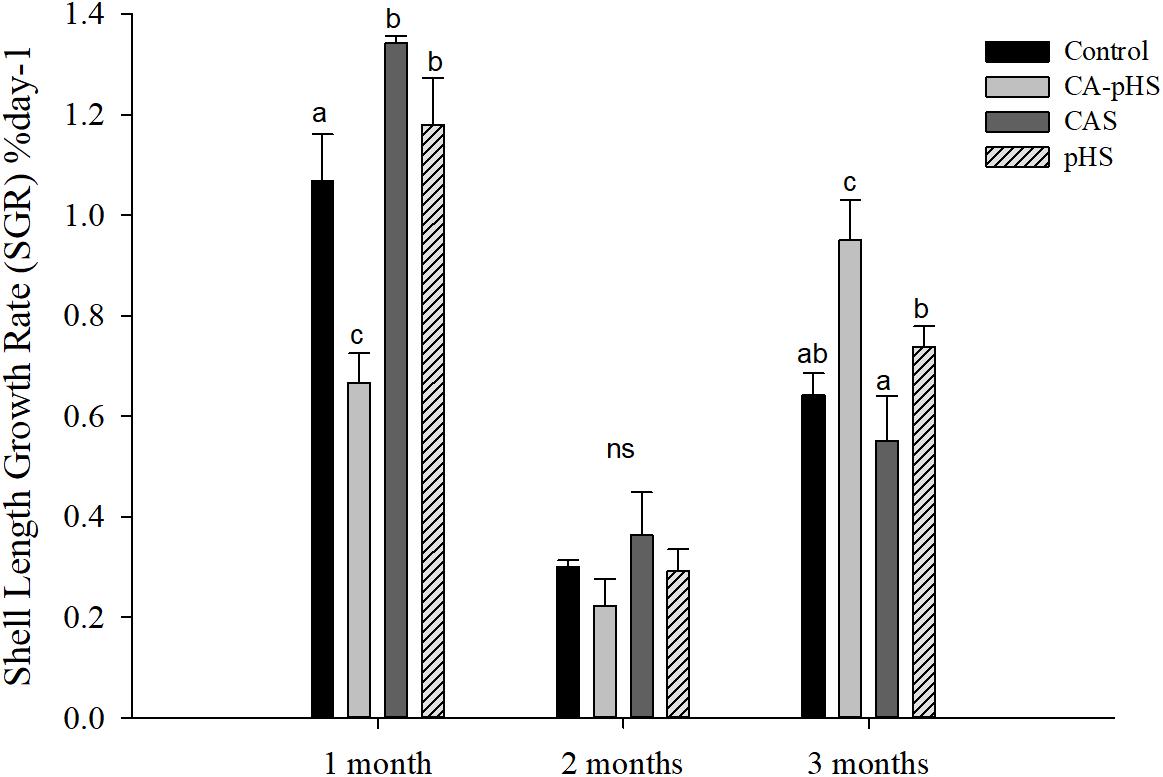
FIGURE 3. Juvenile of S. constricta shell length growth rate (SGR) in the long-term toxicity test. Bars (mean ± SE, n = 3) with different letters denote significant differences (p < 0.05) among the four groups in each month. The letters “ns” indicate insignificant difference among the four groups in each month.
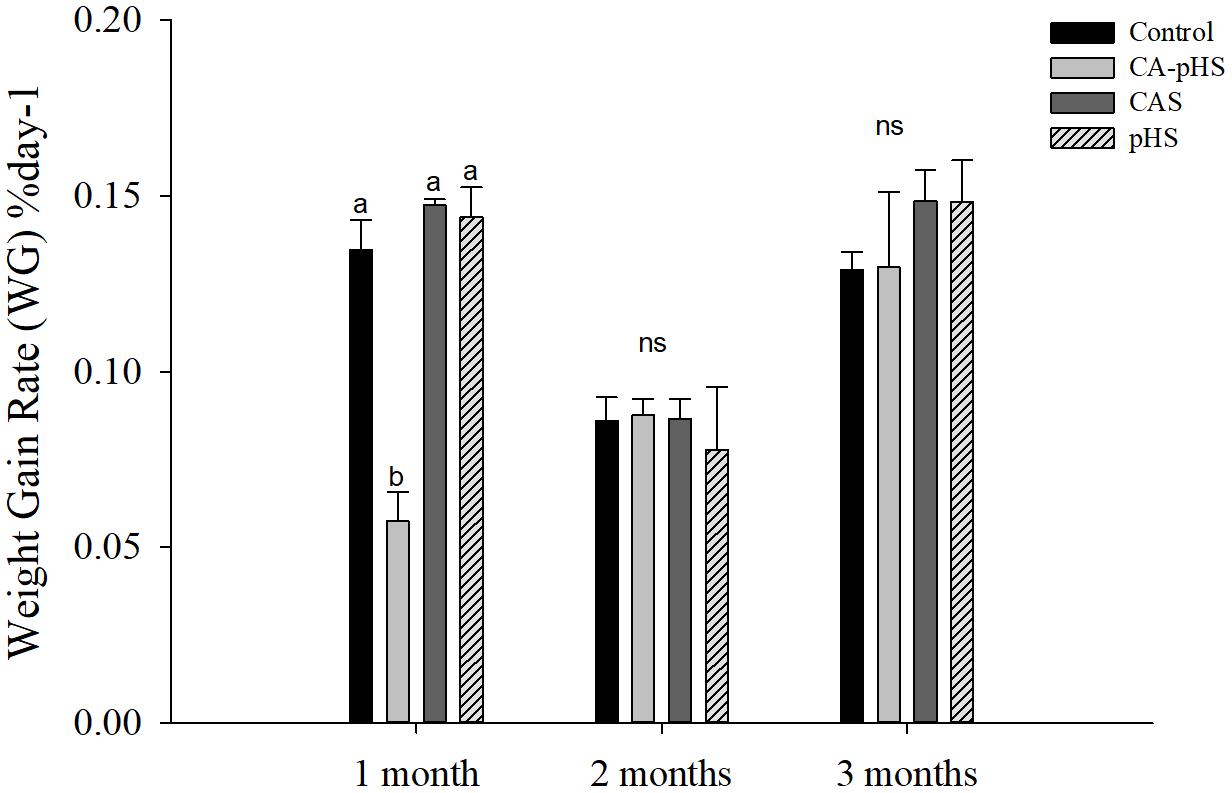
FIGURE 4. juvenile of S. constricta body weight gain rate in the long-term toxicity test. Bars (mean ± SE, n = 3) with different letters denote significant differences (p < 0.05) among the four groups in each month. The letters “ns” indicate insignificant difference among the four groups in each month.
Long-Term Toxicity Tests Based on Oxygen Consumption and Ammonia Excretory Rate
Figure 5 shows that there were no significant differences in the oxygen consumption rate among the groups, except for the CA-pHS group in the first month when it was significantly higher than that in the control group. The oxygen consumption rate was higher in the CA-pHS group than that in the control group during the second and third months but the difference was not significant. In Figure 6, the results are similar to those in Figure 5, except that the ammonia excretory rate in the CAS group during the first month was significantly lower than that in the pHS group and the CA-pHS group. The oxygen consumption rate (Figure 5) and ammonia excretory rate (Figure 6) decreased with time in the CA-pHS group.
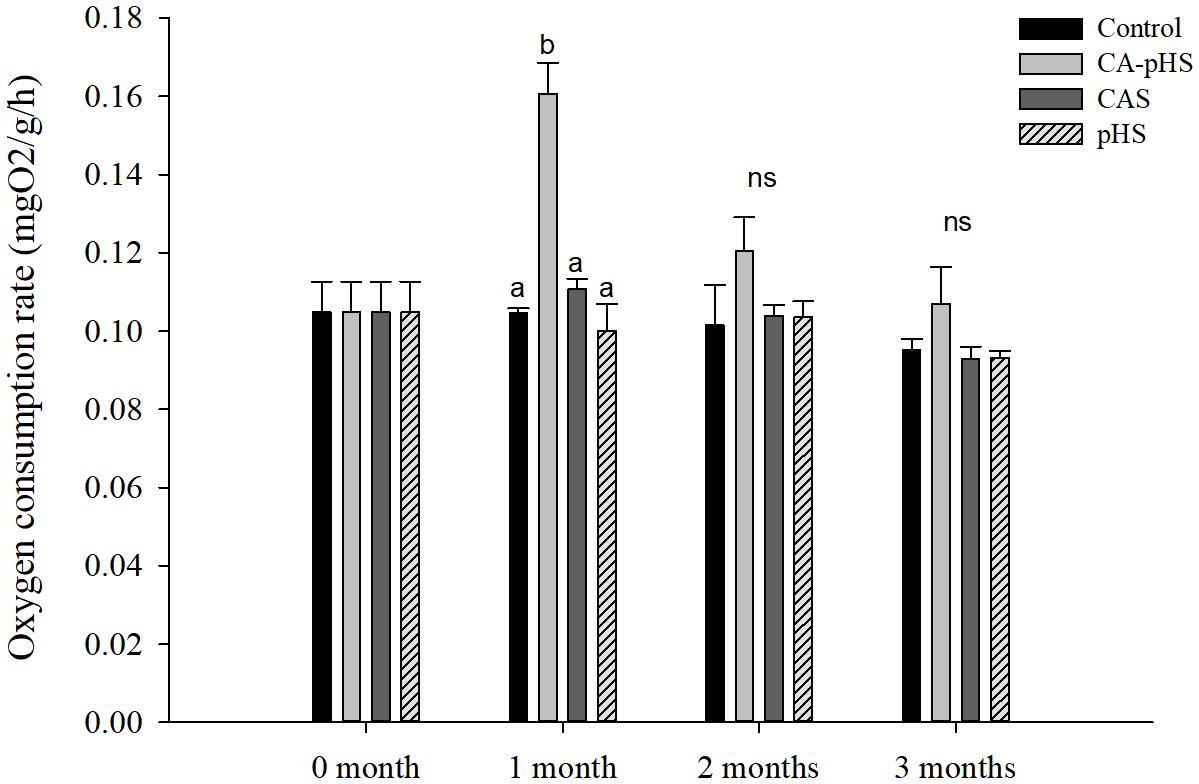
FIGURE 5. juvenile of S. constricta oxygen consumption rate in the long-term toxicity test. Bars (mean ± SE, n = 3) with different letters denote significant differences (p < 0.05) among the four groups in each month. The letters “ns” indicate insignificant difference among the four groups in each month.
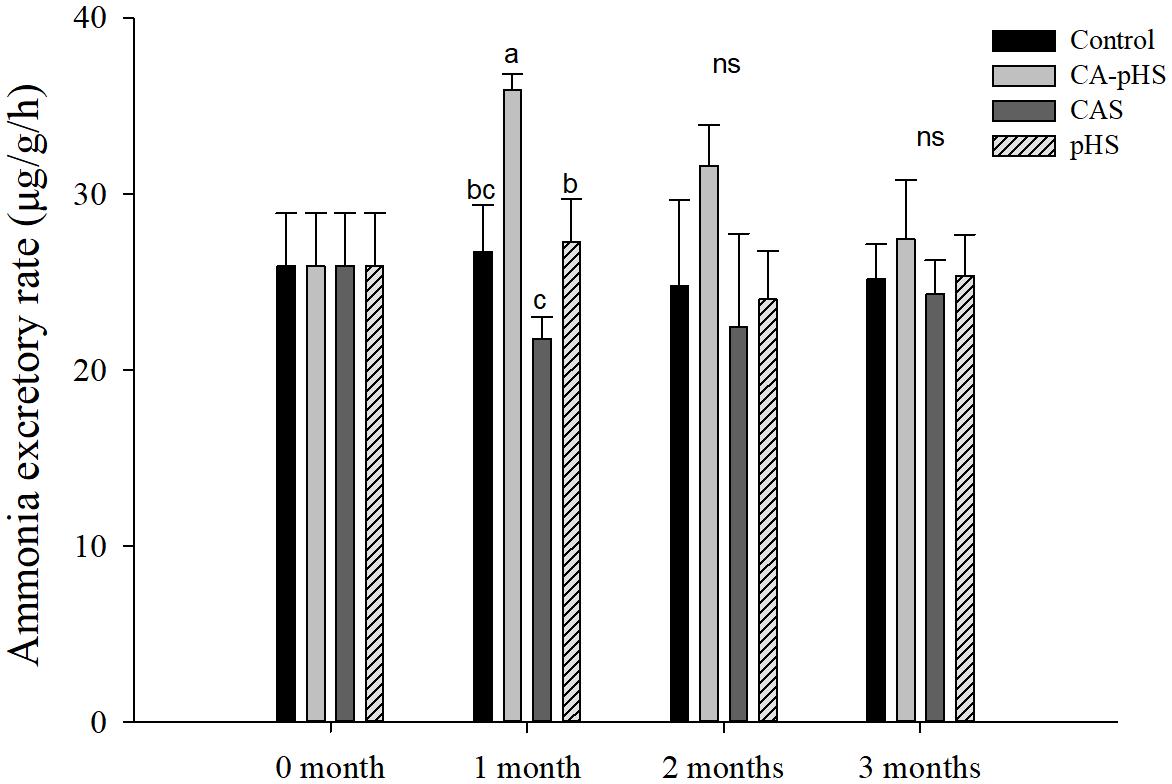
FIGURE 6. Juvenile of S. constricta ammonia excretory rate in the long-term toxicity test. Bars (mean ± SE, n = 3) with different letters denote significant differences (p < 0.05) among the four groups in each month. The letters “ns” indicate insignificant difference among the four groups in each month.
Long-Term Toxicity Test Based on Enzyme Activities
Figure 7 shows that the NKA activity in the first month differed significantly among the groups. Compared with the control group, the NKA activity was significantly higher in the CA-pHS group, but significantly lower in the CAS and pHS groups. The NKA activity decreased with time in the CA-pHS group, but it did not differ significantly compared with the control group in the third month. The NKA activity was still significantly lower in the CAS group compared with the control group in the second and third month, and it tended to decline with time. In the second and third month, there was no significant difference in the NKA activity between the pHS group and the control group.
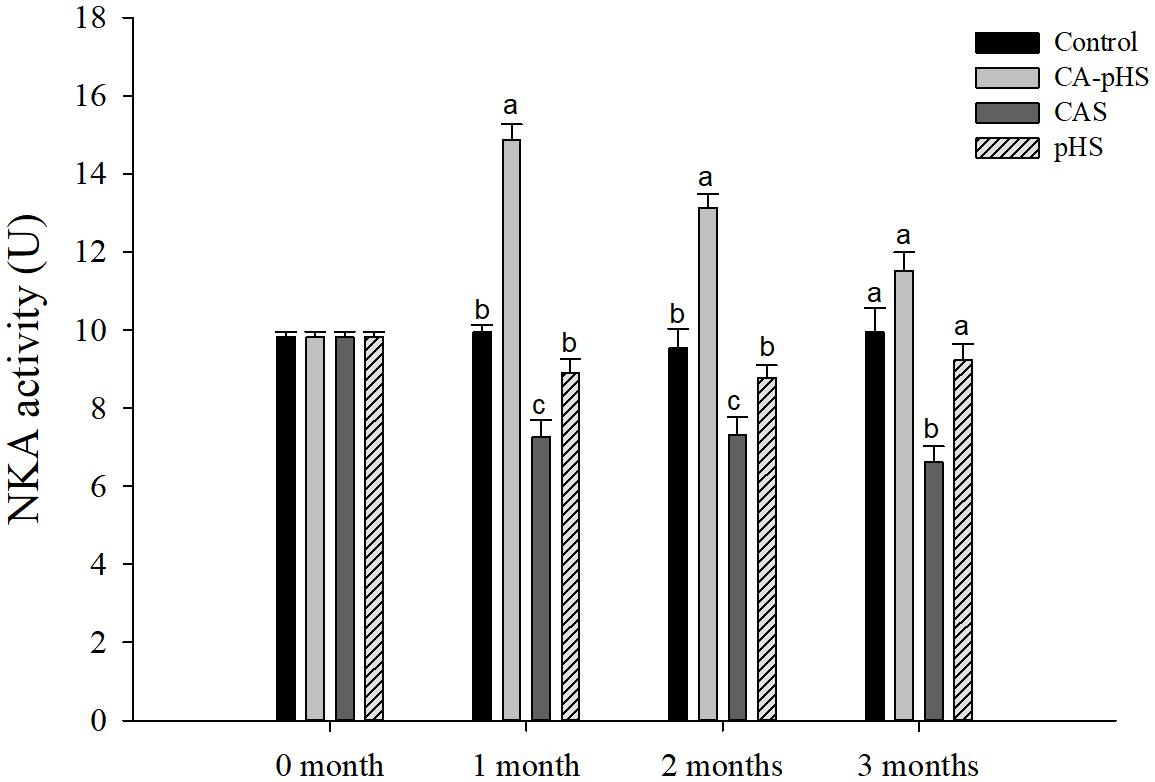
FIGURE 7. Juvenile of S. constricta Na+/K+-ATPase (NKA) activity levels in the long-term toxicity test. Bars (mean ± SE, n = 3) with different letters denote significant differences (p < 0.05) among the four groups in each month. The letters “ns” indicate insignificant difference among the four groups in each month.
Figures 8, 9 shows that there were no significant differences in the AChE activitiy and LZM activity among groups in each month.

FIGURE 8. Juvenile of S. constricta acetylcholinesterase (AChE) activity levels in the long-term toxicity test. Bars (mean ± SE, n = 3) with different letters denote significant differences (p < 0.05) among the four groups in each month. The letters “ns” indicate insignificant difference among the four groups in each month.
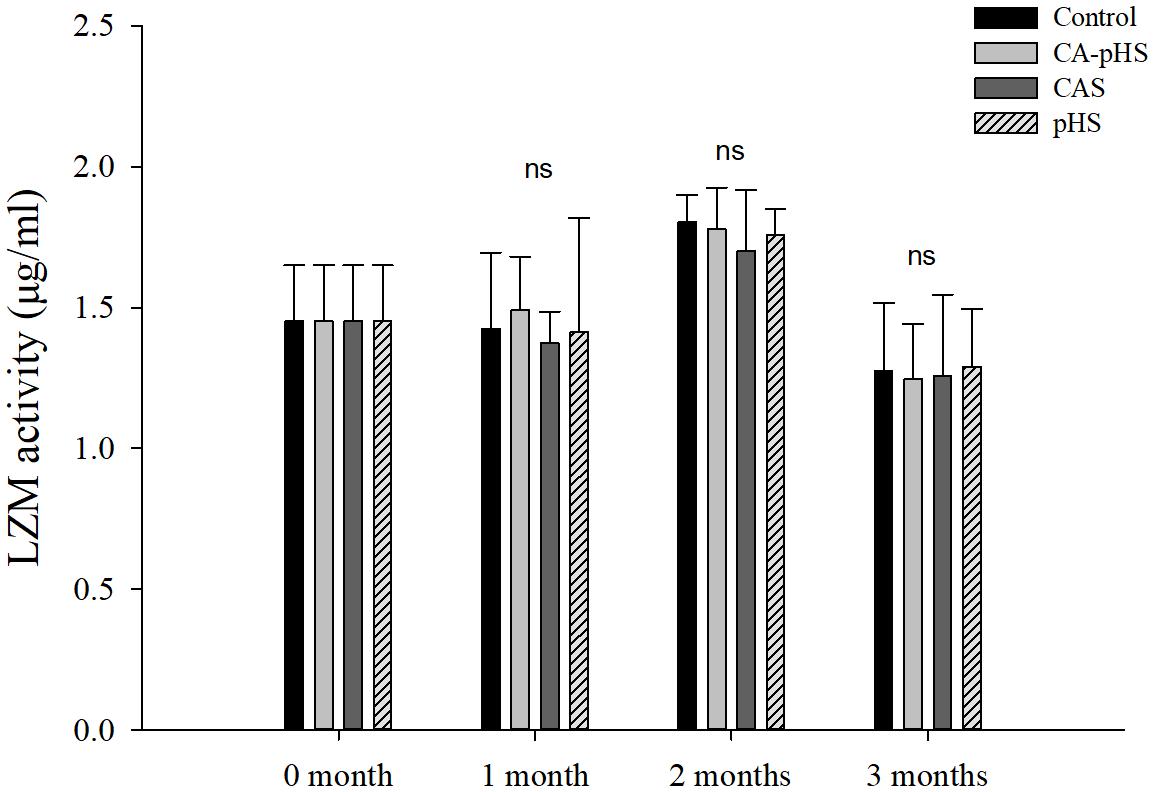
FIGURE 9. Juvenile of S. constricta lysozyme (LZM) activity levels in the long-term toxicity test. Bars (mean ± SE, n = 3) with different letters denote significant differences (p < 0.05) among the four groups in each month. The letters “ns” indicate insignificant difference among the four groups in each month.
Figure 10 shows that the AST activity was significantly higher in the CA-pHS group than the control group in each month. The AST activity in the CA-pHS group tended to decline with time, and there was no significant difference between the AST activity in the CA-pHS group and the pHS group during the third month.
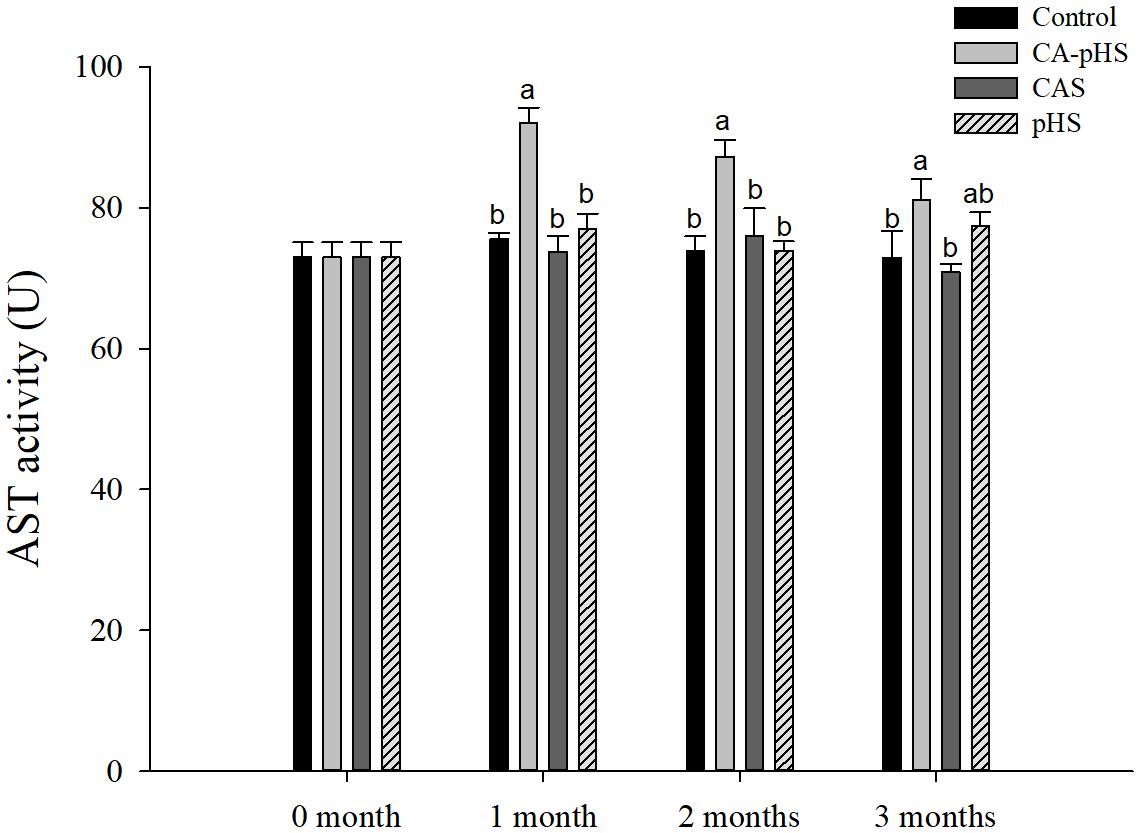
FIGURE 10. Juvenile of S. constricta aspartate aminotransferase (AST) activity levels in the long-term toxicity test. Bars (mean ± SE, n = 3) with different letters denote significant differences (p < 0.05) among the four groups in each month. The letters “ns” indicate insignificant difference among the four groups in each month.
Figure 11 shows that the SOD activity in the CA-pHS group differed significantly compared with that in the control group during the first month, but there were no significant differences among the other groups.
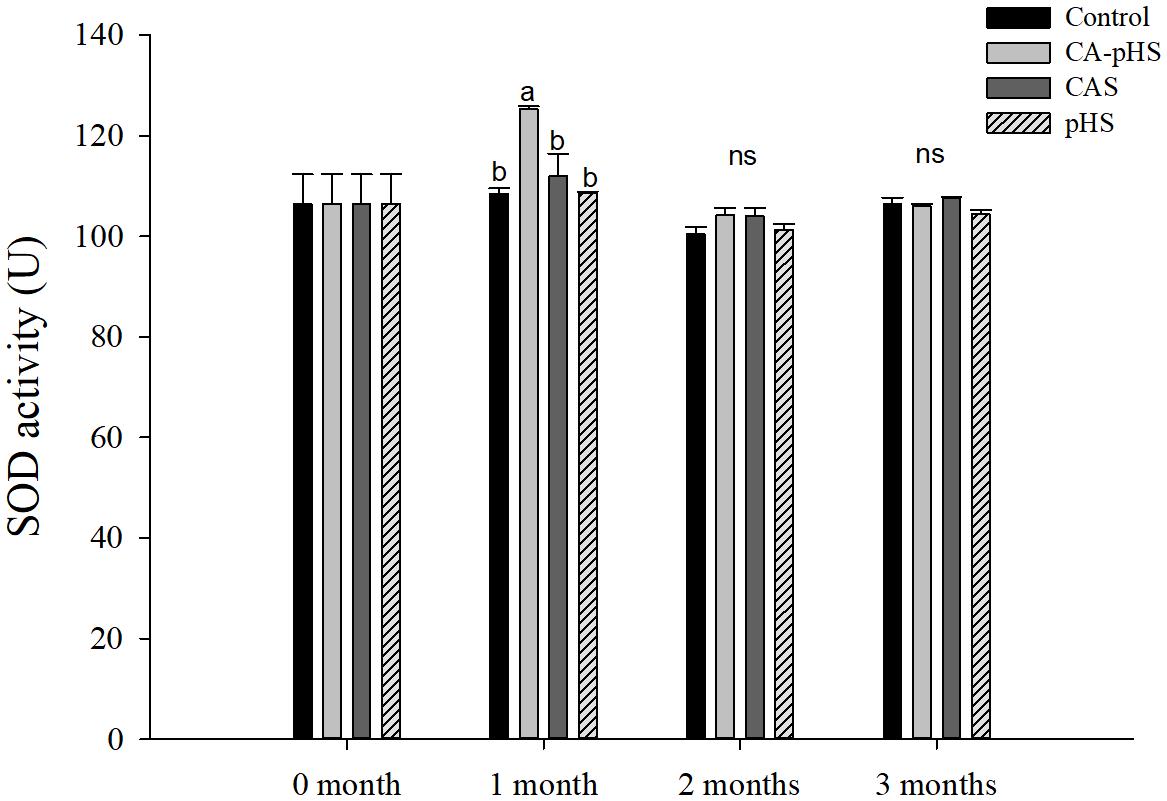
FIGURE 11. Juvenile of S. constricta superoxide dismutase (SOD) activity levels in the long-term toxicity test. Bars (mean ± SE, n = 3) with different letters denote significant differences (p < 0.05) among the four groups in each month. The letters “ns” indicate insignificant difference among the four groups in each month.
Long-Term Toxicity Test Based on the IBR Index
The IBR indices were calculated using the data sets obtained after 1, 2, and 3 months (Figure 12). The IBR value was much higher in the CA-pHS group than the other groups during the first month, and the IBR values in the four groups could be ranked as: CA-pHS > CAS > pHS > control. The IBR values were similar in the CA-pHS and the CAS groups during the second month, and similar in the pHS and control groups, where the IBR values for the four groups could be ranked as: CA-pHS > CAS > pHS ≈ control. In the third month, the IBR value was larger for the CAS group than the other groups, and the IBR values for the four groups could be ranked as: CAS > CA-pHS > pHS > control. The IBR value in the CA-pHS group exhibited a decreasing trend from the first month to the second month relative to the IBR value for the control group. The IBR values obtained for the CA-pHS group in the second month and third month varied little compared to those in the control group. The IBR values in the pHS group and CAS group were higher than those in control group at all times, except the IBR value for the pHS group during the second month was similar to that for the control group. The peak IBR value occurred in the first month in the CA-pHS group.
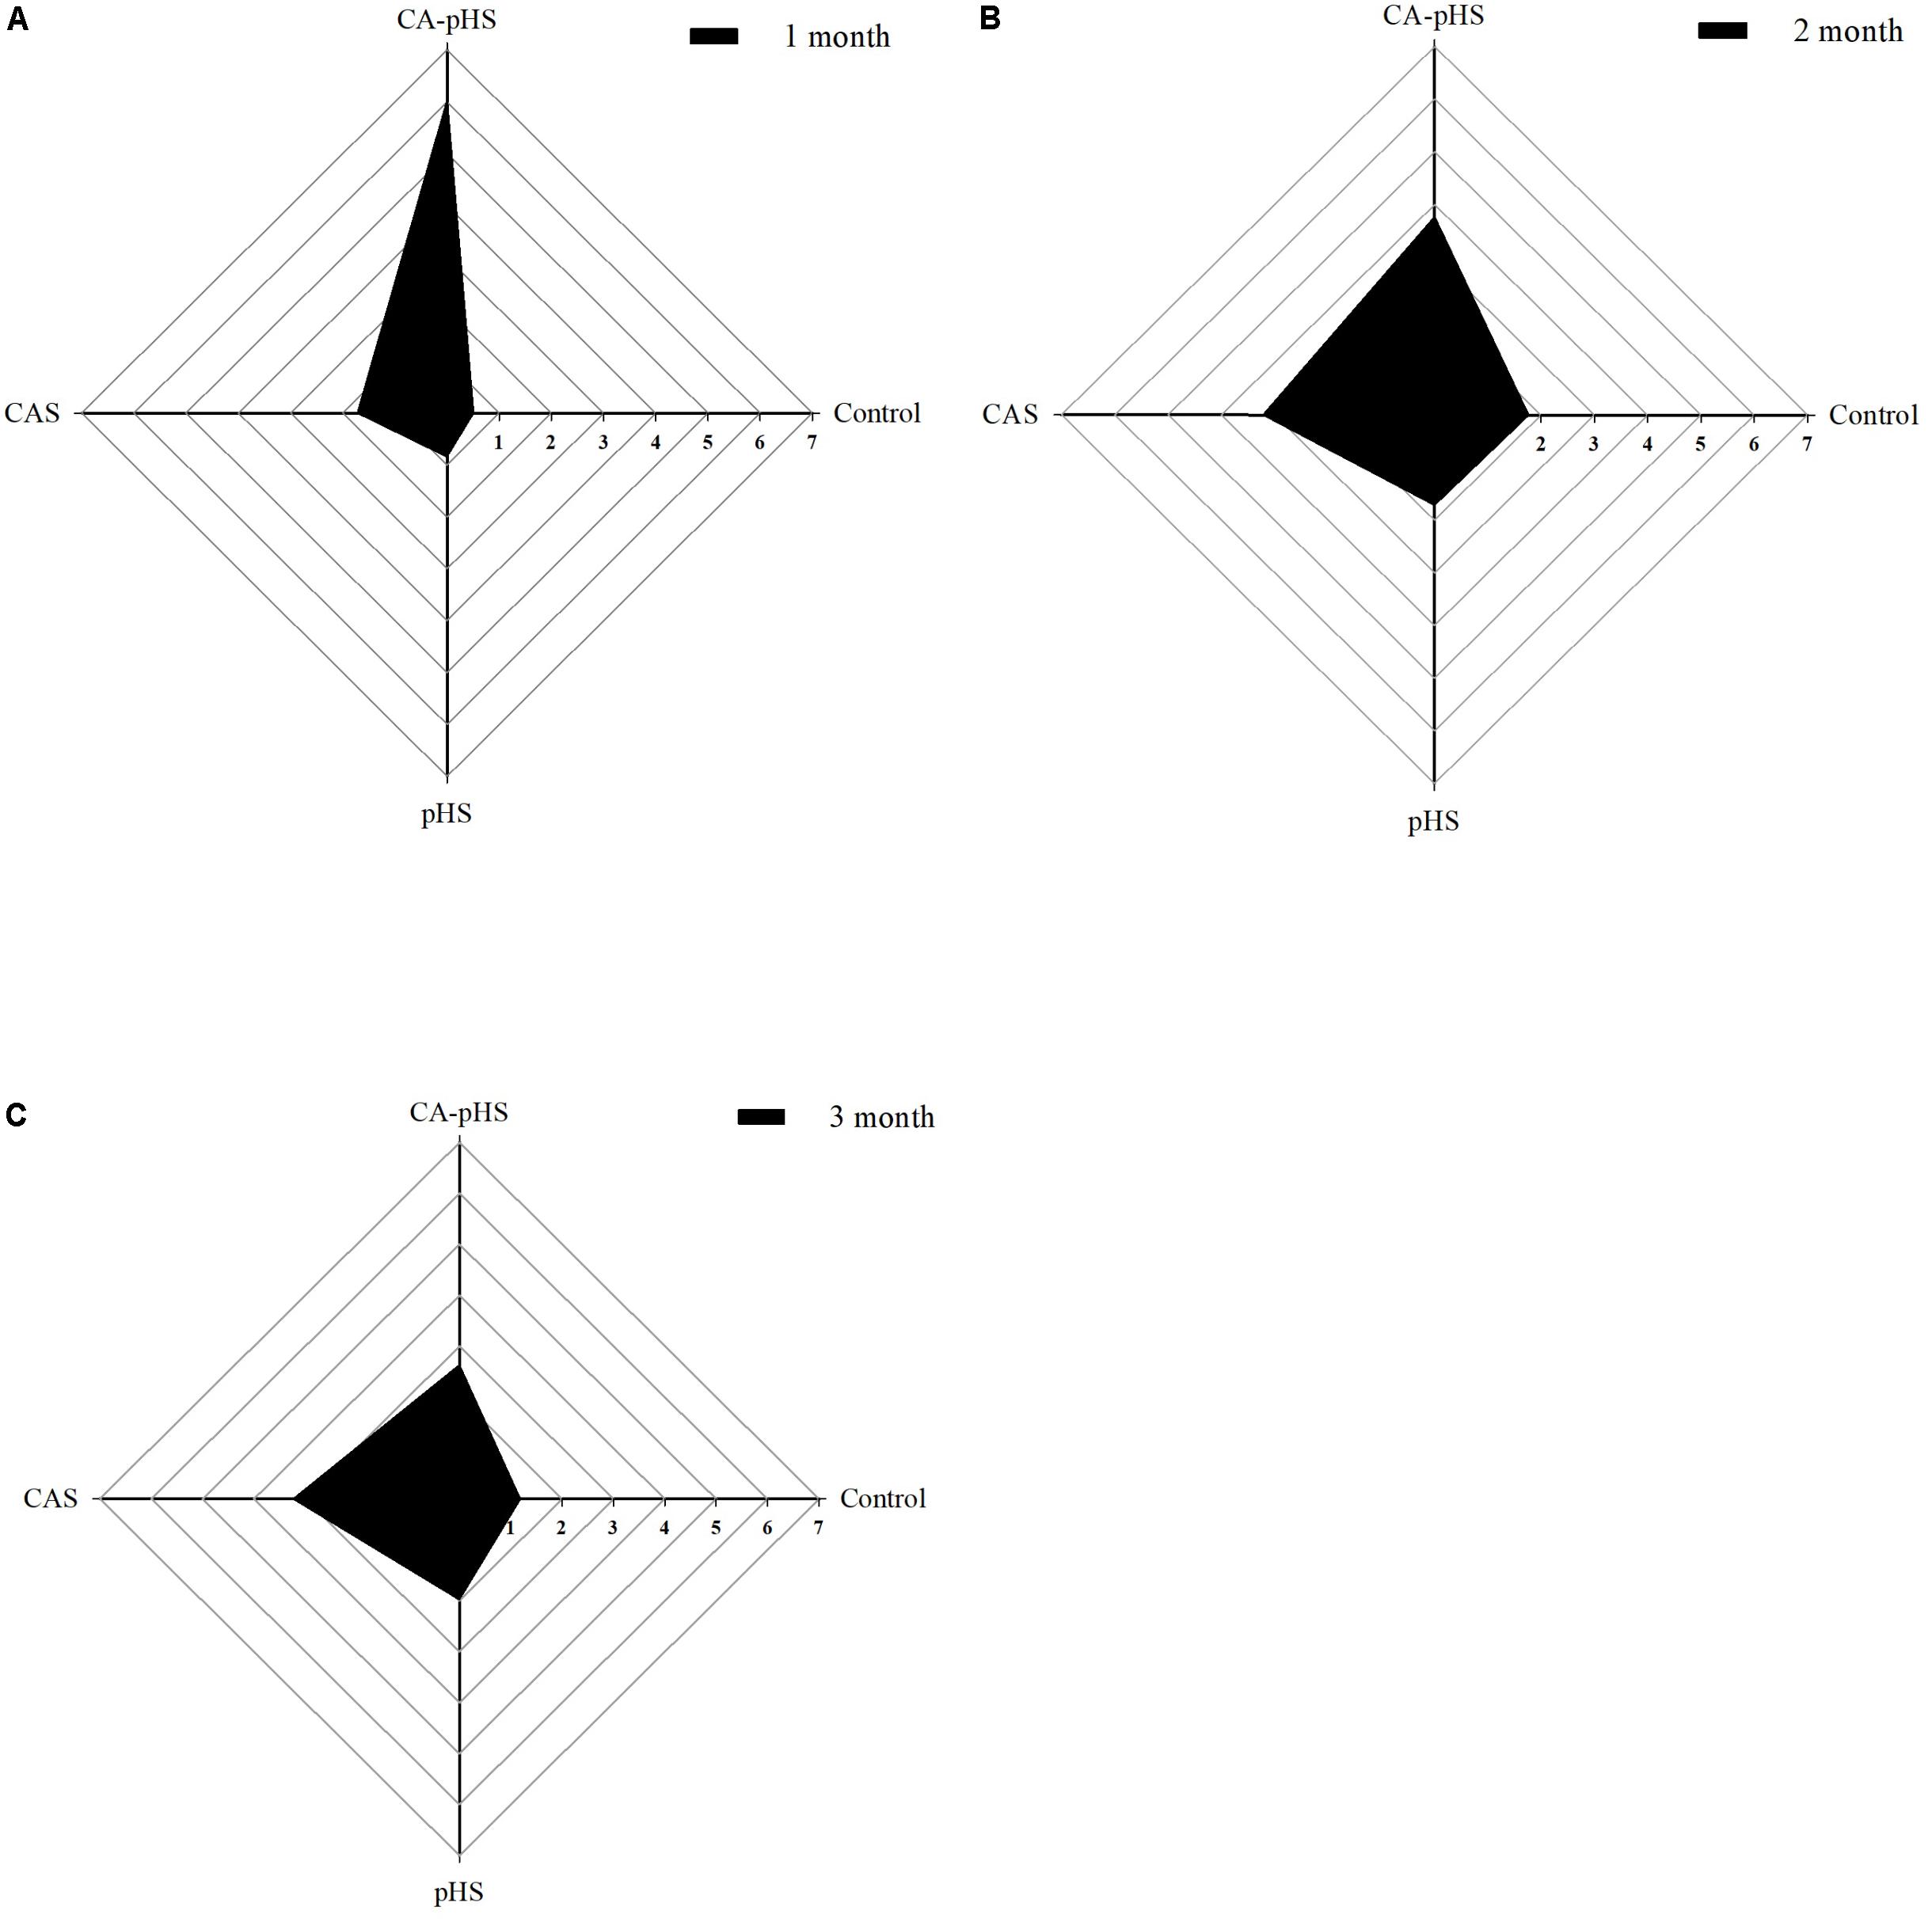
FIGURE 12. Juvenile of S. constricta integrated biomarker response (IBR) values in the long-term toxicity test. (A–C) Represent month 1, month 2, and month 3, respectively. Axis values are expressed as IBR values.
Discussion
Sinonovacula constricta is an estuarine intertidal zone shellfish and faces many challenges, such as the water quality changes, during its life cycle. Therefore, it was selected as a potential shellfish for breeding in ISWs due to its high tolerance of a broad temperature range and different salt concentrations. Previously, Lin and Wu (1984) reported that the development of S. constricta larvae occurs in the metamorphosis phase between 2 and 40°C, and between salinity levels of 1.8 and 40 ppt, but the larvae could survive for several hours in water at -2°C and the survival rate was 3.2% in water at 1.8 ppt. The tolerance levels of S. constricta may be higher than generally considered in terms of long-term low-salt stress tolerance (unpublished data), and the source (living environment) of the parent is also an important reason for determining the level of tolerance of animals (Alden, 1964). In summary, the temperature (annual scope from -10.2–20.2°C) and salinity (average of 6 ppt) data range of the target ISW were considered that may not be an important influence factor (stress factors), in this study. Thus, we tested pH and CA as the key factors in order to study their effects on the growth and physiology of S. constricta.
The key factors that limit the growth and reproduction of farmed animals in ISWs have been investigated widely. In terms of the ions involved in ISWs, CO32- and HCO3- (CA), OH- (pH), Na+, K+, Ca2+, Mg2+, Cl-, and SO42- can all affect the growth and development of farmed animals (Rijstenbil and Gerringa, 2002; Partridge, 2008; Dinh, 2015). Hiele et al. (2014) suggested that imbalanced ion ratios in ISWs can have major effects on the growth of mussels. Fang et al. (2000) and Yang et al. (2004) reported that high CA and high pH levels are major factors that can restrict aquaculture in ISWs. Studies have shown that the extreme pH value is in the range of 7.08–9.67 and the extreme CA value is in the range of 1.73–12.02 mmol L-1, in northwestern China (Shi, 2009). The results of the acute test showed that the SRs of JSCs under the same CA conditions were not affected by pH in the range of 7.0–9.5. However, when the pH exceeded 9.5, the SR of the JSCs was low after 48 h. Under the same pH, the SRs of the JSCs decreased significantly as the CA concentration increased, where the pH and CA had synergistic effects. According to Dennis (1974) and Wen (2009), the body fluids of aquatic animals tend to maintain a near-neutral pH because cells and organisms are able to tolerate a range of changes in the external pH due to their in vivo buffer system. Thus, when the pH changes in the external environment, the chemical buffer system can maintain the balance. However, when it exceeds the buffer limit, the pH value of the body fluids will change drastically and affect the normal physiological activities of the organism. Zheng et al. (2005) found that elevated water CA can cause surface damage to the gill tissues of aquatic animals as well as affecting the function of the outer surface of the gill epidermal cells, which exchange Cl- and HCO3-. Galat et al. (2010) also found that exposure to a high level of CA for a short time could lead to the proliferation or hypertrophic gill chloride cells. Ye et al. (2011) showed that the survival and growth of Mytilus coruscus larvae are influenced by pH, where the survival and growth of the larvae were significantly inhibited when the pH was 10.0. This result may be attributed to the influence of the environmental pH on the blood pH in the body. Therefore, a pH range of 9.5–10.0 may be the maximum range tolerated by the in vivo buffer system of JSCs, where acute death occurs when the pH exceeds 10.5 because the buffer system is completely disrupted (Wen, 2009). Acute stress tests have shown that exposure to high CA concentrations may damage the gill tissue within a short period of time, thereby resulting in acute death of JSCs (Alper et al., 2002). However, JSCs are also resistant to certain concentrations of CA for a short period of time as well as the pH. There is a balance between pH and CA in water: OH- + HCO3-→ CO32- + H2O, where both elevated pH or elevated CA, will lead to elevated CO32-, and CO32- has a high toxicogenic effect on aquatic animals (Lei et al., 1985; Yao et al., 2010; Zhao et al., 2014). Therefore, according the results of the acute tests, pH and CA have a synergistic lethal effect (Wilkie and Wood, 1996).
We designed the long-term toxicity test according to the results of the acute test. The long-term toxicity test comprised slow acclimation to the stress conditions by all groups during the first 8 days (Table 2), followed by continuous stress for 3 months. According to the PMSR data (Table 4 and Figure 2), highly toxic death and growth inhibition occurred in the first month, followed by a stable mortality rate and few deaths in the different groups. Thus, the combined lethal effect of pH and CA had the greatest influence, followed by pH, but CA did not affect the survival rate. The same trend was also reflected in the SGR and WG results, but unlike the mortality results, the pH and CA did not affect the growth rate. McGraw et al. (2002) and Jayasankar et al. (2009) suggested that a period of acclimation can promote the balance between the physiological environment and the surrounding environment for aquatic animals, thereby reducing the osmoregulatory stress in animals and increasing survival. Zhao et al. (2016) studied the effects of CA on osmolality in Nile tilapia and showed that the effect of CA on the osmotic pressure was acute, with the maximum impact occurring in 24 h before decreasing. In a study of the effects of pH on the survival of Moerella iridescens juveniles, Gu et al. (1998) found that there was a dramatic change in survival after 5 days (45% on day 5) at pH 10.0, but the survival rate was basically stable from days 5–14 (40% on days 10 and 14), thereby indicating their strong adaptation to a high pH. These observations are consistent with the results of the acute and chronic stress tests conducted in the present study. According to Portz et al. (2006), the pH can directly affect the composition of HCO3- and CO32- in aquatic animals to influence physiological metabolism, but this effect can be reduced under long-term stress (Portz et al., 2006; Parra and Baldisserotto, 2007). In the present study, the pH had a greater effect on the survival of JSCs but it did not influence growth, whereas only increasing the CA did not affect survival and growth in the JSCs. Under a high pH, a large amount of CO32- was present in the CA-pHS group, where it had significant adverse effects on the survival and growth of JSCs. However, most of the JSCs could tolerate these stresses in the long-term test and they adapted to the changed environments (high pH and CA), where the finally survival rates of the JSC exceeded 85% in each group.
Continuous monitoring of physiological indicators in each of the long-term test groups indicated the physiological effects of pH and CA on JSCs. Excluding AChE and LZM (which were not significantly affected by pH and CA), the other indices differed significantly during the first month but the differences decreased in the second and third months. In the first month, the combined effect of pH and CA caused significant increases in the oxygen consumption rate and ammonia excretory rate. Thomas and Poupin (1985) found that high levels of CA induced mixed respiratory and metabolic alkalosis in adult rainbow trout. Pan and Jiang (2002) found a similar effect in shrimp where a high level of CO32- production hindered the gill surface Cl-/HCO3- and Na+/H+ exchange, and the metabolism accelerated and oxygen consumption increased in order to maintain the internal balance. Zhao et al. (2016) showed that changes in the pH and CA upregulated ammonia nitrogen metabolism-related genes in Nile tilapia. These results agree with our AST activity test results, as shown in Figure 10. Fan et al. (2002) studied the acute effects of pH on S. constricta and found that a high pH had no significant effect on the oxygen consumption rate but it had a significant effect on the ammonia excretion rate. By contrast, we found no significant change in the ammonia excretion rate in the pHS group (Figure 6), possibly due to the rapid recovery of ammonia nitrogen excretion after acclimation for 1 month. Changes in pH can damage osmotic regulation in mollusks and even cause disease outbreaks, with a large number of deaths and other phenomena (Breitwieser et al., 1987; Zhang et al., 2008). Pan et al. (2004) studied the effects of pH on the activity of NKA in the gill filaments of L. vannamei. When the pH varied over 3 days, the NKA activity in the gill filaments of L. vannamei reached the maximum value at 12 h under high pH, but it returned to normal after 3 days. Figure 7 shows that the NKA activity could adjust rapidly in a short time when only the pH increased, which caused osmotic changes in vivo. An increase in HCO3- ions may continue to inhibit the activity of NKA. However, an increase in CO32- ions may upregulate the activity of NKA over a longer period of time. Wang et al. (2013) found that under high CA stress, Gymnocypris przewalskii could respond to changes in the external environment by regulating the activities of SOD, alkaline phosphatase, and acid phosphatase in the liver and kidney. In addition, studies have shown that as the pH increases, the bacteriolytic activity of shrimp decreases and the activity of phenoloxidase increases (Ha et al., 2009). We also found that the SOD activities increased in the JSCs, but pH or CA did not affect the LZM activity in the long term. The conduction and in vivo responses to stress signals in fish are considered to function via the endocrine system and through the nervous system (Portz et al., 2006). The nervous system of fish is more developed than that of shellfish, but it still plays a major role in shellfish physiology (Croll and Dickinson, 2004; Dewilde et al., 2006). The nervous system involves a cascade of reactions (Wayne, 2001) and the results shown in Figure 8 suggest that AChE may act as an upstream regulator of the activities of other enzymes and physiological responses, although the AChE activity was only higher in the CA-pHS group compared with the other groups (but not significantly different) during the first month.
The IBR index was established by Beliaeff and Burgeot (2002). The IBR values can be obtained for different groups by calculating the area of the star plot in order to distinguish the effects of the degree of pollution among groups (Bodin et al., 2004; Oliveira et al., 2010). Jiang et al. (2015) described the effects of the virulence of No. 0 fuel on S. constricta using the IBR index. In contrast to normal seawater, the target ISW features (high pH and CA) could be considered as environmental stressors (Portz et al., 2006). In the present study, we used the IBR index to determine the combined effects of pH and CA in water. Figure 12 shows that the trends in the IBR values during the first month and second month were similar but they could be ranked as: CA-pHS group > CAS group > pHS group > control group. However, compared with the second month, the IBR value for the CA-pHS group was higher than that for the CAS group during the first month. The areas enclosed by the IBR values for each group in the star plot decreased in size from the first month to the third month, thereby indicating that the tolerance of the JSCs to high pH and CA increased under the long-term stress.
Obviously, this series of physiological changes are interrelated, high level CO32- and OH- were present in the CA-pHS group first hinders the gill surface Cl-/HCO3- and Na+/H+ exchange and causes more complete (Compared to groups CAS and pHS) osmotic pressure imbalance. Therefore, resulting in increased NKA activity. The increase in NKA activity leads to a rise of metabolic consumption and then leads to increase in oxygen consumption, ammonia excretion, AST activity, and metabolic free radicals, further leading to SOD activity increase. The JSC individuals who can tolerate the combined effects of these factors have survived, but at the expense of part of the growth energy. However, such effects will be adapted by some JSC in the long-term stress.
Conclusion
In this study, the data showed consistently that high CA and pH levels could induce physiological changes in the JSC within a short time, and even cause death or slow growth, where there was a synergistic effect between CA and pH. However, the JSCs adapted well to these changes under long-term stress. Thus, S. constricta may be a suitable species for breeding in ISWs in China. Other important factors (Na+, K+, Ca2+, Mg2+) in the ISW that influence the survival, growth, and physiology of the S. constricta will be the goals of our next study. We intend to unravel the molecular mechanisms of S. constricta adaptation to the environment of ISW through more in-depth research. In addition, we are very interested in whether S. constricta can affect the content of some ions (such as Ca2+ and Mg2+) in ISW by exerting the function of bivalve (biomineralization), so to explore the possibility of S. constricta as an environmental regulator for ISW. Further practice, cultivation of S. constricta in ISW in Northwest China, is imminent and significant.
Author Contributions
PM was responsible for experimental design, test operations, data processing, and article writing. YB was responsible for test operations and data processing. LX was responsible for experimental design and article modification. LT was responsible for experimental data collection. LJ, ND, and DZ were responsible for the experimental program guidance.
Funding
This work was supported by grants from the National Natural Science Foundation of China [Grant No. 31472278], the “863” Hi-tech Research and Development Program of China [Grant No. 2012AA10A400-3], and the Shanghai Universities Knowledge Service Platform [Grant No. ZF1206].
Conflict of Interest Statement
The authors declare that the research was conducted in the absence of any commercial or financial relationships that could be construed as a potential conflict of interest.
References
Alden, S. (1964). Salinity, temperature, and food requirements of soft-shell clam larvae in laboratory culture. Ecology 45, 283–291. doi: 10.2307/1933841
Allan, G. L., Fielder, D. S., Fitzsimmons, K. M., Applebaum, S. L., and Raizada, S. (2009). New Technologies in Aquaculture. Sawston: Woodhead Publishing Ltd.
Alper, S. L., Darman, R. B., Chernova, M. N., and Dahl, N. K. (2002). The AE gene family of Cl/HCO3- exchangers. J. Nephrol. 15(Suppl. 5), S41–S53.
Beliaeff, B., and Burgeot, T. (2002). Integrated biomarker response: a useful tool for ecological risk assessment. Environ. Toxicol. Chem. 21, 1316–1322. doi: 10.1002/etc.5620210629
Bodin, N., Burgeot, T., Stanisière, J. Y., Bocquené, G., Menard, D., Minier, C., et al. (2004). Seasonal variations of a battery of biomarkers and physiological indices for the mussel Mytilus galloprovincialis transplanted into the northwest Mediterranean Sea. Comp. Biochem. Physiol. C Toxicol. Pharmacol. 138, 411–427. doi: 10.1016/j.cca.2004.04.009
Boyd, C. A., Boyd, C. E., and Rouse, D. B. (2007). Potassium budget for inland, saline water shrimp ponds in Alabama. Aquac. Eng. 36, 45–50. doi: 10.1016/j.aquaeng.2006.06.002
Breitwieser, G. E., Altamirano, A. A., and Russell, J. M. (1987). Effects of pH changes on sodium pump fluxes in squid giant axon. Am. J. Physiol. 253, 547–554. doi: 10.1152/ajpcell.1987.253.4.C547
Chen, J., Shen, G., Zhuan, C., Lin, W., Lin, H., and Cai, D. (1984). Preliminary studies on the use of cyanide in the cultivation of the razor clam. J. Xiamen Univ. 23, 87–93.
Croll, R., and Dickinson, A. G. (2004). Form and function of the larval nervous system in molluscs. Invertebr. Reprod. Dev. 46, 173–187. doi: 10.1080/07924259.2004.9652620
Devin, S., Burgeot, T., Giambérini, L., Minguez, L., and Pain-Devin, S. (2014). The integrated biomarker response revisited: optimization to avoid misuse. Environ. Sci. Pollut. Res. Int. 21, 2448–2454. doi: 10.1007/s11356-013-2169-9
Dewilde, S., Ebner, B., Vinck, E., Gilany, K., Hankeln, T., Burmester, T., et al. (2006). The nerve hemoglobin of the bivalve mollusc Spisula solidissima. J. Biol. Chem. 281, 5364–5372. doi: 10.1074/jbc.M509486200
Dinh, H. Q. (2015). Cultural Biology of the Blue Mussel, Mytilus Edulis (Linnaeus, 1758) in Inland Saline Water in Western Australia. Doctoral thesis, Curtin University of Technology, Bentley WA.
Dinh, H. Q., and Fotedar, R. (2016). Early development of the blue mussel Mytilus edulis (Linnaeus, 1758) cultured in potassium-fortified inland saline water. Aquaculture 452, 373–379. doi: 10.1016/j.aquaculture.2015.11.025
Doroudi, M. S., Fielder, D. S., Allan, G. L., and Webster, G. K. (2006). Combined effects of salinity and potassium concentration on juvenile mulloway (Argyrosomus japonicus, Temminck and Schlegel) in inland saline groundwater. Aquac. Res. 37, 1034–1039. doi: 10.1111/j.1365-2109.2006.01525.x
Dou, L. (2006). The Analysis of Water Environment Changes Over the Past 30 Years in the CaoWoTan Basin of Jingtai Irrigation District. Master thesis, Lanzhou University, Lanzhou.
Doupé, R., Lymbery, A., and Starcevich, M. (2003). Rethinking the land: the development of inland saline aquaculture in western Australia. Inter. J. Agric. Sustain. 1, 30–37. doi: 10.3763/ijas.2003.0104
Doupé, R. G., Sarre, G. A., Partridge, G. J., Lymbery, A. J., and Jenkins, G. I. (2005). What are the prospects for black bream Acanthopagrus butcheri (Munro) aquaculture in salt-affected inland Australia? Aquac. Res. 36, 1345–1355. doi: 10.1111/j.1365-2109.2005.01350.x
Dumbauld, B. R., Ruesink, J. L., and Rumrill, S. S. (2009). The ecological role of bivalve shellfish aquaculture in the estuarine environment: a review with application to oyster and clam culture in West Coast (USA) estuaries. Aquaculture 290, 196–223. doi: 10.1016/j.aquaculture.2009.02.033
Fan, D., Pan, L., Ma, S., and Dong, S. (2002). Effects of salinity and pH on oxygen consumption rate and ammonia excretion rate in Sinonovacula constricta. J. Fish. Sci. China 9, 234–238.
Fang, W., Wang, H., and Lai, Q. (2000). Toxicity of carbonate-alkalinity and pH to larval Penaeus chinensis. J. Fish. Sci. China 7, 78–81.
Fang, W., Wang, H., Lai, Q., and Yu, L. (1995). Effects of salinity on the osmotic and ionic concentrations in the hemolymph of Penaeus orientalis. J. Shanghai Ocean Univ. 4, 122–127.
Feng, B., Niu, D., Zhong, Y., Chen, H., Lin, G., and Li, J. (2012). Molecular characteristics and expression analysis of ScHsc70 cDNA in agamaki clam (Sinonovacula constricta). J. Fish. Sci. China 19, 33–44.
Fielder, D. S., Bardsley, W. J., and Allan, G. L. (2001). Survival and growth of Australian snapper, Pagrus auratus, in saline groundwater from inland New South Wales, Australia. Aquaculture 201, 73–90. doi: 10.1016/S0044-8486(01)00555-5
Galat, D. L., Post, G., Keefe, T. J., and Bouck, G. R. (2010). Histological changes in the gill, kidney and liver of Lahontan cutthroat trout, Salmo clarki henshawi, living in lakes of different salinity-alkalinity. J. Fish. Biol. 27, 533–552. doi: 10.1111/j.1095-8649.1985.tb03200.x
Gu, X., You, Z., and Wang, Y. (1998). Some environmental factors effects on the mud shail Moerella iridescens in the different growth stages. Donghai Mar. Sci. 16, 40–56.
Guo, K., Zhao, W., Jiang, Z., and Dong, S. (2017). A study of organic carbon, nitrogen and phosphorus budget in jellyfish–shellfish–fish–prawn polyculture ponds. Aquac. Res. 48, 68–76. doi: 10.1111/are.12861
Ha, C., Liu, P., He, Y., Li, J., and Li, X. (2009). Effects of high pH on immune enzymes of “Huanghai No.1”population of shrimp Fenneropenaeus chinensis. J. Fish. Sci. China 16, 303–306.
He, M., Lai, Q., Yao, Z., Sui, Y., Lu, J., Gao, P., et al. (2017). Effects of pH and temperature on carbon budget of Sinonovacula constricta. Chin. J. Ecol. 36, 1014–1019.
He, W., Yu, T., and Cai, Y. (2010). Analysis of control and use of alkaline soil. J. Liaoning. Tech. Univ. 29, 158–160.
Hiele, T. V. D., Rijstenbil, J. W., Creemers, J., and Heringa, J. (2014). Composition, treatment and use of saline groundwater for aquaculture in the Netherlands saline groundwater composition and chemistry. World Aquac. 23–27.
Hu, W., Li, K., and Gu, X. (2000). The water quality control methods of high profitable culture of Macrobrachium rosenbergh (Deman) insulin-alkali wetland. J. Nat. Resour. 6, 102–107.
Ingram, B. A., Mckinnon, L. J., and Gooley, G. J. (2015). Growth and survival of selected aquatic animals in two saline groundwater evaporation basins: an Australian case study. Aquac. Res. 33, 425–436. doi: 10.1046/j.1365-2109.2002.00691.x
Jayasankar, V., Jasmani, S., Nomura, T., Nohara, S., Huong, D. T. T., and Wilder, M. N. (2009). Low salinity rearing of the Pacific white shrimp Litopenaeus vannamei: acclimation, survival and growth of postlarvae and juveniles. Japan. Agric. Res. Q. 4, 345–350. doi: 10.6090/jarq.43.345
Jiang, M., Li, L., Shen, X., Wu, Q., Niu, J., and Xv, G. (2015). Investigation of toxic effects of No.0 fuel oil and Pinghu crude oil on Sinonovacula constricta by using integrated biomarker responses. Acta Sci. Circumpola 35, 1174–1182.
Lai, Q., Wang, H., and Fang, W. (2007). Effects of K+ and Ca2+ in aquatic environment on survival of Fenneropenaeus chinensis larvae. Chin. J. Ecol. 26, 1359–1363.
Lee, C. L. (1997). “Design and operation of a land-based closed recirculating hatchery system for the topshell, Trochus niloticus, using treated bore water,” in Trochus: Status, Hatchery Practice and Nutrition, eds B. Smith and C. Barlow (Darwin, NT: Northern Territory University), 6–7.
Lei, Y., Dong, S., and Shen, C. (1985). Study on the toxicity of carbonate-alkaline to fishes. J. Fish. China 9, 171–183.
Lin, B., and Wu, T. (1984). The effects of temperature and salinity on the larvae of Sinonovacula constricta (Lamarck). Acta Ecol. Sin. 4, 89–96.
Lin, B., and Wu, T. (1990). Temperature and salinity in relating to the survinal, growth and development of the larvae and spat of Sinonovacula constricta. J. Fish. China 14, 171–178.
Lin, T., Lai, Q., Lu, J., Yao, Z., Li, Z., Wang, H., et al. (2012). Toxic effects of several saline-alkali factors on Cyclina sinensis. Mar. Fish. 34, 183–188.
Liu, C., Wang, J., Zhang, Y., and Liu, L. (2008). Effects of salinity and Na+/K+ in percolating water from saline-alkali soft on the growth of Litopenaeus vannamei. Chin. J. Appl. Ecol. 19, 1337–1342.
Lv, X., Xu, H., Li, L., and Zhao, Y. (2012). Agricultural sustainable utilization and evaluation of saline-alkali land. Soils 44, 203–207.
Malik, A., Abbas, G., Ghaffar, A., Ferrando, S., Gallus, L., and Shah, S. S. A. (2018). Effect of different salinity level on breeding, fertilization, hatching and survival of Nile tilapia, Oreochromis niloticus (Linnaeus, 1758) in captivity. Pak. J. Zool. 50, 539–547. doi: 10.17582/journal.pjz/2018.50.2.539.547
McGraw, W. J., Davis, D. A., Teichertcoddington, D., and Rouse, D. B. (2002). Acclimation of Litopenaeus vannamei postlarvae to low salinity: influence of age, salinity endpoint, and rate of salinity reduction. J. World Aquac. Soc. 33, 78–84. doi: 10.1111/j.1749-7345.2002.tb00481.x
Niu, D., Li, J., Wang, G., Jiang, Z., Zhang, W., Shen, Y., et al. (2007). The genetic diversity of mitochondrial 16S rRNA gene fragment in six populations of Sinonovacula constricta. J. Shanghai Fish. Univ. 16, 1–6.
Niu, D., Wang, F., Xie, S., Sun, F., Wang, Z., Peng, M., et al. (2016). Developmental transcriptome analysis and identification of genes involved in larval metamorphosis of the razor clam, Sinonovacula constricta. Mar. Biotechnol. 18, 168–175. doi: 10.1007/s10126-016-9691-y
Niu, D., Wang, L., Bai, Z., Xie, S., Zhao, H., and Li, J. (2015). Identification and expression characterization of the myostatin (MSTN) gene and association analysis with growth traits in the razor clam Sinonovacula constricta. Gene 555, 297–304. doi: 10.1016/j.gene.2014.11.020
Oliveira, M., Ahmad, I., Maria, V. L., Pacheco, M., and Santos, M. A. (2010). Monitoring pollution of coastal lagoon using Liza aurata kidney oxidative stress and genetic endpoints: an integrated biomarker approach. Ecotoxicology 19, 643–653. doi: 10.1007/s10646-009-0436-9
Pan, L., and Jiang, J. (2002). The effect of sudden changes in salinity and pH on the immune activity of two species of shrimps. J. Ocean Univ. Qingdao 32, 903–910.
Pan, L., Liu, Z., and Jiang, L. (2004). The effect of salinity and pH changes on gill Na+-K+-ATPase activity of Litopenaeus vannamei. J. Ocean Univ. China 34, 787–790.
Parra, J. G., and Baldisserotto, B. (2007). Effect of Water pH and Hardness on Survival and Growth of Freshwater Teleosts. Enfield: Science Publishers.
Partridge, G. (2008). Inland Saline Aquaculture: Overcoming Biological and Technical Constraints Towards the Development of an Industry. Doctoral thesis, Murdoch University, Murdoch WA.
Peng, M., Niu, D., Wang, F., Chen, Z., and Li, J. (2016). Complement C3 gene: expression characterization and innate immune response in razor clam Sinonovacula constricta. Fish Shellfish Immun. 55, 223–232. doi: 10.1016/j.fsi.2016.05.024
Portz, D. E., Woodley, C. M., and Cech, J. J. Jr. (2006). Stress-associated impacts of short-term holding on fishes. Rev. Fish. Biol. Fish. 16, 125–170. doi: 10.1007/s11160-006-9012-z
Prangnell, D., and Fotedar, R. (2005). The effect of potassium concentration in inland saline water on the growth and survival of the western king shrimp, Penaeus latisulcatus Kishinouye, 1896. J. Appl. Aquac. 17, 19–34. doi: 10.1300/J028v17n02_02
Qadir, M., Ghafoor, A., and Murtaza, G. (2001). Amelioration strategies for saline soils: a review. Land Degrad. Dev. 12, 357–386. doi: 10.1002/ldr.458
Rahim, A., Abbas, G., Ferrando, S., Gallus, L., and Ghaffar, A. (2017). Assessment of growth performance and meat quality of black fin sea bream, Acanthopagrus berda (Forsskal, 1775) reared in brackish water ponds: a preliminary investigation. Pak. J. Zool. 49, 869–876. doi: 10.17582/journal.pjz/2017.49.3.869.876
Rijstenbil, J. W., and Gerringa, L. J. (2002). Interactions of algal ligands, metal complexation and availability, and cell responses of the diatom Ditylum brightwellii with a gradual increase in copper. Aquat. Toxicol. 56, 115–131. doi: 10.1016/S0166-445X(01)00188-6
Roy, L. A., Allen, D. D., Patrick, S. I., Boyd, C. A., Pine, H. J., and Boyd, C. E. (2010). Shrimp culture in inland low salinity waters. Rev. Aquac. 2, 191–208. doi: 10.1111/j.1753-5131.2010.01036.x
Salati, A. P., Ferrando, S., Movahedinia, A., Gambardella, C., and Gallus, L. (2014). Effect of different levels of salinity on immunolocalization of Na+-K+ATPase and aquaporin 3 in kidney of common carp Cyprinus carpio. Iran. J. Vet. Res. 15, 45–49.
Sedmak, J. J., and Grossberg, S. E. (1977). A rapid, sensitive, and versatile assay for protein using Coomassie brilliant blue G250. Anal. Biochem. 79, 544–552. doi: 10.1016/0003-2697(77)90428-6
Shentu, Q., Dong, S., Zhao, W., Zhang, Z., Lv, A., and Lu, L. (2000). Effects of salinity and alkalinity oll plankton and water chemical factors. Chin. J. Appl. Ecol. 11, 449–454.
Shi, Y. (2009). Studies on Water Quality Characteristics and Change Regulations of Culture Ponds with Heavy Saline-Alkaline Soil. Master thesis, Shanghai Ocean University, Pudong.
Shumway, S. E., Davis, C., Downey, R., Karney, R., Kraeuter, J., Parsons, J., et al. (2003). Shellfish aquaculture - in praise of sustainable economies and environments. Data 34, 15–17.
Stephan, C. E. (1977). Methods for Calculating an LC50. Aquat. Toxic. Hazard. Eval. 34, 65–84. doi: 10.1520/STP32389S
Tantulo, U., and Fotedar, R. (2006). Comparison of growth, osmoregulatory capacity, ionic regulation and organosomatic indices of black tiger prawn (Penaeus monodon Fabricius, 1798) juveniles reared in potassium fortified inland saline water and ocean water at different salinities. Aquaculture 258, 594–605. doi: 10.1016/j.aquaculture.2006.04.038
Thomas, S., and Poupin, J. (1985). A study of the effects of water carbonate alkalinity on some parameters of blood acid-base status in rainbow trout (Salmo gairdneri R.). J. Comp. Physiol. B 156, 29–34. doi: 10.1007/BF00692923
Tolley, S. G., Volety, A. K., and Savarese, M. (2004). Shellfish research and adaptive resource management in southwest Florida: oysters as sentinels of ecosystem health. World Aquac. 1, 31–66.
Wang, H., Geng, L., Fang, W., Lai, Q., Tian, R., Zhao, Z., et al. (1997). Studies on the commercially experimental culture of penaeid shrimp, Penaeus chinensis, transplanted to the northwest inland salt waters. Mar. Fish. 1, 9–12.
Wang, J., Jin, H., Zhong, T., and Chen, Z. (2011). Review on sustainable utilization of salt-affected land. Acta Geogr. Ain 66, 673–684.
Wang, Y., and Shi, G. (2010). Analysis on the characteristics of temperature and precipitation in Jingtai County since recent 50 years. J. Arid Land. Resour. Environ. 24, 89–95.
Wang, Z., Yao, Z., Lin, T., Shi, J., Zhou, K., Wang, H., et al. (2013). Effects of carbonate alkalinity stress on SOD, ACP, and AKP activities in the liver and kidney of juvenile Gymnocypris przewalskii. J. Fish. Sci. China 20, 1212–1218. doi: 10.3390/ijms11125234
Wayne, N. L. (2001). Regulation of seasonal reproduction in mollusks. J. Biol. Rhythm. 16, 391–402. doi: 10.1177/074873001129002097
Wilkie, M. P., and Wood, C. M. (1996). The adaptations of fish to extremely alkaline environments. Comp. Biochem. Physiol. B 113, 665–673. doi: 10.1016/0305-0491(95)02092-6
Wu, H., and Xv, A. (2000). A test on artificial cultivation of Sinonovacula constricta (Lamarck). Mar. Sci. 24, 15–17.
Wu, Z., Pan, L., and Dong, S. (2003). Effects of nine metal ions on digestive enzyme activities of Sinonovacula constricta. J. Fish. Sci. China 10, 297–300.
Xiao, L. (2004). Study on indicator selection for determination of water alkalify. Technol. Dev. Chem. Indust. 33, 43–44.
Xie, S., Niu, D., Haideng, R., Wang, Z., Wang, F., Chen, S., et al. (2015). Molecular characterization of IGFBP and association analysis with growth traits in the razor clam Sinonovacula constricta. J. Fish. Chin. 39, 799–809.
Yang, F., Sun, L., and Yang, X. (2004). Toxicity of Carbonate alkalinity to Penaeus vannamei Juveniles. Fish. Sci. 23, 3–6.
Yao, Z., Wang, H., Zhou, K., Ying, C., and Lai, Q. (2010). Effects of water carbonate alkalinity and pH on survival rate of post-larval Litopenaeus vannamei. Chin. J. Ecol. 29, 945–950.
Ye, Y., Xv, M., and Wu, C. (2011). Influences of some environmental factors on growth and survival of Mytilus coruscus gould larvae. J. Zhejiang Ocean Univ. 30, 292–296.
Zhang, L., Pan, L., and Luan, Z. (2008). Effects of pH on ion-transport enzyme activities and survival, growth of mars Penaeus japonicus postlarvae. J. Fish. China 32, 758–764.
Zhang, Z., Zhang, Z., and Dong, S. (1999). Advance in research on the effects of pH, salinity and alkalinity on freshwater cultured species. J. Fish. Sci. China 6, 95–98.
Zhao, L., Zhao, J., Jeerawat, T., and Zhao, Y. (2014). Effects of salinity-alkalinity on serum osmolality, ion concentration and mRNA expression of ion transport enzymes of Oreochromis niloticus. J. Fish. China 38, 1696–1704.
Zhao, Y., Wu, J., Meng, S., Wang, Y., Wu, H., and Zhao, J. (2016). Effects of carbonate alkalinity on serum pH, ammonia concentration and related gene expression in Oreochromis niloticus. J. S. Agric. 47, 1032–1038.
Zheng, W., Zhang, Z., Zhang, M., Dong, S., and Zhang, Q. (2005). Toxicity of salinity and alkalinity to Lateolabrax japonicus fingerlings. Chin. J. Eco Agric. 13, 116–118.
Keywords: carbonate alkalinity, enzyme activity, growth, inland saline water, pH, Sinonovacula constricta
Citation: Maoxiao P, Bo Y, Xiaojun L, Donghong N, Tianyi L, Zhiguo D and Jiale L (2018) Effects of Alkalinity and pH on Survival, Growth, and Enzyme Activities in Juveniles of the Razor Clam, Sinonovacula constricta. Front. Physiol. 9:552. doi: 10.3389/fphys.2018.00552
Received: 15 March 2018; Accepted: 30 April 2018;
Published: 18 May 2018.
Edited by:
Nour Eissa, University of Manitoba, CanadaReviewed by:
Alexssandro Geferson Becker, Universidade Federal do Paraná, BrazilLorenzo Gallus, Università di Genova, Italy
Copyright © 2018 Maoxiao, Bo, Xiaojun, Donghong, Tianyi, Zhiguo and Jiale. This is an open-access article distributed under the terms of the Creative Commons Attribution License (CC BY). The use, distribution or reproduction in other forums is permitted, provided the original author(s) and the copyright owner are credited and that the original publication in this journal is cited, in accordance with accepted academic practice. No use, distribution or reproduction is permitted which does not comply with these terms.
*Correspondence: Li Jiale, amxsaTIwMDlAMTI2LmNvbQ==
†These authors have contributed equally to this work.