 Pengfei Xu1†
 Jens-Uwe Werner1†
 Sebastian Milerski1Carmen M. Hamp1
 Tatjana Kuzenko1
 Markus Jähnert2
 Pascal Gottmann2Luisa de Roy3Daniela Warnecke3
 Alireza Abaei4
 Annette Palmer5
 Markus Huber-Lang5
 Lutz Dürselen3Volker Rasche4Annette Schürmann2
 Martin Wabitsch6*
 Uwe Knippschild1*
- 1Department of General and Visceral Surgery, Ulm University Hospital, Ulm, Germany
- 2Department of Experimental Diabetology, German Institute of Human Nutrition, Potsdam-Rehbrücke, Potsdam, Germany
- 3Institute of Orthopaedic Research and Biomechanics, Center for Trauma Research, Ulm University Medical Center, Ulm, Germany
- 4Core facility “Small Animal Imaging”, Ulm University, Ulm, Germany
- 5Institute of Clinical and Experimental Trauma Immunology, Ulm University Hospital, Ulm, Germany
- 6Division of Pediatric Endocrinology and Diabetes, Ulm University Hospital for Pediatrics and Adolescent Medicine, Ulm, Germany
Injury to skeletal muscle affects millions of people worldwide. The underlying regenerative process however, is a very complex mechanism, time-wise highly coordinated, and subdivided in an initial inflammatory, a regenerative and a remodeling phase. Muscle regeneration can be impaired by several factors, among them diet-induced obesity (DIO). In order to evaluate if obesity negatively affects healing processes after trauma, we utilized a blunt injury approach to damage the extensor iliotibialis anticus muscle on the left hind limb of obese and normal weight C57BL/6J without showing any significant differences in force input between normal weight and obese mice. Magnetic resonance imaging (MRI) of the injury and regeneration process revealed edema formation and hemorrhage exudate in muscle tissue of normal weight and obese mice. In addition, morphological analysis of physiological changes revealed tissue necrosis, immune cell infiltration, extracellular matrix (ECM) remodeling, and fibrosis formation in the damaged muscle tissue. Regeneration was delayed in muscles of obese mice, with a higher incidence of fibrosis formation due to hampered expression levels of genes involved in ECM organization. Furthermore, a detailed molecular fingerprint in different stages of muscle regeneration underlined a delay or even lack of a regenerative response to injury in obese mice. A time-lapse heatmap determined 81 differentially expressed genes (DEG) with at least three hits in our model at all-time points, suggesting key candidates with a high impact on muscle regeneration. Pathway analysis of the DEG revealed five pathways with a high confidence level: myeloid leukocyte migration, regulation of tumor necrosis factor production, CD4-positive, alpha-beta T cell differentiation, ECM organization, and toll-like receptor (TLR) signaling. Moreover, changes in complement-, Wnt-, and satellite cell-related genes were found to be impaired in obese animals after trauma. Furthermore, histological satellite cell evaluation showed lower satellite cell numbers in the obese model upon injury. Ankrd1, C3ar1, Ccl8, Mpeg1, and Myog expression levels were also verified by qPCR. In summary, increased fibrosis formation, the reduction of Pax7+ satellite cells as well as specific changes in gene expression and signaling pathways could explain the delay of tissue regeneration in obese mice post trauma.
Introduction
The skeletal muscle exhibits a high potential to regenerate after injury, although the total turnover rate of the muscle is very low. Muscle regeneration can be divided into the initial response phase, which includes early inflammation and degenerative events, the peak inflammation, and degenerative response phase, and the structural and functional muscle recovery phase. The complement system as major fluid phase of the innate immune system is crucially involved in the initiation of the inflammatory phase. It is rapidly activated in injured muscle tissue leading to immune cell infiltration in the lesion site (Frenette et al., 2000). Neutrophils are the first to be recruited. Thereafter, monocytes invade the lesion area and differentiate into pro-inflammatory M1 macrophages (M1Φ). Resident MΦ are activated to remove tissue debris, attract satellite cells to the injured site, and stimulate their proliferation (Tidball and Villalta, 2010; Rigamonti et al., 2014). In later stages, M2 macrophages (M2Φ; 24–48 h) resolve inflammation. In response to injury, satellite cells (Pax7+ progenitor cells), which can be found in a niche between sarcolemma and basal lamina, are activated (as documented by the expression of the myogenic regulatory factors Myf5 and Myod), transiently proliferate and upregulate genes necessary for terminal differentiation (myogenin and MRF4) (Chargé and Rudnicki, 2004). There is only minor evidence of a direct contribution to the production of new muscle fibers by other cells residing in the interstitium or recruited from a distal source. Thus, research has focused on understanding the processes within the microenvironment that modulate satellite cell renewal and differentiation, including the composition and milieu secreted by both inflammatory and non-inflammatory cells (Boppart et al., 2013; Yin et al., 2013).
MΦ contribute to muscle regeneration by stimulating survival and proliferation of primary progenitor cells in the muscle, the satellite cells (Pax7+) (1–8 days) (Cantini et al., 1994; Warren et al., 2005), by releasing pro-inflammatory cytokines (Li, 2003; Toth et al., 2011) and by promoting myogenic differentiation through M2Φ. In addition, fibroblasts are also involved in regulating satellite cell proliferation and differentiation (Murphy et al., 2011). However, the complex fine-tuned regeneration process of injured muscles can be perturbed by several factors, such as obesity (Finkelstein et al., 2007; Norton et al., 2011; Abhyankar et al., 2012; Nelson et al., 2012). In obesity, adipose tissue functions are deregulated leading to changes in the release of growth factors, adipocytokines, cytokines, chemokines, hormones, and fatty acids which are secreted from adipocytes and MΦ resident in white adipose tissue (Fischer-Posovszky et al., 2007; Wozniak et al., 2009; Adamczak and Wiecek, 2013; Al-Suhaimi and Shehzad, 2013; de Oliveira Leal and Mafra, 2013; Cao, 2014). These changes affect lipid metabolism, glucose homeostasis, inflammation, angiogenesis, hemostasis, and blood pressure. In addition, the ectopic lipid accumulation in several organs and tissues can lead to various severe co-morbidities including heart disease, diabetes, metabolic syndrome, hypertension, sleep apnea, and cancer.
However, little is known on the molecular level whether and how early lifetime nutrition and severe obesity influence the regeneration of injured muscles (Trayhurn et al., 2011; Woo et al., 2011; Akhmedov and Berdeaux, 2013). The role of obesity on skeletal muscle physiology, structural maintenance, and regeneration after exposure to myotoxins or freezing has been analyzed in several obese animal models, such as: leptin-deficient (ob/ob), leptin receptor-deficient (db/db) mice, POUND (Leprdb/lb) mice lacking all functional leptin receptors, obese Zucker rats bearing a mutation in the leptin receptor, as well as in rodents fed a high-fat diet (HFD). In normal animals, myotoxin- or freezing-induced injury causes local myofiber necrosis and inflammation, followed by satellite cell activation, proliferation, differentiation, fusion, and ultimately regrowth of myofibers to approximate the same size as the original within 3 weeks (Chargé and Rudnicki, 2004). In contrast, regeneration of injured skeletal muscle is impaired in obese mice: Compared to normal weight littermates HFD mice showed a reduction in muscle mass associated with smaller myofibrils, larger interstitial spaces, increased collagen deposition, and a reduction in the amount and regeneration ability of satellite cells (Hu et al., 2010; Woo et al., 2011). These findings suggest that elevated levels of lipid metabolites, pro-inflammatory cytokines as well as insulin resistance impair satellite cell function in obese mice, finally leading to decreased regeneration capacity (Bosma et al., 2012; Coen and Goodpaster, 2012; Akhmedov and Berdeaux, 2013). However, the exact mechanisms how obesity impairs cellular processes during the different stages of repair, have to be elucidated.
Of note, a model combining HFD with an injury is rare although of high clinical relevance. The most common types of muscle trauma models apply freezing, barium chloride, notexin, or cardiotoxin (Hardy et al., 2016). Depending on the injury type, a different response with regard to regeneration will take place. Since the physical approach for a blunt muscle injury is grossly underrepresented in current literature, we aimed at using a drop tower model for application of injury.
Here, we continued to further analyze the role of obesity on muscle regeneration using our drop-tower based model (Werner et al., 2018) for induction of a blunt trauma to the extensor iliotibialis anticus muscle of normal weight and obese mice. Imaging the trauma induction and regeneration process by magnetic resonance imaging (MRI) clearly showed edema formation and hemorrhage exudate in muscles of normal weight and obese mice. Morphological analysis revealed the occurrence of tissue necrosis, immune cell infiltration, extracellular matrix (ECM) remodeling and fibrosis formation in the damaged muscle. Regeneration was delayed in muscles of obese mice, with a higher incidence of fibrosis formation due to hampered expression levels of underlying genes. To further analyze previously obtained microarray data (Werner et al., 2018) a time lapse heatmap for an unbiased evaluation of striking candidates was generated. With this approach, we identified 81 differentially expressed genes (DEG) associated, but not limited to, five pathways, which play crucial roles during regeneration. In addition, we focused on Wnt- and satellite cell-related genes in order to assess the influence of obesity on muscle regeneration after injury. Whereas, histological analysis confirmed the notion, that satellite cell numbers are impaired upon injury in obese mice, the detected differences in expression levels of Ankrd1, C3ar1, Ccl8, Mpeg1, and Myog in normal and obese mice could be verified by qPCR. Summarizing, obese mice showed a general lack of regenerative response at all-time points compared to their normal weight counterparts, thus further illustrating the negative influence of obesity on the healing process after skeletal muscle injury.
Materials and Methods
Animal Housing, Breeding, Sampling, and Treatment
C57BL/6J mice were purchased at the age of 16 weeks from the in-house breeding facility within the Animal Research Center at Ulm University and kept in a pathogen free open cage facility pre-injury and in an IVC cage facility post-injury. Animals were kept in a 12 h light/dark cycle at 22.5 ± 1°C with access to food and water ad libitum.
C57BL/6J mice were used for breeding purposes, whereas parent animals received either normal diet (ND; 10% kcal fat; D12450J) or HFD (60% kcal fat; D12492) 1 week prior in order to influence the prenatal development of litters until breeding possibility was exhausted by regularity. Both diets were purchased from Research Diets Inc., by their European distributor Brogaarden® in Gentofte, Denmark. Litters were weaned after 3 weeks and received their respective parental diet for 16 ± 1 weeks until they were sacrificed. Female litter were used for the presented experiments. All animal experiments were approved by the local and state authorities (license number: 1183) and carried out in accordance with local regulations and ARRIVE guidelines. In order to assess the progression of injury in normal weight and obese C57BL/6J mice by immunohistochemistry analysis, gene expression profiling and RT-qPCR, analyses were performed to assess muscle regeneration at 1, 6, 24 h, 3 days, and 8 days post injury. In addition, MRI, HE-, and Sirius Red stainings were also performed 21 days after trauma induction. For this purpose, female C57BL/6J litter animals were randomly grouped into sham and treated groups. Induction of injury to extensor iliotibialis anticus muscle of the left hind leg was carried out by using a physical trauma model previously described (Claes et al., 2006; Weckbach et al., 2013; Wanner et al., 2017; Werner et al., 2018). Briefly, anesthesia was carried out with 2.5 vol% sevoflurane (Sevorane™ Abbott, Wiesbaden, Germany) mixed with 97.5 vol% oxygen. Analgesic treatment involved s. c. injection of Buprenorphine [Temgesic® Reckitt Benckiser, Berkshire, Great-Britain (0.03 mg/kg KG)] 30 min before injury. A weight (40 g) was dropped from a defined height (120 cm bar length; 100 cm effective case depth) on the muscle, generating a defined force input to damage the muscle. Bone fracture was avoided by using a spacer (3 mm), in order to limit the depth of penetration (see Supplementary Figure 1). For increased reproducibility, the area around the muscle to be hit was shaved and marked. Control animals received the same procedure without application of injury. At the defined time points, mice were sacrificed by CO2 inhalation following standard procedure. Tissue was isolated, snap frozen in liquid nitrogen, and stored at −80°C until further use. Additionally, tissue was also formalin-fixed and embedded in paraffin.
Determination of Force Input Into Extensor Iliotibialis Anticus
In order to evaluate whether both, normal weight and obese mice were subjected to a similar force input, the impact force was assessed and calculated by measuring the travel of the trauma wedge over time by using a laser distance sensor (OptoNCDT 2200, Micro-Epsilon, Germany). A more detailed description can be found in Wanner et al. (2017). For this, nine female C57BL/6J mice receiving either a normal or HFD were used.
In Vivo Imaging
Muscle damage was assessed by in vivo MRI. All data were acquired on a dedicated ultrahigh field 11.7T small animal system (BioSpec 117/16, Bruker Biospin, Ettlingen, Germany) equipped with a 9 cm gradient insert (BGA-S9) operating with ParaVision 6.01 software. Signal was received with a four-channel receive-only surface coil placed anterior to the TA. During scanning the respiratory frequency and body temperature were recorded with a MR compatible small animal unit (SA Instruments, Inc., NY, USA). For reproducible positioning, the mouse was placed in supine position with both legs parallel to the bore of the magnet in a self-made holder. Anesthesia was maintained using 1.5% isoflurane (abbvie, Wiesbaden, Germany) and was adjusted to maintain a safe respiration rate about 80 cycles per minute. All animals were scanned prior to the injury and 1, 6, 24 h, 3 days, 8 days, and 21 days after injury.
The following MR scans were performed: 2D FLASH in coronal and axial slice orientation with acquisition parameters as TE/TR = 3.1/280 ms, spatial resolution Δr = 100 × 100 × 1,000 μm3; T1-weighted multi spin-echo (T1-RARE) with acquisition parameters as TE/TR = 12.4 /815 ms, Δr = 86 × 100 × 500 μm3, RARE factor = 3; T2-weighted multi spin-echo (T2-RARE) with acquisition parameters as TE/TR = 46.5/3,470 ms, Δr = 86 × 100 × 500 μm3, RARE factor = 16, and a multi spin-echo T2 mapping sequence acquiring 30 echoes with 7.5 ms echo spacing with Δr = 171 × 200 × 500 μm3. T2 mapping was performed using a mono-exponential fit with offset correction.
Hematoxylin and Eosin (HE) Staining
Muscle tissue from female normal weight (n = 3) and obese mice (n = 3) was collected before and 1, 6, 24 h, 3, 8, and 21 days after trauma induction and subsequently embedded in paraffin. 5 μm thick tissue-sections were deparaffinized, rehydrated, and stained by HE as described previously (Werner et al., 2018).
Sirius Red Staining
Paraffin embedded Extensor iliotibialis anticus muscle tissue from normal weight (n = 3) and obese mice (n = 3) collected before and 1, 6, 24 h, 3, 8, and 21 days after trauma induction was longitudinally cut into 5 μm-thick sections with circular layer and myenteric ganglia for cross-sections. Deparaffinized sections were stained with 0.1% Sirius Red dissolved in aqueous saturated picric acid for 1 h. Thereafter, sections were washed twice in water, and subsequently stained with hematoxylin for 10 min. Dehydration was carried out by incubation of the sections in 96% EtOH twice for 5 min, followed by incubation in 100% EtOH twice for 5 min and twice in Roti®-Histol for 10 min. Finally, sections were mounted using Entellan®.
Immunohistochemical Analysis of Pax7, C3ar, and C5ar
Deparaffinized and rehydrated 3 μm thick muscle sections collected before at the indicated time points after induction of normal weight and obese mice were microwaved with CitraPlus solution (Biogenex, San Ramon, California, USA) for antigen retrieval. Sections were then incubated in 3% H2O2 for 15 min to prevent endogenous peroxidase activity, whereas unspecific binding sites were subsequently blocked by applying blocking solution (TBS + 0.3% Tween20 + 10% goat serum) at RT for 30 min. Anti-Pax7 (ThermoFisher Scientific, Dreieich, Germany; PA1-24471; 1:750; n = 6), anti-C3ar (Bioss Antibodies; Woburn, MA, USA; bs-2955R; 1:100; n = 3) or anti-C5ar (proteintech®; Manchester, United Kingdom; 21316-1-AP; 1:100; n = 3) were applied and incubated at RT for 2 h. Goat anti-rabbit secondary antibodies (N-histofineH from Nichirei Corporation, Tokyo, Japan for Pax7; Jackson ImmunoResearch Laboratories Inc., West Grove, PA, USA; 111-035-144; 1:50; for C3ar/C5ar) were then added for 1 h at RT and developed by adding the chromogen 3,39-diaminobenzidine (DAB; Agilent, Santa Clara, CA, USA). Sections were counterstained with hematoxylin and briefly immersed into 1% HCl in EtOH to prevent unspecific binding. Sections were then de-hydrated and mounted using Entellan® (Merck, Darmstadt, Germany).
RNA Isolation and Microarray Analysis
Tissue from extensor iliotibialis anticus muscle of normal weight and obese female mice, control and injury (n = 3 per group), was used. Harvesting time points were 1, 6, 24 h, 3, and 8 days to cover the early and middle stage regeneration process. Isolation of total RNA, microarray analysis and evaluation method were described previously (Werner et al., 2018). Briefly, CEL-files of trauma vs. control were compared per time point and diet, respectively. While each time point could be used to generate a traditional heatmap, we comprised the data previously published by Werner et al. into a time lapse (Werner et al., 2018), screened shared and unique genes, and performed a pathway analysis with the high impact genes (81 in total). The general workflow of this method is shown in Figure 1. Full data can be found at Gene Expression Omnibus under the acronym “GSE103726.”
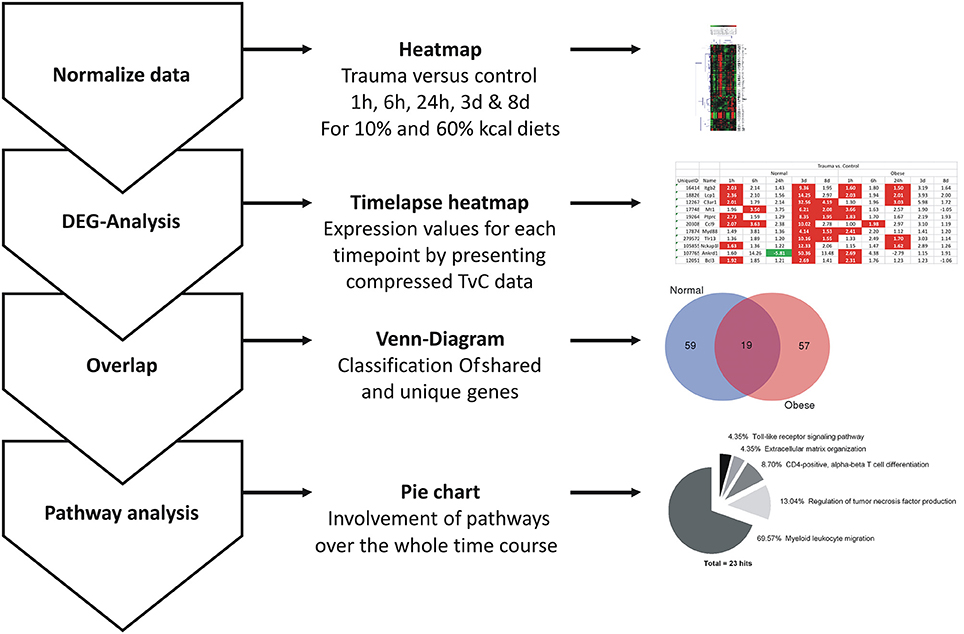
Figure 1. General workflow for evaluation of present microarray data. After normalization of data and generation of heatmaps for each comparison, a general DEG analysis per time point and diet for the generation of a time-lapse heatmap was carried out. The total amount of genes for normal weight and obese mice at each time was compared to screen for unique and shared genes using Venn diagrams at the indicated time points. Final pathway analysis was carried out with ClueGO (Bindea et al., 2009), a plugin for Cytoscape (Lotia et al., 2013).
Real-Time qPCR
Hundred nanograms of total RNA was transcribed into cDNA using the AffinityScript cDNA Synthesis Kit (Agilent Technologies, Santa Clara, USA) according to manufacturer's instructions. Ppia (Mm_Ppia_1_SG QT00247709) was used as reference gene following the recommendations of Gong et al. (2016). Marker genes were Ankrd1 (Mm_Ankrd1_1_SG QT00104419), C3ar1 (Mm_C3ar1_1_SG QT00251216), Ccl8 (Mm_Ccl8_1_SG QT00128548), Mpeg1 (Mm_Mpeg1_1_SG QT00247660), and Myog (Mm_Myog_1_SG QT00112378). Reference genes, markers and SYBR® Green (QantiTect® SYBR® Green PCR Kit) were purchased from Qiagen (Hilden, Germany). Time points evaluated were 24 h, 3, and 8 days for sham and trauma animals (n = 3). Data evaluation was carried out as follows: Each well was related to the average of the housekeeping gene, then averaged again for one value per mouse. Mice were grouped appropriate to time of treatment (control/injury) and diet. Each injured subgroup was normalized on their corresponding controls to determine x-fold values.
Statistical Evaluation
Statistical analysis was carried out by two-sided homoscedastic t-test, for weight distribution, force input, satellite cell counts, and qPCR. Calculation of microarray data was performed by R with the help of the “questionr” package (see Supplementary Table 1). Microarray evaluation used the t-test function of R to determine significance. Briefly, the t-test function performs a two-sided t-test. However, as the t-test function arguments by default are “paired = FALSE, var.equal = FALSE” it instead switches to a Welch-test (or unequal variances t-test), which neither needs equal sample sizes nor assumes equal variances, while solely focusing on the differences between the averages μ1 and μ2 for each group.
Software
Figures were generated using GraphPad Prism version 5 for Windows, GraphPad Software, San Diego California USA, www.graphpad.com.
Analysis of CEL files was carried out with RStudio (RStudio Team, 2016) (version 0.99.903), R (R Development Core Team, 2016) (version 3.2.5), and several R-packages (e.g., “affy,” “pvclust,” “gplots,” and “FactoMineR”). The complete list of packages, including version number, can be found in Supplementary Table 1.
Pathway analysis was performed using ClueGO (Bindea et al., 2009) v2.3.3, a plug-in for Cytoscape (Lotia et al., 2013).
Results
In order to assess the influence of obesity on blunt muscle injuries, an established drop tower device was used for trauma induction on the muscle extensor iliotibialis anticus on the left hind leg of 16-weeks old C57BL/6J mice fed either with a 10 or 60% kcal diet (Claes et al., 2006; Weckbach et al., 2013; Werner et al., 2018). Characteristics of animals and experimental details of trauma induction are depicted in Table 1.
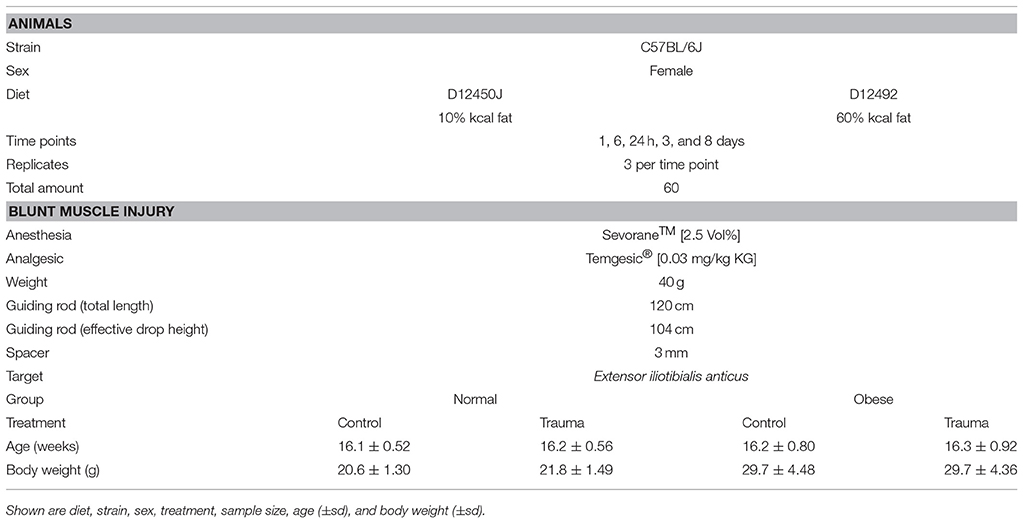
Table 1. Characteristics of C57BL/6J mice and for the induction of a blunt muscle injury.
Morphological Evaluation of a Blunt Muscle Injury to Extensor Iliotibialis Anticus
Although weight distribution of normal weight and obese mice showed significant differences within the control and treated group (Figure 2A), no statistical significant weight-specific differences in the impact forces (Figure 2A) created by the drop tower device were observed. Here, the average forces ranged between 40 and 75 N for our animals, regardless of diet. Hematoma formation and blood inclusion in injured muscle tissue was visible in each case, whereas hematoma formation increased within the first 24 h (Figure 2B).
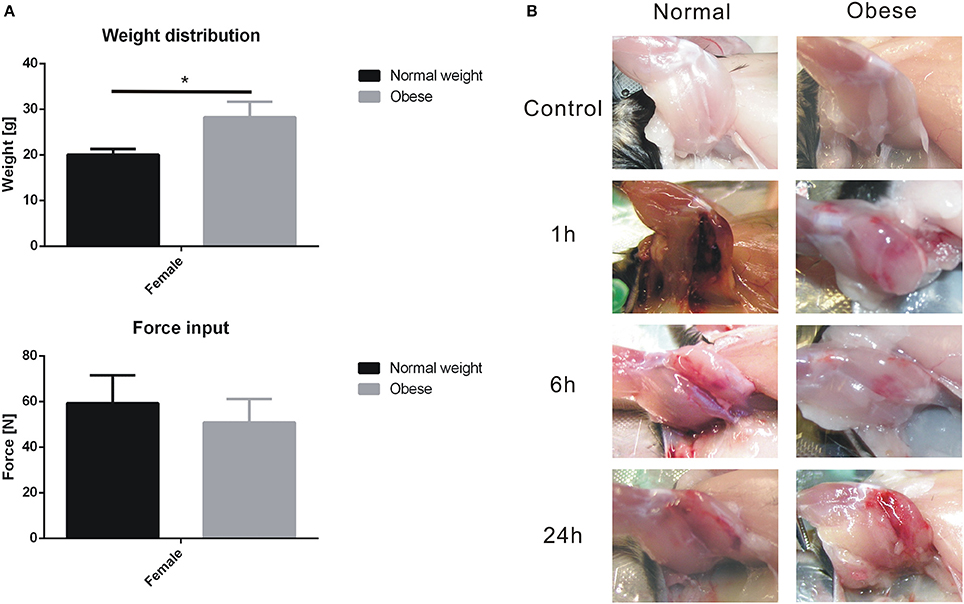
Figure 2. Body weight, force input, and soft tissue trauma induction of the left hind leg of C57BL/6J mice. Values are given with mean ± standard deviation; n = 9. Statistical analysis by two-sided homoscedastic t-test. (A) Weight distribution for normal weight and obese animals (*indicates p ≤ 0.05); Force input into extensor iliotibialis anticus, values showed no significance. (B) Left hind limb of normal weight and obese C57BL/6J mice before and after trauma induction. Hematoma formation was observed within 24 h.
Analysis of physiological changes in the injured leg of female normal weight and obese mice by MRI at different time points of the regeneration process revealed the occurrence of interstitial fluid, edema, and hemorrhage exudate along the gap between muscle fibers and muscle bundles in both, FLASH and T2W images (Figure 3A). Edema formation increased until 6 h post-injury, then receded within 21 days. However, the obese mouse still showed signs of edema 8 days after injury, while the normal weight mouse seemed to recover. Next, to assess general morphological changes in paraffin-embedded muscle tissue of female, normal weight and obese mice at different time points of the regeneration process, HE staining of muscle tissue was conducted at the indicated time points (Figure 3B). Morphology of muscle tissue of control animals was similar, except for the increased fat incorporation in the tissue of obese mice. One hour post-injury, the disruption of muscle tissue and the presence of erythrocytes in normal weight and obese mice were visible. Six hour post-injury immune cells started to infiltrate the damaged tissue peaking at 24 h in normal weight mice, and at day 3 in obese mice. Tissue debris was removed in the muscle tissue of normal weight mice 8 days post-injury, while muscle tissue of obese just showed first signs of beginning regeneration. Twenty-one days post-injury muscle tissue of normal weight animals was almost fully regenerated, whereas the regeneration process in muscle tissue of obese mice was still incomplete and accompanied with a higher rate of fat incorporation. To detect changes in the amount of connective tissue, Sirius Red staining was performed (Figure 3C). In normal weight and obese sham animals, healthy muscle fibers with small amounts of connective tissue were observed in cross sections. However, cross sections of obese animals showed a higher incorporation of fat than those of normal weight animals. Whereas, no distinct differences in the degree of fibrosis were detectable until day 3 post injury, distinct changes in the degree of fibrosis were observed 8 days post-injury. Overall, obese animals showed more severe cases of fibrosis when compared to their normal weight counterparts. These changes manifested in obese mice 21 days post injury.
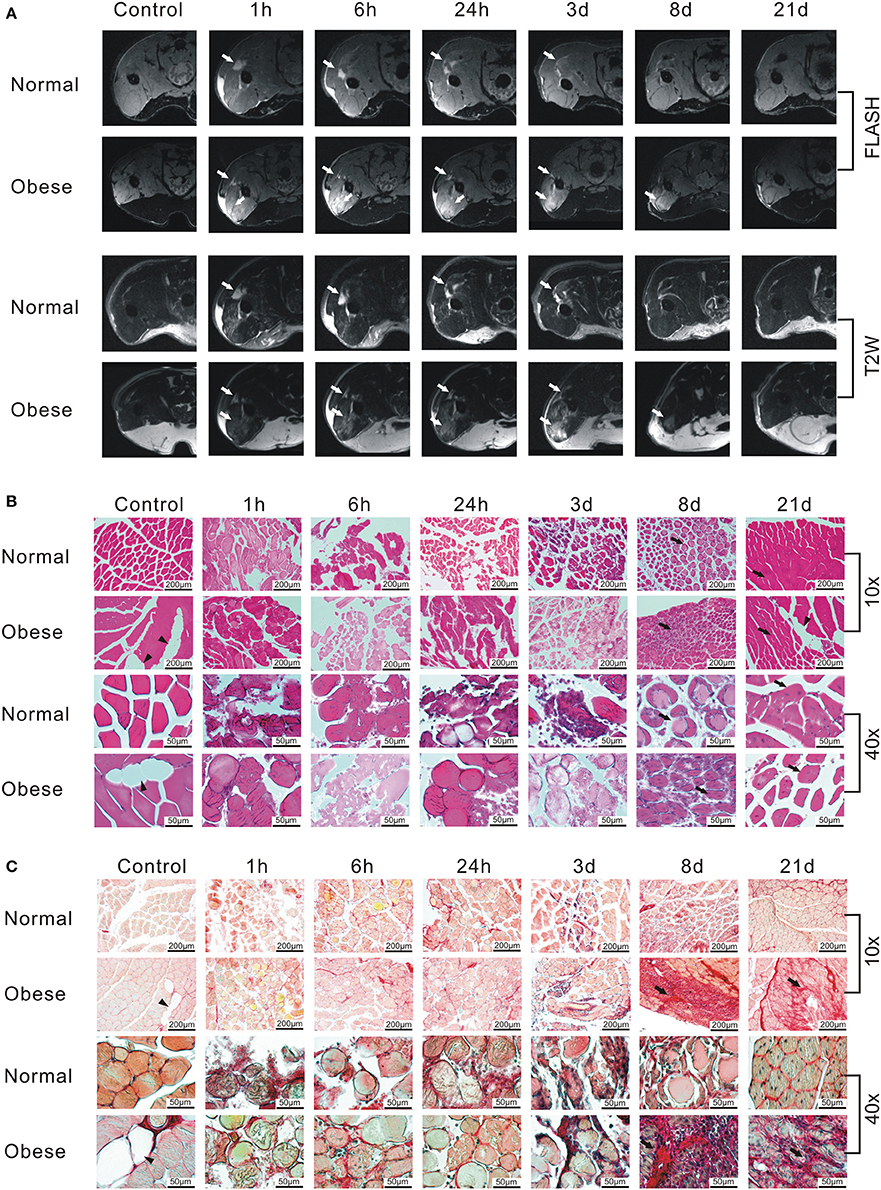
Figure 3. Monitoring of the regeneration process after induction of a blunt muscle injury in female normal weight and obese C57BL/6J mice. (A) FLASH and T2W-RARE recordings of two female C57BL/6J mice receiving either ND or HFD. Arrow = edema. Same animals were used for the whole time course. Prescan (Control) did not show any signs of injury, whereas an edema can be seen starting 1 h post-injury. Edema formation increases until 6 h post-injury, then recedes within 21 days, whereas the obese mouse shows signs of edema 8 days after injury. The normal weight mouse seems to recover within the observed time frame. (B) Hematoxylin-eosin (HE) staining of muscle tissue sections. The staining shows damaged muscle, inflammatory cells and subsequent myofiber regeneration within 21 days post-injury. Triangle = fat inclusion, arrow = newly regenerated myofiber. (C) Sirius Red staining of muscle tissue sections. Triangle = fat inclusion, arrow = fibrosis. Pictures were taken with Olympus IX81 using Xcellence v.1.2. Scale = 200 μm at 10x magnification; Scale = 50 μm at 40x magnification.
Following our histochemical findings in fibrous tissue, we focused on identifying genes involved in fibrosis formation during regeneration of injured muscles. Here, normalized relative gene expression levels (“Trauma vs. Control”) were compared between normal weight and obese mice at 1, 6, 24 h, 3, and 8 days after trauma induction (Table 2). Alterations were detected in collagen-, fibronectin-, TGF-, IL-, MMP-, TIMP-, and Plasminogen-related families. Whereas, expression levels of collagen type I, III, V, VI, VIII, XII, XIV, and fibronectin increased up to 3 days post injury in normal weight mice, obese animals seem to lack a response to injury. Furthermore, expression levels of additional factors involved in ECM remodeling, among them Plat, Plau, Il10ra, Il10rb, Il13ra1, Tgfb1, Tgfbr2, Mmp2, Mmp3, Mmp14, Timp1, and Timp2 were increased in normal mice after injury, but much weaker effects were observed in obese mice.
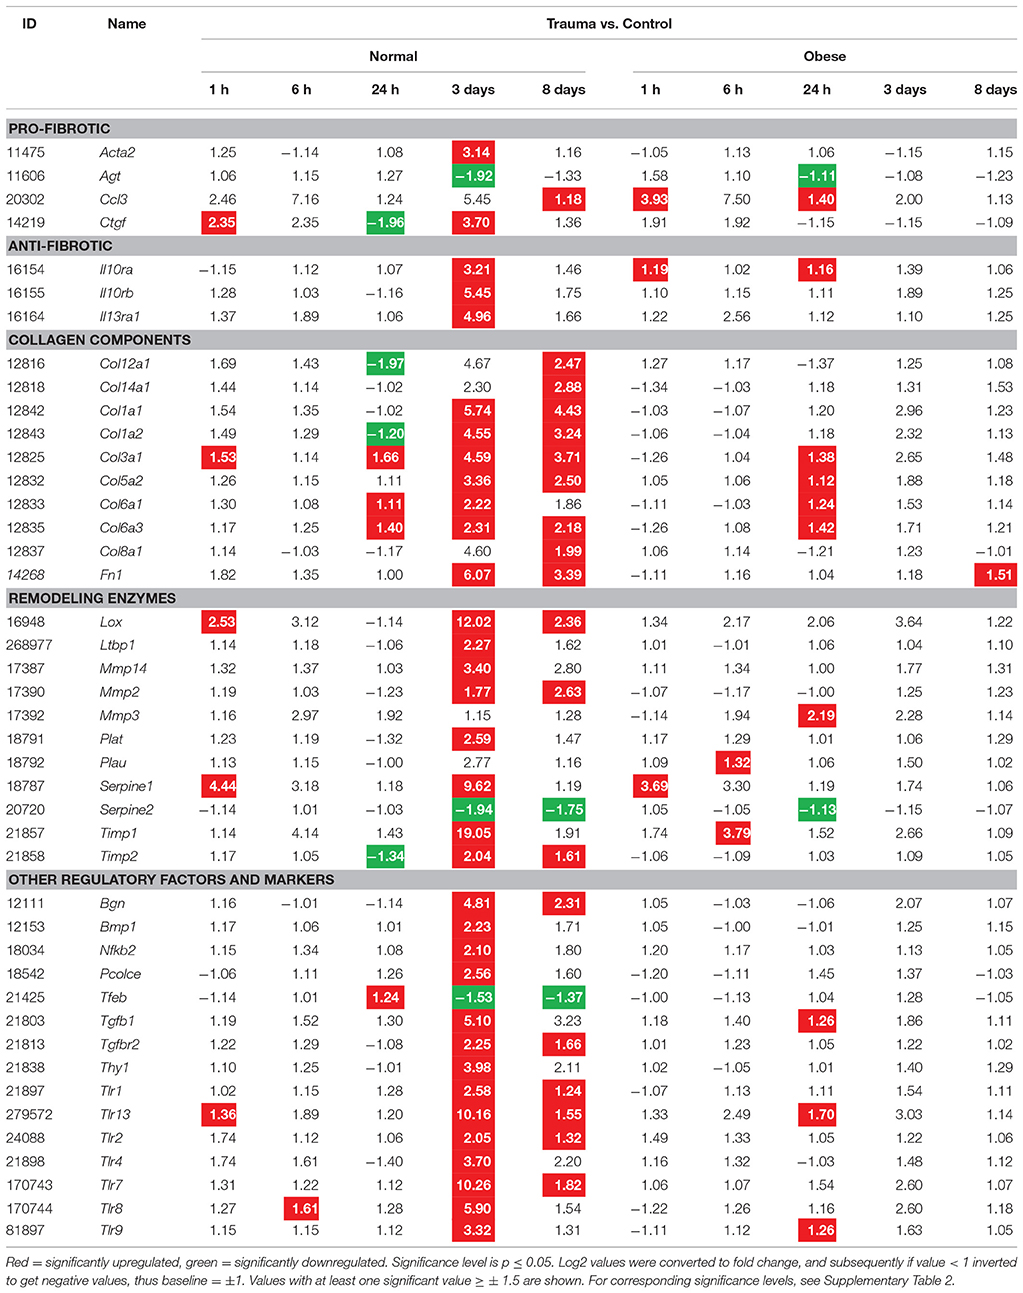
Table 2. Gene expression levels in fold change values determined by microarray analysis for fibrosis formation.
Gene Cluster Differences of Muscle Tissue in Normal Weight vs. Obese Mice After Muscle Trauma
While we first specifically focused on genes involved in fibrosis formation, an unbiased approach to determine genes with highest impact on muscle regeneration up to 8 days was applied. For this purpose, expression data of each time point (1 h to 8 days) per diet was normalized by Robust Multi-array Average for trauma vs. control animals, respectively, consequently allowing the compression of our data for time and diet, finally resulting in only one table (viewed as a heatmap) instead of 10 traditional heatmaps. Our results clearly revealed the influence of injury on our respective diet model. In order to assess DEG, p-values were determined at p ≤ 0.05. Hierarchical cluster analysis (HCA), principal component analysis (PCA), and volcano plots were calculated by their respective functions within our script for microarray evaluation.
HCA showed a clear distinction in the cluster dendrogram, in which the combination of data sets connected in a cluster can be exchanged with the next level for each time point. Sham and trauma groups within differently expressed genes for normal weight and obese mice can be clearly distinguished at all-time points in both, approximately unbiased, marked red, and bootstrap probability, marked green (Supplementary Figure 2). PCA also resulted in the separation of control and trauma mice in DEG over the treatment period for normal weight and obese mice, indicating that both groups are not related. The first principal component usually covered around 80% of all variables, while the second principal component had less influence of max. 5–6% (Supplementary Figure 3). Volcano plots were generated albeit considering a significance level of p ≤ 0.05 and a log fold change (lfc) of at least ±0.75 in a log2 scale. Overall data indicated that normal weight animals show higher numbers of genes being up- and downregulated at the analyzed time points. Examples were Serpine1 (1 h), Serpinb1a (24 h, 8 days), Ankrd1 (24 h), Ccr2 (3 days), Serp1 (3 days), and Slc37a4 (3 days) in muscle tissue of normal weight animals and Fosb (1 h), Egr1 (1 h), Lrrc32 (6 h), Ms4a4c (24 h), Mpeg1 (24 h), Fmod (24 h), Ostn (3 days), Myl (3 days), and Socs2 (8 days) in muscle tissue of obese animals. Interestingly, obese animals showed either a delay, or a complete lack of response, whereas normal weight mice showed a relative strong counter mechanism at 24 h and 3 days post-trauma (Supplementary Figure 4).
Reduction of the Quantitative Gene Response to Muscle Trauma in Obese Mice
Next, for comparative reasons, the total amount of DEG was counted for both, normal weight and obese mice at the indicated time points (Figure 4). Strikingly, with regard to the total amount of DEG, normal weight animals showed a defined response to injury peaking 3 days post-injury. However, obese animals lacked a distinct response to injury in our model, which was especially obvious 3 days post-injury where 3,096 genes in normal weight compared to 80 genes in obese mice were found. Overall, obese animals showed lower numbers of DEG at all-time points, thus clearly indicating a lack of response to trauma despite showing a distinct response in the tissue.
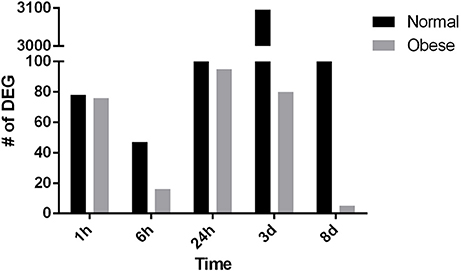
Figure 4. Differentially expressed genes in normal weight and obese mice respectively (p ≤ 0.05; fold change ≥ ± 1.5).
Minimal Overlap of Regulated Genes After Muscle Trauma in Obese vs. Normal Weight Mice
To assess the affiliation of genes to either the normal weight or obese group, the webtool from Ghent University Bioinformatics & Evolutionary Genomics to compare two groups (provided by VIB Ghent University, available at http://bioinformatics.psb.ugent.be/webtools/Venn/) was used for the preparation of Venn diagrams. The gene data analysis revealed that the total amount of DEG was generally higher in normal weight mice at all-time points, whereas obese animals showed less activity (Figure 5). Subgrouping of all genes revealed unexpectedly that only a few genes were shared between both models. Thus, obese animals lack a regular response to the blunt muscle injury of the extensor iliotibialis anticus.
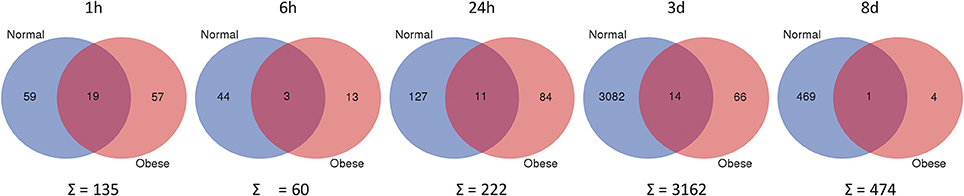
Figure 5. Differentially expressed genes, when comparing trauma vs. control (p ≤ 0.05; fold change ≥ ± 1.5) in normal weight and obese mice. Unique and shared genes with their total amount for each time point are shown. Blue = normal; Red = obese. Webtool from Ghent University Bioinformatics and Evolutionary Genomics.
Time Dependency of the Gene Expression Profile After Muscle Trauma in Obese vs. Normal Weight Mice Reflected by the Time Lapse Heatmap
Due to the complexity of our study design, a comparative time lapse heatmap was generated to normalize trauma to control animals for each time point in their corresponding diet. Consequently, expression levels of genes with at least three significant hits over time regardless of diet were summarized. Eighty-one DEG within these criteria had a stronger impact over the evaluated time frame. Especially 3 days post-injury, the analysis indicated the greatest influence on expression levels regarding regeneration in normal weight mice (Table 3).
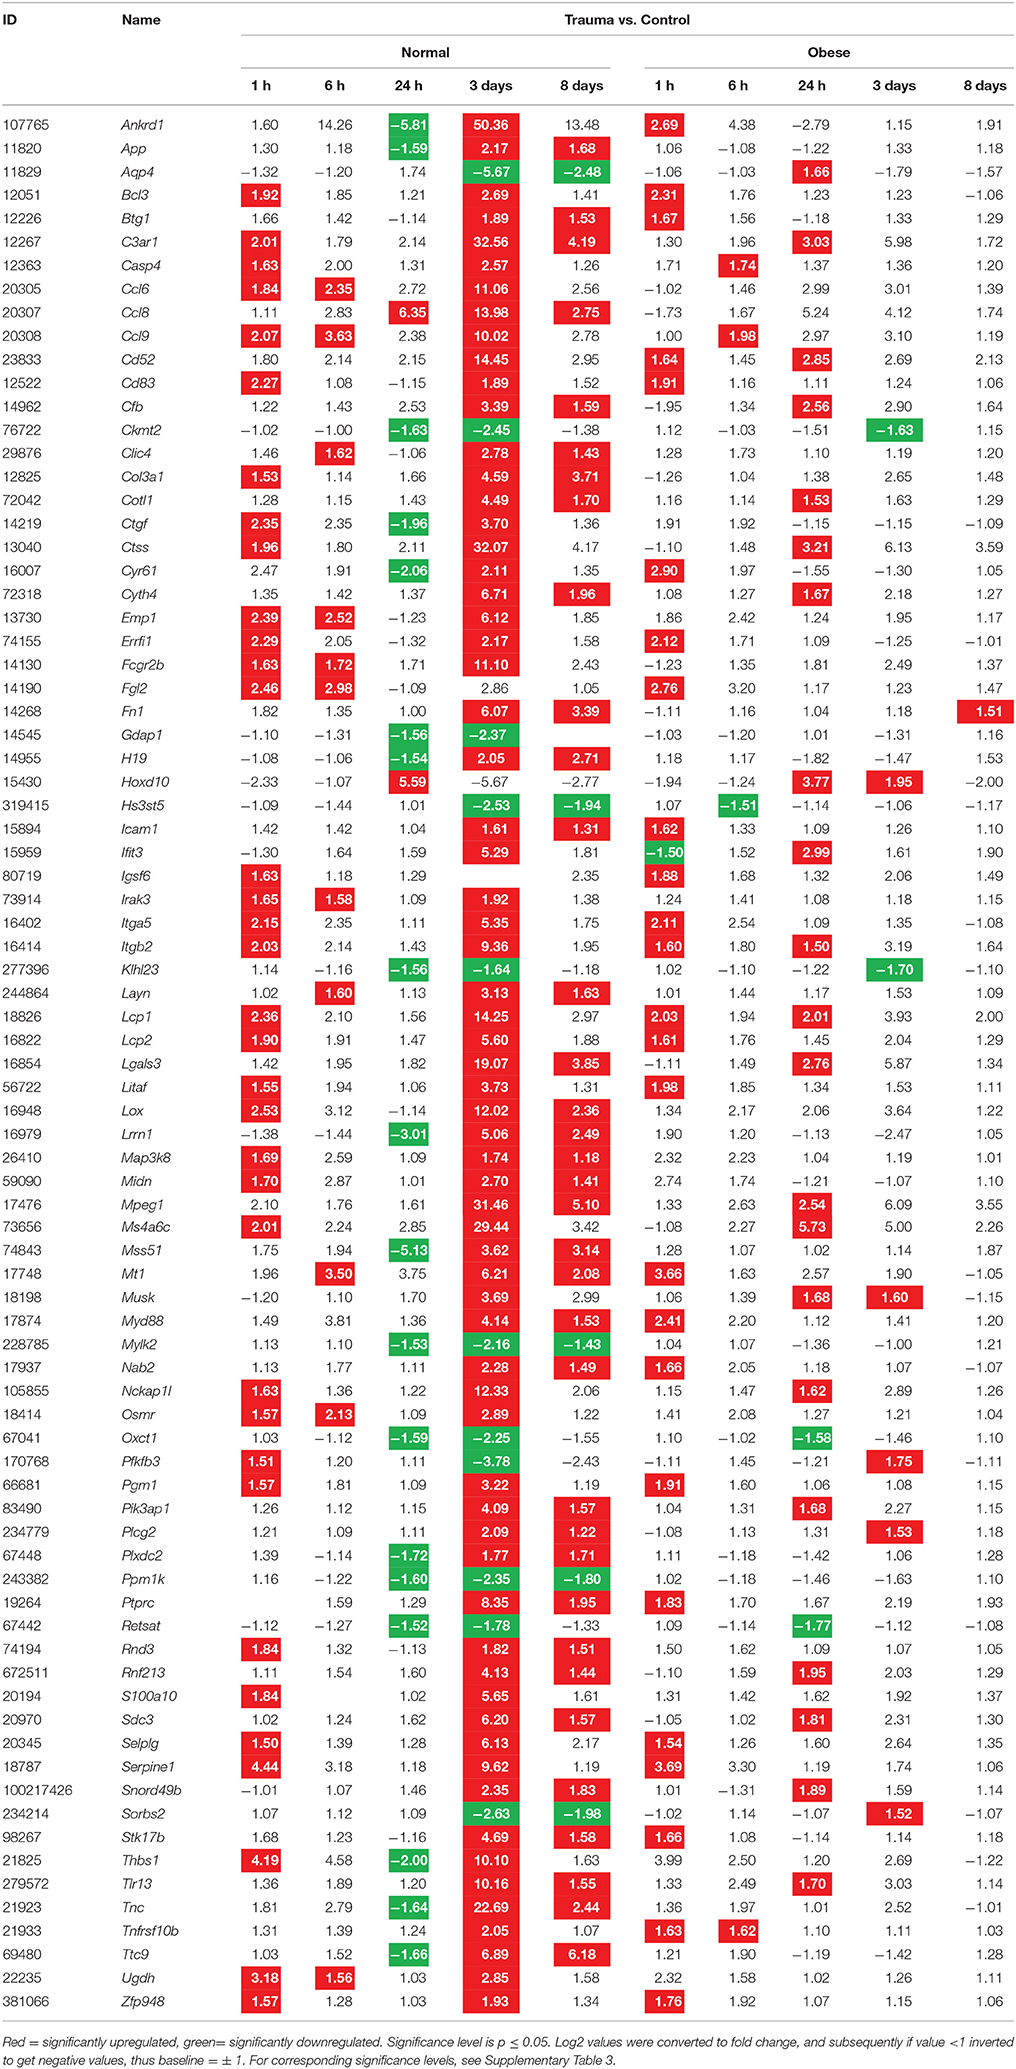
Table 3. Gene expression levels in fold change values determined by microarray analysis with at least three hits and a fold change ≥±1.5 over all time points independent of diet.
Gene Expression for Leukocyte Migration is Central After Muscle Trauma
All 81 DEG were used to perform a pathway analysis in order to determine their affiliation with GO terms. Some terms were grouped due to their association to a common superordinate term. Five terms in total were identified, namely myeloid leukocyte migration (16 hits; 69.57%), regulation of tumor necrosis factor production (3 hits; 13.04%), CD4-positive, alpha-beta T cell differentiation (2 hits; 8.70%), ECM organization (1 hit; 4.35%), and toll-like receptor (TLR) signaling pathway (1 hit; 4.35%) with high confidence and at least 3 matches to the database (Figure 6).
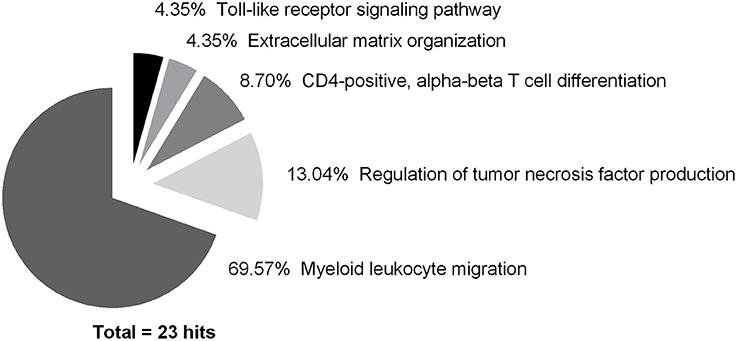
Figure 6. Pathway analysis of differentially expressed genes showing the highest impact over the whole course of time (hits ≥ 3; 23 in total). Data was analyzed using ClueGO (Bindea et al., 2009), a Cytoscape (Lotia et al., 2013) plugin designed by Bindea et al. (2009). Each association to an ontology was counted as one hit, regardless of gene quantity.
As the grouping of GO terms was necessary, the underlying captions were grouped into the next superordinate one (Table 4), which was due for CD4-positive, alpha-beta T cell differentiation, regulation of tumor necrosis factor production, and myeloid leukocyte migration.
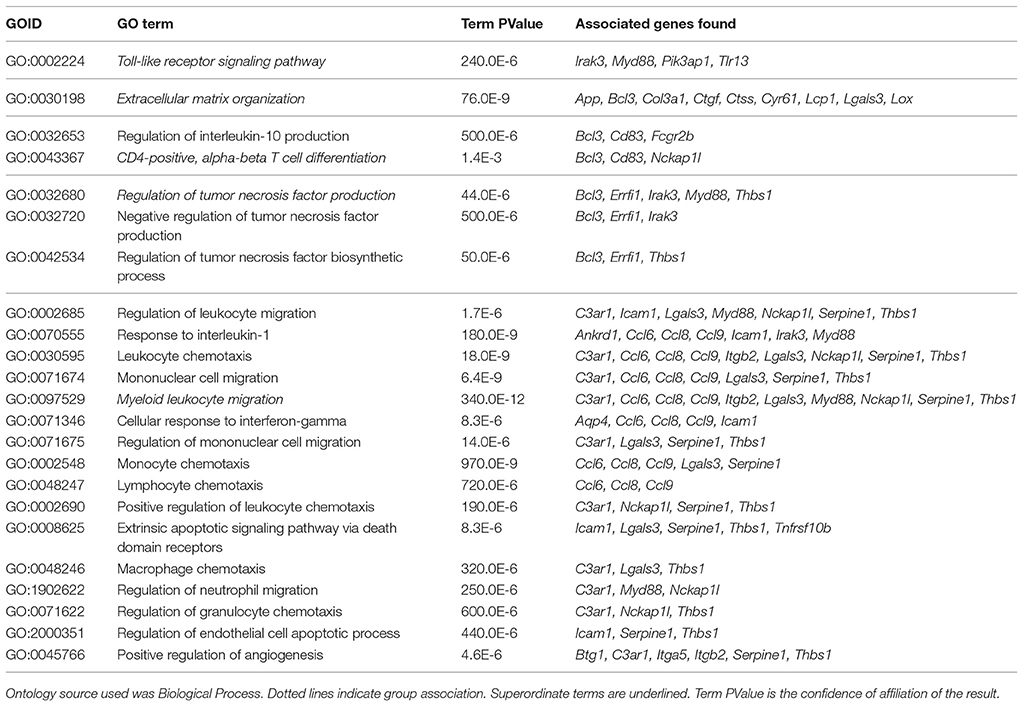
Table 4. Overview of GO terms found by ClueGO.
Differential Gene Expression Profiles After Muscle Trauma Between Obese and Normal Weight Mice
The pathway analysis revealed several genes of interest, among them Ankrd1, App, Aqp4, Bcl3, Btg1, C3ar1, Ccl6, Ccl8, Ccl9, Cd83, Col3a1, Ctgf, Ctss, Cyr61, Errfi1, Fcgr2b, Icam1, Irak3, Itga5, Itgb2, Lcp1, Lgals3, Lox, Myd88, Nckap1l, Pik3ap1, Serpine1, Thbs1, and Tlr13. These genes were evaluated to detect differences in expression levels between the comprised data of normal weight and obese mice (Table 3).
Evaluation of the time lapse heatmap data indicated that several genes are associated with the TLR signaling pathway, namely Irak3, Myd88, Pik3ap1, and Tlr13. While these genes show upregulation in muscle tissue from normal weight mice (except Irak3), obese animals show a comparably lower response to injury. Myd88 is strikingly upregulated 6 h and 3 days post-injury in normal weight mice. Tlr13 is not involved in the early response to injury. However, it shows a considerable increase 3 days after trauma in the injured muscle of normal weight animals. In summary, TLR signaling is regularly functioning in normal weight animals while obese mice are hampered in response. ECM is influenced by App, Bcl3, Col3a1, Ctgf, Ctss, Cyr61, Lcp1, Lgals3, and Lox, which were at least partially changed. Overall, both groups show a similar behavior of these genes at all-time points with an exception at day 3. Here, normal weight mice have a more or less markedly increase in gene expression levels, up to 30-fold (Ctss), which is indicative that ECM organization was impaired in obese animals due to their overall lack in response. CD4-positive, alpha-beta T cell differentiation is mediated by Bcl3, Cd83, Nckap1l, and shows a similar reduction in obese mice. Responses in normal weight animals are stronger when compared to obese mice. Whereas, Bcl3 and Cd83 do not show a strong reaction upon injury in general, Nckap1l is increased 12-fold 3 days post-injury. Thus, CD4-positive T cell differentiation seems to be mostly impaired by a lack of Nckap1l response. Bcl3, Errfi1, Irak3, Myd88, and Thbs1 are involved in the regulation of tumor necrosis factor production and show similar curvatures for normal weight and obese animals, with the exception of 3 days post-injury and Myd88 in general. Overall, activity is also higher in normal weight animals, suggesting a dysfunctional TNF production cycle in obese individuals. The GO term myeloid leukocyte migration includes the following gene associations: Ankrd1, Aqp4, Btg1, C3ar1, Ccl6, Ccl8, Ccl9, Icam1, Irak3, Itga5, Itgb2, Lgals3, Myd88, Nckap1l, Serpine1, Thbs1, and Tnfrsf10b. In general, data from injured and non-injured muscle tissue from normal weight and obese mice showed similar curvatures, while three days usually marks a major change for obese animals due to a lack of response. Most genes (Ankrd1, C3ar1, Ccl6, Ccl8, Ccl9, Itga5, Itgb2, Lgals3, Myd88, Nckap1l, Serpine1, and Thbs1) show a strong increase in gene expression at this time point, making it a vital variable for the orchestration of leukocyte migration to the site of injury. Although obese animals do show a response to injury in some chemokines (Ccl6, Ccl8, and Ccl9), integrin (Itgb2), and galectin (Lgals3), a proper function in terms of mediating their effects to attract and bind immune cells is impaired.
Due to the presence of several complement-related genes within our 81 DEG with major impact on muscle regeneration, we also focused on corresponding factors related to this pathway (Table 5). Here, we found C1, C3, and C5-associated genes as well as Cfb and F13a1 to be differentially expressed. The complement system is involved in the clearance of tissue debris among other and shows a limited response for obese mice when compared to the normal weight group. It is still active especially after 3 and 8 days post-injury, while the alternative (Cfb) and classical pathway (C1) are switched on. IHC analyses of C3ar and C5ar confirmed a stronger impact of C3ar in normal weight animals when compared to obese (Figure 7A), with 3 days showing the highest intensity during muscle regeneration, localized in the damaged area within the muscle. Similarly, despite exhibiting lower expression levels, C5ar showed a partially increased signal in the damaged muscle tissue (Figure 7B). Here, intensity levels slightly increase between 24 h and 3 days in both groups, also indicating that obesity hampers the C5ar expression.
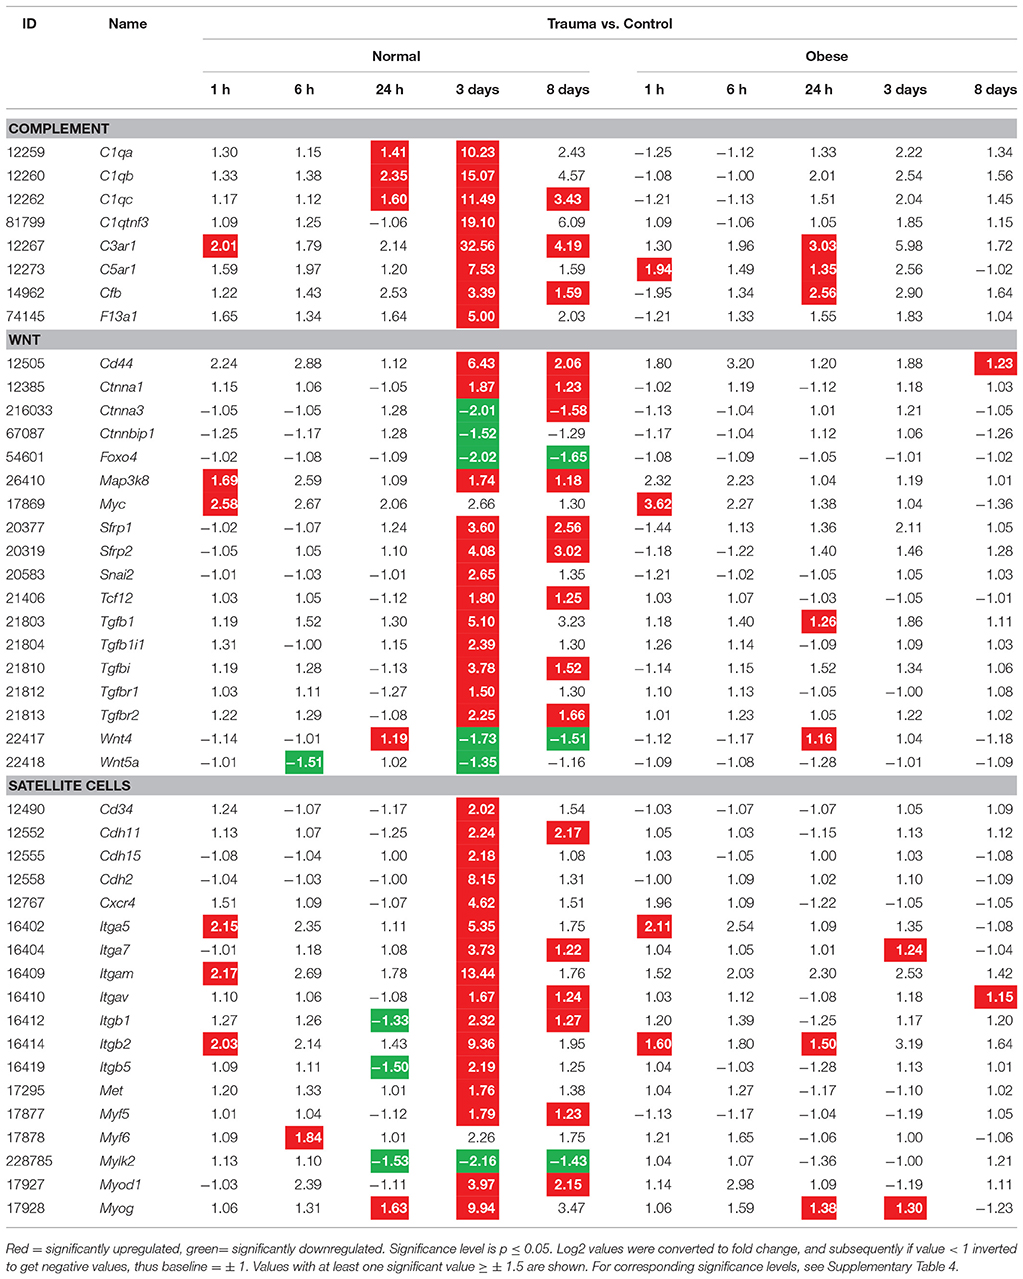
Table 5. Gene expression levels in fold change values determined by microarray analysis for complement, Wnt and satellite cells.
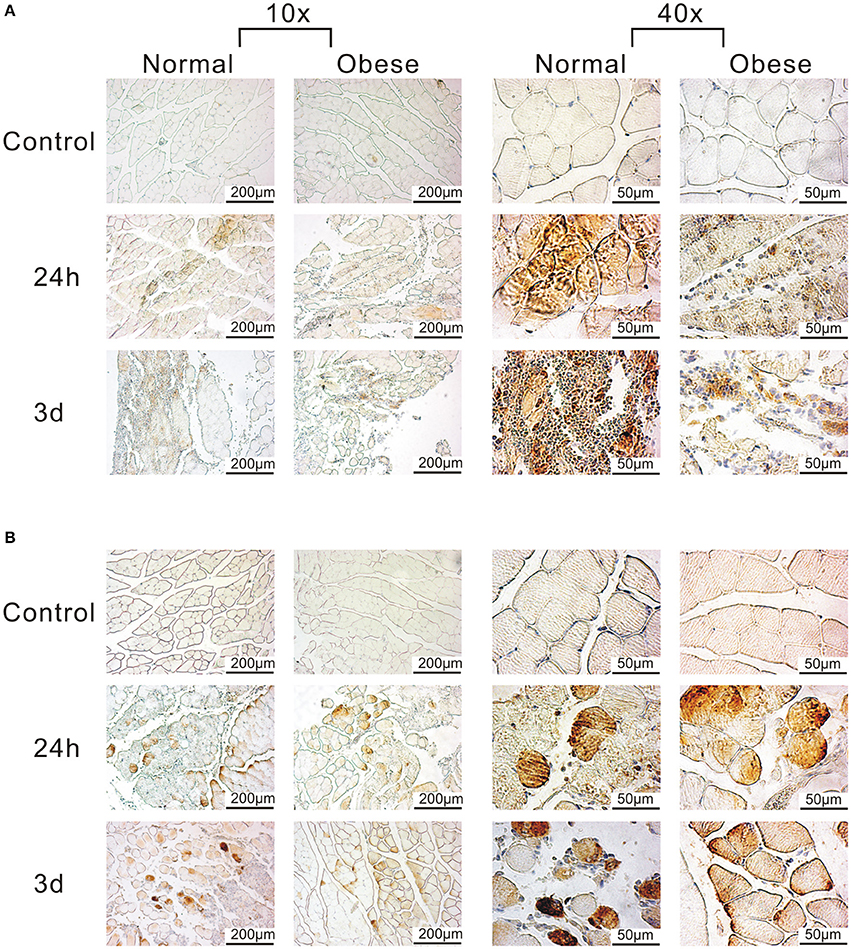
Figure 7. Detection of C3ar and C5ar in muscle tissue of normal weight and obese mice by IHC. (A) Anti-C3ar-labeled muscle shows stronger signals for normal weight when compared to obese. (B) Anti-C5ar-labeled muscle shows a partially increased signal, and slightly increases over time, also indicating the negative role of obesity. Pictures were taken with Olympus IX81 using Xcellence v.1.2. Scale = 200 μm at 10x magnification; Scale = 50 μm at 40x magnification.
As several pathways and genes for the clearance of tissue debris and immune response were found, a priority was also made for pathways involved in the proliferation and differentiation of cells. In this regard, we assessed the Wnt-pathway, responsible for the symmetric expansion of satellite cells and is required for the differentiation of its progenitors, and satellite cell-related genes (Table 5). Wnt-related genes (Cd44, Ctnna1, Ctnna3, Ctnnbip1, Foxo4, Map3k8, Myc, Sfrp1, Sfrp2, Snai2, Tcf12, Tgfb1, Tgfb1i1, Tgfbi, Tgfbr1, and Tgfbr2) were also changed upon injury for normal weight mice, but with no significant changes in the obese group.
Satellite cells are crucial key players in muscle regeneration due to their active role in forming new myofibers (Table 5). Here, Cd34, Cdh11, Cdh15, Cdh2, Cxcr4, Itga5, Itga7, Itgam, Itgav, Itgb1, Itgb2, Itgb5, Met, Myf5, Myf6, Mylk2, Myod1, and Myog were found to be altered. In general, satellite cell-related genes were changed upon injury in normal weight mice, whereas obese animals clearly lack a distinct response to the same injury impact.
Differences in Satellite Cell Numbers and Validation of Gene Expression
In order to validate the previous findings, we used IHC and qPCR analysis to affirm the presence of Pax7+ cells and the expression levels of Ankrd1, C3ar1, Mpeg1, Ccl8, and Myog.
Upon evaluation of the satellite cell populations within the muscle tissue of sham and injured normal weight and obese C57BL/6J mice in histological stainings (Figure 8A), we observed notable differences. While normal weight animals exhibited higher numbers of satellite cells per mm2 altogether within controls, 3 and 8 days showed significantly higher results. Also, 3 days seems to confirm to be a crucial turning point for Pax7-positive cells (Figure 8B). In comparison, obese animals lack this strong increase of satellite cell numbers and stick relatively close to basal levels. Interestingly, both groups showed higher numbers at 21 days, possibly indicating the renewal of the stem cell pool.
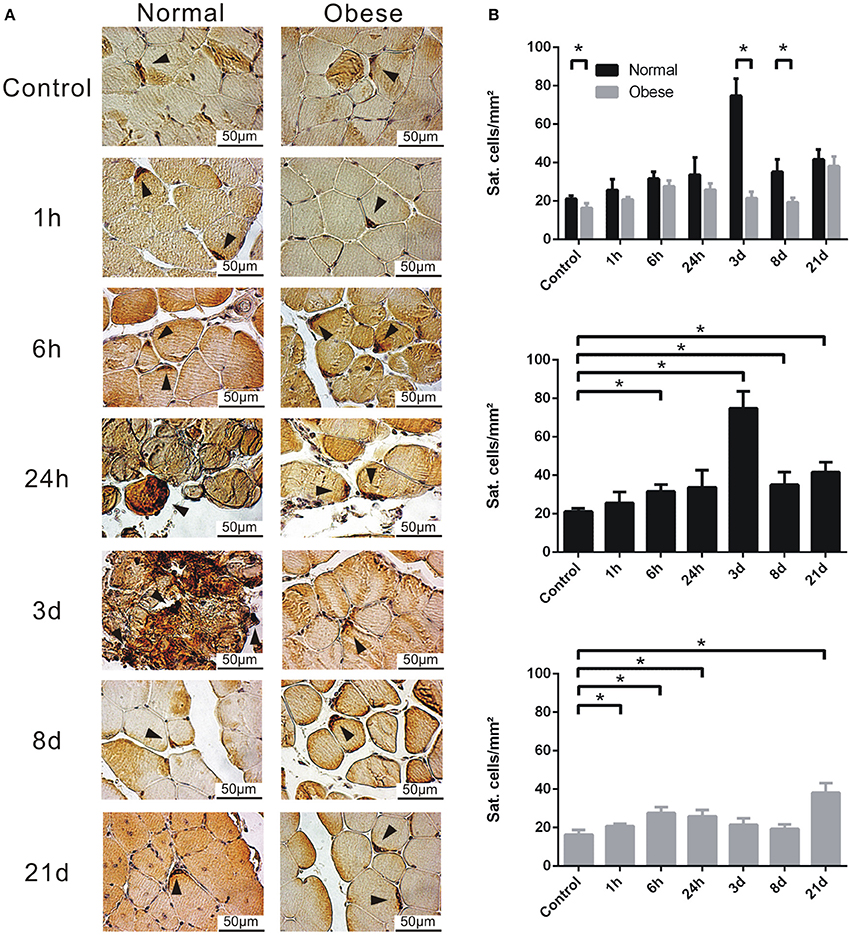
Figure 8. Determination of Pax7-positive satellite cells by IHC. (A) Tissue sections of female normal weight and obese C57BL/6J mice, labeled with anti-Pax7, and stained with DAB. Triangle = satellite cell. Pictures were taken with Olympus IX81 using Xcellence v.1.2. Scale = 50 μm at 40x magnification. (B) Calculated satellite cells per mm2. Six animals per time point à three sections per animal were independently counted by three researchers, averaged and depicted. Black = normal weight; Gray = obese. Statistical analysis by homoscedastic two-sided t-test. *Indicates p ≤ 0.05.
In order to reaffirm the expression levels of several genes, including Ankrd1, C3ar1, Mpeg1, Ccl8, and Myog, qPCR were performed. Here, gene expression levels detected in our microarray analysis could be confirmed. Similarly, although upregulated, the endpoint marker of differentiation Myog was significantly altered 3 days post-injury, while it shows similar but non-significant levels after day 8 (Figure 9).
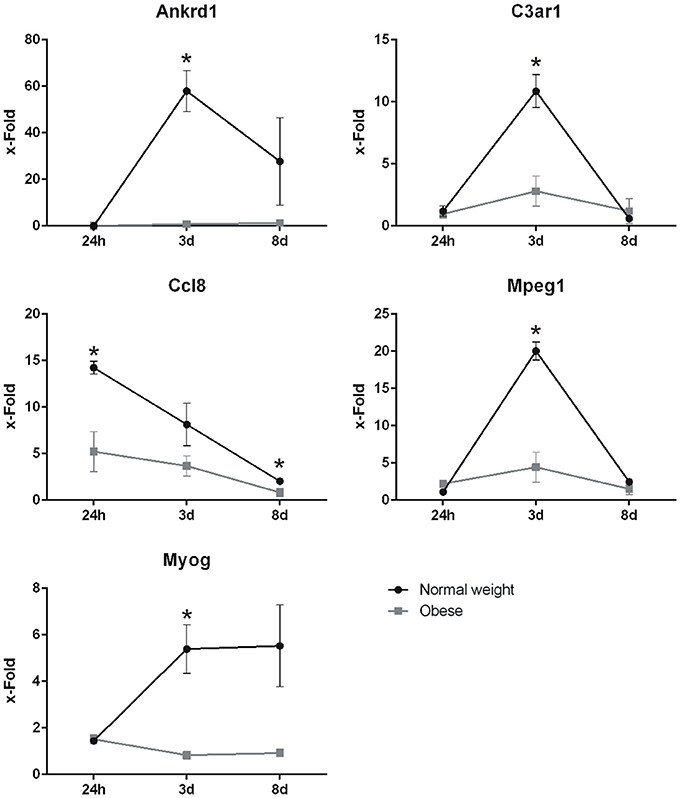
Figure 9. Expression levels of Ankrd1, C3ar1, Ccl8, Mpeg1, and Myog determined by qPCR on Ppia as housekeeper. X-fold values ±SEM were determined by normalization on corresponding controls of each time point and diet. Statistical analysis by two-sided homoscedastic t-test. *Indicates p ≤ 0.05, n = 3.
Discussion
Obesity, characterized by dysfunctional and excessive adipose tissue and a chronic low-grade inflammation, is associated with severe co-morbidities that affect cell metabolism (Upadhyay et al., 2018). The accompanied metabolic changes, increased levels of adipocytokines and lipid metabolites seem to impair muscle regeneration by altering the interplay of several cell populations, such as the interaction of satellite cells with MΦ. Consequently, the rebuilding of smaller myofibrils, increased interstitial spaces, higher amounts of collagen deposition, a reduction in the amount, and regenerative ability of satellite cells were observed (Langen et al., 2006; Tilg and Moschen, 2008; Gregor and Hotamisligil, 2011; Ouchi and Walsh, 2012; Adamczak and Wiecek, 2013; Akhmedov and Berdeaux, 2013; Makki et al., 2013; Cao, 2014; D'Souza et al., 2015; Caslin et al., 2016; Hardy et al., 2016; Liu et al., 2016; Chapman et al., 2017; Sinha-Hikim et al., 2017).
In this study, we first analyzed the effects of diet-induced obesity (DIO) on muscle regeneration and fibrosis formation in the skeletal muscle of C57BL/6J mice after injury. Since there is evidence that early lifetime nutrition has an influence on the regeneration ability (Woo et al., 2011), parental mice already received a HFD at least 1 week before breading. DIO resulted in a statistically significant increase in body weight as described earlier (Lai et al., 2014). Consequently, the non-invasive animal model of blunt crush muscle injury in normal weight and DIO mice which is based on a drop tower approach resulted in muscle damage in all mice and was verified by MRI and morphological analyses.
Muscle damage was assessed in the T2-weighted MRI images, in which a clear contrast between the edema in the injured (hyperintense signal) and healthy muscle was observed. In injured muscles of both, normal weight and obese mice, edema and hemorrhage was already seen 1 h after injury, indicated by a high T2W-RARE signal for edema and a low T2W-RARE signal for hemorrhage. Whereas, edema was visible until 3 days post-trauma in the injured muscle tissue of the normal weight mouse, the edema in the injured muscle of the obese mouse is still observed 8 days after injury, pointing to a delay in edema elimination. However, results of other studies revealed that the peak of edema depends on the kind and degree of injury applied through the injury model and is usually visible between 7 h up to 2 days after injury (Mattila et al., 1995; Wishnia et al., 2001). In addition, changes in the T2 signal might not exclusively be due to inflammation, and water and fat content, but might also depend on intrinsic cellular features, among them composition of the cell membrane and its degree of disruption, as well as on disease-induced changes, like the development of a metabolic syndrome (Dunn and Zaim-Wadghiri, 1999; McMillan et al., 2011; Miller and Toth, 2013; Pratt et al., 2013; Acevedo et al., 2017). Since our results did not show statistically significant differences of force input into the muscle tissue of normal and obese mice by our drop-toper based trauma model, it seems that obesity-based physiological changes as well as changes in the composition of the cell membrane of muscle cells of obese mice might contribute to the late T2 peak in obese muscle tissue. This assumption is underlined by our data, which indicate obesity-associated as well as trauma-induced changes in fatty acid composition in muscle tissue of obese mice in comparison to normal weight mice (Werner et al., 2018).
Within the first 24 h after trauma induction, infiltration of immune cells, bloating of myofibers, and necrotic processes were observed. Furthermore, a delay in fluid retention and a large amount of fibrous tissue were observed in skeletal muscle of obese mice. These findings are in line with data obtained from other physical muscle injury models (Akhmedov and Berdeaux, 2013; D'Souza et al., 2015; Hardy et al., 2016). To explain the high degree of fibrosis in obese mice, microarray analysis was performed to detect changes in the expression levels of genes involved in ECM remodeling, among them collagens, fibronectin, elastin, proteoglycans, and laminin. We identified several significant differences in the expression levels of genes involved in ECM organization, among them App, Bcl3, Col3a1, Ctgf, Ctss, Cyr61, Lcp1, Lgals3, and Lox. Obese mice usually showed lower expression levels and lower numbers of ECM-associated cells, a stiffer and excessive ECM with an impaired signaling cascade when compared to normal weight individuals, whereas nutritional cues present in obesity are also of note due to their influence on increased free fatty acids (Garg et al., 2015; Lin et al., 2016; Chapman et al., 2017; Werner et al., 2018). However, as changes in ECM organization occur, infiltration of immune cells and clearance of tissue debris becomes problematic, thus leading to a hampered response in obese individuals (Mann et al., 2011; Akhmedov and Berdeaux, 2013; Urciuolo et al., 2013; Garg et al., 2015; Sziksz et al., 2015; Darby et al., 2016; Lin et al., 2016). Similarly, our analysis also revealed increased amounts of fibrous tissue in the muscle of obese animals. In contrast to the elevated fibrosis, we also observed a down-regulation of ECM-related gene expression levels responsible for degradation, which is in line with lower numbers of cells responsible for ECM organization in obese mice (Akhmedov and Berdeaux, 2013; Urciuolo et al., 2013).
Further detailed analysis of our previous published microarray data (Werner et al., 2018) of skeletal muscle after blunt trauma induction in normal weight and obese C57BL/6J mice over 8 days clearly revealed that normal weight animals showed a significant response to injury, resulting in a peak of alterations in expression levels 3 days post-injury, whereas regeneration in obese animals was impaired, seen in the much lower number of total DEG. Overall, 81 DEG were identified with at least three significant hits in all time points, thus revealing the most striking candidates regarding muscle regeneration. Additionally, it led to the detection of genes with non-significant changes with high values, among them Ankrd (6 h and 8 days; normal), C3ar1 (3 days; obese), Mpeg1 (3 days; obese), and Ccl8 (24 h and 3 days; obese).
Pathway analysis revealed the association of our 81 DEG in TLR signaling, ECM organization, CD4-positive, alpha-beta T cell differentiation, regulation of tumor necrosis factor production, and myeloid leukocyte migration with high confidence and at least three matches to the database.
Within the TLR pathway, we identified genes involved in the pro-inflammatory MΦ mediated response (Myd88, Pik3ap1), or in weakening the pro-inflammatory response (Irak3) (GeneCards, 2017a,b,c). Whereas, Myd88 showed an immediate response to injury within 6 h post-injury, Irak3 expression levels were less altered in general. TLRs have been shown to play a major role in innate immunity and are involved in regulating muscle regeneration in response to traumatic injury (Tidball and Villalta, 2010; Tidball et al., 2014). In this context, TLR2 deficiency resulted in a reduction of the number of MΦ in injured muscles, leading to delayed clearance of necrotic tissue and an impaired reconstruction of muscle structure (Mojumdar et al., 2016). The connection of TLR4 and lipid metabolism makes TLR4 a potential target to control adipose tissue inflammation and insulin resistance in obesity (Phieler et al., 2013). Interestingly, TLR4 gene expression and protein levels seem to be significantly upregulated in T2DM, eventually leading to insulin resistance. This correlates to abnormal TLR4 expression found in obese individuals, likely caused by increased free fatty acid levels which boost the likelihood of insulin resistance (Könner and Br üning, 2011). Particularly sphingolipid ceramides, derived from saturated fatty acids, are linked to metabolic stress by excessive nutrient availability and inflammatory cytokines to insulin resistance (Summers and Nelson, 2005).
CD4 is a surface marker for lineage committed T-cells that mature toward specialized features required for cell processes (Burzyn et al., 2013; Yui and Rothenberg, 2014). Four genes (Bcl3, Cd83, Fcgr2b, and Nckap1l) associated with this term were found and exhibited lower expression levels in muscle tissue of obese mice when compared to those of normal weight mice. Although CD83 did not show distinct changes between both groups, major alterations were noticeable 3 days post-injury. Especially Fcgr2b and Nckap1l show a marked increase in normal weight mice, indicating a higher incidence for clearance of debris by immune cells. T-cells play a role of in the development of insulin resistance in obesity (Bornstein et al., 2000; Catalán et al., 2013). They are involved in pro-inflammatory cytokine production of monocytes and MΦ, which remove tissue debris in the initial degenerative phase after injury (Burzyn et al., 2013; Makki et al., 2013).
T-cells, most notably Treg, can prime other immune cells, and also exhibit various functions related to the regulation of body weight, insulin-resistance and glucose tolerance (Sakaguchi et al., 2008; Winer et al., 2009; Catalán et al., 2013; Chapman and Chi, 2017; Cinkajzlová et al., 2017). This subpopulation declines in obesity, while various negative immune cell-related effects arise (Catalán et al., 2013). We detected only little activity within this pathway within our obese model, indicating that obesity exhibits a deregulated T-cell response, which potentially further enhances the aberrant muscle regeneration (Chapman and Chi, 2017; Mauro et al., 2017). However, further studies focusing on this pathway are necessary to conclude our assumptions.
Closely linked to T-cell functions is the regulation of tumor necrosis factor (TNF) production, (AmiGO, 2017). Surprisingly, we did not detect any major effect of injury and obesity on the expression levels of TNF or the associated genes Bcl3, Errfi1, Irak3, Myd88, and Thbs1 in our obese model. Usually, TNF is increased in obese individuals due to chronic low grade inflammation, with a major impact on muscle regeneration following injury due to its effects on inflammatory responses by recruiting and modulating MΦ populations (Gregor and Hotamisligil, 2011; Akhmedov and Berdeaux, 2013; Tateya et al., 2013; Sinha et al., 2017). As T-cells are able to regulate the response of other (TNF-producing) immune cells, a lack in modification and the subsequent recognition and removal of tissue debris results in a delay of muscle regeneration (Akhmedov and Berdeaux, 2013; Catalán et al., 2013; D'Souza et al., 2015; Chapman and Chi, 2017; Sinha et al., 2017). Additionally, TNF-α is a pro-inflammatory cytokine that is closely tied to the pathogenesis of obesity and insulin-resistance. Whereas, this pathway seems to be dysfunctional due to lack of activity in our obese model, a compensatory upregulation of other cytokines and co-morbidities were described previously (Jung and Choi, 2014).
We found several genes associated with the pathway myeloid leukocyte migration, namely Ankrd1, Aqp4, Btg1, C3ar1, Ccl6, Ccl8, Ccl9, Icam1, Irak3, Itga5, Itgb2, Lgals3, Myd88, Nckap1l, Serpine1, Thbs1, Tnfrsf10b, which are involved in cell-adhesion and immune cell recruitment and retention. These genes exhibit stronger changes in normal weight mice, while our obese animals only showed a limited response. Manicone et al. described several factors of obesity on, but not limited to, (myeloid) leukocyte migration (Manicone et al., 2016). Although they focused on pulmonary immune cells, a correlation to skeletal muscle by predominant populations of M1Φ, leukocytes, and neutrophils is commonly recognized (Tidball and Villalta, 2010; Pillon et al., 2013; Manicone et al., 2016). As T-cells are involved in recruiting, maintaining and altering immune cell populations, a close link can be made between this pathway and CD4-related mechanisms (Catalán et al., 2013; Chapman and Chi, 2017). Notably, Ankrd1 and Ccl8 expression levels were confirmed by our qPCR data supporting the involvement of cell-adhesion and immune cell recruitment during the evaluated time points. Macrophage expressed gene 1 (Mpeg1) although not listed above, was also strongly increased as shown by our qPCR results most notably 3 days post-injury, derived from the peak inflammatory response of immune cells to trauma.
Another striking feature of our study is the lack of activity in several genes associated to the complement system in our obese model, namely C1qa, C1qb, C1qc, C1qtnf3, C3ar1, C5ar1, Cfb, and F13a1 (see Table 4). C3aR and C5aR are involved in the development of insulin resistance in adipocytes by MΦ infiltration, while the complement system is generally needed for sensing, opsonization, and removal of tissue debris after trauma (Phieler et al., 2013; Vlaicu et al., 2016). Here, we see both, upregulation of genes in the classical (C1) and the alternative complement pathway (C3) in response to trauma, notably 3 days post-injury in normal weight mice. In contrast, genes for the classical pathway were not altered in obese animals after trauma, although obesity has been described to lead to an exaggerated activation of the classical pathway (Vlaicu et al., 2016). Although complement activation is not equal to expression levels of genes, we observed a stronger activation of genes in the alternative pathway. Here, we could show that C3ar signal intensity was increased in tissue sections of normal weight animals when compared to obese, as well as the expression levels of C3ar1 in our qPCR data. Phieler et al. described the involvement of C5ar in MΦ accumulation and M1Φ polarization in obese adipose tissue (Phieler et al., 2014). Although C5ar expression was barely altered in the muscle tissue of obese animals, enhanced C5a levels after trauma may still signal via the remaining C5ar on muscle cells (Burk et al., 2012). Similarly as described for C3ar, IHC staining revealed partially increased signal intensities of C5ar in normal weight animals compared to obese animals. As a limitation of the study, the gene screening approach was not extended to the protein and functional level. Summarizing, the removal of tissue debris and the function of the complement system seems to be hampered within our obesity model, making it unable to properly react to the stimulus.
Changes in gene expression were also detected in the Wnt-pathway among them especially frizzled-related genes, which were elevated 3 and 8 days post-injury in normal weight animals only. Whereas, we did not detect major alterations in gene expression levels for the β-catenin destruction complex, we noticed changes in Wnt proteins (Wnt1-16). However, none of those genes were upregulated greater than 2-fold, while only two (Wnt4 and Wnt5a) met our criteria of ≥ ± 1.5-fold difference in regulation. This indicates a severe impact on cell maintenance for obese animals, as they showed only little and unspecific signs of Wnt expression. The downstream targets of Wnt CD44, Myc, and Foxo4 were significantly changed, thus promoting Wnt signaling dependent growth and differentiation (Tortelote et al., 2017). Both, obese and normal weight mice show an upregulation of Myc as an immediate response to injury, potentially promoting the proliferation of resident cells, while later on, CD44 is up- and Foxo4 down-regulated in normal weight mice. Obese animals lack this response in expression. In general, Wnt proteins are commonly associated with the regulation of cell proliferation, differentiation, and migration. β-catenin, a major player within Wnt, is subjected to a permanent turnover by a destruction complex functioning as an “on/off” switch (Guo and Wang, 2009; Tortelote et al., 2017). Wnt5a is associated with the non-canonical pathway in Wnt signaling, controlling intracellular calcium levels. Despite recent findings from Tang et al. we did not find any distinct changes in the upregulation of Wnt5a which is supposed to correlate with early-onset obesity (Tang et al., 2018). Fuster et al. described Wnt5a as a gene closely correlated with obesity-related metabolic dysfunction by promoting insulin resistance via augmentation of tissue inflammation (Fuster et al., 2015). In addition, the Wnt- and TGF-pathways are closely intertwined on several molecular levels. TGF and Wnt reciprocally regulate their ligand production, hence establish a gradient within the extracellular space and also cross-talk within the nucleus (please note: this interaction is not limited to Wnt signaling, but also involves Hh, Notch, IL, and IFNγ) (Guo and Wang, 2009).
Satellite cells are under direct influence of Wnt and recognized as major players in muscle regeneration upon injury. A stimulus such as a mechanical injury recruits neutrophils and activates the stem cells resident in the muscle (Shi and Garry, 2006; Yin et al., 2013; D'Souza et al., 2015). These cells migrate toward the site of injury and start proliferating, partially losing their stem cell character (myoblasts) as they strive toward differentiation to form myotubes. This process can be assessed by several myogenic regulatory factors (MRFs), like Pax7, Myf5, MyoD, and MyoG. During the differentiation program, myoblasts fuse to form multinucleated myofibers, which bundle together to rebuild healthy and functional muscle tissue (Shi and Garry, 2006; Keire et al., 2013; Yin et al., 2013; Rocheteau et al., 2015). Although this process is much more complex, we assessed two major classes of genes relevant for satellite cells in muscle regeneration: Adherence (cadherins and integrins) and MRFs. We found cadherins to be significantly upregulated 3 days post-injury in normal weight mice. Integrins showed similar behavior, while Itga5, Itgam, and Itgb2 were activated within 1 h post-injury, potentially advocating for the recruitment of immune cells. Interestingly, Itga5 and Itgb2 were upregulated within 1 h for obese animals but did not show a response to injury at later time points. Myod1 and Myog were notably altered in normal weight mice. Both genes are known as an endpoint of differentiation (Chargé and Rudnicki, 2004; Kim et al., 2013; Yin et al., 2013; D'Souza et al., 2015). Myf5, a marker for early satellite cell commitment toward proliferation, only showed little yet significant upregulation. Pax7, the unique marker for quiescent and activated satellite cells, did not show any changes. Although we expected changes within this marker in our model, the expression threshold of Pax7 was likely lost due to background noise derived from the low cell count in tissue, previously described at 550 sat. cells on 1 mg muscle tissue (Bentzinger et al., 2012). However, to circumvent this issue, we analyzed total satellite cell numbers per mm2 in tissue sections by IHC. Here, total numbers were lower in obese mice, showing a significant decrease for control, at 3 and 8 days post-injury when compared to normal weight. Our findings support previously published results, although the total numbers per time point are lower in comparison (Murphy et al., 2011). While comparing different approaches of injuries, Hardy and coworkers showed that a mechanical approach (here: freezing) led to the overall lowest numbers of satellite cells (Hardy et al., 2016). In addition, 3 days post-injury is probably a major tipping point for polarization of M1Φ to M2Φ, likely a link to the promotion of proliferation from M1Φ to the increase in differentiation promoted by M2Φ (Kharraz et al., 2013; Saclier et al., 2013). This notion is supported by the increased expression of Myod, and especially Myog, the terminal marker of differentiation seen in our microarray and confirmed by qPCR analysis.
Summarizing, we suggest that normal weight animals show a distinct and differentiated response to injury by the interaction of immune cells with satellite cells to start the proliferation and differentiation procedure. In contrast, the obese animals did show some signs of activity within integrins, but almost completely lacked a response for cadherins and MRFs, thus not eliciting the proper recruitment of necessary immune cells and impairing the satellite cell proliferation and differentiation.
Conclusion
We used a drop tower unit to induce an indirect blunt muscle injury to extensor iliotibialis anticus in female normal weight and obese C57BL/6J mice, thereby not finding any significant differences in force input into the muscle between both groups. MRI and HE-staining confirmed morphological changes derived from the injury, while Sirius Red staining and targeted gene expression analysis of our microarray data revealed altered ECM organization and increased fibrosis formation in obese mice. In general, we further assessed genome-wide gene expression by an unbiased analysis of our microarray data (Werner et al., 2018) and confirmed that obesity hampers the regeneration process. Furthermore, our results showed a distinct and differentiated response to injury for normal weight animals, while obese mice had an overall lower amount of total DEG in all time points. We found 81 DEG in both groups to be significantly changed in at least three time points, by using a time-lapse heatmap. Pathway analysis showed these genes to be involved in myeloid leukocyte migration, regulation of tumor necrosis factor production, CD4-positive, alpha-beta T cell differentiation, ECM organization, and TLR signaling with high confidence. Interestingly and somewhat controversial, obese mice, receiving their diet already during prenatal development, showed an overall lack of response in gene expression levels for most genes. In this regard, we also analyzed genes associated with Wnt and satellite cell physiology, thereby showing striking interferences in our obese model. We were able to further confirm the notion, that obesity alters satellite cell numbers and negatively affects the expression levels of Ankrd1, C3ar1, Ccl8, Mpeg1, and Myog, as seen in our qPCR results. This indicates that obesity influences the response to injury even more severely than assumed previously. Here, we provide new potential targets for further studies that may significantly affect the outcome of muscle regeneration in normal weight and obese individuals.
Availability of Data
Complete microarray data are available at Gene Expression Omnibus (accession number: GSE103726).
Author Contributions
Study design, funding, and supervision by MW and UK. PX, CH, TK, and J-UW performed animal experiments. UK, PX, J-UW, AP, SM, MH-L, LdR, DW, and LD were involved in establishment of the drop-tower device for the induction of a blunt muscle trauma. LdR, DW, and LD designed the force input setup, while J-UW, LdR, DW, and LD performed the experiments for the determination of force input into the muscles of normal weight and obese mice. MRI scans were performed by PX, AA, and VR. Morphological and immunohistochemistry analyses were performed by PX, SM, CH, TK, J-UW, AP, and MH-L. AS, MJ, PG, and J-UW designed and discussed the microarray method and script for evaluation. J-UW evaluated the corresponding data with valuable input from UK, MW, AS, MJ, PG, and MH-L. UK, MW, MH-L, AS, VR, LD, PX, and JW wrote the paper with input from the other authors. All authors read the final manuscript and approved it.
Funding
UK and MW are supported by the Deutsche Forschungsgemeinschaft (DFG) as part of the SFB1149, Danger Response, Disturbance Factors and Regenerative Potential after Acute Trauma. JW is a member of the International Graduate School of Molecular Medicine (IGradU) at Ulm University, which is funded by the DFG under the acronym GSC270.
Conflict of Interest Statement
The authors declare that the research was conducted in the absence of any commercial or financial relationships that could be construed as a potential conflict of interest.
Acknowledgments
We would like to thank Sonja Braumüller for her technical support with the trauma model, as well as Dr. Karlheinz Holzmann and Karin Lanz from the Ulm University core facility genomics for their help and expertise in performing microarray experiments. We would also like to thank Anne Subgang for her technical assistance for MRI experiments.
Supplementary Material
The Supplementary Material for this article can be found online at: https://www.frontiersin.org/articles/10.3389/fphys.2018.00674/full#supplementary-material
References
Abhyankar, S., Leishear, K., Callaghan, F. M., Demner-Fushman, D., and McDonald, C. J. (2012). Lower short- and long-term mortality associated with overweight and obesity in a large cohort study of adult intensive care unit patients. Crit Care 16:R235. doi: 10.1186/cc11903
Acevedo, L. M., Raya, A. I., Ríos, R., Aguilera-Tejero, E., and Rivero, J. L. (2017). Obesity-induced discrepancy between contractile and metabolic phenotypes in slow- and fast-twitch skeletal muscles of female obese Zucker rats. J. Appl. Physiol. 123, 249–259. doi: 10.1152/japplphysiol.00282.2017
Adamczak, M., and Wiecek, A. (2013). The adipose tissue as an endocrine organ. Semin. Nephrol. 33, 2–13. doi: 10.1016/j.semnephrol.2012.12.008
Akhmedov, D., and Berdeaux, R. (2013). The effects of obesity on skeletal muscle regeneration. Front. Physiol. 4:371. doi: 10.3389/fphys.2013.00371
Al-Suhaimi, E. A., and Shehzad, A. (2013). Leptin, resistin and visfatin: the missing link between endocrine metabolic disorders and immunity. Eur. J. Med. Res. 18:12. doi: 10.1186/2047-783X-18-12
AmiGO 2. (2017). “GO:0032680.” Available online at: http://amigo.geneontology.org/amigo/term/GO:0032680 (Accessed September 25, 2017).
Bentzinger, C. F., Wang, Y. X., and Rudnicki, M. A. (2012). Building muscle: molecular regulation of myogenesis. Cold Spring Harb. Perspect. Biol. 4:a008342. doi: 10.1101/cshperspect.a008342
Bindea, G., Mlecnik, B., Hackl, H., Charoentong, P., Tosolini, M., Kirilovsky, A., et al. (2009). ClueGO: a Cytoscape plug-in to decipher functionally grouped gene ontology and pathway annotation networks. Bioinformatics 25, 1091–1093. doi: 10.1093/bioinformatics/btp101
Boppart, M. D., De Lisio, M., Zou, K., and Huntsman, H. D. (2013). Defining a role for non-satellite stem cells in the regulation of muscle repair following exercise. Front. Physiol. 4:310. doi: 10.3389/fphys.2013.00310
Bornstein, S. R., Abu-Asab, M., Glasow, A., Päth, G., Hauner, H., Tsokos, M., et al. (2000). Immunohistochemical and ultrastructural localization of leptin and leptin receptor in human white adipose tissue and differentiating human adipose cells in primary culture. Diabetes 49, 532–538. doi: 10.2337/diabetes.49.4.532
Bosma, M., Kersten, S., Hesselink, M. K., and Schrauwen, P. (2012). Re-evaluating lipotoxic triggers in skeletal muscle: relating intramyocellular lipid metabolism to insulin sensitivity. Prog. Lipid Res. 51, 36–49. doi: 10.1016/j.plipres.2011.11.003
Burk, A. M., Martin, M., Flierl, M. A., Rittirsch, D., Helm, M., Lampl, L., et al. (2012). Early complementopathy after multiple injuries in humans. Shock 37, 348–354. doi: 10.1097/SHK.0b013e3182471795
Burzyn, D., Kuswanto, W., Kolodin, D., Shadrach, J. L., Cerletti, M., Jang, Y., et al. (2013). A special population of regulatory T cells potentiates muscle repair. Cell 155, 1282–1295. doi: 10.1016/j.cell.2013.10.054
Cantini, M., Massimino, M. L., Bruson, A., Catani, C., Dalla Libera, L., and Carraro, U. (1994). Macrophages regulate proliferation and differentiation of satellite cells. Biochem. Biophys. Res. Commun. 202, 1688–1696. doi: 10.1006/bbrc.1994.2129
Cao, H. (2014). Adipocytokines in obesity and metabolic disease. J. Endocrinol. 220, T47–T59. doi: 10.1530/JOE-13-0339
Caslin, H. L., Franco, R. L., Crabb, E. B., Huang, C. J., Bowen, M. K., and Acevedo, E. O. (2016). The effect of obesity on inflammatory cytokine and leptin production following acute mental stress. Psychophysiology 53, 151–158. doi: 10.1111/psyp.12568
Catalán, V., Gómez-Ambrosi, J., Rodríguez, A., and Frühbeck, G. (2013). Adipose tissue immunity and cancer. Front. Physiol. 4:275. doi: 10.3389/fphys.2013.00275
Chapman, M. A., Mukund, K., Subramaniam, S., Brenner, D., and Lieber, R. L. (2017). Three distinct cell populations express extracellular matrix proteins and increase in number during skeletal muscle fibrosis. Am. J. Physiol. Cell Physiol. 312, C131–C143. doi: 10.1152/ajpcell.00226.2016
Chapman, N. M., and Chi, H. (2017). Dietary fat inflames CD4(+) T cell memory in obesity. Cell Metab. 25, 490–492. doi: 10.1016/j.cmet.2017.02.012
Chargé, S. B., and Rudnicki, M. A. (2004). Cellular and molecular regulation of muscle regeneration. Physiol. Rev. 84, 209–238. doi: 10.1152/physrev.00019.2003
Cinkajzlová, A., Mráz, M., and Haluzík, M. (2017). Lymphocytes and macrophages in adipose tissue in obesity: markers or makers of subclinical inflammation? Protoplasma 254, 1219–1232. doi: 10.1007/s00709-017-1082-3.
Claes, L., Maurer-Klein, N., Henke, T., Gerngross, H., Melnyk, M., and Augat, P. (2006). Moderate soft tissue trauma delays new bone formation only in the early phase of fracture healing. J. Orthop. Res. 24, 1178–1185. doi: 10.1002/jor.20173
Coen, P. M., and Goodpaster, B. H. (2012). Role of intramyocelluar lipids in human health. Trends Endocrinol. Metab. 23, 391–398. doi: 10.1016/j.tem.2012.05.009
Darby, I. A., Zakuan, N., Billet, F., and Desmoulière, A. (2016). The myofibroblast, a key cell in normal and pathological tissue repair. Cell. Mol. Life Sci. 73, 1145–1157. doi: 10.1007/s00018-015-2110-0
de Oliveira Leal, L., and Mafra, D. (2013). Adipokines in Obesity. Clin. Chim. Acta. 419, 87–94. doi: 10.1016/j.cca.2013.02.003
D'Souza, D. M., Trajcevski, K. E., Al-Sajee, D., Wang, D. C., Thomas, M., Anderson, J. E., et al. (2015). Diet-induced obesity impairs muscle satellite cell activation and muscle repair through alterations in hepatocyte growth factor signaling. Physiol. Rep. 3:e12506. doi: 10.14814/phy2.12506
Dunn, J. F., and Zaim-Wadghiri, Y. (1999). Quantitative magnetic resonance imaging of the mdx mouse model of Duchenne muscular dystrophy. Muscle Nerve 22, 1367–1371. doi: 10.1002/(SICI)1097-4598(199910)22:10<1367::AID-MUS5>3.0.CO;2-H
Finkelstein, E. A., Chen, H., Prabhu, M., Trogdon, J. G., and Corso, P. S. (2007). The relationship between obesity and injuries among U.S. adults. Am. J. Health Promot. 21, 460–468. doi: 10.4278/0890-1171-21.5.460
Fischer-Posovszky, P., Wabitsch, M., and Hochberg, Z. (2007). Endocrinology of adipose tissue - an update. Horm. Metab. Res. 39, 314–321. doi: 10.1055/s-2007-976539
Frenette, J., Cai, B., and Tidball, J. G. (2000). Complement activation promotes muscle inflammation during modified muscle use. Am. J. Pathol. 156, 2103–2110. doi: 10.1016/S0002-9440(10)65081-X
Fuster, J. J., Zuriaga, M. A., Ngo, D. T., Farb, M. G., Aprahamian, T., Yamaguchi, T. P., et al. (2015). Noncanonical Wnt signaling promotes obesity-induced adipose tissue inflammation and metabolic dysfunction independent of adipose tissue expansion. Diabetes 64, 1235–1248. doi: 10.2337/db14-1164
Garg, K., Corona, B. T., and Walters, T. J. (2015). Therapeutic strategies for preventing skeletal muscle fibrosis after injury. Front. Pharmacol. 6:87. doi: 10.3389/fphar.2015.00087
GeneCards, R. (2017a). “Irak3 - Interleukin-1 Receptor-Associated Kinase 3.” GeneCards(R) Human Gene Database. Available online at: http://www.genecards.org/
GeneCards, R. (2017b). “Myd88 - Myeloid Differentiation Primary Response 88.” GeneCards(R) Human Gene Database. Available online at: http://www.genecards.org/
GeneCards, R. (2017c). “Pik3ap1 - Phosphoinositide-3-Kinase Adaptor Protein 1.” GeneCards(R) Human Gene Database. Available online at: http://www.genecards.org/
Gong, H., Sun, L., Chen, B., Han, Y., Pang, J., Wu, W., et al. (2016). Evaluation of candidate reference genes for RT-qPCR studies in three metabolism related tissues of mice after caloric restriction. Sci. Rep. 6:38513. doi: 10.1038/srep38513
Gregor, M. F., and Hotamisligil, G. S. (2011). Inflammatory mechanisms in obesity. Annu. Rev. Immunol. 29, 415–445. doi: 10.1146/annurev-immunol-031210-101322
Guo, X., and Wang, X. F. (2009). Signaling cross-talk between TGF-beta/BMP and other pathways. Cell Res. 19, 71–88. doi: 10.1038/cr.2008.302
Hardy, D., Besnard, A., Latil, M., Jouvion, G., Briand, D., Thepenier, C., et al. (2016). Comparative study of injury models for studying muscle regeneration in mice. PLoS ONE 11:e0147198. doi: 10.1371/journal.pone.0147198
Hu, Z., Wang, H., Lee, I. H., Modi, S., Wang, X., Du, J., et al. (2010). PTEN inhibition improves muscle regeneration in mice fed a high-fat diet. Diabetes 59, 1312–1320. doi: 10.2337/db09-1155
Jung, U. J., and Choi, M. S. (2014). Obesity and its metabolic complications: the role of adipokines and the relationship between obesity, inflammation, insulin resistance, dyslipidemia and nonalcoholic fatty liver disease. Int. J. Mol. Sci. 15, 6184–6223. doi: 10.3390/ijms15046184
Keire, P., Shearer, A., Shefer, G., and Yablonka-Reuveni, Z. (2013). Isolation and culture of skeletal muscle myofibers as a means to analyze satellite cells. Methods Mol. Biol. 946, 431–468. doi: 10.1007/978-1-62703-128-8_28
Kharraz, Y., Guerra, J., Mann, C. J., Serrano, A. L., and Muñoz-Cánoves, P. (2013). Macrophage plasticity and the role of inflammation in skeletal muscle repair. Mediators Inflamm. 2013:491497. doi: 10.1155/2013/491497
Kim, J. A., Shon, Y. H., Lim, J. O., Yoo, J. J., Shin, H. I., and Park, E. K. (2013). MYOD mediates skeletal myogenic differentiation of human amniotic fluid stem cells and regeneration of muscle injury. Stem Cell Res. Ther. 4:147. doi: 10.1186/scrt358
Könner, A. C., and Brüning, J. C. (2011). Toll-like receptors: linking inflammation to metabolism. Trends Endocrinol. Metab. 22, 16–23. doi: 10.1016/j.tem.2010.08.007
Lai, M., Chandrasekera, P. C., and Barnard, N. D. (2014). You are what you eat, or are you? The challenges of translating high-fat-fed rodents to human obesity and diabetes. Nutr. Diabetes 4:e135. doi: 10.1038/nutd.2014.30
Langen, R. C., Schols, A. M., Kelders, M. C., van der Velden, J. L., Wouters, E. F., and Janssen-Heininger, Y. M. (2006). Muscle wasting and impaired muscle regeneration in a murine model of chronic pulmonary inflammation. Am. J. Respir. Cell Mol. Biol. 35, 689–696. doi: 10.1165/rcmb.2006-0103OC
Li, Y. P. (2003). TNF-alpha is a mitogen in skeletal muscle. Am. J. Physiol,. Cell Physiol. 285, C370–C376. doi: 10.1152/ajpcell.00453.2002
Lin, Chun, T. H., and Kang, L. (2016). Adipose extracellular matrix remodelling in obesity and insulin resistance. Biochem. Pharmacol. 119, 8–16. doi: 10.1016/j.bcp.2016.05.005
Liu, J., Han, L., Zhu, L., and Yu, Y. (2016). Free fatty acids, not triglycerides, are associated with non-alcoholic liver injury progression in high fat diet induced obese rats. Lipids Health Dis. 15:27. doi: 10.1186/s12944-016-0194-7
Lotia, S., Montojo, J., Dong, Y., Bader, G. D., and Pico, A. R. (2013). Cytoscape app store. Bioinformatics 29, 1350–1351. doi: 10.1093/bioinformatics/btt138
Makki, K., Froguel, P., and Wolowczuk, I. (2013). Adipose tissue in obesity-related inflammation and insulin resistance: cells, cytokines, and chemokines. ISRN Inflamm. 2013:139239. doi: 10.1155/2013/139239
Manicone, A. M., Gong, K., Johnston, L. K., and Giannandrea, M. (2016). Diet-induced obesity alters myeloid cell populations in naive and injured lung. Respir. Res. 17:24. doi: 10.1186/s12931-016-0341-8
Mann, C. J., Perdiguero, E., Kharraz, Y., Aguilar, S., Pessina, P., Serrano, A. L., et al. (2011). Aberrant repair and fibrosis development in skeletal muscle. Skelet. Muscle 1:21. doi: 10.1186/2044-5040-1-21
Mattila, K. T., Lukka, R., Hurme, T., Komu, M., Alanen, A., and Kalimo, H. (1995). Magnetic resonance imaging and magnetization transfer in experimental myonecrosis in the rat. Magn. Reson. Med. 33, 185–192. doi: 10.1002/mrm.1910330207
Mauro, C., Smith, J., Cucchi, D., Coe, D., Fu, H., Bonacina, F., et al. (2017). Obesity-induced metabolic stress leads to biased effector memory CD4(+) T cell differentiation via PI3K p110delta-Akt-mediated signals. Cell Metab. 25, 593–609. doi: 10.1016/j.cmet.2017.01.008
McMillan, A. B., Shi, D., Pratt, S. J., and Lovering, R. M. (2011). Diffusion tensor MRI to assess damage in healthy and dystrophic skeletal muscle after lengthening contractions. J. Biomed. Biotechnol. 2011:970726. doi: 10.1155/2011/970726
Miller, M. S., and Toth, M. J. (2013). Myofilament protein alterations promote physical disability in aging and disease. Exerc. Sport Sci. Rev. 41, 93–99. doi: 10.1097/JES.0b013e31828bbcd8
Mojumdar, K., Giordano, C., Lemaire, C., Liang, F., Divangahi, M., Qureshi, S. T., et al. (2016). Divergent impact of Toll-like receptor 2 deficiency on repair mechanisms in healthy muscle vs. Duchenne muscular dystrophy. J. Pathol. 239, 10–22. doi: 10.1002/path.4689
Murphy, M. M., Lawson, J. A., Mathew, S. J., Hutcheson, D. A., and Kardon, G. (2011). Satellite cells, connective tissue fibroblasts and their interactions are crucial for muscle regeneration. Development 138, 3625–3637. doi: 10.1242/dev.064162
Nelson, J., Billeter, A. T., Seifert, B., Neuhaus, V., Trentz, O., Hofer, C. K., et al. (2012). Obese trauma patients are at increased risk of early hypovolemic shock: a retrospective cohort analysis of 1,084 severely injured patients. Crit. Care 16:R77. doi: 10.1186/cc11334
Norton, L., Harrison, J. E., Pointer, S., and Lathlean, T. (2011). Obesity and injury in Australia: A Review of the literature. Injury Research and Statistics Series. Available online at: http://www.aihw.gov.au/publication-detail/?id=10737420420
Ouchi, N., and Walsh, K. (2012). Cardiovascular and metabolic regulation by the adiponectin/C1q/tumor necrosis factor-related protein family of proteins. Circulation 125, 3066–3068. doi: 10.1161/CIRCULATIONAHA.112.114181
Phieler, J., Chung, K. J., Chatzigeorgiou, A., Klotzsche-von Ameln, A., Garcia-Martin, R., Sprott, D., et al. (2014). The complement anaphylatoxin C5a receptor contributes to obese adipose tissue inflammation and insulin resistance. J. Immunol. 191, 4367–4374. doi: 10.4049/jimmunol.1300038
Phieler, J., Garcia-Martin, R., Lambris, J. D., and Chavakis, T. (2013). The role of the complement system in metabolic organs and metabolic diseases. Semin. Immunol. 25, 47–53. doi: 10.1016/j.smim.2013.04.003
Pillon, N. J., Bilan, P. J., Fink, L. N., and Klip, A. (2013). Cross-talk between skeletal muscle and immune cells: muscle-derived mediators and metabolic implications. Am. J. Physiol. Endocrinol. Metab. 304, E453–E465. doi: 10.1152/ajpendo.00553.2012
Pratt, S. J., Xu, S., Mullins, R. J., and Lovering, R. M. (2013). Temporal changes in magnetic resonance imaging in the mdx mouse. BMC Res. 6:262. doi: 10.1186/1756-0500-6-262
R Development Core Team, (2016). R: A Language and Environment for Statistical Computing. Vienna: R Foundation for Statistical Computing.
Rigamonti, E., Zordan, P., Sciorati, C., Rovere-Querini, P., and Brunelli, S. (2014). Macrophage plasticity in skeletal muscle repair. Biomed Res. Int. 2014:560629. doi: 10.1155/2014/560629
Rocheteau, P., Vinet, M., and Chretien, F. (2015). Dormancy and quiescence of skeletal muscle stem cells. Results Probl. Cell Differ. 56, 215–235. doi: 10.1007/978-3-662-44608-9_10
RStudio Team. (2016). RStudio: Integrated Development for R. Boston, MA: RStudio, Inc. Available online at: http://www.Rstudio.Com
Saclier, M., Yacoub-Youssef, H., Mackey, A. L., Arnold, L., Ardjoune, H., Magnan, M., et al. (2013). Differentially activated macrophages orchestrate myogenic precursor cell fate during human skeletal muscle regeneration. Stem Cells 31, 384–396. doi: 10.1002/stem.1288
Sakaguchi, S., Yamaguchi, T., Nomura, T., and Ono, M. (2008). Regulatory T cells and immune tolerance. Cell 133, 775–787. doi: 10.1016/j.cell.2008.05.009
Shi, X., and Garry, D. J. (2006). Muscle stem cells in development, regeneration, and disease. Genes Dev. 20, 1692–1708. doi: 10.1101/gad.1419406
Sinha, I., Sakthivel, D., and Varon, D. E. (2017). Systemic regulators of skeletal muscle regeneration in obesity. Front. Endocrinol. 8:29. doi: 10.3389/fendo.2017.00029
Sinha-Hikim, A. P., Sinha-Hikim, I., and Friedman, T. C. (2017). Connection of nicotine to diet-induced obesity and non-alcoholic fatty liver disease: cellular and mechanistic insights. Front. Endocrinol. 8:23. doi: 10.3389/fendo.2017.00023
Summers, S. A., and Nelson, D. H. (2005). A role for sphingolipids in producing the common features of type 2 diabetes, metabolic syndrome X, and Cushing's syndrome. Diabetes 54, 591–602. doi: 10.2337/diabetes.54.3.591
Sziksz, E., Pap, D., Lippai, R., Béres, N. J., Fekete, A., Szabó, A. J., et al. (2015). Fibrosis related inflammatory mediators: role of the IL-10 Cytokine family. Mediators Inflamm. 2015:764641. doi: 10.1155/2015/764641.
Tang, Q., Chen, C., Zhang, Y., Dai, M., Jiang, Y., Wang, H., et al. (2018). Wnt5a regulates the cell proliferation and adipogenesis via MAPK-independent pathway in early stage of obesity. Cell Biol. Int. 42, 63–74. doi: 10.1002/cbin.10862
Tateya, S., Kim, F., and Tamori, Y. (2013). Recent advances in obesity-induced inflammation and insulin resistance. Front. Endocrinol. 4:93. doi: 10.3389/fendo.2013.00093
Tidball, J. G., Dorshkind, K., and Wehling-Henricks, M. (2014). Shared signaling systems in myeloid cell-mediated muscle regeneration. Development 141, 1184–1196. doi: 10.1242/dev.098285
Tidball, J. G., and Villalta, S. A. (2010). Regulatory interactions between muscle and the immune system during muscle regeneration. Am. J. Physiol. Regul. Integr. Comp. Physiol. 298, R1173–R1187. doi: 10.1152/ajpregu.00735.2009
Tilg, H., and Moschen, A. R. (2008). Inflammatory mechanisms in the regulation of insulin resistance. Mol. Med. 14, 222–231. doi: 10.2119/2007-00119.Tilg
Tortelote, G. G., Reis, R. R., de Almeida Mendes, F., and Abreu, J. G. (2017). Complexity of the Wnt/betacatenin pathway: searching for an activation model. Cell. Signal. 40, 30–43. doi: 10.1016/j.cellsig.2017.08.008
Toth, K. G., McKay, B. R., De Lisio, M., Little, J. P., Tarnopolsky, M. A., and Parise, G. (2011). IL-6 induced STAT3 signalling is associated with the proliferation of human muscle satellite cells following acute muscle damage. PLoS ONE 6:e17392. doi: 10.1371/journal.pone.0017392
Trayhurn, P., Drevon, C. A., and Eckel, J. (2011). Secreted proteins from adipose tissue and skeletal muscle - adipokines, myokines and adipose/muscle cross-talk. Arch. Physiol. Biochem. 117, 47–56. doi: 10.3109/13813455.2010.535835
Upadhyay, J., Farr, O., Perakakis, N., Ghaly, W., and Mantzoros, C. (2018). Obesity as a disease. Med. Clin. North Am. 102, 13–33. doi: 10.1016/j.mcna.2017.08.004
Urciuolo, A., Quarta, M., Morbidoni, V., Gattazzo, F., Molon, S., Grumati, P., et al. (2013). Collagen VI regulates satellite cell self-renewal and muscle regeneration. Nat. Commun. 4:1964. doi: 10.1038/ncomms2964
Vlaicu, S. I., Tatomir, A., Boodhoo, D., Vesa, S., Mircea, P. A., and Rus, H. (2016). The role of complement system in adipose tissue-related inflammation. Immunol. Res. 64, 653–664. doi: 10.1007/s12026-015-8783-5
Wanner, R., Gey, M., Abaei, A., Warnecke, D., de Roy, L., Dürselen, L., et al. (2017). Functional and molecular characterization of a novel traumatic peripheral nerve-muscle injury model. Neuromolecular Med. 19, 357–374. doi: 10.1007/s12017-017-8450-1
Warren, G. L., Hulderman, T., Mishra, D., Gao, X., Millecchia, L., O'Farrell, L., et al. (2005). Chemokine receptor CCR2 involvement in skeletal muscle regeneration. FASEB J. 19, 413–415. doi: 10.1096/fj.04-2421fje
Weckbach, S., Hohmann, C., Braumueller, S., Denk, S., Klohs, B., Stahel, P. F., et al. (2013). Inflammatory and apoptotic alterations in serum and injured tissue after experimental polytrauma in mice: distinct early response compared with single trauma or “double-hit” injury. J. Trauma Acute Care Surg. 74, 489–498. doi: 10.1097/TA.0b013e31827d5f1b
Werner, J. U., Tödter, K., Xu, P., Lockhart, L., Jähnert, M., Gottmann, P., et al. (2018). Comparison of fatty acid and gene profiles in skeletal muscle in normal and obese C57BL/6J Mice before and after blunt muscle injury. Front. Physiol. 9:19. doi: 10.3389/fphys.2018.00019
Winer, S., Chan, Y., Paltser, G., Truong, D., Tsui, H., Bahrami, J., et al. (2009). Normalization of obesity-associated insulin resistance through immunotherapy. Nat. Med. 15, 921–929. doi: 10.1038/nm.2001
Wishnia, A., Alameddine, H., Tardif de Géry, S., and Leroy-Willig, A. (2001). Use of magnetic resonance imaging for noninvasive characterization and follow-up of an experimental injury to normal mouse muscles. Neuromuscul. Disord. 11, 50–55. doi: 10.1016/S0960-8966(00)00164-4
Woo, M., Isganaitis, E., Cerletti, M., Fitzpatrick, C., Wagers, A. J., Jimenez-Chillaron, J., et al. (2011). Early life nutrition modulates muscle stem cell number: implications for muscle mass and repair. Stem Cells Dev. 20, 1763–1769. doi: 10.1089/scd.2010.0349.
Wozniak, S. E., Gee, L. L., Wachtel, M. S., and Frezza, E. E. (2009). Adipose tissue: the new endocrine organ? A review article. Dig. Dis. Sci. 54, 1847–1856. doi: 10.1007/s10620-008-0585-3
Yin, H., Price, F., and Rudnicki, M. A. (2013). Satellite cells and the muscle stem cell niche. Physiol. Rev. 93, 23–67. doi: 10.1152/physrev.00043.2011
Keywords: obesity, trauma, C57BL/6J, skeletal muscle, microarray, fibrosis, satellite cells
Citation: Xu P, Werner J-U, Milerski S, Hamp CM, Kuzenko T, Jähnert M, Gottmann P, de Roy L, Warnecke D, Abaei A, Palmer A, Huber-Lang M, Dürselen L, Rasche V, Schürmann A, Wabitsch M and Knippschild U (2018) Diet-Induced Obesity Affects Muscle Regeneration After Murine Blunt Muscle Trauma—A Broad Spectrum Analysis. Front. Physiol. 9:674. doi: 10.3389/fphys.2018.00674
Received: 18 January 2018; Accepted: 15 May 2018;
Published: 05 June 2018.
Edited by:
Stefano Biressi, University of Trento, ItalyReviewed by:
Stefano Ciciliot, Istituto Veneto di Medicina Molecolare (VIMM), ItalyLuca Madaro, Fondazione Santa Lucia (IRCCS), Italy
Copyright © 2018 Xu, Werner, Milerski, Hamp, Kuzenko, Jähnert, Gottmann, de Roy, Warnecke, Abaei, Palmer, Huber-Lang, Dürselen, Rasche, Schürmann, Wabitsch and Knippschild. This is an open-access article distributed under the terms of the Creative Commons Attribution License (CC BY). The use, distribution or reproduction in other forums is permitted, provided the original author(s) and the copyright owner are credited and that the original publication in this journal is cited, in accordance with accepted academic practice. No use, distribution or reproduction is permitted which does not comply with these terms.
*Correspondence: Martin Wabitsch, bWFydGluLndhYml0c2NoQHVuaWtsaW5pay11bG0uZGU=
Uwe Knippschild, dXdlLmtuaXBwc2NoaWxkQHVuaWtsaW5pay11bG0uZGU=
†These authors have contributed equally to this work.