 Robbert J. van der Pijl1,2*
 Brian Hudson1Tomotaroh Granzier-Nakajima1Frank Li1Anne M. Knottnerus1
 John Smith1
 Charles S. Chung1,3Michael Gotthardt4,5
 Henk L. Granzier1*Coen A. C. Ottenheijm1,2*
- 1Cellular and Molecular Medicine, University of Arizona, Tucson, AZ, United States
- 2Department of Physiology, Amsterdam UMC, Amsterdam, Netherlands
- 3Department of Physiology, Wayne State University, Detroit, MI, United States
- 4Max-Delbruck-Center for Molecular Medicine, Berlin, Germany
- 5Cardiology, Virchow Klinikum, Charité University Medicine, Berlin, Germany
The Proline, Glutamate, Valine and Lysine-rich (PEVK) region of titin constitutes an entropic spring that provides passive tension to striated muscle. To study the functional and structural repercussions of a small reduction in the size of the PEVK region, we investigated skeletal muscles of a mouse with the constitutively expressed C-terminal PEVK exons 219–225 deleted, the TtnΔ219–225 model (MGI: TtnTM 2.1Mgot). Based on this deletion, passive tension in skeletal muscle was predicted to be increased by ∼17% (sarcomere length 3.0 μm). In contrast, measured passive tension (sarcomere length 3.0 μm) in both soleus and EDL muscles was increased 53 ± 11% and 62 ± 4%, respectively. This unexpected increase was due to changes in titin, not to alterations in the extracellular matrix, and is likely caused by co-expression of two titin isoforms in TtnΔ219–225 muscles: a larger isoform that represents the TtnΔ219–225 N2A titin and a smaller isoform, referred to as N2A2. N2A2 represents a splicing adaption with reduced expression of spring element exons, as determined by titin exon microarray analysis. Maximal tetanic tension was increased in TtnΔ219–225 soleus muscle (WT 240 ± 9; TtnΔ219–225 276 ± 17 mN/mm2), but was reduced in EDL muscle (WT 315 ± 9; TtnΔ219–225 280 ± 14 mN/mm2). The changes in active tension coincided with a switch toward slow fiber types and, unexpectedly, faster kinetics of tension generation and relaxation. Functional overload (FO; ablation) and hindlimb suspension (HS; unloading) experiments were also conducted. TtnΔ219–225 mice showed increases in both longitudinal hypertrophy (increased number of sarcomeres in series) and cross-sectional hypertrophy (increased number of sarcomeres in parallel) in response to FO and attenuated cross-sectional atrophy in response to HS. In summary, slow- and fast-twitch muscles in a mouse model devoid of titin’s PEVK exons 219–225 have high passive tension, due in part to alterations elsewhere in splicing of titin’s spring region, increased kinetics of tension generation and relaxation, and altered trophic responses to both functional overload and unloading. This implicates titin’s C-terminal PEVK region in regulating passive and active muscle mechanics and muscle plasticity.
Introduction
Titin is a giant protein located inside the striated muscle sarcomere where it anchors inside the Z-disk and M-band and spans the half-sarcomere. This layout in the sarcomere uniquely positions titin to act as a molecular spring (Labeit and Kolmerer, 1995). The spring function of titin is primarily regulated through elastic domains in the I-band region of the sarcomere. In skeletal muscle, these domains consist of serially linked immunoglobulin(Ig)-like repeats and a spring element consisting of the PEVK (Proline, Glutamate, Valine, Lysine-rich) region (Watanabe et al., 2002; Nagy et al., 2005). Titin’s spring-like behavior, combined with its contiguous arrangement, provides passive tension to skeletal muscle. Indeed, complete removal of titin results in loss of sarcomere structure and passive and active tension (Horowits et al., 1986; Radke et al., 2019), supporting titin’s vital role in muscle mechanics and sarcomerogenesis.
The role of titin in passive tension has been extensively studied in the heart [reviewed in Granzier and Irving (1995); Linke and Fernandez (2002), and LeWinter et al. (2007)], with several studies targeting titin-stiffness for therapeutic benefit in cardiac dysfunction (Hinze et al., 2016; Methawasin et al., 2016). Deletion models such as the TtnΔ30–38 [proximal tandem Ig segment; Mouse genome informatics entry (MGI): TtnTM 1.1Hgra (Chung et al., 2013)], TtnΔ49 [N2B; MGI: TtnTM 1Mgot (Radke et al., 2007)] and TtnΔ251–269 [I/A-junction; MGI: TtnTM 2.1Hgra (Granzier et al., 2014)] models show increased passive tension in the heart, whereas the deletion of Rbm20ΔRRM [Rbm20 RNA recognition motif deletion; MGI: Rbm20TM 1Hgra (Guo et al., 2012; Methawasin et al., 2014)], involved in titin RNA-splicing, results in more compliant titin isoforms and reduced passive tension. Trophic responses to these deletions are varied, with TtnΔ251–269 and TtnΔ219–225 hearts developing mild hypertrophy, and TtnΔ30–38 and TtnΔ49 hearts showing atrophy. Thus, the varied responses to altering titin stiffness in the heart exemplify the complexity of the mechanisms underlying passive tension and muscle trophicity.
In skeletal muscles, the effect of modifying titin stiffness is even more complex. Skeletal muscles possess highly variably spliced tandem Ig segments and PEVK regions (Li et al., 2012; Savarese et al., 2018), with fetal muscle possessing the highest inclusion of exons (Lahmers et al., 2004). This variable titin splicing in skeletal muscles makes studying deletions in titin more challenging, as the deletions are likely to have variable effects on muscle structure and function; effects that are likely specific to muscle types. The splicing of titin is controlled by RNA-binding protein 20 (Rbm20). Both rat and mouse models of complete or partial ablation of the Rbm20 protein result in titin isoforms of 3.8–3.9 mDa in skeletal muscles, with reduced passive tension (Mateja et al., 2013; van der Pijl et al., 2018). Whereas Rbm20 animal models indirectly affect the PEVK region of titin, there are two mouse models that specifically target this region: the TtnΔ112–158 [MGI; TtnTM 4.1Hgra (Brynnel et al., 2018)] and TtnΔ219–225 [N2B PEVK KO; MGI: TtnTM 2.1Mgot (Granzier et al., 2009)] deletion models. The TtnΔ112–158 model targets the N-terminal portion of the PEVK region, deleting up to 47 of 100 PEVK repeats found in the mouse gene (Granzier et al., 2007). TtnΔ112–158 mice showed marked increases in passive stiffness of skeletal muscle. In response, muscles developed longitudinal hypertrophy, i.e. serial growth of the number of sarcomeres, to reduce the sarcomere length working range and the apparent passive muscle stiffness. The TtnΔ219–225 model targets only a small portion of the PEVK region, the constitutively expressed seven C-terminal PEVK exons. This model was designed to target the only PEVK repeats expressed in the N2B cardiac titin isoform. In the heart, this mouse displays increased passive tension and hypertrophy. The structure and function of skeletal muscles in this model has not been investigated. Considering the relatively small size of the deletion of the TtnΔ219–225 model, we hypothesized that the deletion would minimally affect passive tension in skeletal muscle, allowing us to study titin stiffness in relation to muscle function in the absence of trophic remodeling.
Our findings revealed that the TtnΔ219–225 soleus and extensor digitorum longus (EDL) muscles have increased passive tension, partly due to the appearance of a smaller secondary titin isoform. Contrary to our hypothesis, the increased passive tension induced both cross-sectional and longitudinal hypertrophy. Active tensions were higher in soleus muscle, but not in the EDL, while the kinetics of force generation and relaxation were faster. Finally, TtnΔ219–225 muscles displayed a “sensitization” to hypertrophic stimuli. These findings indicate that a small truncation in titin’s PEVK region can have substantial repercussions for the structure and function of skeletal muscle.
Materials and Methods
Animals and Tissue Collection
TtnΔ219–225 mouse model generation was previously described by Granzier et al. (Granzier et al., 2009) and the Rbm20ΔRRM mouse model has previously been described by Methawasin et al. (2014). Mice were maintained on a mixed C57BL/6 × 129S6 background, on a heterozygous to heterozygous breeding scheme. Age-matched homozygous TtnΔ219–225 (Δ) and wildtype littermates were used for experiments. Mouse soleus (SOL), extensor digitorum longus (EDL), tibialis cranialis (TC), and diaphragm (DIA) were collected from full grown 3.5-month-old male mice and to show progressive changes in muscle mass, 6-month old male mice were also used. A subset of the experiments was also performed on female mice of both genotypes, to study whether the results obtained were gender-dependent. Prior to starting experiments, mice were anesthetized with isoflurane and sacrificed by cervical dislocation. Tissues were rapidly excised and the muscles dissected in oxygenated HEPES solution (NaCl 133.5 mM; KCl 5 mM; NaH2PO4 1.2 mM; MgSO4 1.2 mM; HEPES 10 mM). Dissected muscles were either: (1) snap frozen in liquid nitrogen, (2) used directly for intact muscle contractility studies, or (3) chemically skinned in relaxing solution (BES 40 mM, EGTA 10 mM, MgCl2 6.56 mM, ATP 5.88 mM, DTT 1 mM, K-propionate 46.35 mM, creatine phosphate 15 mM, pH 7.0) with 1% Triton-X-100, overnight at 4°C, washed thoroughly with relaxing solution, and stored up to 1 month at −20° in relaxing solution containing 50% (v/v) glycerol. To prevent protein degradation, all solutions contained protease inhibitors (phenylmethylsulfonyl fluoride (PMSF) 0.5 mM; Leupeptin 0.04 mM; E64 0.01 mM). All animal experiments were approved by the University of Arizona Institutional Animal Care and Use Committee and followed the U.S. National Institutes of Health “Using Animals in Intramural Research” guidelines for animal use.
Functional Overload Study
Male 3.5-month-old mice were sedated with 1–3% isoflurane and underwent bilateral ablation of the gastrocnemius and plantaris muscles to induce functional overload (FO) hypertrophy in soleus muscle. Briefly, hair was removed from the lower leg, with depilatory cream and cleaned with alternating scrubs of 70% ethanol and betadine. A longitudinal incision was made to reveal the gastrocnemius-complex and the Achilles tendon. The soleus tendon was carefully isolated and the remaining portion of the Achilles tendon was cut. The gastrocnemius and planteris were gently blunt-dissected away from the soleus muscle, until approximately 75% was free and the muscles were then removed and the skin sutured together. Mice were allowed to recover and then freely move in their cage for 10 days after which they were sacrificed for subsequent studies.
Hindlimb Suspension Study
Male 3.5-month-old mice were suspended by the tail to induce atrophy of the hindlimb muscles, as previously described (Labeit et al., 2010). Briefly, the tail of each mouse was placed in a harness, which is used to elevate the pelvis so that the mice are angled ∼45°, with the feet of the hindlimbs unable to contact the cage floor. The suspended mice were housed in custom-designed cages where they could freely move around on their front limbs, with free access to water and food. Mice were suspended for 10 days before being sacrificed for subsequent studies.
Titin Microarray Studies
The microarray experiments were performed as described previously (Buck et al., 2010). Briefly, freshly dissected soleus and EDL were stored in RNAlater (Ambion) and RNA was subsequently isolated using the RNeasy Fibrous Tissue Mini Kit (Qiagen). RNA was amplified using the SenseAmp kit (Genisphere) and Superscript III reverse transcriptase enzyme (Invitrogen). Reverse transcription and dye coupling was done using superscript plus indirect cDNA labeling module (Invitrogen). WT and TtnΔ219–225 samples were reciprocally labeled with Alexa Fluor 555 or Alexa Fluor 647, and samples of both genotypes were cohybridized on a custom microarray (Lahmers et al., 2004). For each sample 750 ng of cDNA (Nanodrop, Thermo Fisher Scientific) was hybridized with Slide-Hyb buffer #1 (Ambion) for 16 h at 42°C and continuously washed using a GeneTac Hybridization Station (Genomic Solutions). Microarrays were scanned at 595 and 685 nm with an Array WoRx scanner, spot-finding with SoftWoRx Tracker, and analysis using the R module, CARMA (Greer et al., 2006). The analysis detects relative changes in the fluorescence of a probe, represented as a fold-difference between WT and TtnΔ219–225 exon expression. A positive fold change indicates an increase in expression and a negative fold-change indicates a decrease in expression compared to WT samples. Eight samples of each muscle and genotype, consisting of four males and four females each, were run to determine the average fold-change in the TtnΔ219–225 mice.
Gel Electrophoresis
SDS-agarose gel electrophoresis (SDS-AGE) was performed as previously described (Warren et al., 2003). Briefly, muscle samples were solubilized in a urea and glycerol buffer (with protease inhibitors Leupeptin 0.04 mM; E64 0.16 mM; and PMSF 0.2 mM). The gels were run at 15 mA per gel for 3 h and 20 min in a SE600X vertical gel system (Hoefer Inc., United States), stained with Neuhoff’s coomassie, and subsequently scanned and analyzed using One-D scan EX (Scanalytics Inc., United States) software. The integrated optical density of titin and myosin heavy chain (MyHC) was determined as a function of the slope of the linear range between integrated optical density and loaded volume. Note that N2A and N2A2 Gaussians fits do not fully separate, leading to a slight overestimation of titin levels in the TtnΔ219–225 muscles. SDS-PAGE gels for MyHC separation were performed as previously described (Agbulut et al., 1996). MyHC IIa overlaps with IIx, therefore we refer to this band as IIa/x.
Simulated Force
To estimate the effect of the exon 219–225 deletion on titin-based passive force we determined the force-sarcomere length relation of a single titin molecule in the sarcomere with and without exons 219–225. These calculation take into account the extensibility of the various titin segments, in the absence of post-translational modifications. The spring region of titin was simulated as two WLCs in series: (1) the tandem Ig segment (combined proximal and distal segments), and (2) the PEVK segment. For a WLC, the external force is given by equation 1.
F is force (pN), Lp is the persistence length (nm), z is end-to-end extension (nm), Lc is the contour length (nm), kB is Boltzmann’s constant, and T is absolute temperature. Based on previous work the PEVK segment was assumed to contain 1613 residues in WT mouse soleus muscle (Brynnel et al., 2018) and 190 residues less in TtnΔ219–225 mouse soleus (Granzier et al., 2009). Assuming a maximal residue spacing of 0.38 nm per residue (Kellermayer et al., 1997; Anderson and Granzier, 2012), resulting in a PEVK Lc of 613 nm in WT and 541 nm in TtnΔ219–225 mice. Tandem Ig segments were assumed to contain 90 Ig domains in both WT and TtnΔ219–225 mice (Brynnel et al., 2018) with an average maximal spacing of folded Ig domains of 5 nm (Trombitas et al., 1998), resulting in a Lc of 450 nm. The persistence length (Lp) of the PEVK and tandem Ig segments were (based on previous work) assumed to be 1.0 nm and 10 nm, respectively, (Watanabe et al., 2002; Anderson and Granzier, 2012). Because spring elements are in series, they bear equivalent forces, and the fractional extension (z/L) at each force can therefore be calculated. Using the fractional extensions and the Lc values (above) the corresponding SLs were determined assuming that the inextensible Z-disk and A-band segments of titin are 700 nm long (per half sarcomere) (Trombitas et al., 1998).
Measurement of Passive Tension
Small muscle strips (100–200 μm in diameter, ∼2 mm in length) were dissected from chemically skinned skeletal muscle preparations that had been stored in 50% glycerol/relaxing solution. Passive force was measured with a strain gauge force transducer and fiber length was controlled by a high-speed motor. Muscle strips were attached to the motor arm and the force transducer via aluminum T-clips and then lowered into a chamber containing relaxing solution (room temperature). The width and depth of the bundles were measured and the cross-sectional area (CSA) was calculated assuming an elliptical shape. The measured forces were then converted to tension (force/CSA). Sarcomere length (SL) was measured on-line by laser diffraction. At the beginning of each experiment, muscles were activated at SL 2.4 μm (pCa 4.0) to measure active tension. Typically, maximal activate tension was at least 100 mN/mm2, indicating normal myofilament function.
Fibers bathed in relaxing solution were stretched (10%/sec) from their slack length (2.0 μm) up to a SL of 3.0 μm, in 0.1 μm increments, followed by a 90 s hold. At the end of the hold phase the fiber was released back to slack length and allowed to rest 12 min before the next stretch. To determine titin and collagen contribution to passive force, thick and thin filaments were extracted with KCl/KI (KCl 0.6 mM and KI 1 mM, respectively), from the sarcomere, removing titin’s anchors. The remaining force, assumed to be collagen-based, was subtracted from the pre-extraction forces to determine titin-specific forces (Brynnel et al., 2018).
Intact Muscle Contractility Experiments
For intact muscle experiments, fresh soleus and EDL muscles were used for their distinct tendons that make mechanical experiments possible and well known attributes as slow-twitch and fast-twitch muscles, respectively. Muscles were quickly dissected and, using silk suture, mounted vertically in a tissue bath between a dual-mode lever arm and a fixed hook (1200A Intact Muscle Test System, Aurora Scientific Inc., Canada). The muscle was bathed in continuously oxygenated (95% O2–5% CO2) mammalian Ringer solution (pH 7.4) and kept at a constant temperature (30°C) for the duration of the experiment. The muscle was stimulated directly with platinum plate electrodes placed in close apposition to the muscle. Muscle preload force was adjusted until optimal fiber length (L0) for maximal twitch force was achieved (pulse width of 200 ms).
Force-Frequency Protocol
Five minutes after completion of the passive tension protocol, the muscle was stimulated at various incremental frequencies (1, 5, 10, 20, 40, 60, 80, 100, 150, and 200 Hz). Stimuli were applied with a train duration of 400 ms and a 90 s interval. After completion of the contractility measurements, the weight of the muscle was determined. Cross-sectional area (in mm2) of the EDL and Soleus muscles was calculated using: CSA [cm2] = (muscle mass [g] × cos [θ])/(ρ [g × cm–3] × fiber length [cm]) (θ is the pennation angle and ρ is the physiological density of muscle) (Lieber and Ward, 2011).
A subset of these muscles was fixed at L0 by overnight immersion in 4% formaldehyde/1% glutaraldehyde. Intrinsic shrinkage was minimized by pinning the tissue during fixation. Thin full-length (tendon-tendon) fiber bundles were dissected from the fixed muscles and sarcomere length was measured by laser diffraction. The number of serial sarcomeres was calculated by dividing the length of the fiber bundles by the measured sarcomere length.
Western Blots
Samples were run on 0.8% SDS-AGE gels for titin or 12% SDS-PAGE for signaling proteins, and transferred to PVDF membrane using a semi dry transfer unit (Bio-Rad; United States). The blots were stained with Ponceau S to visualize total transferred protein. The blots were then probed with CSRP3/MLP, FHL1, MARP1, MARP2, Ttn C-term, Ttn N-term, Erk, Thr202/Tyr204 p-Erk, mTOR, S2481 p-mTOR, and GAPDH (see antibody table for details). Secondary antibodies conjugated with fluorescent dyes with near-infrared excitation spectra were used for detection. Two-color IR western blots were scanned (Odyssey Infrared Imaging System, Li-Cor Biosciences, United States) and the images analyzed with Image studio light (Li-Cor Biosciences). All proteins were normalized against GAPDH, and, subsequently, (for FO and HS samples) normalized to control samples (EDL or soleus) to determine relative changes in protein quantity.
Statistics
Data are presented as mean ± SEM. Significance was defined p < 0.05 as indicated in the figures. Statistical testing was performed using student t-test, one or two-way ANOVA as applicable. A linear model that accounts for experimental variability was used to analyze the microarray data. Curves were fitted for non-linear regression to determine the difference in fit between equations, an extra sum of squares F-test determined whether the data sets differed from each other.
Results
Titin-Based Passive Tension of TtnΔ219–225 Is Disproportionately Increased
Considering that the deleted exons 219–225 comprise a small fraction of the PEVK region of the titin gene (Figure 1A), the expected level of passive tension increase in TtnΔ219–225 skeletal muscle was assessed first. Calculations of the force per titin molecule using a worm-line chain model (see section “Materials and Methods”), showed a small predicted passive tension increase (Figure 1B) that within the 2.3-3.0 μm SL range [selected because it includes the physiological SL range (Burkholder and Lieber, 2001)] was on average 9.7% (17% at SL: 3.0 μm). Passive tension was measured next, using demembranated fiber bundles of soleus and extensor digitorum longus (EDL) muscles (Figures 1C,D). Soleus muscle displayed an increase in passive tension of 36 ± 2% and EDL 27 ± 10% (SL range 2.3–3.0 μm) and a level of 48 ± 5% and 41 ± 5% at SL 3.0 μm, i.e. ∼2-fold higher than titin-based passive tension predicted. Because changes in the extracellular matrix (ECM) also contribute to passive tension (Trombitas et al., 2003; Chung et al., 2011) this larger than expected measured passive tension could be due to an adaption in the ECM. To test this, passive tension was measured both before and after extraction of the thin and thick filaments (see section “Materials and Methods”), thereby removing titin’s anchors in the sarcomere and abolishing titin-based passive tension (Wang et al., 1993; Wu et al., 2000). These experiments provided both the total tension (titin and ECM) and the ECM-based passive tension (extraction insensitive tension) and from this the titin-based fraction was calculated (total passive tension minus ECM-based passive stiffness). This showed that the ECM-based passive tension in WT and TtnΔ219–225 muscles did not differ significantly but that titin-based tension solely accounted for the higher passive tension in TtnΔ219–225 muscles: 52 ± 11% and 62 ± 4% for soleus and EDL muscle, respectively, (at SL 3.0 μm, Figures 1C,D, striped lines; titin-based passive tension, dotted lines; ECM-based passive tension). Thus, the large increase in passive tension in TtnΔ219–225 muscles is likely titin-based and the increase is much higher than predicted based on the deletion of PEVK exons 219–225.
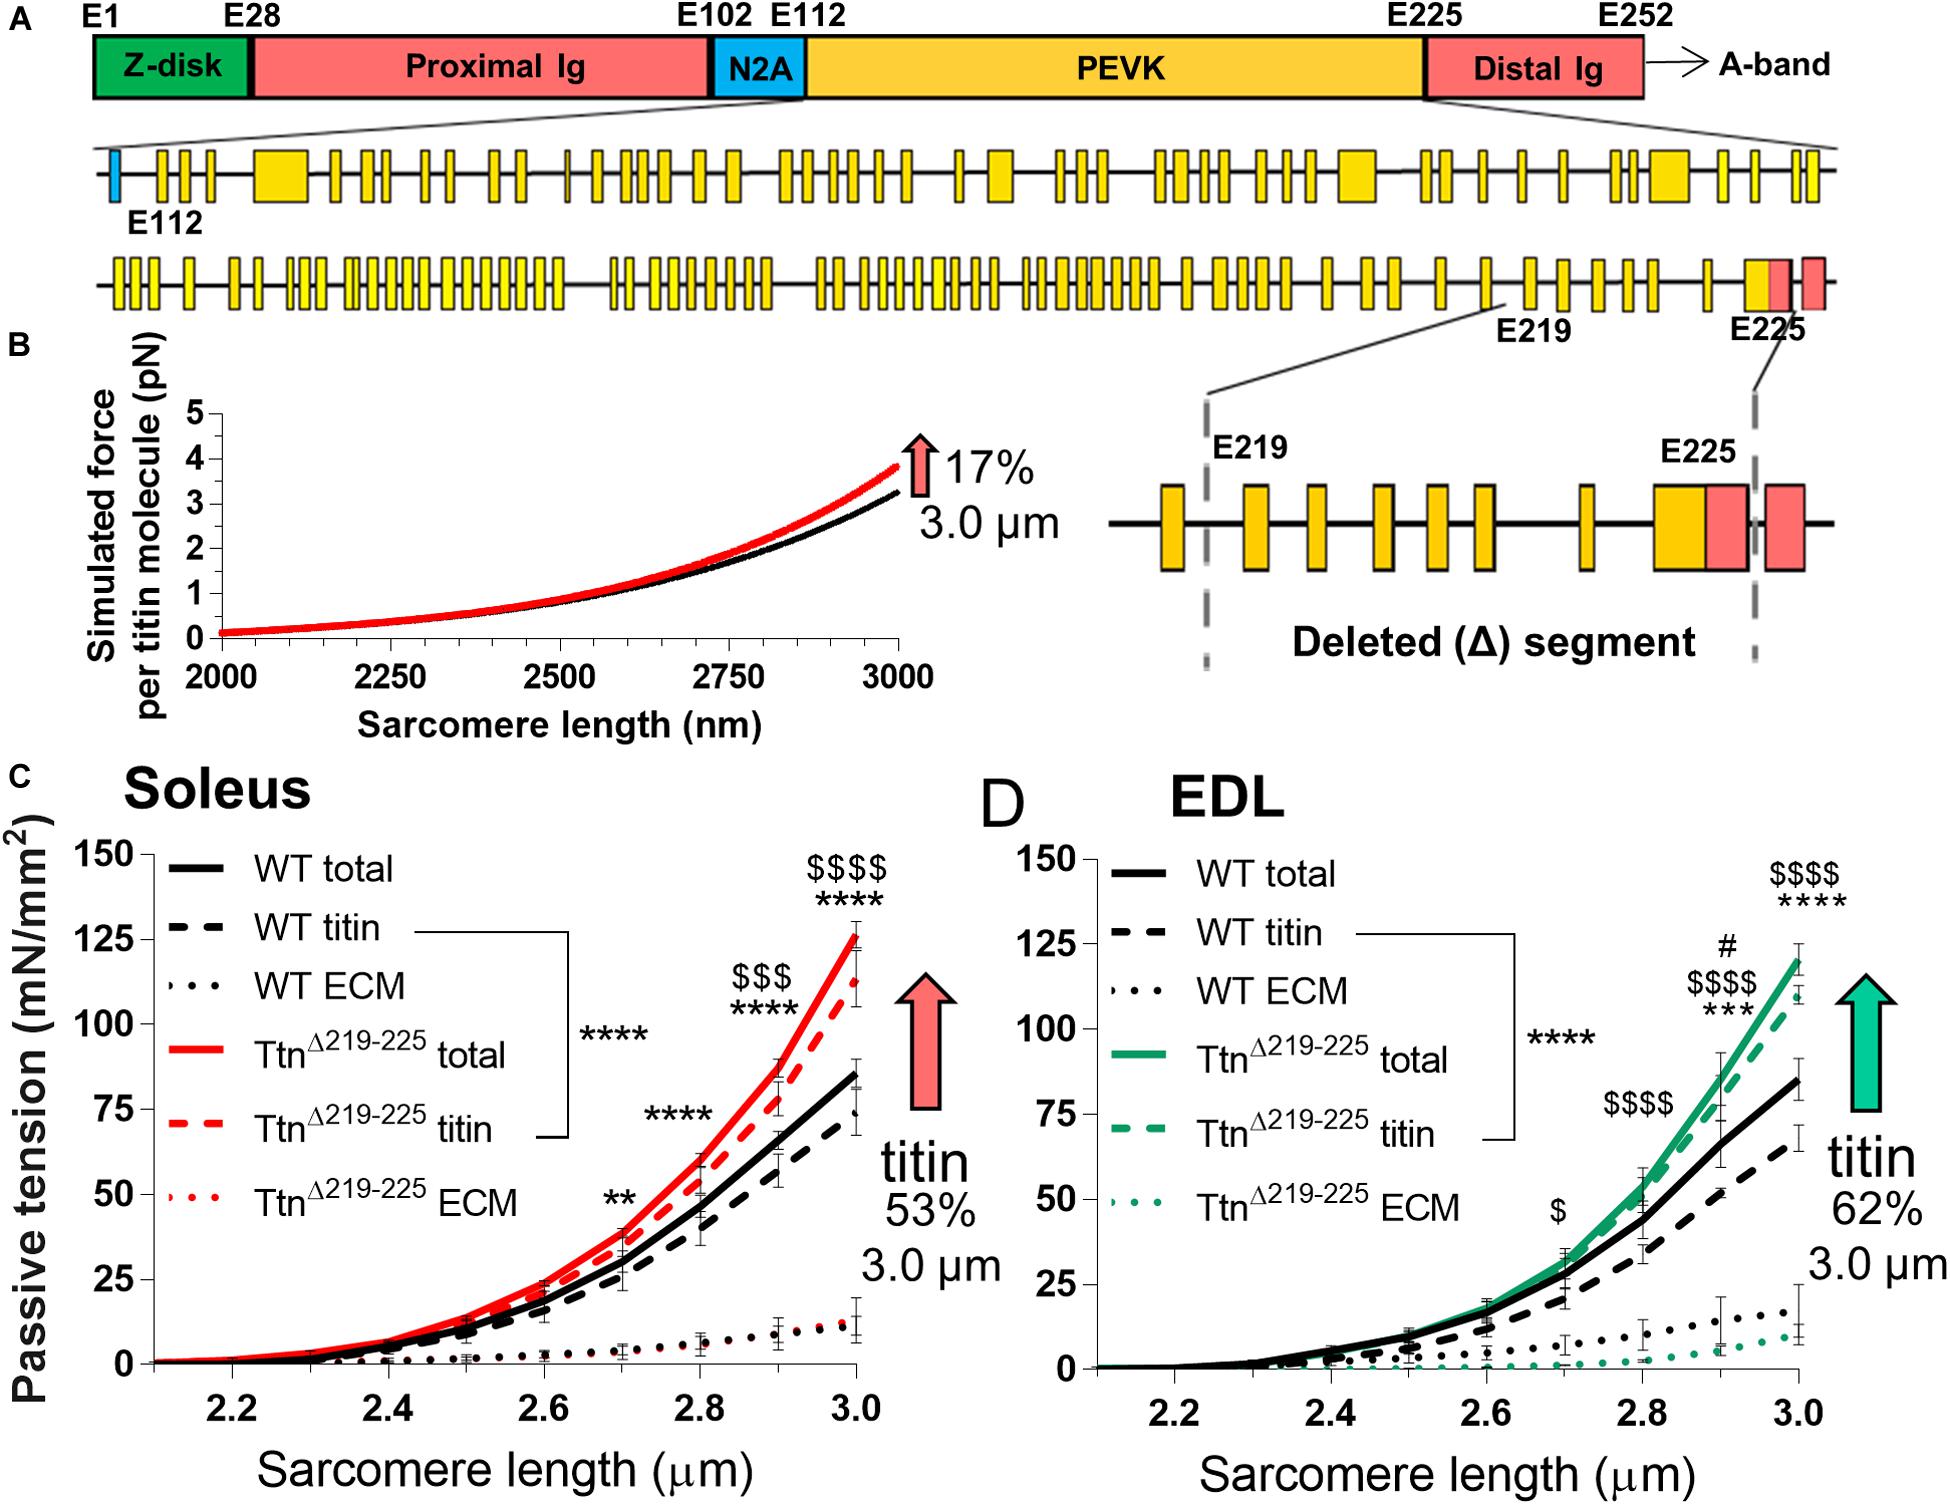
Figure 1. Passive tension in TtnΔ219–225 mice. (A) Schematic of titin’s I-band region, with exon composition of PEVK segment (below) and detailed facet of deleted segment (bottom-right), (Yellow: PEVK exons; red: Ig domains, blue: unique sequence). (B) Simulated titin tension for wildtype (WT; black line) and TtnΔ219–225 (red line), showing a minimal increase in passive tension (17% at SL 3.0 μm). The increase in passive tension was substantially higher in skinned soleus (C; 53%) and EDL (D; 62% at SL 3.0 μm). The increase in tension is due to changes in titin-based passive tension (curve fit p < 0.0001) and minor changes in extracellular matrix (ECM; n = 4 mice; t-test p-value: *total passive tension, $titin-based passive tension, #ECM-based tension; *p < 0.05, **p < 0.01, ***p < 0.001, ****p < 0.0001).
Aberrant Titin Splicing in Skeletal Muscle of TtnΔ219–225 Mice
To explain the higher than expected titin-based passive tension in the TtnΔ219–225 muscles, we first performed SDS-AGE to assess titin at the protein level. Expression levels of titin and myosin heavy chain (MyHC) in TtnΔ219–225 mice were not different in either soleus or EDL muscle (Figure 2). EDL muscle appears to contain more titin, compared to soleus muscle. As the current sarcomere models predict a defined number (6) of titin molecules per sarcomere (Granzier and Irving, 1995; Liversage et al., 2001), it is possible that EDL has a larger pool of unincorporated titin molecules. In TtnΔ219–225 soleus and EDL muscles the presence of a second titin band was detected just below the N2A titin band, referred to as N2A2 (Figure 3A). We performed western blots to study whether this N2A2 band was either a truncation or a smaller full-length titin isoform. Both the titin N-term and the C-term antibodies stained this lower band (Figure 2A, Bottom panels), indicating that it represents a full-length titin isoform. Quantitative analysis showed that N2A2 is ∼20% of total titin in soleus muscle and ∼10% in EDL muscle (Figure 3A, right panels). To study N2A2 titin at the transcript level, custom titin exon microarrays were used to determine changes in exon inclusion in TtnΔ219–225 muscles compared to wildtype (WT) mice. Results for both the soleus and EDL muscles confirmed the expected deletion of exons 219–225 and revealed additional splicing in primarily the PEVK region of titin (Supplementary Table 1). Changes in titin Z-disc splicing were also detected (consistent with fiber type switching, see below), as well as minor changes in the proximal Ig-segment, but exon expression was unaltered in the A-band segment of titin (Supplementary Table 1). The additional splicing in the PEVK segment is calculated to give a size shift of 71.5 kDa in soleus (Figure 3B, left) and 39.3 kDa in EDL titin (Figure 3B, right). SDS-AGE gels revealed comparable titin migration patterns between soleus and EDL muscles (Figure 3A), and showed that TtnΔ219–225 soleus has more N2A2 (20.6 ± 2.9%; Figure 3A, right panels) compared to EDL (11.5 ± 1.0%). The low N2A2 transcript levels in EDL limited the detection capacity by the titin microarray, suggesting that the N2A2 isoform is likely similar between soleus and EDL. To illustrate the potential effect of the N2A2 isoform on passive tension, we repeated the WLC for N2A2 (Supplementary Figure 1). At 100% N2A2 expression levels the passive tension is substantially increased, whereas at 20% N2A2 expression levels (similar to soleus levels) passive tension is moderately increased. This supports the notion that N2A2 contributes to the higher than expected passive tension observed in Figures 1C,D. Subsequently, we explored whether Rbm20, a titin splice factor (Guo et al., 2012; Li et al., 2013; Buck et al., 2014), regulates the splicing of N2A2 titin. Western blot analyses revealed a trending increase in Rbm20 levels in TtnΔ219–225 soleus (P = 0.11; Figure 3C; left panel) and significantly increased Rbm20 levels in EDL (P > 0.01; Figure 3C; right panel). To further establish that Rbm20 controls N2A2 splicing in vivo, we crossed the TtnΔ219–225 (homozygous) mouse with the Rbm20ΔRRM (heterozygous) mouse model and studied titin isoform expression. The data reveal that reducing Rbm20 levels results in soleus and EDL muscles with single mutant N2A isoforms (Figure 3D). This confirms that the aberrant splicing of titin in the TtnΔ219–225 mouse model is due to altered regulation of Rbm20.
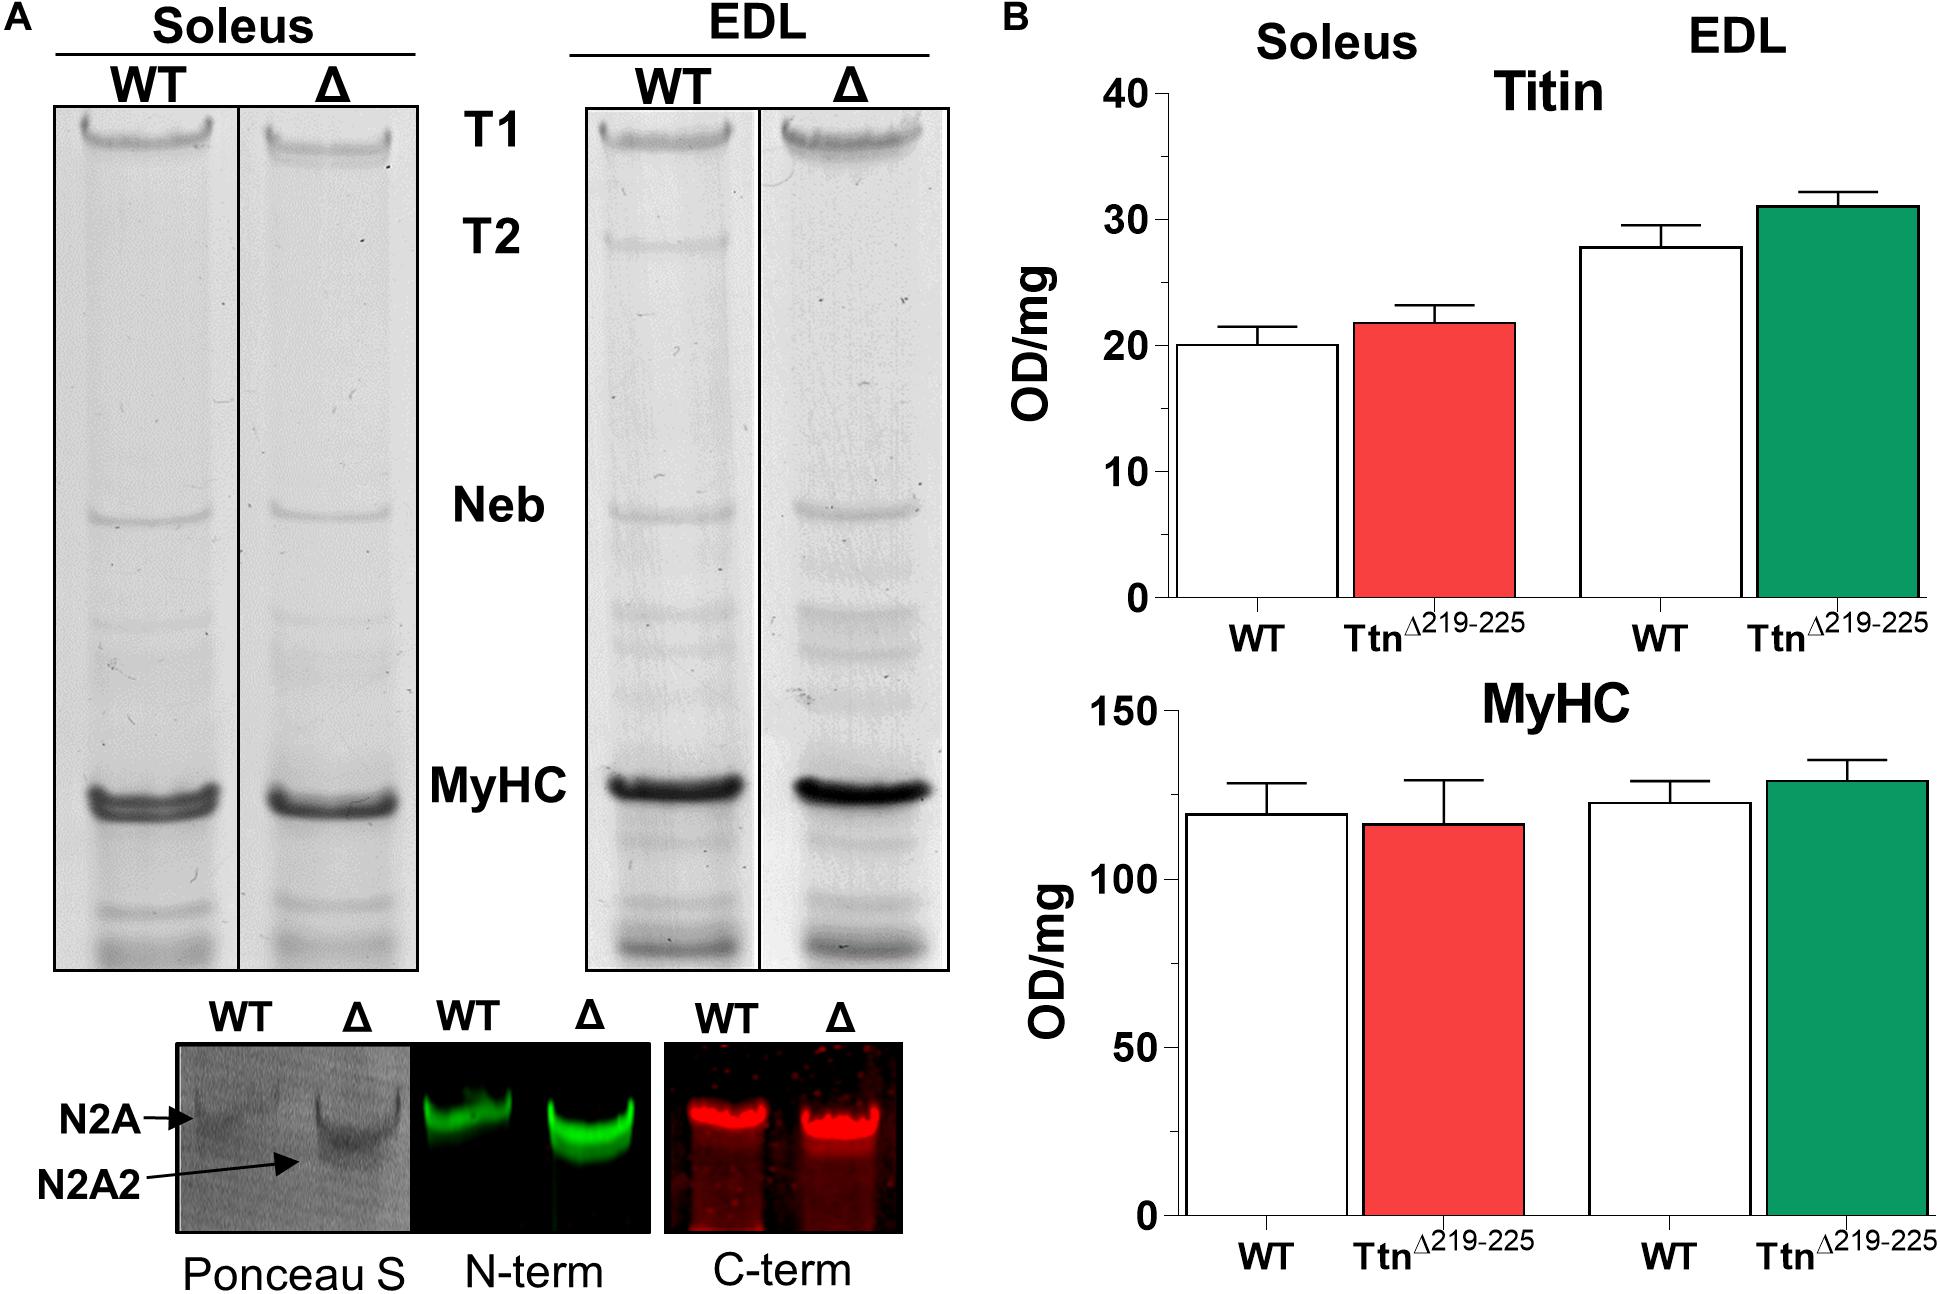
Figure 2. Titin in skeletal muscles of TtnΔ219–225 mice. (A) Representative gel images of soleus (left) and EDL (right) TtnΔ219–225 mice show a second band below the mutant N2A isoform, that is detected by both N- and C-terminal titin antibodies on Western blot, making it a full length titin isoform: N2A2 (left image: Ponceau S; middle: Z1–Z3 antibody, N-term titin. Right: M8M9 antibody, C-term titin). (B) Quantification of total titin (top graph) and myosin heavy chain (below), showing no changes in content between wildtype (WT) and TtnΔ219–225 content. OD: optical density.
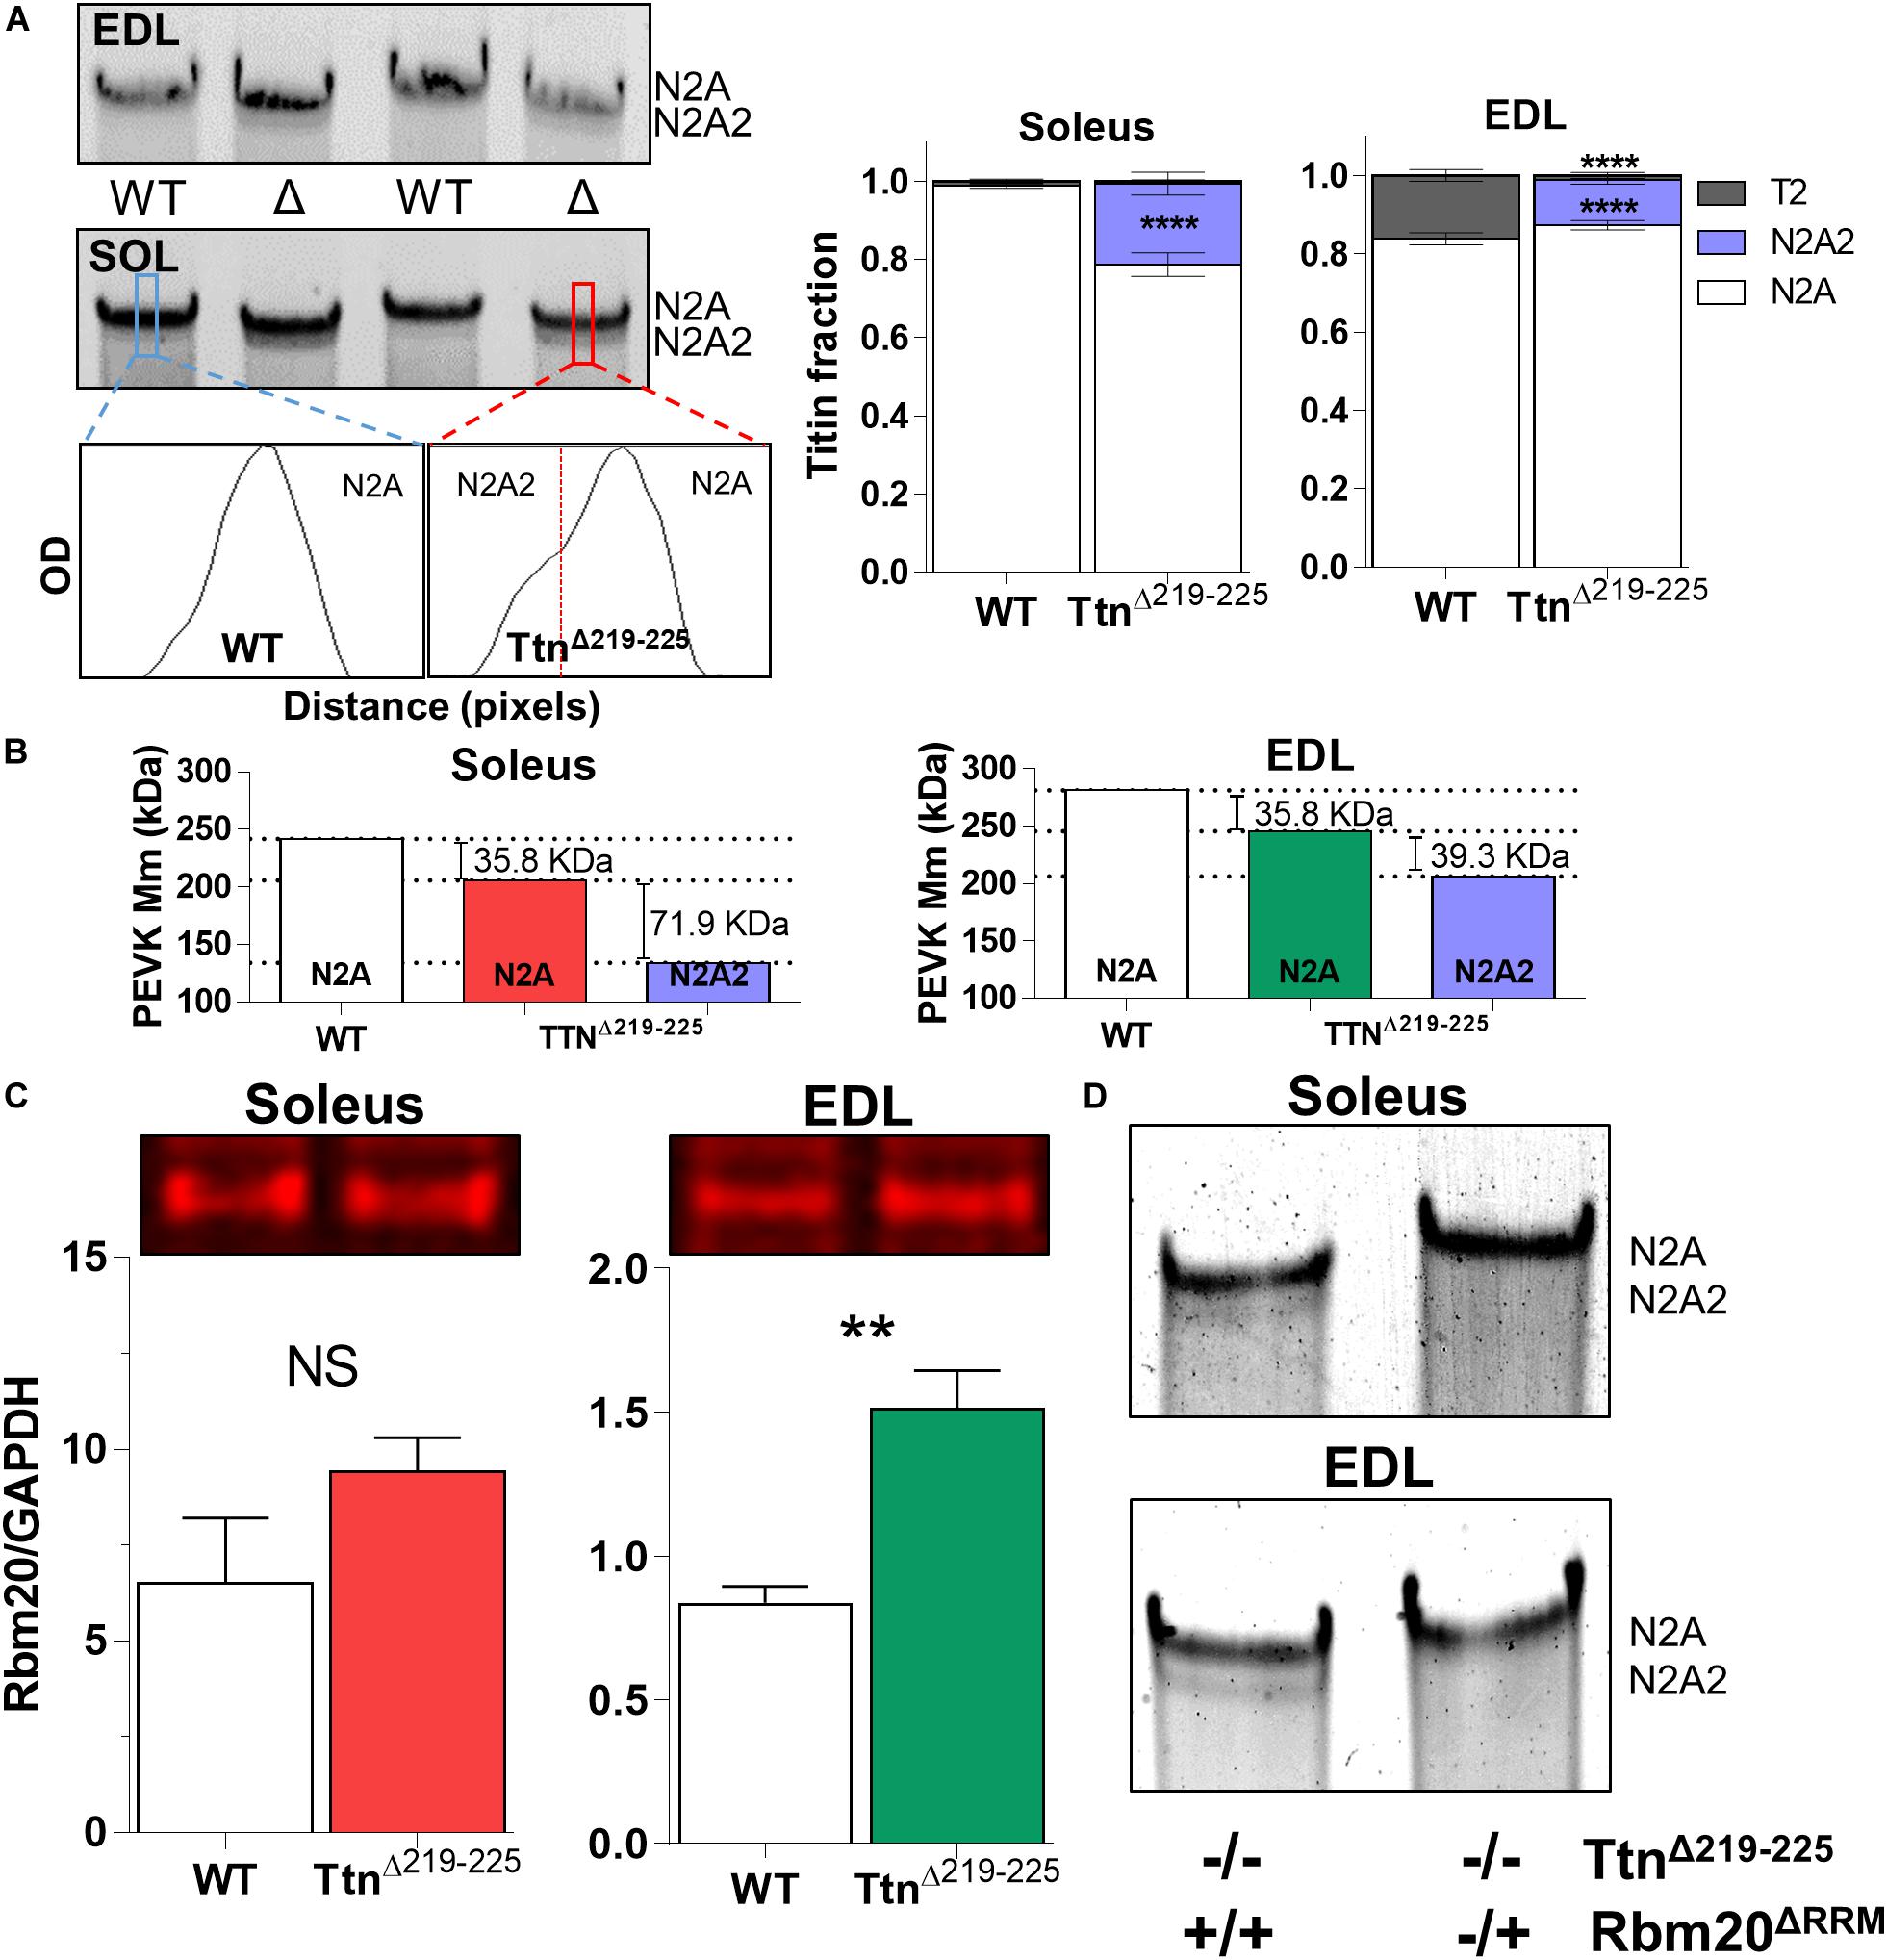
Figure 3. N2A2 titin is an alternative splice isoform, under control of Rbm20. (A) Representative detail gel images of EDL (top) and Soleus (middle), and densitometry profiles (below) of wildtype and TtnΔ219–225 soleus muscle, showing the N2A2 isoform. Quantification of the N2A2 isoform as a ratio over total titin [TT; N2A, N2A2 and titin degradation products (T2)], showing 15-20% of total titin consists of N2A2 (****p < 0.0001 t-test). Soleus muscle also has a higher quantity (*p < 0.05, t-test) of N2A2 titin compared to EDL muscle. (B) Calculated effect of titin splicing on molecular mass of the PEVK-region of soleus (left) and EDL (right) muscle, as determined by custom titin gene array (N = 7–8 for each muscle; both female and male mice). Splicing in the I-band, showing additional splicing in primarily the PEVK region, A-band segment was unaffected (see Supplementary Table 1). (C) Western blots show an increase in Rbm20 levels in EDL (**p < 0.01, t-test) and a trending increase in soleus (N = 4–5 for each muscle). (D) Soleus and EDL muscles (N = 3) from homozygous (−/−) TtnΔ219–225 mice crossed with heterozygous (±) Rbm20ΔRRM (inactivated splice activity) mice, show that Rbm20 controls N2A2 expression.
TtnΔ219–225 Muscles Display Changes in Active Tension, With Faster Tension Kinetics
To determine if the increased passive tension of TtnΔ219–225 muscles affected active tension (Horowits and Podolsky, 1987), intact soleus and EDL muscles were electrically stimulated at L0, defined as the length of the muscle at which they produce the highest maximum tetanic force. Soleus muscle (Figure 4A, left) showed a pronounced increase in tetanic tension (240 ± 9 mN/mm2 in WT to 276 ± 17 mN/mm2; stimulation frequency 150 Hz), caused by hypertrophy (discussed below). In contrast, the EDL muscle (Figure 4A, right) showed a decrease in tetanic tension (315 ± 9 in WT to 280 ± 14 in TtnΔ219–225; stimulation frequency 200 Hz). Thus, in the TtnΔ219–225 mice, the maximal force generating capacity is differently affected in soleus than in EDL muscle.
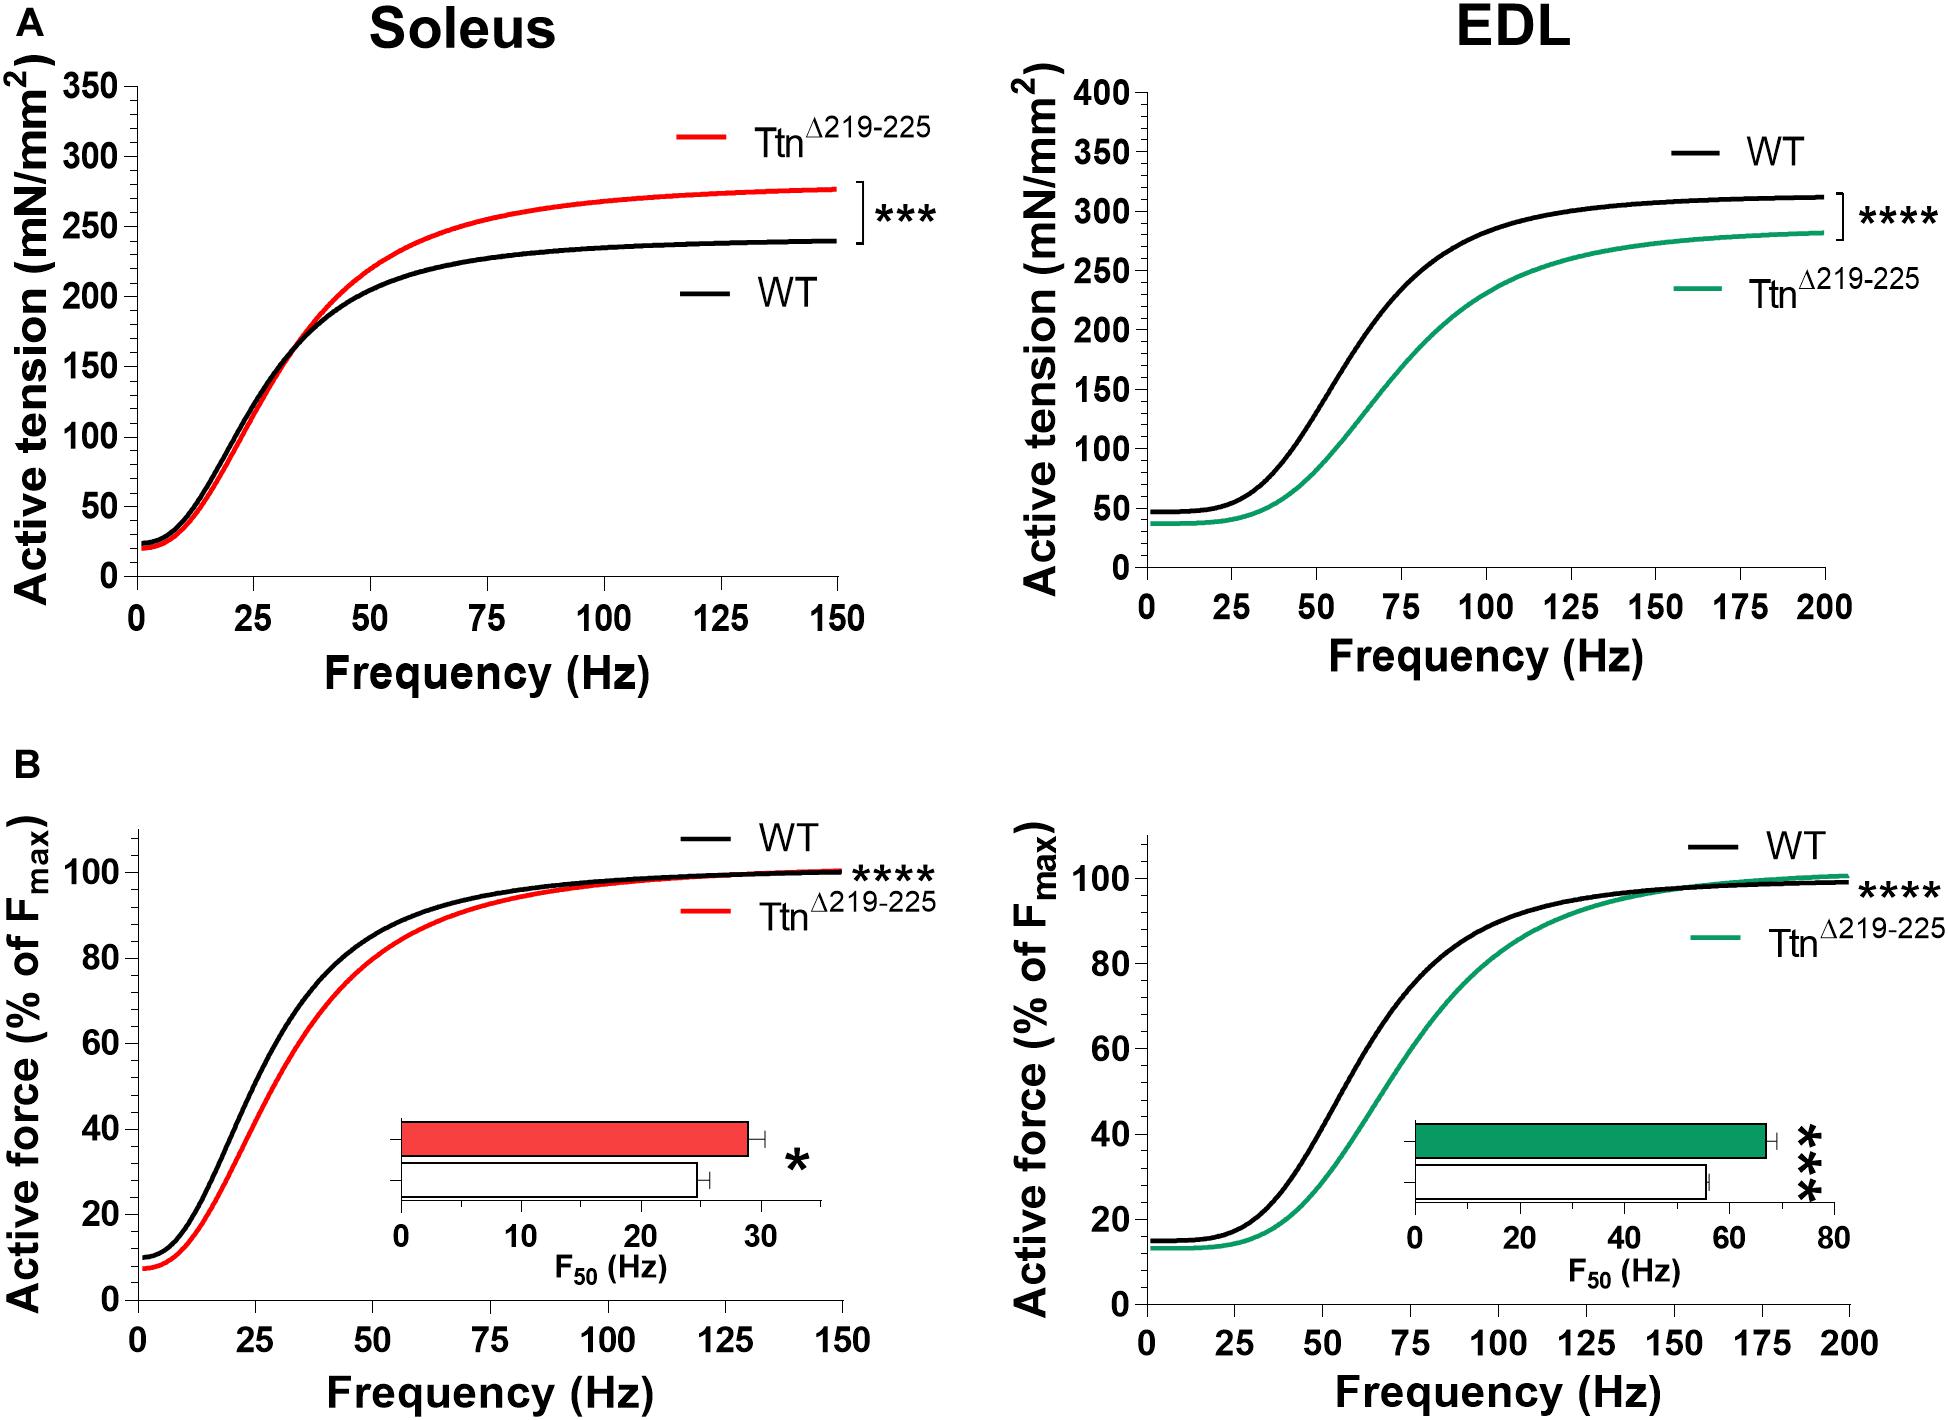
Figure 4. Muscle contractility of TtnΔ219–225 mice. (A) curve fit of the active tension-stimulation frequency relation for soleus (left; WT, black line; TtnΔ219–225 red line) and EDL (right; WT, black line; TtnΔ219–225 green line), respectively, (N = 6–7, males; soleus maximal stimulation frequency: 150 Hz, and EDL: 200 Hz). (B) Curve fit in which active force is expressed as a % of maximum force for soleus (left) and EDL (right); insert depicts the frequency that produces 50% of the maximum active tension (F50). Curve fit; ***p < 0.001, ****p < 0.0001 and inserts t-test; *p < 0.05, ***p < 0.001.
The tension-frequency relations, when normalized to maximum force, of both soleus and EDL muscles from TtnΔ219–225 mice were shifted rightward (Figure 4B). Consequently, the F50, the frequency at which the force is at 50% of maximum, was increased in both soleus (Figure 4B insert; 24.7 ± 1.0 Hz in WT to 28.9 ± 1.4 Hz in TtnΔ219–225) and EDL (Figure 4B insert; 55.5 ± 0.6 Hz WT to 67.0 ± 2.0 Hz in TtnΔ219–225). Tension-frequency relations were also obtained from female mice and similar trends were observed, except in female soleus muscle, where F50 was not different (Supplementary Figure 2), a peculiarity we discuss further in the discussion section.
The kinetics of force generation and force relaxation kinetics were studied during isometric twitch and maximal tetanic contractions. Soleus muscle (Figure 5A) showed reduced time to maximal tension during twitch contractions (28.3 ± 0.5 ms in WT; 26.6 ± 0.5 ms in TtnΔ219–225, p = 0.035) and a minor reduction during maximal tetanic contractions (1002 ± 1 ms in WT to 999 ± 1 ms in TtnΔ219–225, p = 0.026). Similarly, in EDL (Figure 5B) the time to maximal tension was reduced during twitch contractions (14.6 ± 0.3 in WT; 13.2 ± 0.3 in TtnΔ219–225, p = 0.007). The time to maximal tension during tetanic contractions was not different (165 ± 13 in WT; 176 ± 13 in TtnΔ219–225). The relaxation kinetics (time for tension to reduce by 50%) followed similar temporal shifts. Soleus muscle showed reduced time to half relaxation during twitch contractions (32.5 ± 0.5 ms in WT to 26.9 ± 0.5 ms in TtnΔ219–225, p = 0.0228) and similarly during tetanic contractions (87.3 ± 2 ms in WT to 72.1 ± 2 ms in TtnΔ219–225, p = 0.0007). In EDL, the time to half relaxation was reduced during twitch contraction (9.7 ± 0.6 in WT to 7.9 ± 0.2 in TtnΔ219–225, p = 0.0109) and during tetanic contraction (37.8 ± 0.2 in WT to 33.6 ± 0.7 in TtnΔ219–225, p = 0.0002).
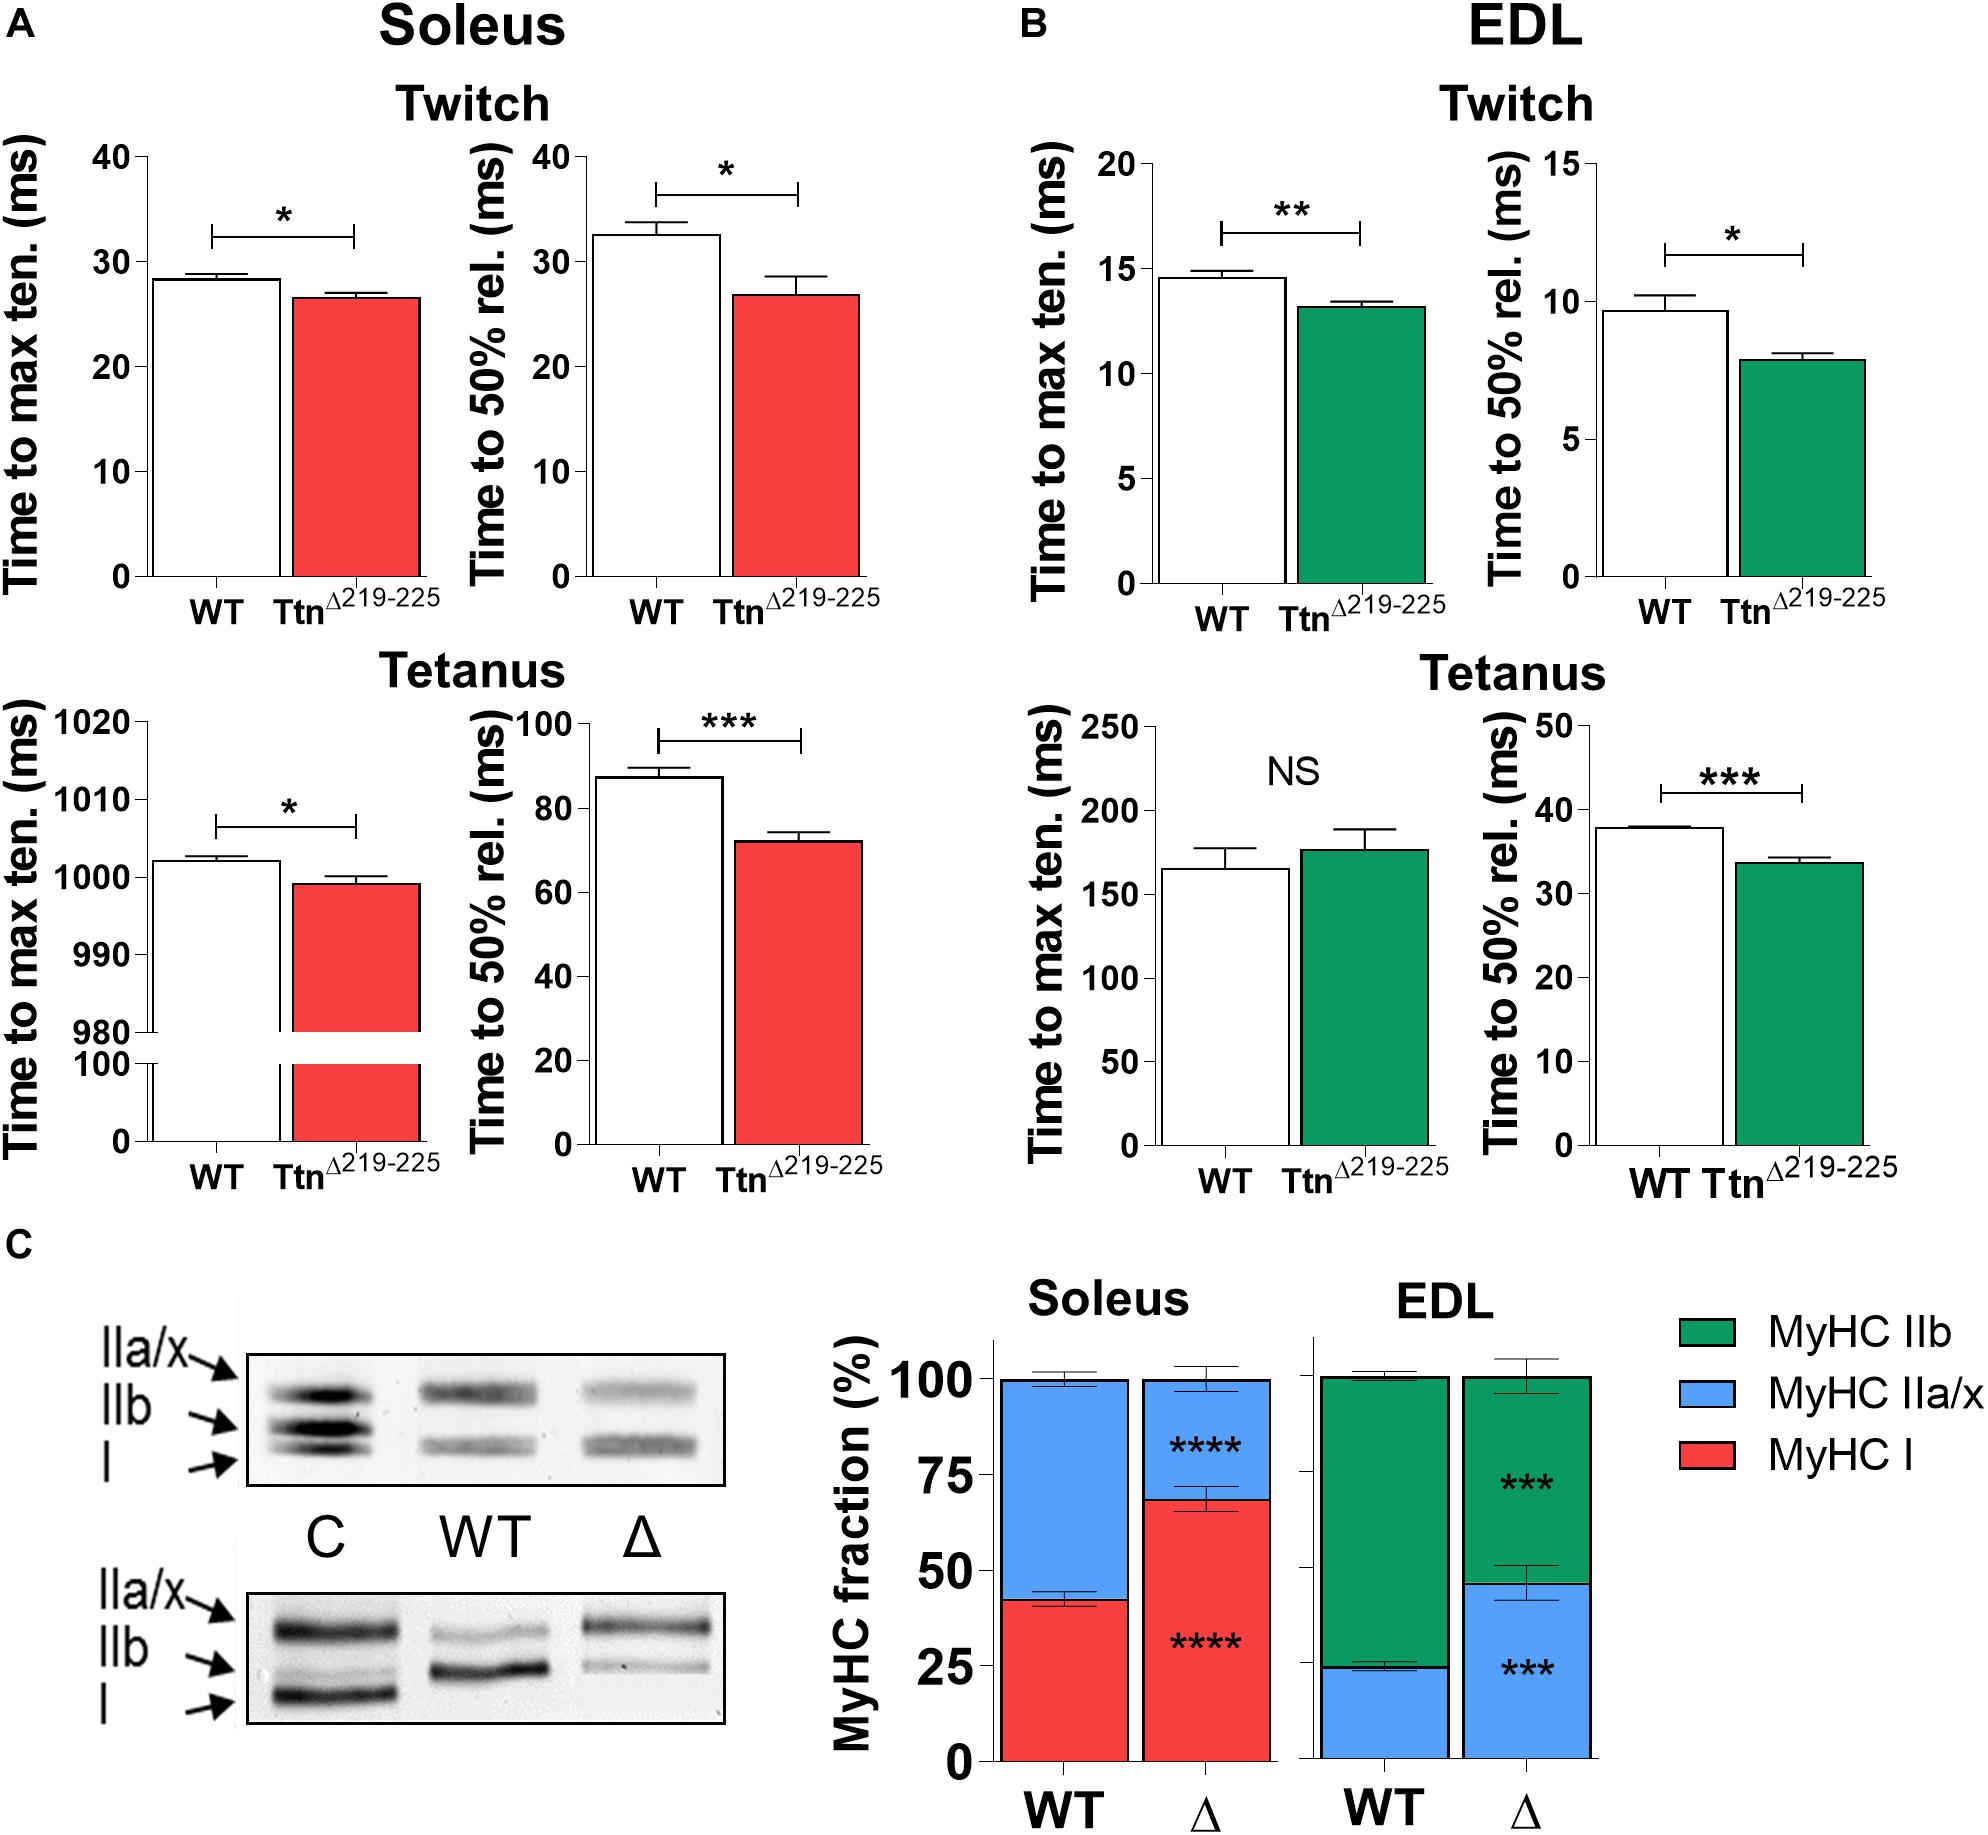
Figure 5. Kinetics of TtnΔ219–225 muscles. Both soleus (A; N = 6–7) and EDL (B; N = 6–7) display increased contractile (left panel; time to maximum tension) and relaxation (right panel; time to 50% relaxation) kinetics during isometric twitch stimulations (top panels; 1 Hz). Only soleus shows similar increases in maximal tetanic stimulations (bottom panels; 150 Hz in soleus and 200 Hz in EDL) for time to maximal tension, a likely result from the fiber type switch seen in Figure C. Relaxation rate is also increased by 17% in the soleus and 11% in the EDL, suggesting the higher titin-based passive tension speeds up contractile and relaxation kinetics. (C) The kinetic changes coincided with a shift in myosin heavy chain (MyHC) type, showing a slow shift in both muscles of TtnΔ219–225 mice (N = 8–10, males and females; representative MyHC gel of soleus; top, and EDL; bottom). C = wildtype tibialis/soleus mix used as running control to show successful separation of MyHC isoforms. t-test; *p < 0.05, **p < 0.01, ***p < 0.001 and NS, not significant.
To study whether the increase in F50 and the faster tension kinetics reflected a change in fiber type composition, the MyHC isoform composition of muscles was determined. Unexpectedly, soleus shifted from 42.6 ± 1.9% type I MyHC in WT to 68.7 ± 3.3% type I MyHC in TtnΔ219–225 and EDL from 75.8 ± 1.1% type IIb MyHC in WT to 54.0 ± 4.5% type IIb MyHC in TtnΔ219–225 (Figure 5C). The changes in fiber type correlate with the titin exon data (Supplementary Table 1), as slow-type muscle fibers have wider Z-discs and are expected therefore to express additional titin Z-repeats (Gregorio et al., 1998). However, the effect of this fiber type shift on F50 and tension kinetics is opposite of what was observed, i.e. a shift to slower fiber types lowers the F50 and slows tension kinetics (see section “Discussion”).
Hypertrophy Sensitization of TtnΔ219–225 Muscles
The effect of deleting exons 219–225 on skeletal muscle trophicity was also studied. Muscle mass (Figures 5A,B, left panel) was significantly higher in TtnΔ219–225 soleus muscles of 3.5-month-old males (9.9 ± 0.4 mg in WT, 11.1 ± 0.4 mg in TtnΔ219–225, p = 0.021), an increase that is absent in EDL muscle (10.4 ± 0.3 mg in WT to 10.6 ± 0.6 mg in TtnΔ219–225). This higher muscle mass was also present in soleus muscle of 6-months-old males (9.3 ± 0.4 mg in WT to 13.2 ± 0.6 mg in TtnΔ219–225, p > 0.0001), whereas EDL was not different between genotypes (10.8 ± 0.3 mg in WT to 11.2 ± 0.8 mg in TtnΔ219–225). To further study if this difference in muscle mass was dependent on muscle type, we also determined the mass of two other predominantly fast-twitch muscles: tibialis cranialis (TC) and diaphragm (DIA) muscles. At 3.5-months-old, both TC (49.5 ± 1.3 mg in WT; 51.3 ± 1.3 mg in TtnΔ219–225) and DIA (80.8 ± 3.0 mg in WT; 87.4 ± 3.7 mg in TtnΔ219–225) muscles were not different. However, at 6-months-old (Figure 6, right panels) there was a significantly higher muscle mass in the TC (45.0 ± 1.6 mg in WT; 54.7 ± 2.2 mg in TtnΔ219–225, p = 0.0023) and a trending increase in the DIA (84.2 ± 6.3 mg in WT; 95.6 ± 4.4 mg in TtnΔ219–225, p = 0.1094). These findings suggest that the hypertrophy is not limited to predominantly slow-twitch muscles, and the mass increase in soleus (2-way ANOVA, p = 0.0123) and TC (2-way ANOVA, p = 0.0264) is progressive, hinting at a continuously active hypertrophy program. TtnΔ219–225 male mice display early growth deficits, with a reduced body weight (Figure 6A, side panels) and a more diminutive skeleton size (as determined by tibia length measurements), which disappears at 6 months of age (Figure 6, right side panels). Female mice (Supplementary Figure 3), follow similar trends in muscle mass as males.
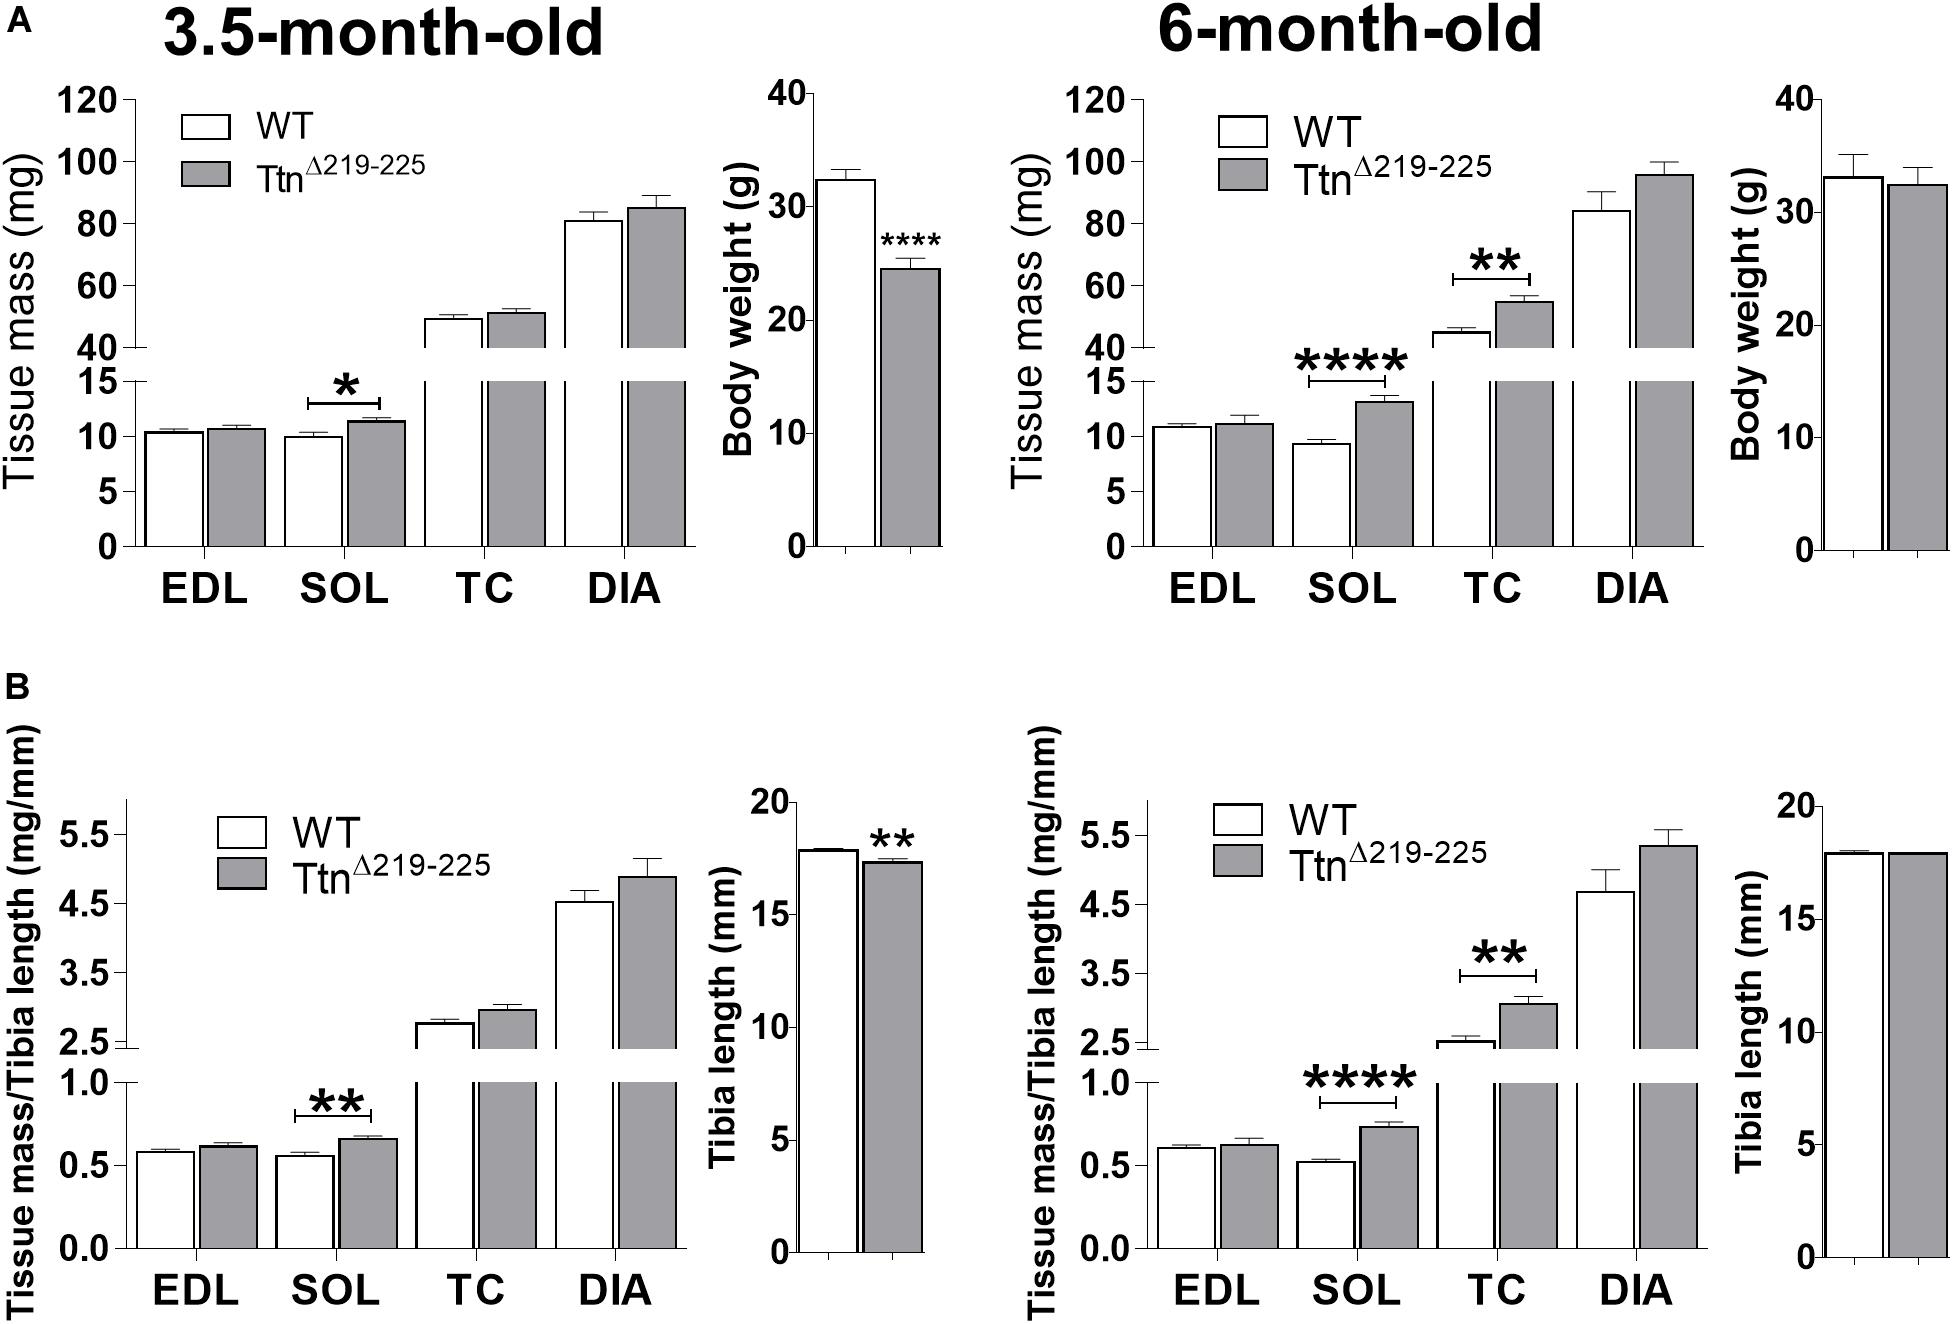
Figure 6. Muscle morphometric analysis. Absolute muscle weights of both 3.5-months (left) and 6-month (right) old male mice (A,B). TtnΔ219–225 mice display an early weight and skeletal system growth deficit [side panels (A,B), respectively], compared to wildtype litter mates, which normalizes at 6 months of age (N = 11–14). Muscle weights are generally unaffected early on, except in the soleus (p < 0.01), with progressive increases in muscle mass as the mice age. t-test; *p < 0.05, **p < 0.01, ***p < 0.001, and ****p < 0.0001.
To study whether longitudinal hypertrophy contributed to the higher muscle mass in TtnΔ219–225 muscles, we assessed the number of sarcomeres in series. We measured sarcomere lengths in formaldehyde fixed soleus and EDL set to their L0 lengths. Note that L0 was not different between WT and TtnΔ219–225 muscles (Figure 7A). Sarcomere length was significantly shorter in soleus (TtnΔ219–225 2.42 ± 0.04 μm versus WT 2.76 ± 0.08 μm) and not different in EDL (and TtnΔ219–225 2.44 ± 0.06 μm versus WT 2.56 ± 0.10 μm; Figure 7B). Sarcomere length heterogeneity was comparable between wildtype soleus (coefficient of variation [CV] 7.82%) and EDL (CV 9.97%). There was less heterogeneity in the TtnΔ219–225 (CV, SOL 4.76% and EDL 6.77%) muscles compared to WT. The sarcomere length data, taken together with the muscle length at L0, show that TtnΔ219–225 muscles have significantly more sarcomeres in series: TtnΔ219–225 soleus 4764 ± 95 versus WT soleus 4105 ± 154, EDL TtnΔ219–225 6031 ± 97 versus EDL WT 5572 ± 139. This represents a 16% increase in serial sarcomeres in the soleus and 8% in the EDL (Figure 7C; top and bottom panels, respectively).
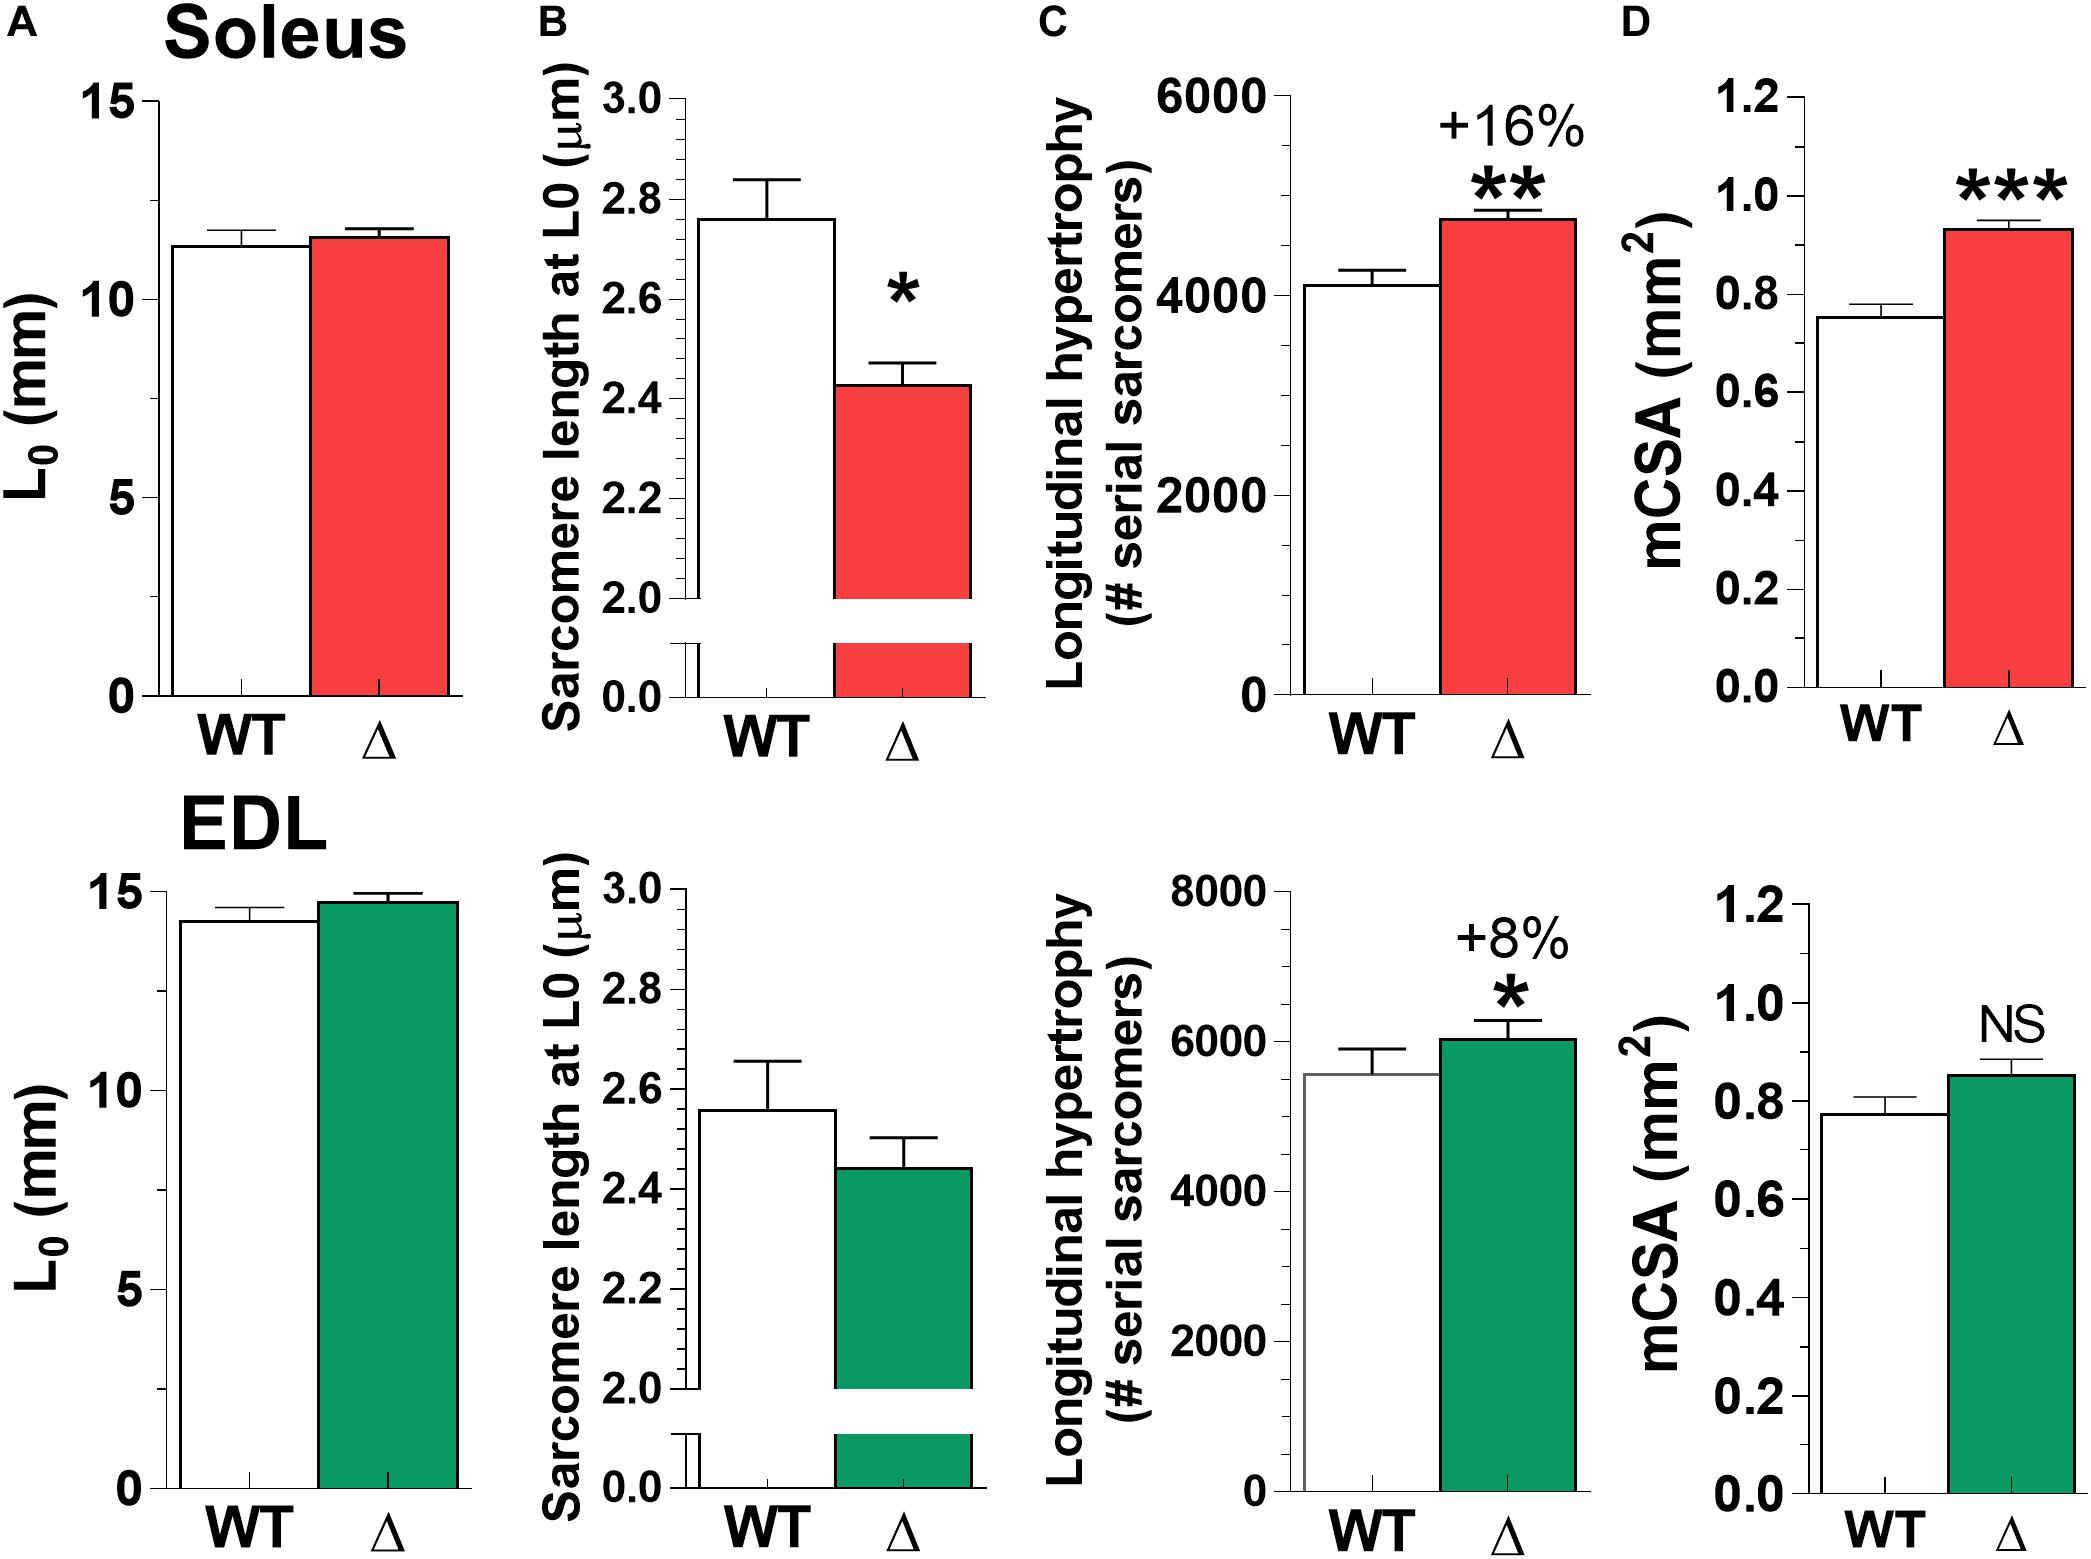
Figure 7. Longitudinal hypertrophy. To study whether longitudinal hypertrophy contributed to the mass increase (Figure 6), we used the L0 (A) and sarcomere length (SL; B), determined for Figure 4 and calculated the number of serial sarcomeres in both soleus (C; top panel) and EDL (bottom panel). Both TtnΔ219–225 soleus and EDL have significantly more sarcomeres in series (*p < 0.05, **p < 0.01), with soleus having significantly (*p < 0.05) shorter sarcomeres at L0. (D) Muscle CSA was measured in passive muscles held at optimum length (L0). Soleus displayed cross-sectional hypertrophy, whereas CSA in EDL is unchanged (N = 6–7, males).
In addition to longitudinal hypertrophy, we assessed muscle cross-sectional hypertrophy as a contributor to higher muscle mass. Soleus muscle showed significant increases in mCSA (TtnΔ219–225 0.93 ± 0.02 mm2 versus WT 0.75 ± 0.03 mm2, p < 0.001). In EDL no difference in mCSA was observed (Figure 7D). We also assessed gross morphology of both soleus and EDL muscle in H/E stained sections, and found muscles to display normal morphology, with increased fiber size in the soleus (Supplementary Figure 4). Thus, the 24% increase in mCSA of soleus, together with the increase in the number of serial sarcomeres, explains the higher muscle mass of soleus than of EDL.
To gain insight in the signaling mechanisms underlying hypertrophy of soleus muscle, Western blots were performed probing for titin-associated signaling proteins involved in trophic signaling [CSRP3, FHL1, MARP1, and MARP2] and proteins involved in protein synthesis pathways [Erk and mTOR] (Figure 8). Several proteins were upregulated (fold-increase compared to WT): CSRP3 (SOL 5.3 ± 0.1; EDL 13.9 ± 3.7), FHL1 (SOL 2.4 ± 0.4; EDL 6.3 ± 1.3), MARP1 (SOL 3.2 ± 0.4; EDL 2.9 ± 1.0), MARP2 (SOL 5.3 ± 0.1; EDL 13.9 ± 3.7), and Erk (SOL 0.6 ± 0.3; EDL 2.4 ± 0.8). Three of these proteins showed significant differences between soleus and EDL muscle: CSRP3, FHL1, and MARP2. Interestingly, these three proteins are all more strongly expressed in TtnΔ219–225 EDL muscle, compared to TtnΔ219–225 soleus muscle. As EDL does not show an increase in muscle mass, these proteins are unlikely to play a critical role in soleus hypertrophy.
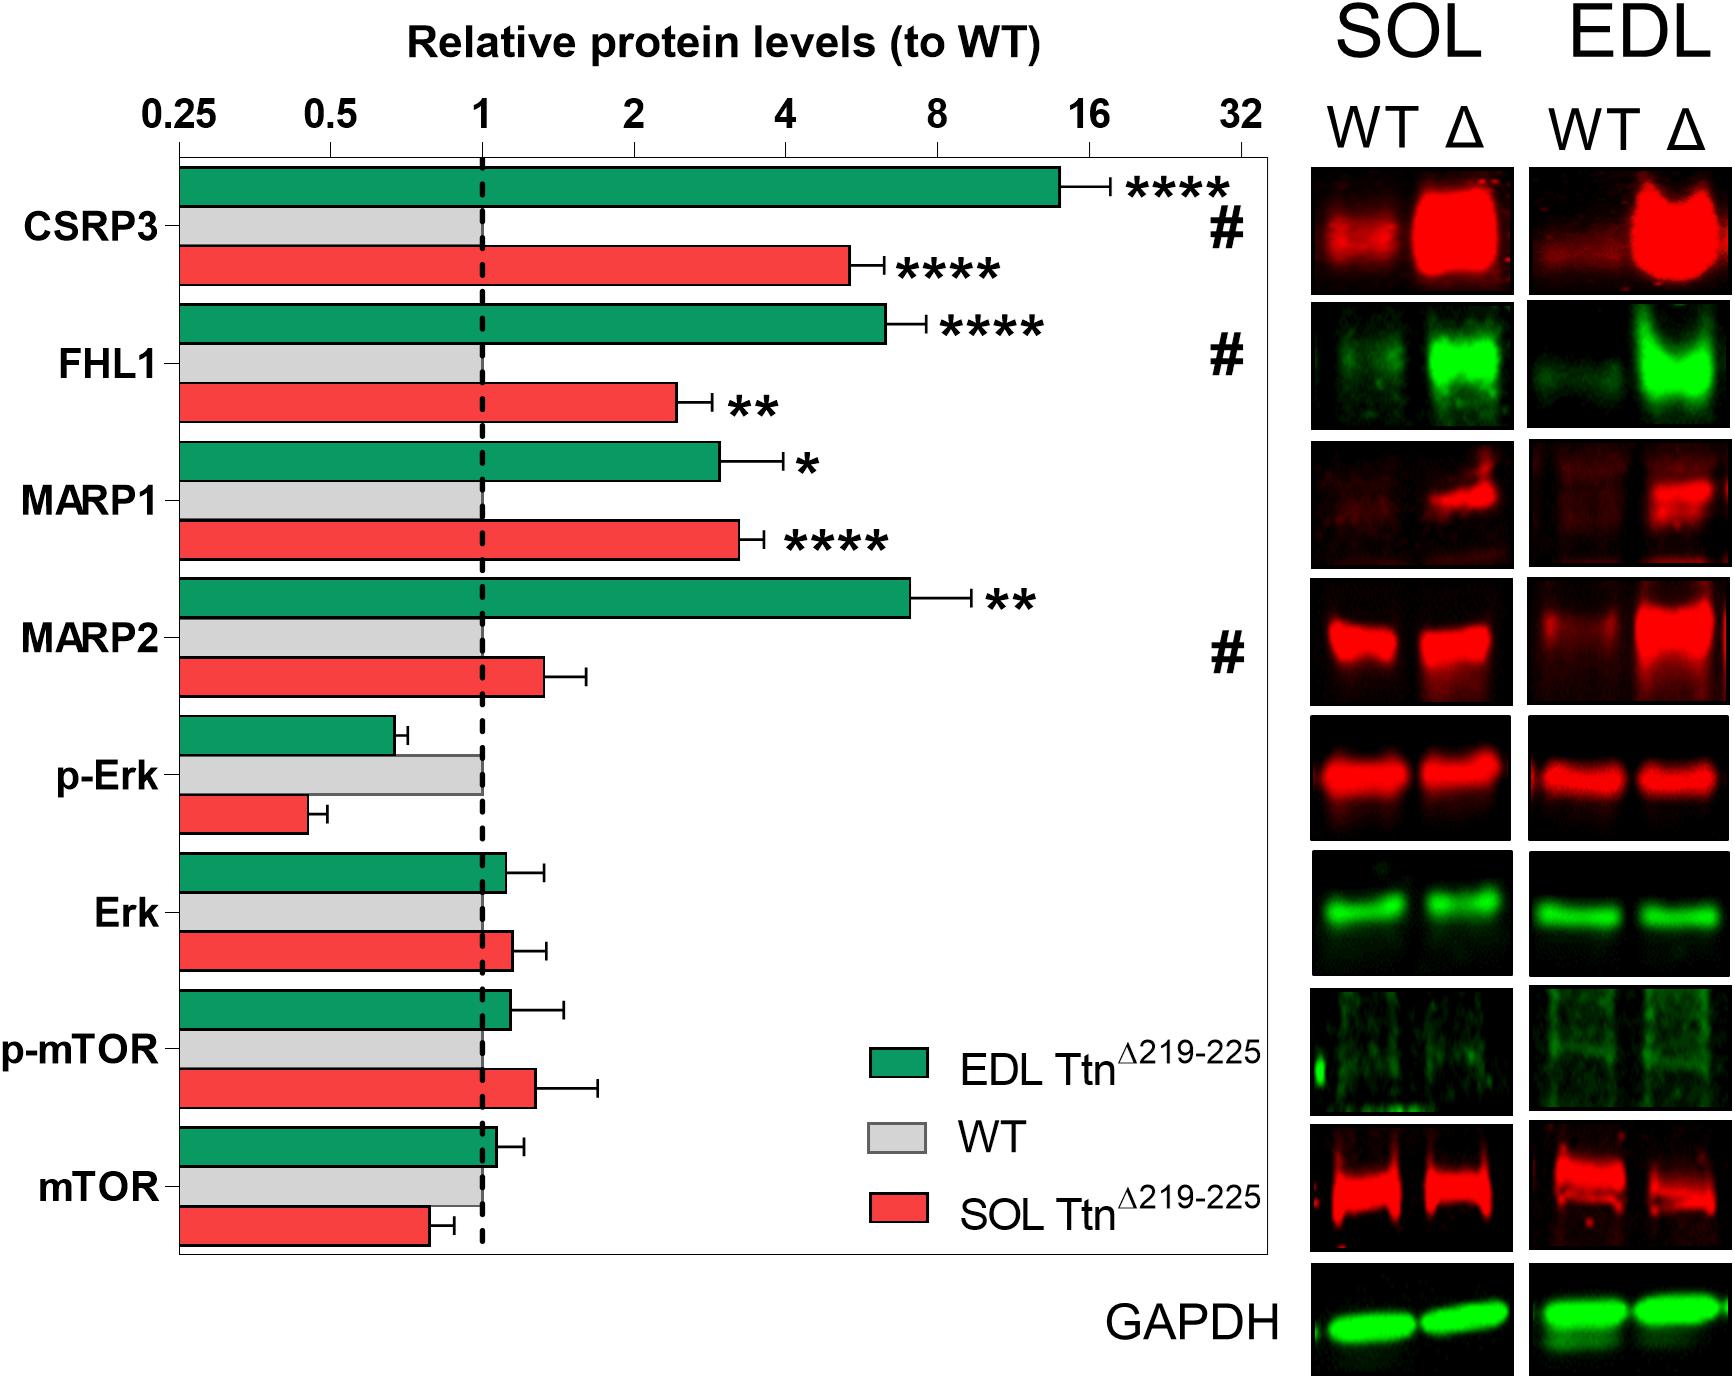
Figure 8. Western blots of various hypertrophy associated proteins. CSRP3, FHL1 and MARP2 show significant differences between soleus (red, lower bar) and EDL (green, upper bar) muscle, relative to wildtype muscles (WT; gray, middle bar), providing a possible link to the hypertrophy seen in the soleus, but not in the EDL muscle. #p < 0.05 interaction factor 2-way ANOVA; *p < 0.05, **p < 0.01, ***p < 0.001, ****p < 0.0001 in repeated t-test.
To test whether TtnΔ219–225 mice are more sensitive to muscle-load stimuli, we subjected mice to either functional overload (FO) of the soleus, by means of synergist ablation (surgical removal of gastrocnemius and plantaris muscle), or unloading by means of hindlimb suspension (HS). Following FO, soleus muscle mass was increased, with the increase being larger in TtnΔ219–225 mice (WT 15.7% increase; TtnΔ219–225 35.2% increase). Interestingly, EDL muscles of TtnΔ219–225 mice also developed hypertrophy (21.6% increase) (Figure 9A). Following HS, the soleus was atrophied in WT mice (mass 19.8% decrease), but this effect was attenuated in TtnΔ219–225 (mass -7.9% decrease). There was no effect of HS in EDL of either WT or TtnΔ219–225 mice (Figure 9B). This, together with the response of other muscles (Supplementary Figure 5), suggests that TtnΔ219–225 mice are more sensitized to increase the muscle mass when exposed to a hypertrophy trigger, and more sensitized to resist muscle mass reductions when exposed to an atrophy trigger.
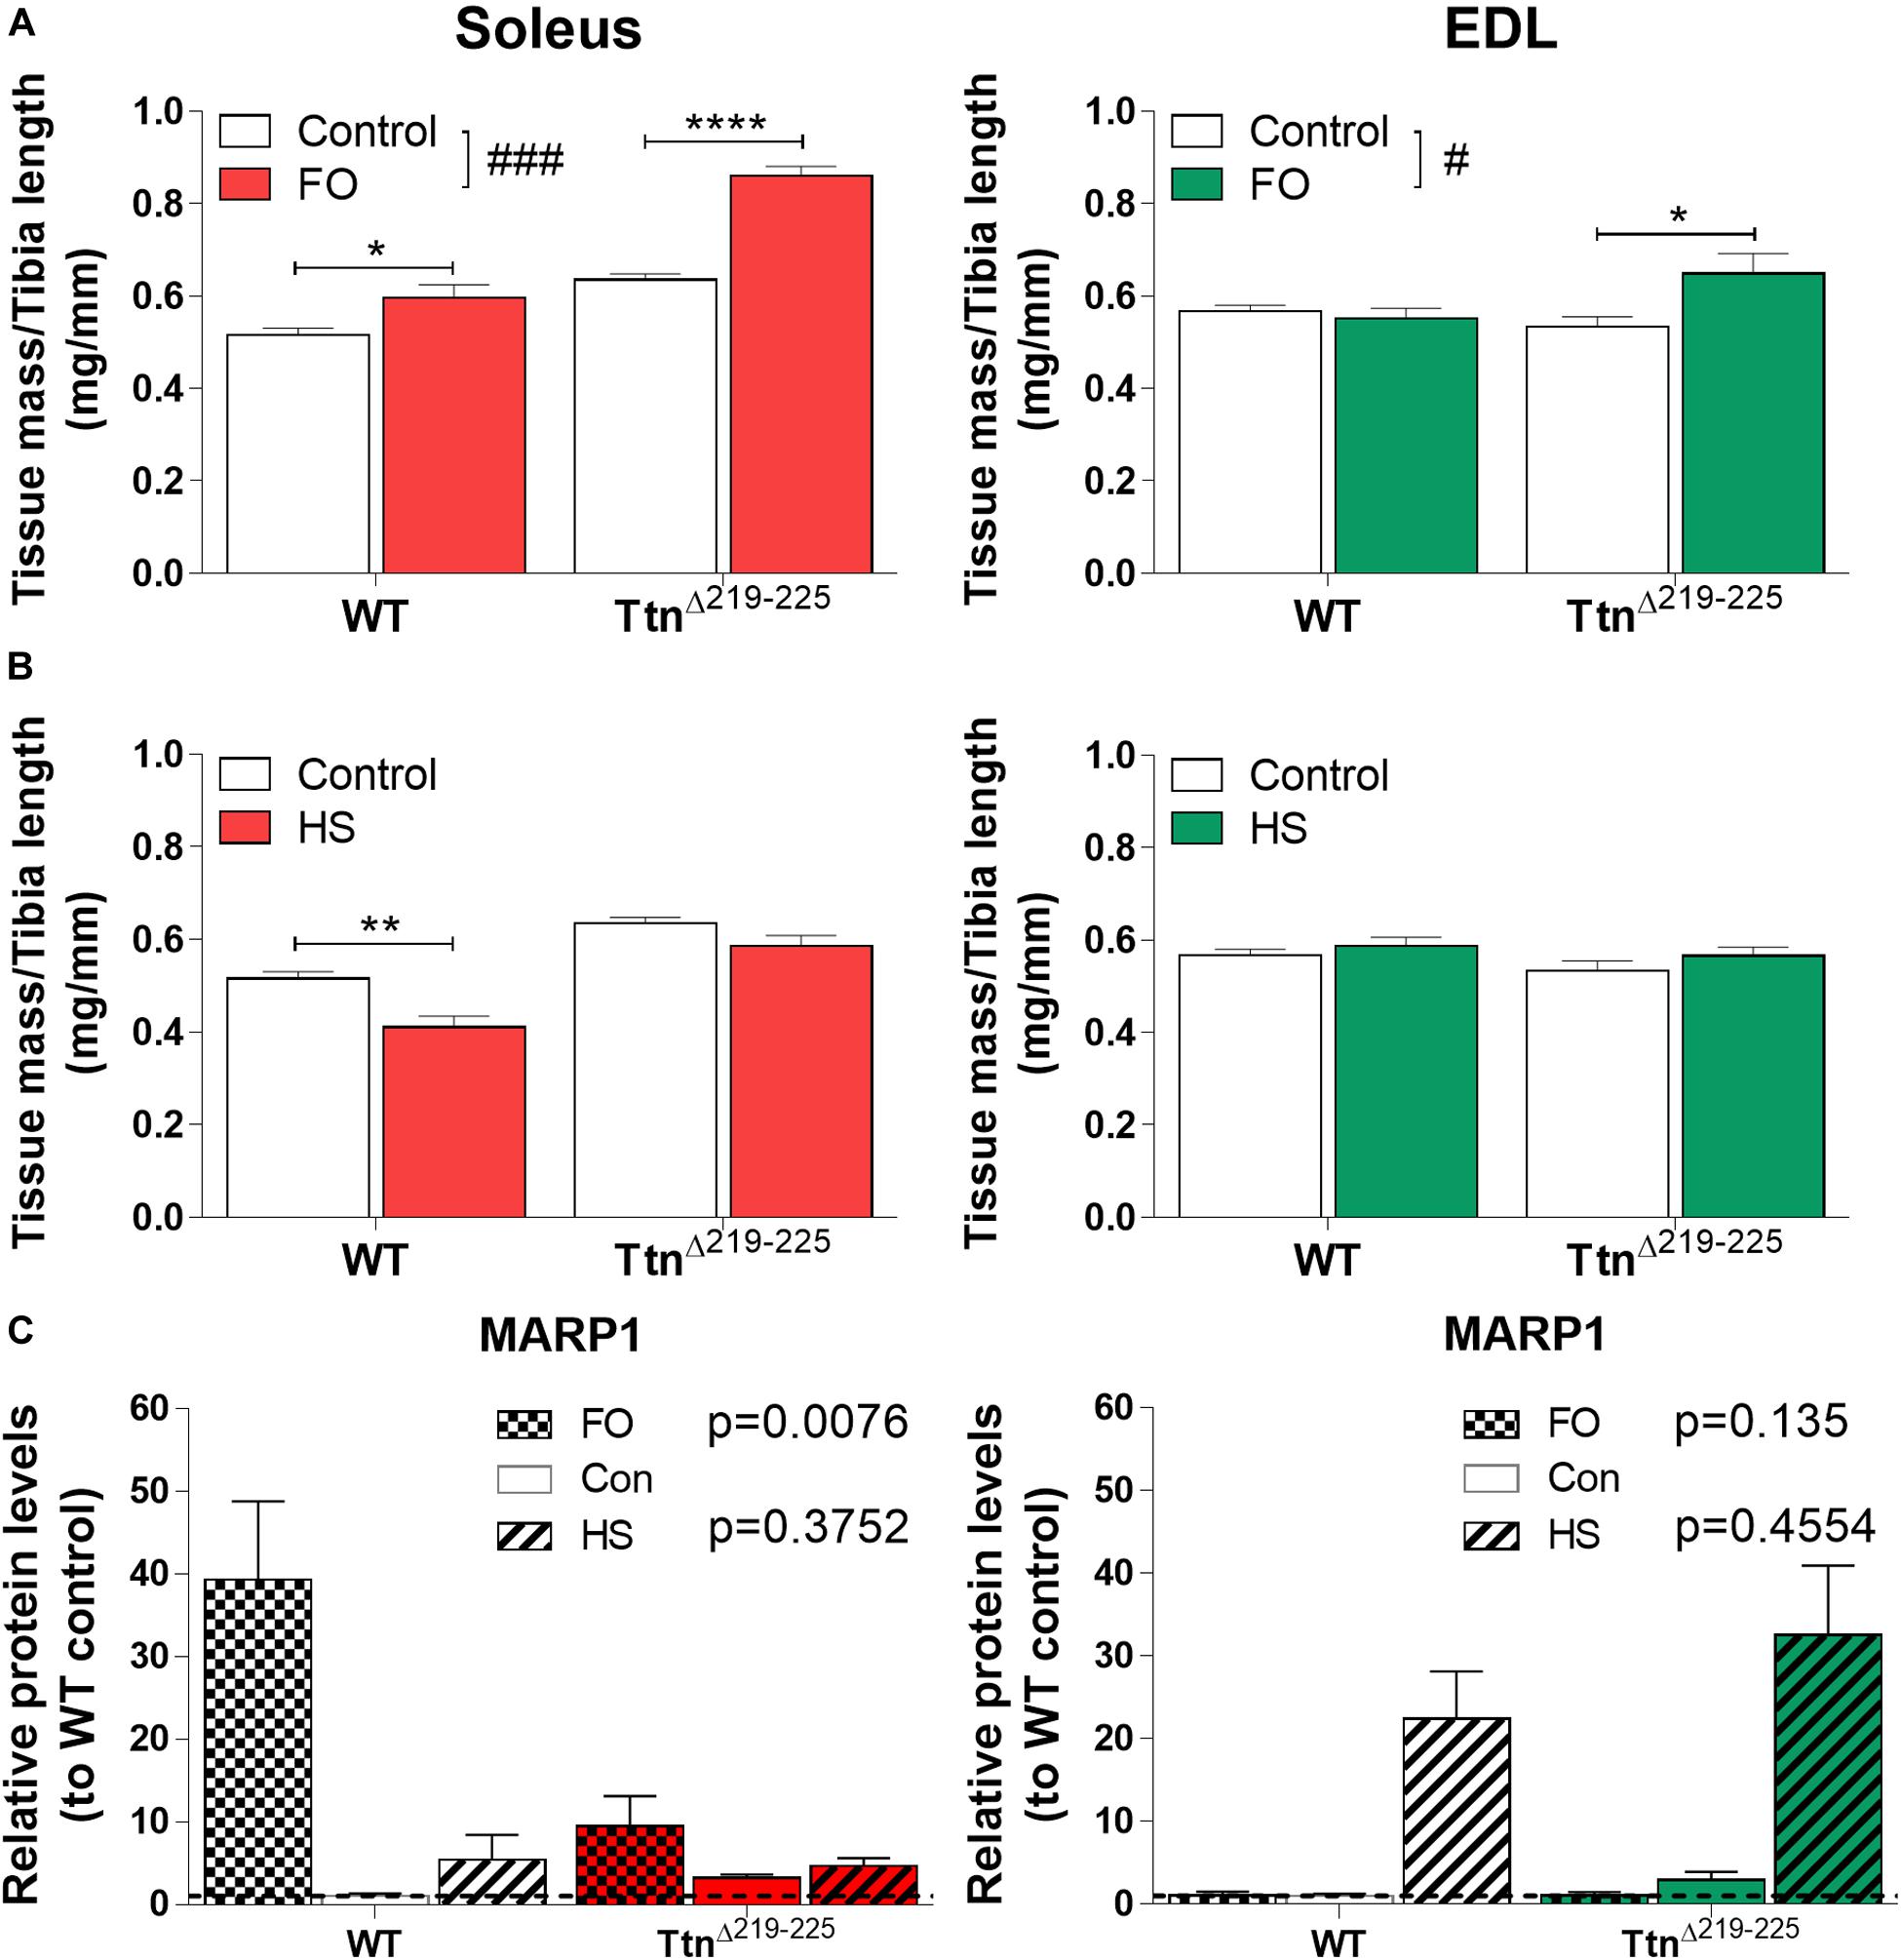
Figure 9. Response of TtnΔ219–225 mice to muscle over- and unloading. Tissue mass normalized to tibia length, soleus (left) and EDL (right), with muscle functional overload due to ablation (A; FO;10 days) and unloading by hindlimb suspension (B; HS 10 days) (N = 6-8; 2-way ANOVA #p < 0.05, ###p < 0.001, Tukey post hoc *p < 0.05, **p < 0.01, ****p < 0.0001). Western blot of MARP1 (C) showing opposing responses to FO and HS, implying a potential roll for MARP1 in muscle trophicity (N = 5-6, data represented as relative protein level compared to WT control; p-value from 2-way ANOVA on con. vs. FO and con. vs. HS, respectively).
To explore a potential signaling mechanism underlying the hypertrophy sensitization, we probed several target proteins with Western blot. We found marked upregulation of CSRP3, FHL1 and MARP2 in TtnΔ219–225 muscles (Supplementary Figure 6) in response to FO and/or HS. Only MARP1 had an opposing response between soleus and EDL (Figure 9C). Following FO, MARP1 was upregulated 39-fold in WT muscle, a response that was attenuated in TtnΔ219–225 muscles (10-fold increase, p = 0.0076). HS only moderately affected MARP1 levels in soleus. EDL muscle showed the exact opposite response for MARP1, wherein FO showed no observable difference in MARP1 expression, but HS showed substantial upregulation of MARP in both WT and TtnΔ219–225 muscles (22-fold increase in WT to 33-fold increase in TtnΔ219–225). This opposing response of MARP1 in soleus compared to that in EDL muscle, following FO or HS, might imply a role during certain stages of hypertrophy development.
Discussion
In this study, we characterized skeletal muscles in a mouse model with a small C-terminal deletion in titin’s PEVK segment. This deletion resulted in alternative splicing of titin’s I-band region, leading to the appearance of a second smaller isoform (N2A2), and an accompanying increase in the passive tension of skeletal muscle. The increase in stiffness of the TtnΔ219–225 muscles coincided with faster kinetics of force generation and relaxation in slow-twitch soleus and fast-twitch EDL muscle, although the fraction of slow myosin heavy chain isoforms was increased. TtnΔ219–225 mice presented with longitudinal and cross-sectional hypertrophy in soleus muscle, and a stronger response to hypertrophic stimuli.
Passive Tension in the TtnΔ219–225 Mouse Model
The TtnΔ219–225 mouse model was originally generated to study the PEVK segment of the predominant titin isoform in the heart, N2B cardiac titin, and to resolve the function of the PEVK-segment in relation to biomechanics. In the heart, the TtnΔ219–225 model displayed increased passive tension, suggesting that the PEVK segment is a major contributor to titin-based passive tension (Granzier et al., 2009). We expected to find little to no change in passive tension in skeletal muscle, due to the small size of the deletion relative to the long spring in skeletal muscle titin. In contrast, a large increase in passive tension was found. Calculations using a serially linked worm-like chain model indicated that excision of the seven exons only increases titin-based passive tension (17% at SL 3.0 μm; Figure 1B). However, a much larger passive tension increase was found (Figures 1C,D). This larger than expected passive tension increase is likely due to the appearance of an additional, smaller N2A isoform, referred to as N2A2 (Figure 2). However, the mechanical contribution of N2A2 is speculative, as we have not determined its incorporation in the sarcomere.
A similar N2A2 isoform was previously described in the TtnΔ30–38 (proximal Ig domain deletion) (Buck et al., 2014) model. Soleus muscle from this mouse showed that ∼30% of total titin consisted of N2A2 and that titin-based passive tension was increased by ∼30% at SL 2.5 μm. Other models of titin I-band region deletion, such as the TtnΔ251–269 (IA-junction deletion) (Granzier et al., 2014) and TtnΔ112–158, do not show N2A2-like isoforms of titin in skeletal muscle. However, in the TtnΔ112–158 model, most of the differentially spliced PEVK exons seen in the TtnΔ219–225 and TtnΔ30–38 models are deleted. For the TtnΔ251–269 model it can be argued that that model should be considered an A-band region titin deletion model, due to its domain structure of Ig and fibronectin repeats. The only other reported titin I-band region deletion is a spontaneous deletion in the N2A and PEVK region. The corresponding mouse model, the muscular dystrophy with myositis (mdm; MGI: Ttnmdm) mouse model (Garvey et al., 2002), presents with only minor increases in passive tension. However, this mouse displays severe dystrophy, with increased ECM, potentially masking increased titin-based stiffness from an N2A2 isoform. Whether an N2A2 isoform is expressed in this model is unknown. An explanation for the additional splicing of titin’s I-band region in the TtnΔ219–225 model might be related to the deletion of the phosphorylation sites that regulate titin stiffness. The deleted section in the TtnΔ219–225 mouse contains 2 phosphorylation sites: S12742 (ex219) and S12884 (ex225) (van der Pijl et al., 2019). Both are phosphorylated by PKCα (Hidalgo et al., 2009) and CAMKIIδ (Hidalgo and Granzier, 2013). These sites increase titin-based stiffness when phosphorylated (Hudson et al., 2010). However, total phosphorylation levels were not different between WT and TtnΔ219–225 muscles (Supplementary Figure 7), arguing against a role for this mechanism. Considering that titin has hundreds of potential post-translational modifications in its spring region, with only a few sites functionally described, it is difficult to assess their role in passive stiffness. Alternatively, there is the possibility that passive stiffness regulates Rbm20. Rbm20 is a known splice-factor of titin (Guo et al., 2012; Li et al., 2012; Murayama et al., 2018). Rbm20 signaling is potentially sensitive to the increased passive tension, resulting in increased expression or activation of Rbm20. Such a mechanism could also explain the N2A2 isoform in the TtnΔ30–38 muscles.
Titin and Active Force Development
There is substantial data supporting that titin-based stiffness modulates active force development by altering thin and thick-filament properties (Fukuda et al., 2008; Mateja et al., 2013; Elhamine et al., 2014; Li et al., 2016, 2019). Indeed, recent work in TtnΔ112–158 muscle by Brynnel et al. (2018), showed that stiffer titin speeds the kinetics of active force generation, similar to the observations in the present study (relaxation kinetics were not determined in TtnΔ112–158 muscle). Recently, advances have been made in the understanding of the mechanisms by which titin stiffness modulates contraction kinetics. Stiffer titin molecules put more strain on the thick filaments (Irving et al., 2011). The increased strain promotes the thick filaments “ON”-state, thereby accelerating force kinetics (Fusi et al., 2016; Piazzesi et al., 2018). We propose that the increased force generation and relaxation kinetics underlie the increased F50 stimulation frequency (Figure 4B, inserts). Due to the increased kinetics, force summation occurs at higher stimulation frequencies. Apparently, this effect is quite pronounced, as it outweighs the reduced force kinetics due to the fast-to-slow fiber type shift. The increased F50 was less evident in female muscles (Supplementary Figure 2). However, muscles of female TtnΔ219–225 mice also present with an increased proportion of type 1 fibers (Figure 5C), which would decrease the F50 in soleus. Thus, this suggests that the F50 in TtnΔ219–225 females is actually increased. Perhaps females do not switch fiber type to the same extent as the males, something that was not tested in this manuscript, resulting in a less pronounced increase in F50 compared to that of male TtnΔ219–225 mice.
These findings prompted us to measure the force kinetics in both WT and TtnΔ219–225 muscles set at the same baseline passive tension (matched preload, Supplementary Figure 8). Interestingly, at matched preload the contraction kinetics are slower in TtnΔ219–225 muscle compared to WT, in line with the slow fiber type switch. This finding supports that titin-based passive tension modulates the force generation and relaxation kinetics. However, it should be noted that matched pre-loads were achieved at different sarcomere length and we cannot rule out that this affected the results via a passive tension-independent mechanism.
Trophic Sensitization of Slow Twitch Muscle
The increased absolute force production in (slow-twitch) soleus muscle of the TtnΔ219–225 model is in part due to cross-sectional hypertrophy (Figure 7 and Supplementary Figure 4). The cross-sectional hypertrophy, combined with the longitudinal hypertrophy, accounts for the observed increased muscle mass in the TtnΔ219–225 model. The hypertrophy is not apparent in (fast-twitch) EDL muscle, suggesting that it is muscle specific. The muscles that do hypertrophy, show progressive growth (Figure 6). Tibialis muscle (TC) has significant increases in mass at 6 months, with a similar trend for the diaphragm. TC and diaphragm are fast-twitch muscles, suggesting that the hypertrophy is not fiber type specific and more likely correlates with the passive characteristics of the muscle. Perhaps the hypertrophy can be attributed to the operating sarcomere length range of the muscles. EDL muscle operates at a smaller sarcomere length range compared to soleus (Burkholder and Lieber, 2001; Brynnel et al., 2018). This smaller range reduces the amplitude of the passive tension change. Previous work suggests that large fluctuations in passive tension induce both cross sectional and longitudinal hypertrophy, with increased titin stiffness amplifying the effect (van der Pijl et al., 2018). Thus, the smaller sarcomere length range in EDL might blunt the stimulus for longitudinal and cross-sectional adaptations in TtnΔ219–225 muscle, resulting in less change in muscle mass.
Longitudinal hypertrophy is expected to normalize the passive stiffness of muscles at their operating sarcomere length range. This notion is supported by recent work on the TtnΔ112–158 model, which showed normalization of passive tension due to addition of sarcomeres in series (Brynnel et al., 2018). Thus, titin-based passive stiffness controls the number of sarcomeres in series, probably to maintain passive tension within a desired range. To determine how this addition in serial sarcomeres affects muscle stiffness, we calculated the average passive tension (based on total passive tension; Figures 1C,D) in a sarcomere length range of 2.3–3.0 μm, including an addition of 16% serial sarcomeres in soleus and 8% in EDL (calculated as percentage decrease in stiffness; Supplementary Figure 9; middle panels). This addition of sarcomeres shifts the sarcomere length range in the TtnΔ219–225 muscles to 1.93–2.52 μm in soleus and to 2.12–2.76 μm in EDL (Supplementary Figure 9; bottom panels, respectively). Consequently, this results in a decrease in passive stiffness in soleus (Supplementary Figure 9A; middle panel) and a similar trend in EDL (Supplementary Figure 9B; middle panel). Thus, the longitudinal hypertrophy might be a compensatory mechanism to adjust for the increase in passive stiffness.
To gain insight into the hypertrophy signaling mechanisms at play, we probed both soleus and EDL muscles for titin-binding proteins and protein synthesis regulators (Figure 8). Although we did identify several upregulated proteins, they appear to be more related to cellular stress and less so to trophicity. Neither of the probed protein synthesis pathways, mTOR and Erk, showed convincing levels of activity, as determined by phosphorylation of mTOR S2181 (auto-phosphorylation site for kinase activity) and Erk Thr202/Tyr204 (dual phosphorylation for downstream effector regulation). Likely the signaling processes in the TtnΔ219–225 mouse are only moderately active, which makes it challenging to deduce the underlying mechanisms.
Finally, a striking finding was that both EDL and soleus from TtnΔ219–225 mice showed a sensitization to hypertrophic stimuli (Figure 9). Repeating the Western blot panel, we found MARP1 to stand out as a potential regulator of hypertrophy. MARP1 was oppositely regulated, during over- and unloading, between soleus and EDL muscle. MARP1 in soleus was sensitive to functional overload, but was significantly less responsive in the TtnΔ219–225 mouse. In EDL, hindlimb suspension rather than functional overload was the main activator of MARP1, independent of genotype. Considering the strong hypertrophy response of soleus muscle in the TtnΔ219–225 mice to functional overload (Figure 9A), MARP1 might be a negative regulator of hypertrophy. Such a mechanism, however, is speculative. The TtnΔ219–225 muscles are sensitized to hypertrophy, i.e. both soleus and EDL responded stronger to muscle overload, and showed a blunted response to unloading (Figure 9B). The mechanisms underlying the sensitization are unclear. We speculate that the C-terminal portion of the PEVK segment houses a signaling complex that normally suppresses hypertrophy but this and other possibilities require future study.
Conclusion
We hypothesized that the TtnΔ219–225 model would display minimally altered passive tension and remodeling in skeletal muscle. Surprisingly, the deletion of these seven exons increased passive tension several times more than predicted, likely at least in part due to unanticipated alternative splicing of the titin transcript and resulting in stiffer titin isoforms. Consequently, TtnΔ219–225 muscle shows extensive remodeling, including longitudinal and cross-sectional hypertrophy, and changes in muscle contractility. The results support the notion that titin-based stiffness controls the number of serial sarcomeres.
Data Availability Statement
All datasets generated for this study are included in the article/Supplementary Material.
Ethics Statement
This study was performed in accordance with the Guide for the Care and Use of Laboratory Animals of the National Institutes of Health. All animal experiments were performed according to approved institutional animal care and use committee (IACUC) protocols (#09-095 & #13-488) of the University of Arizona.
Author Contributions
MG, CO, and HG designed the research studies. BH, RP, TG-N, FL, AK, JS, and CC conducted the experiments and acquired the data. RP, BH, FL, JS, and CC analyzed the data. RP, MG, HG, and CO wrote the manuscript.
Funding
Research reported in this publication was supported by the National Institute of Arthritis and Musculoskeletal and Skin Diseases of the National Institutes of Health under Award Number R01AR053897 (Henk Granzier), R01AR073179 (Henk Granzier) and R01HL121500 (Coen Ottenheijm), and H2020-MSCA-RISE-2014 [645648 ‘Muscle Stress Relief’ (Coen Ottenheijm)].
Conflict of Interest
The authors declare that the research was conducted in the absence of any commercial or financial relationships that could be construed as a potential conflict of interest.
Acknowledgments
We are grateful to Ms. Luan Wyly, Ms. Diana Cummings, Mr. Adam Hoying, Mr. Chandra Saripalli, Ms. Danielle Buck, and Mr. Sike Pan for important support of this work.
Supplementary Material
The Supplementary Material for this article can be found online at: https://www.frontiersin.org/articles/10.3389/fphys.2020.00494/full#supplementary-material
FIGURE S1 | Simulated stiffness of N2A2 titin. Simulated stiffness of wildtype (WT; black line) and TtnΔ219–225 (red line) molecules. The green line shows stiffness in case 100% of the molecules consist of N2A2. The blue line shows stiffness in case 20% of the molecules consists of N2A2.
FIGURE S2 | Active muscle properties of female TtnΔ219–225 mice. (A,B) active tension of soleus (WT, black line; TtnΔ219–225 red line) and EDL (WT, black line; TtnΔ219–225 green line), respectively. Curve fitting revealed a significant increase in tetanic tension (****p < 0.0001) for the soleus and decrease (****p < 0.0001) in the EDL, comparable to what was seen in males (Figure 4B). Insert depict the frequency that produces 50% of the maximum active tension (F50). Soleus is not right shifted at submaximal activation, while EDL is similarly right shifted as seen in the males (Figure 4B). (C) Muscle CSA was measured in passive muscles held at optimum length. Soleus (top) displayed cross-sectional hypertrophy, whereas EDL (bottom) is unchanged (N = 7–8).
FIGURE S3 | Muscle morphometric analysis of female mice. Absolute muscle weights (A,B) of both 3.5-months (left) and 6-month (right) old mice. Contrary to males, females TtnΔ219–225 mice display a late weight deficit (inserts B; p = 0.0546) compared to wildtype litter mates. Muscle weights are generally unaffected early on, except in the soleus (p < 0.01), with progressive increases in muscle mass as the mice age (N = 6–11).
FIGURE S4 | Muscle morphometry of soleus and EDL muscle. Representative images of hematoxylin and eosin stained cryosections of wildtype and TtnΔ219–225 soleus and EDL muscle (N = 4, for each muscle). Gross morphology is preserved in TtnΔ219–225 mice. TtnΔ219–225 soleus shows larger fibers, consistent with hypertrophy, and EDL shows smaller fibers, consistent with fiber type switching to more 2a/x fibers (see Figure 5C).
FIGURE S5 | Response of TtnΔ219–225 mice to muscle over and unloading. Tissue mass normalized to tibia length, with muscle functional overload represented by ablation (FO; left; 10 days) and unloading by hind limb suspension (HS; right; 10 days). (A) Tibialis cranialis (TC). (B) Quadriceps (Quad). (C) Left ventricle (LV). (D) Right ventricle (RV), (N = 6–8, males; 2-way ANOVA NS; Sidak post hoc ∗∗p < 0.01, ****p < 0.00001).
FIGURE S6 | Hypertrophy signaling of TtnΔ219–225 mice in response to muscle over- and unloading. Muscle functional overload represented by ablation (FO) and unloading by hindlimb suspension (HS). Soleus in red and EDL in green, data represented as relative protein level compared to WT control (N = 5–6; 2-way ANOVA).
FIGURE S7 | Titin phosphorylation. Relative ProQ Diamond to Sypro Ruby red signal of titin, in both soleus muscle (left) and EDL muscle (right) (N = 6 for all groups).
FIGURE S8 | Effect of preload in TtnΔ219–225 mice. Relative force plotted against time to 50% activation, max activation and 50% relaxation. Twitch activation (stimulation at 1 Hz) measured at optimum length (L0; (A) soleus, (B) EDL; N = 16–17, males and females) show that both muscles have faster relaxation kinetics (# RM 2-way ANOVA; ∗Holm Sidak post hoc). Since both muscles show a slow fiber switch (Figure 5C), we tested if stiffness affects relaxation time. Muscle set to a length where they reached 85mg preload, matched stiffness (MS) and measured with the same twitch protocol. Soleus (C, N = 7–8) shows a right shift, consistent with the slow fiber switch, however, EDL (D, N = 7–13) remains faster in 50% relaxation time, suggesting titin affects relaxation kinetics.
FIGURE S9 | Effect of additional serial sarcomeres on passive stiffness. To determine the effect of additional serial sarcomeres in both soleus (A; top panel) and EDL (B; top panel) on passive tension, we calculated the effect of adding 16% (Soleus) and 8% (EDL) additional sarcomeres as tension reduction (total passive tension, Figure 1), within a SL range of 2.3-3.0 μm (middle panels) and determined stiffness. The additional sarcomeres in the TtnΔ219–225 soleus normalize the stiffness, in theory, by shifting sarcomere working range, with a similar trend in EDL (bottom panels).
TABLE S1 | Titin exon array. Mouse titin exon expression data of soleus and EDL muscle. Exon nomenclature according to the human titin sequence retreived from Ensmbl ENSG00000155657.
TABLE S2 | Antibodies used in this study.
References
Agbulut, O., Li, Z., Mouly, V., and Butler-Browne, G. S. (1996). Analysis of skeletal and cardiac muscle from desmin knock-out and normal mice by high resolution separation of myosin heavy-chain isoforms. Biol. Cell 88, 131–135.
Anderson, B. R., and Granzier, H. L. (2012). Titin-based tension in the cardiac sarcomere: molecular origin and physiological adaptations. Prog. Biophys. Mol. Biol. 110, 204–217. doi: 10.1016/j.pbiomolbio.2012.08.003
Brynnel, A., Hernandez, Y., Kiss, B., Lindqvist, J., Adler, M., Kolb, J., et al. (2018). Downsizing the molecular spring of the giant protein titin reveals that skeletal muscle titin determines passive stiffness and drives longitudinal hypertrophy. eLife 7:e40532. doi: 10.7554/eLife.40532
Buck, D., Hudson, B. D., Ottenheijm, C. A. C., Labeit, S., and Granzier, H. (2010). Differential splicing of the large sarcomeric protein nebulin during skeletal muscle development. J. Struct. Biol. 170, 325–333. doi: 10.1016/j.jsb.2010.02.014
Buck, D., Smith, J. E. III, Chung, C. S., Ono, Y., Sorimachi, H., Labeit, S., et al. (2014). Removal of immunoglobulin-like domains from titin’s spring segment alters titin splicing in mouse skeletal muscle and causes myopathy. J. Gen. Physiol. 143, 215–230. doi: 10.1085/jgp.201311129
Burkholder, T. J., and Lieber, R. L. (2001). Sarcomere length operating range of vertebrate muscles during movement. J. Exp. Biol. 204, 1529–1536.
Chung, C. S., Bogomolovas, J., Gasch, A., Hidalgo, C. G., Labeit, S., and Granzier, H. L. (2011). Titin-actin interaction: PEVK-actin-based viscosity in a large animal. J. Biomed. Biotechnol. 2011:310791. doi: 10.1155/2011/310791
Chung, C. S., Hutchinson, K. R., Methawasin, M., Saripalli, C., Smith, J. E. III, Hidalgo, C. G., et al. (2013). Shortening of the elastic tandem immunoglobulin segment of titin leads to diastolic dysfunction. Circulation 128, 19–28. doi: 10.1161/CIRCULATIONAHA.112.001268
Elhamine, F., Radke, M. H., Pfitzer, G., Granzier, H., Gotthardt, M., and Stehle, R. (2014). Deletion of the titin N2B region accelerates myofibrillar force development but does not alter relaxation kinetics. J. Cell Sci. 127, 3666–3674. doi: 10.1242/jcs.141796
Fukuda, N., Granzier, H. L., Ishiwata, S., and Kurihara, S. (2008). Physiological functions of the giant elastic protein titin in mammalian striated muscle. J. Physiol. Sci. 58, 151–159. doi: 10.2170/physiolsci.RV005408
Fusi, L., Brunello, E., Yan, Z., and Irving, M. (2016). Thick filament mechano-sensing is a calcium-independent regulatory mechanism in skeletal muscle. Nat. Commun. 7:13281. doi: 10.1038/ncomms13281
Garvey, S. M., Rajan, C., Lerner, A. P., Frankel, W. N., and Cox, G. A. (2002). The muscular dystrophy with myositis (mdm) mouse mutation disrupts a skeletal muscle-specific domain of titin. Genomics 79, 146–149. doi: 10.1006/geno.2002.6685
Granzier, H., Radke, M., Royal, J., Wu, Y., Irving, T. C., Gotthardt, M., et al. (2007). Functional genomics of chicken, mouse, and human titin supports splice diversity as an important mechanism for regulating biomechanics of striated muscle. Am. J. Physiol. Regul. Integr. Comp. Physiol. 293, R557–R567. doi: 10.1152/ajpregu.00001.2007
Granzier, H. L., Hutchinson, K. R., Tonino, P., Methawasin, M., Li, F. W., Slater, R. E., et al. (2014). Deleting titin’s I-band/A-band junction reveals critical roles for titin in biomechanical sensing and cardiac function. Proc. Natl. Acad. Sci. U.S.A. 111, 14589–14594. doi: 10.1073/pnas.1411493111
Granzier, H. L., and Irving, T. C. (1995). Passive tension in cardiac muscle: contribution of collagen, titin, microtubules, and intermediate filaments. Biophys. J. 68, 1027–1044. doi: 10.1016/S0006-3495(95)80278-X
Granzier, H. L., Radke, M. H., Peng, J., Westermann, D., Nelson, O. L., Rost, K., et al. (2009). Truncation of titin’s elastic PEVK region leads to cardiomyopathy with diastolic dysfunction. Circ. Res. 105, 557–564. doi: 10.1161/CIRCRESAHA.109.200964
Greer, K. A., McReynolds, M. R., Brooks, H. L., and Hoying, J. B. (2006). CARMA: a platform for analyzing microarray datasets that incorporate replicate measures. BMC Bioinformatics 7:149. doi: 10.1186/1471-2105-7-149
Gregorio, C. C., Trombitas, K., Centner, T., Kolmerer, B., Stier, G., Kunke, K., et al. (1998). The NH2 terminus of titin spans the Z-disc: its interaction with a novel 19-kD ligand (T-cap) is required for sarcomeric integrity. J. Cell Biol. 143, 1013–1027. doi: 10.1083/jcb.143.4.1013
Guo, W., Schafer, S., Greaser, M. L., Radke, M. H., Liss, M., Govindarajan, T., et al. (2012). RBM20, a gene for hereditary cardiomyopathy, regulates titin splicing. Nat. Med. 18, 766–773. doi: 10.1038/nm.2693
Hidalgo, C., and Granzier, H. (2013). Tuning the molecular giant titin through phosphorylation: role in health and disease. Trends Cardiovasc. Med. 23, 165–171. doi: 10.1016/j.tcm.2012.10.005
Hidalgo, C., Hudson, B., Bogomolovas, J., Zhu, Y., Anderson, B., Greaser, M., et al. (2009). PKC phosphorylation of titin’s PEVK element: a novel and conserved pathway for modulating myocardial stiffness. Circ. Res. 105, 631–638. doi: 10.1161/CIRCRESAHA.109.198465
Hinze, F., Dieterich, C., Radke, M. H., Granzier, H., and Gotthardt, M. (2016). Reducing RBM20 activity improves diastolic dysfunction and cardiac atrophy. J. Mol. Med. 94, 1349–1358. doi: 10.1007/s00109-016-1483-3
Horowits, R., Kempner, E. S., Bisher, M. E., and Podolsky, R. J. (1986). A physiological role for titin and nebulin in skeletal muscle. Nature 323, 160–164. doi: 10.1038/323160a0
Horowits, R., and Podolsky, R. J. (1987). The positional stability of thick filaments in activated skeletal muscle depends on sarcomere length: evidence for the role of titin filaments. J. Cell Biol. 105, 2217–2223. doi: 10.1083/jcb.105.5.2217
Hudson, B. D., Hidalgo, C. G., Gotthardt, M., and Granzier, H. L. (2010). Excision of titin’s cardiac PEVK spring element abolishes PKCalpha-induced increases in myocardial stiffness. J. Mol. Cell. Cardiol. 48, 972–978. doi: 10.1016/j.yjmcc.2009.12.006
Irving, T., Wu, Y., Bekyarova, T., Farman, G. P., Fukuda, N., and Granzier, H. (2011). Thick-filament strain and interfilament spacing in passive muscle: effect of titin-based passive tension. Biophys. J. 100, 1499–1508. doi: 10.1016/j.bpj.2011.01.059
Kellermayer, M. S., Smith, S. B., Granzier, H. L., and Bustamante, C. (1997). Folding-unfolding transitions in single titin molecules characterized with laser tweezers. Science 276, 1112–1116. doi: 10.1126/science.276.5315.1112
Labeit, S., Kohl, C. H., Witt, C. C., Labeit, D., Jung, J., and Granzier, H. (2010). Modulation of muscle atrophy, fatigue and MLC phosphorylation by MuRF1 as indicated by hindlimb suspension studies on MuRF1-KO mice. J. Biomed. Biotechnol. 2010:693741. doi: 10.1155/2010/693741
Labeit, S., and Kolmerer, B. (1995). Titins: giant proteins in charge of muscle ultrastructure and elasticity. Science 270, 293–296. doi: 10.1126/science.270.5234.293
Lahmers, S., Wu, Y., Call, D. R., Labeit, S., and Granzier, H. (2004). Developmental control of titin isoform expression and passive stiffness in fetal and neonatal myocardium. Circ. Res. 94, 505–513. doi: 10.1161/01.RES.0000115522.52554.86
LeWinter, M. M., Wu, Y., Labeit, S., and Granzier, H. (2007). Cardiac titin: structure, functions and role in disease. Clin. Chim. Acta 375, 1–9. doi: 10.1016/j.cca.2006.06.035
Li, K.-L., Methawasin, M., Tanner, B. C. W., Granzier, H. L., Solaro, R. J., and Dong, W.-J. (2019). Sarcomere length-dependent effects on Ca(2+)-troponin regulation in myocardium expressing compliant titin. J. Gen. Physiol. 151, 30–41. doi: 10.1085/jgp.201812218
Li, S., Guo, W., Dewey, C. N., and Greaser, M. L. (2013). Rbm20 regulates titin alternative splicing as a splicing repressor. Nucleic Acids Res. 41, 2659–2672. doi: 10.1093/nar/gks1362
Li, S., Guo, W., Schmitt, B. M., and Greaser, M. L. (2012). Comprehensive analysis of titin protein isoform and alternative splicing in normal and mutant rats. J. Cell. Biochem. 113, 1265–1273. doi: 10.1002/jcb.23459
Li, Y., Lang, P., and Linke, W. A. (2016). Titin stiffness modifies the force-generating region of muscle sarcomeres. Sci. Rep. 6:24492. doi: 10.1038/srep24492
Lieber, R. L., and Ward, S. R. (2011). Skeletal muscle design to meet functional demands. Philos. Trans. R. Soc. Lond. B. Biol. Sci. 366, 1466–1476. doi: 10.1098/rstb.2010.0316
Linke, W. A., and Fernandez, J. M. (2002). Cardiac titin: molecular basis of elasticity and cellular contribution to elastic and viscous stiffness components in myocardium. J. Muscle Res. Cell Motil. 23, 483–497. doi: 10.1023/a:1023462507254
Liversage, A. D., Holmes, D., Knight, P. J., Tskhovrebova, L., and Trinick, J. (2001). Titin and the sarcomere symmetry paradox. J. Mol. Biol. 305, 401–409. doi: 10.1006/jmbi.2000.4279
Mateja, R. D., Greaser, M. L., and de Tombe, P. P. (2013). Impact of titin isoform on length dependent activation and cross-bridge cycling kinetics in rat skeletal muscle. Biochim. Biophys. Acta 1833, 804–811. doi: 10.1016/j.bbamcr.2012.08.011
Methawasin, M., Hutchinson, K. R., Lee, E.-J., Smith, J. E. III, Saripalli, C., Hidalgo, C. G., et al. (2014). Experimentally increasing titin compliance in a novel mouse model attenuates the Frank-Starling mechanism but has a beneficial effect on diastole. Circulation 129, 1924–1936. doi: 10.1161/CIRCULATIONAHA.113.005610
Methawasin, M., Strom, J. G., Slater, R. E., Fernandez, V., Saripalli, C., and Granzier, H. (2016). Experimentally increasing the compliance of Titin Through RNA Binding Motif-20 (RBM20) inhibition improves diastolic function in a mouse model of heart failure with preserved ejection fraction. Circulation 134, 1085–1099. doi: 10.1161/CIRCULATIONAHA.116.023003
Murayama, R., Kimura-Asami, M., Togo-Ohno, M., Yamasaki-Kato, Y., Naruse, T. K., Yamamoto, T., et al. (2018). Phosphorylation of the RSRSP stretch is critical for splicing regulation by RNA-Binding Motif Protein 20 (RBM20) through nuclear localization. Sci. Rep. 8:8970. doi: 10.1038/s41598-018-26624-w
Nagy, A., Grama, L., Huber, T., Bianco, P., Trombitas, K., Granzier, H. L., et al. (2005). Hierarchical extensibility in the PEVK domain of skeletal-muscle titin. Biophys. J. 89, 329–336. doi: 10.1529/biophysj.104.057737
Piazzesi, G., Caremani, M., Linari, M., Reconditi, M., and Lombardi, V. (2018). Thick Filament Mechano-Sensing in skeletal and cardiac muscles: a common mechanism able to adapt the energetic cost of the contraction to the task. Front. Physiol. 9:736. doi: 10.3389/fphys.2018.00736
Radke, M. H., Peng, J., Wu, Y., McNabb, M., Nelson, O. L., Granzier, H., et al. (2007). Targeted deletion of titin N2B region leads to diastolic dysfunction and cardiac atrophy. Proc. Natl. Acad. Sci. U.S.A. 104, 3444–3449. doi: 10.1073/pnas.0608543104
Radke, M. H., Polack, C., Methawasin, M., Fink, C., Granzier, H. L., and Gotthardt, M. (2019). Deleting full length Titin Versus the Titin M-Band region leads to differential mechanosignaling and Cardiac Phenotypes. Circulation 139, 1813–1827. doi: 10.1161/CIRCULATIONAHA.118.037588
Savarese, M., Jonson, P. H., Huovinen, S., Paulin, L., Auvinen, P., Udd, B., et al. (2018). The complexity of titin splicing pattern in human adult skeletal muscles. Skelet. Muscle 8:11. doi: 10.1186/s13395-018-0156-z
Trombitas, K., Greaser, M., Labeit, S., Jin, J. P., Kellermayer, M., Helmes, M., et al. (1998). Titin extensibility in situ: entropic elasticity of permanently folded and permanently unfolded molecular segments. J. Cell Biol. 140, 853–859. doi: 10.1083/jcb.140.4.853
Trombitas, K., Wu, Y., McNabb, M., Greaser, M., Kellermayer, M. S. Z., Labeit, S., et al. (2003). Molecular basis of passive stress relaxation in human soleus fibers: assessment of the role of immunoglobulin-like domain unfolding. Biophys. J. 85, 3142–3153. doi: 10.1016/S0006-3495(03)74732-74738
van der Pijl, R., Strom, J., Conijn, S., Lindqvist, J., Labeit, S., Granzier, H., et al. (2018). Titin-based mechanosensing modulates muscle hypertrophy. J. Cachexia. Sarcopenia Muscle 9, 947–961. doi: 10.1002/jcsm.12319
van der Pijl, R. J., Granzier, H. L., and Ottenheijm, C. A. C. (2019). Diaphragm contractile weakness due to reduced mechanical loading: role of titin. Am. J. Physiol. Cell Physiol. 317, C167–C176. doi: 10.1152/ajpcell.00509.2018
Wang, K., McCarter, R., Wright, J., Beverly, J., and Ramirez-Mitchell, R. (1993). Viscoelasticity of the sarcomere matrix of skeletal muscles. The titin-myosin composite filament is a dual-stage molecular spring. Biophys. J. 64, 1161–1177. doi: 10.1016/S0006-3495(93)81482-81486
Warren, C. M., Krzesinski, P. R., and Greaser, M. L. (2003). Vertical agarose gel electrophoresis and electroblotting of high-molecular-weight proteins. Electrophoresis 24, 1695–1702. doi: 10.1002/elps.200305392
Watanabe, K., Nair, P., Labeit, D., Kellermayer, M. S. Z., Greaser, M., Labeit, S., et al. (2002). Molecular mechanics of cardiac titin’s PEVK and N2B spring elements. J. Biol. Chem. 277, 11549–11558. doi: 10.1074/jbc.M200356200
Keywords: passive tension, titin, PEVK region, hypertrophy, RNA splicing
Citation: van der Pijl RJ, Hudson B, Granzier-Nakajima T, Li F, Knottnerus AM, Smith J, Chung CS, Gotthardt M, Granzier HL and Ottenheijm CAC (2020) Deleting Titin’s C-Terminal PEVK Exons Increases Passive Stiffness, Alters Splicing, and Induces Cross-Sectional and Longitudinal Hypertrophy in Skeletal Muscle. Front. Physiol. 11:494. doi: 10.3389/fphys.2020.00494
Received: 21 January 2020; Accepted: 23 April 2020;
Published: 29 May 2020.
Edited by:
Bruno Bastide, Lille University of Science and Technology, FranceReviewed by:
Maria Jolanta Redowicz, Nencki Institute of Experimental Biology (PAS), PolandOlivier Cazorla, Université de Montpellier, France
Martina Krüger, Heinrich Heine University Düsseldorf, Germany
Copyright © 2020 van der Pijl, Hudson, Granzier-Nakajima, Li, Knottnerus, Smith, Chung, Gotthardt, Granzier and Ottenheijm. This is an open-access article distributed under the terms of the Creative Commons Attribution License (CC BY). The use, distribution or reproduction in other forums is permitted, provided the original author(s) and the copyright owner(s) are credited and that the original publication in this journal is cited, in accordance with accepted academic practice. No use, distribution or reproduction is permitted which does not comply with these terms.
*Correspondence: Robbert J. van der Pijl, cmp2YW5kZXJwaWpsQGVtYWlsLmFyaXpvbmEuZWR1; Henk L. Granzier, Z3JhbnppZXJAZW1haWwuYXJpem9uYS5lZHU=; Coen A. C. Ottenheijm, Y29lbm9AZW1haWwuYXJpem9uYS5lZHU=