 Bastian Maus
 Sebastian Gutsfeld
 Christian Bock
 Hans-Otto Pörtner
- 1Integrative Ecophysiology, Alfred-Wegener-Institute Helmholtz Centre for Polar and Marine Research, Bremerhaven, Germany
- 2Department of Biology and Chemistry, University of Bremen, Bremen, Germany
The thermal tolerance of marine decapod crustacea is defined through their capacities for oxygen uptake and distribution. High ambient CO2 levels were previously shown to reduce hemolymph oxygen levels at enhanced cardiac performance during warming. This study investigated the impacts of warming under two CO2 levels on ventilation and hemolymph circulation in edible crabs Cancer pagurus. It also highlights changes in the ventilatory and cardiac pauses displayed by Decapoda under routine metabolism. Animals were exposed to step-wise, sub-critical warming (12–20°C over 5 days) under control (470 μatm) and high (1,350 μatm) water PCO2. Flow-through respirometry was combined with magnetic resonance imaging and infra-red photoplethysmography to allow for simultaneous, non-invasive measurements of metabolic rates (
Cancer pagurus: urn:lsid:zoobank.org:act:B750F89A-84B5-448B-8D80-EBD724A1C9D4
Introduction
Edible crabs, Cancer pagurus, are abundant in the North Sea, which has been identified as a regional hot spot for global warming (Hobday and Pecl, 2014). Given the severe impacts of marine heatwaves on other commercial crab stocks, it is paramount to improve our understanding of thermal tolerance in economically important species (Chandrapavan et al., 2019). Thermal tolerance in marine crustacea has been linked to hemolymph oxygen levels (PeO2), which are set by the capacities for oxygen uptake, delivery, and demand (Frederich et al., 2000; Frederich and Pörtner, 2000). PeO2 is maximal in the optimum temperature range: for C. pagurus, this maximum was found around 10–12°C (Metzger et al., 2007). Thermal limitation sets in when temperature-dependent oxygen demand in the tissues exceeds the oxygen supply via the cardiorespiratory system. Under acute warming beyond 16°C, C. pagurus’ PeO2 fell (pejus temperature Tp) and at 20°C, it remained at a constant minimum (critical temperature Tc). Generally, warming causes an increase in maximum heart rates and ventilation rates, but beyond Tp, ventilatory and cardiac limitations have been recorded: ventilation failed to increase with temperature in spider crabs Maja squinado. Heart rates continue to increase with temperature beyond Tp, but at a much lesser incline than below Tp (Frederich and Pörtner, 2000).
In crustacea, the heart is the first organ perfused by oxygenated hemolymph from the gills, thus playing a key role in the systemic distribution of oxygen (Taylor, 1982; McMahon and Burnett, 1990). A reduced hemolymph PO2 measured in the pericardial sinus may be caused by elevated myocardial oxygen consumption or reduced oxygen uptake in the gills. Reduced oxygen uptake may in turn result from low hemolymph flow through the branchial veins or from impaired ventilation, i.e., an impaired ventilation/perfusion ratio (Wheatly and Taylor, 1981). Decapoda are able to independently adjust heart rates and stroke volumes (Airriess and McMahon, 1994; McGaw and McMahon, 1998; Giomi and Pörtner, 2013). Therefore, both parameters need to be measured simultaneously for an accurate assessment of cardiac output and aerobic cardiac performance.
If ambient CO2 levels are elevated (hypercapnia), warming causes post-branchial PeO2 to decline at lower temperature thresholds compared to normocapnic warming, shifting the Tp to lower values and thus narrowing the optimum thermal window (Metzger et al., 2007; Walther et al., 2009). For spider crabs Hyas araneus, the reduction in PeO2 under hypercapnia was attributed to elevated heart rates (HR): more frequent contractions of the cardiac muscle may result in a higher oxygen demand of that tissue, reducing the availability of oxygen to the subsequently perfused tissues. The tachycardic effect of hypercapnic warming appears to be dependent on the water CO2 level (PwCO2; Walther et al., 2009). While ambient CO2 levels of up to 10,000–20,000 μatm did not affect ventilation at control temperatures (Batterton and Cameron, 1978), the combined effects of temperature increases and elevated CO2 levels on the interplay of ventilation and branchial perfusion have not been studied to date.
Branchial ventilation and perfusion are functionally linked in Brachyura, so changes in one parameter are paralleled by changes in the other. Regular, synchronous fluctuations in cardiovascular and ventilatory activity were observed in resting Decapoda within their optimum temperature range (McDonald et al., 1977; McMahon and Wilkens, 1977). Periodic fluctuations in whole-animal metabolic rates () and HR are displayed by free-moving C. pagurus (Ansell, 1973) and also by Carcinus maenas in situ (Aagaard, 1996). Over the course of 1 h, peak activities in physiological parameters (like HR) alternate with phases of minimum activities (i.e. bradycardia). This characteristic has thus been termed as pausing behavior (McMahon and Wilkens, 1977) and appears to be reflective of routine metabolism. The periodic changes in ventilatory and cardiac activity may be linked to a pacemaker in the central nervous system, connecting these structures (Taylor, 1982). Energy can be saved during a cardiac and ventilatory pause, since neither hemolymph nor water has to be moved. Consequently, phases of bradycardia and hypoventilation translate into reduced aerobic metabolism, however, pre-branchial hemolymph PO2 shows peaks and depressions synchronous to the activities of the cardiac and ventilatory systems (Burnett and Bridges, 1981).
Detailed studies exist of the properties and steady-state function of the pausing behavior (McDonald et al., 1980; Burnett and Bridges, 1981; Bradford and Taylor, 1982). However, reports on its response to warming and elevated CO2 levels are limited to increased frequencies in phase shifts of pericardial PeO2 as a result of rapid warming (1°C h−1; Metzger et al., 2007).
The focus of the present study was to investigate how elevated PwCO2 affects temperature-dependent ventilatory, cardiovascular, and/or aerobic performance in a large crustacean model; these components of the oxygen uptake and delivery system affect thermal tolerance in the edible crab C. pagurus. It was hypothesized that exposure to high CO2 levels limits the temperature-dependent capacity for performance in one or multiple components of the edible crab’s cardio-respiratory chain. Due to the functional connection of cardiac and ventilatory systems in Decapoda, metabolic rate, ventilatory water flow, and cardiovascular performance were recorded simultaneously in a non-invasive setup. Whole-animal metabolic rates () were used as a proxy for aerobic capacity and measured in a flow-through setup. They were recorded in conjunction with cardiovascular and ventilatory performance via either magnetic resonance imaging (MRI; for hemolymph flow, ventilatory water flow, and cardiac contractility) or infrared photoplethysmography (IR-PPG; for heart rates, stroke volumes, and cardiac output). Non-invasive measurements of multiple physiological parameters should allow for a closer look at the response of pausing behavior to environmental perturbations. A step-wise temperature increase until maximum summer habitat temperatures was performed under two CO2 levels, encountered in the animal’s natural habitat (Artioli et al., 2012; Atamanchuk et al., 2014).
Materials and Methods
Experimental Animals
Edible crabs Cancer pagurus (Linneaus, 1758) were caught via net fishing from R/V Uthörn in July 2017 around the island of Helgoland in the North Sea at depths between 10 and 20 m. They were transported to the aquaria of the Alfred-Wegener-Institute Helmholtz Centre for Polar and Marine Research, Bremerhaven, Germany and kept in natural seawater at 12°C and 32 salinity. Animals were allowed to feed to saturation on Mytilus edulis flesh. Food sources were replaced twice a week. To ensure baseline metabolism during measurements, food consumption was stopped 48 h before any experimental treatment by withholding any food from the animals (Ansell, 1973). All applicable international, national, and institutional guidelines for the care and use of animals were followed. All procedures performed involving animals were approved by the ethical standards of the institution at which the studies were conducted. Eight animals (seven females and one male) were used in the experiments, with a mean weight of 330 ± 39 g.
Experimental Setup and Water Parameters
Animals were placed in polyurethane chambers to allow for measurements of whole-animal oxygen consumption (metabolic rate, ) with flow-through respirometry (Figure 1). Infra-red photoplethysmography (IR-PPG) was used to determine heart rates (HR), proxies (SVP) for cardiac stroke volume (SV) and cardiac output (CO; Maus et al., 2019a). Cardiac motion, branchial hemolymph flow, and ventilatory water flow were determined non-invasively with the use of MRI (Maus et al., 2019b). Further details on the measurements are described in subsequent sections.
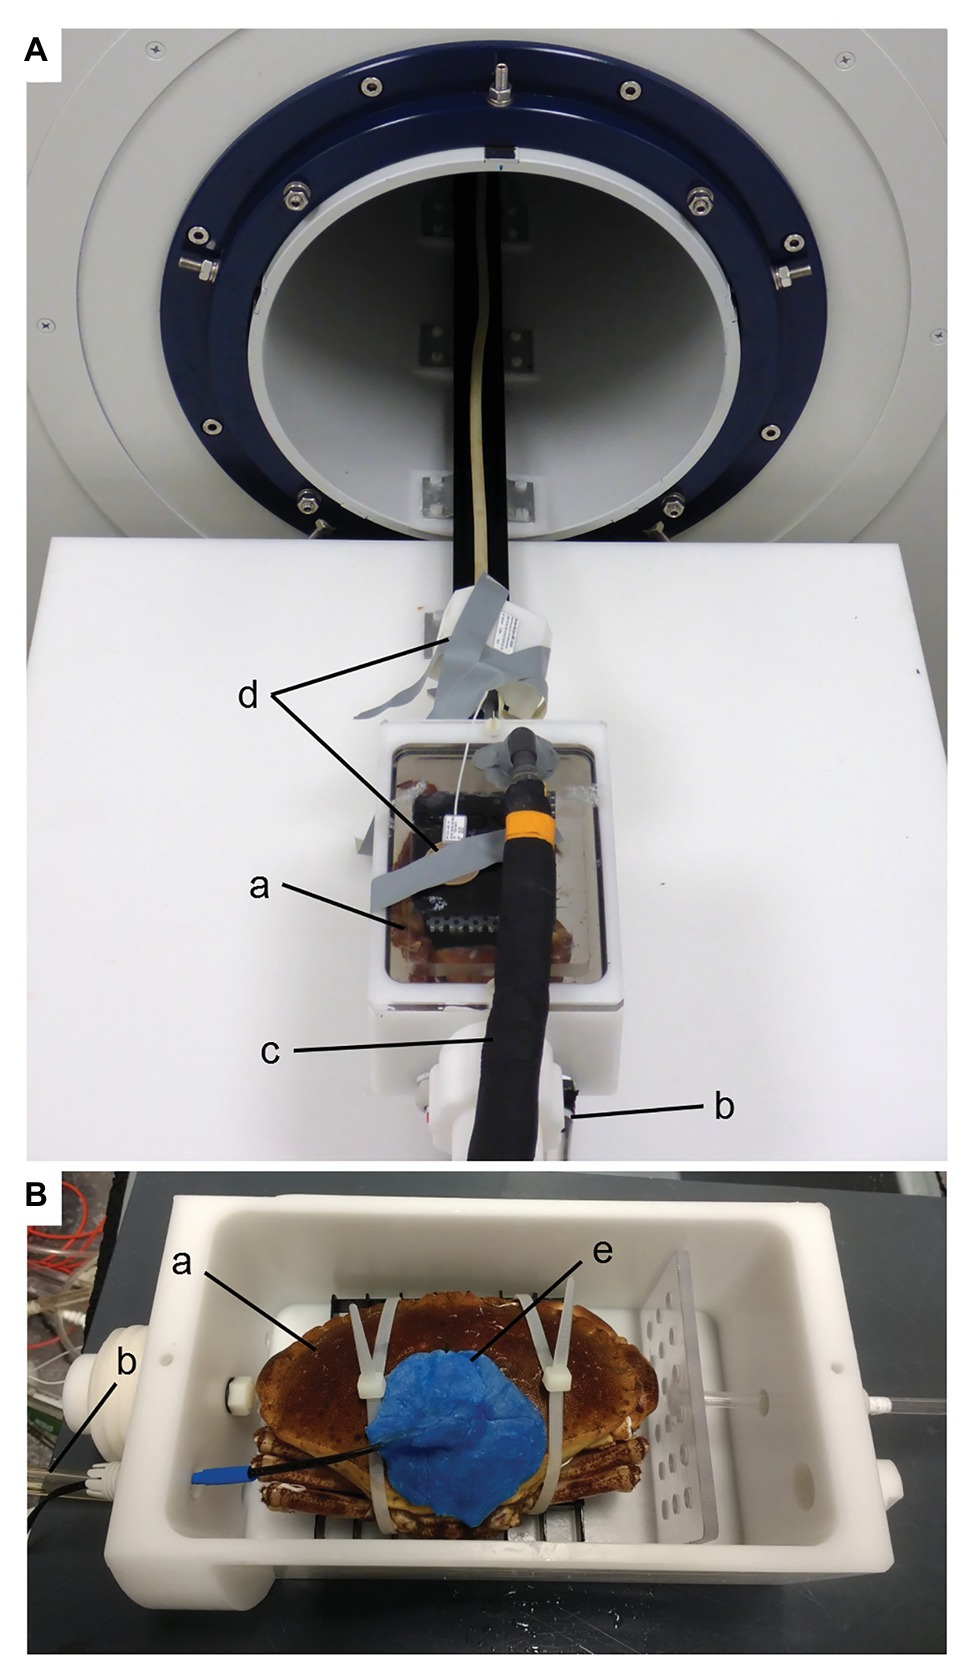
Figure 1. Experimental setup for MRI (A) and IR-PPG (B) experiments. The animal chamber is placed outside of the magnet in (A). Water is supplied to the crab (a) via the inlet (b) and leaves the chamber via a dorsal outlet (c). A surface coil (d) for improved signal reception is visible on top of the chamber but was not used for the present experiments. For IR-PPG experiments (B), a larger chamber was used to accommodate the plethysmograph sensor (e; see text). Animals were fixed to a plastic grid with cable ties. Once the chamber was closed with a lid similar to the one in (A), it was submerged in seawater and connected to water circulation for respirometry (see Supplementary Figure S2).
Temperature control of all natural seawater supply was set to 12°C (Eco 630G and Lauda Gold Series, Lauda-Brinkmann, Delran, NJ, United States). Animals were exposed to this control temperature under either control PwCO2 (400 μatm, normocapnia) or elevated PwCO2 (1,350 μatm, hypercapnia) for 1 day. All seawater reservoirs were covered with a lid to minimize CO2 exchange between atmosphere and water. At the defined PwCO2, water temperatures were increased at a rate between 0.17 and 1°C h−1. The rate of temperature change allowed for 10 h plateau phases at 14, 16, 18, and 20°C during working hours (Figure 2). After 10 h at 20°C, water temperature (Tw) was lowered to the control temperature of 12°C within 8 h (1°C h−1). One experimental run lasted 5 days. Three animals were subjected to IR-PPG experiments and five animals to MRI experiments. All techniques applied here were non-invasive, so normocapnic and hypercapnic experiments in each setup could be replicated on the same individuals, separated by at least 1 week of recovery in the animals’ holding aquaria (Field, 1977). Two females in the MRI experiments were only exposed to either normocapnic or hypercapnic warming.
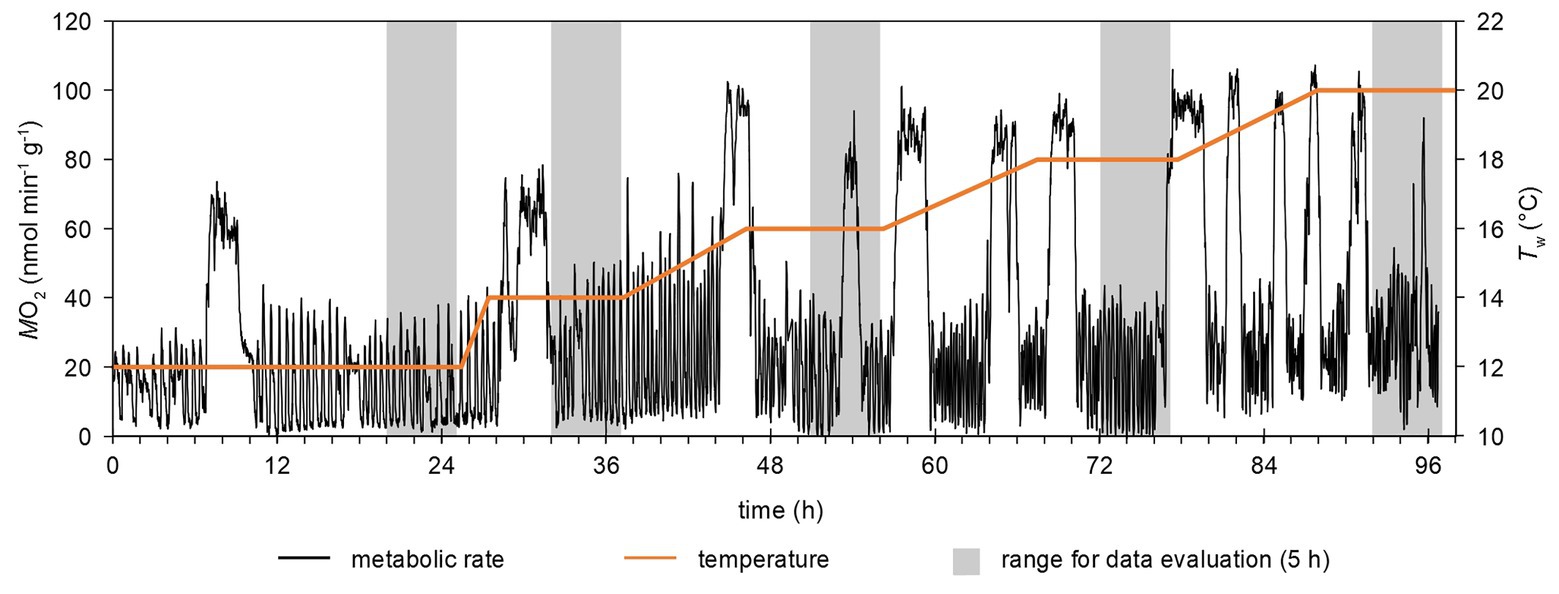
Figure 2. Example of a time-course of temperature changes and metabolic rate. Metabolic rate was continuously recorded in a flow-through setup at a rate of 1 min−1. Gray areas highlight the time frames for data evaluation, i.e., the last 5 h of each temperature step. Phases with continuously elevated (e.g., around hour 54 at 18°C) were excluded from the analysis (see text).
Water PCO2 was adjusted with an air-CO2 mix, set by a gas mixing device (PR4000; MKS, Andover, MA, United States). The water carbonate chemistry was monitored with a combined CO2 probe (CARBOCAP GMP343, Vaisala, Helsinki, Finland) and CO2 meter (CARBOCAP GM70, Vaisala), together with water pH measurements. The pH meter (pH3310, WTW, Weilheim, Germany) was calibrated in NIST buffers at 12 and 20°C to measure seawater pH (pHw) at these temperatures. pHw was converted to the free scale, with corrections for ionic strength and a reference pH in artificial seawater (Dickson, 2010; Waters and Millero, 2013). Water [HCO3−], total alkalinity (TA) and total dissolved inorganic carbon (DIC) were calculated in mmol per kg seawater with CO2Sys (Pierrot et al., 2006) with K1 and K2 from Millero (2010), KSO4 from Dickson (1990) and [B]T from Uppström (1974).
Respirometry
Whole-animal oxygen consumption was determined in a flow-through setup (Steffensen, 1989), incorporated into both, the MRI-experiments (similar to Mark et al., 2002) and IR-PPG experiments (similar to Zittier et al., 2015). Oxygen saturation (PwO2 in percent air saturation, corrected for atmospheric and water vapor pressure) was measured with temperature-compensated fiber-optical oxygen sensors (FIBOX 3; PreSens, Regensburg, Germany) directly before and after the animal chamber at a frequency of 1 min−1, using software PSt3 (v7.01, PreSens). Sensors were calibrated at 12°C for 0% O2 saturation in N2-gas and 100% saturation in the aerated flow-through system before each animal experiment. To reduce measurement errors during warming steps, another calibration for 100% saturation was conducted at 16°C. With the exception of this calibration step, PwO2 was measured continuously for 5 days. From the difference in oxygen partial pressure ∆PwO2 between inflow and outflow from the chamber, was calculated as
where FR is the rate of water flow through the chamber (ml min−1) and wf is animal fresh weight. Temperature-dependent oxygen solubility αO2 (μM torr−1) was taken from Boutilier et al. (1984). data were corrected for delays in water mixing in both experimental setups, determined in a separate experiment with hypoxic seawater at different water flow speeds. These time-corrected values for were aligned with the MRI or IR-PPG data, allowing for a temporal correlation between whole-animal oxygen consumption and cardiovascular performance. Previous tests confirmed a 3–4 min delay of the PwO2 signal between inlet and outlet optode, requiring a shift of data by this time frame, relative to immediate cardiovascular measurements. Whole-animal oxygen consumption integrates all aerobic processes in an animal and was therefore used to compare the physiological states of the animals in the different measurement setups (see below). In accordance with literature reports, phases of periodic fluctuations were deemed routine activity (McDonald et al., 1980) and shall be the foundation for the subsequent analysis.
Magnetic Resonance Imaging
In vivo MRI experiments were conducted in a 9.4 T horizontal animal scanner with a 30 cm bore (BioSpec 94/30 Avance III, Bruker BioSpin, Rheinstetten, Germany, RRID:SCR_018054). MRI allows for repeated, non-invasive measurements of the performance of the crustacean cardiovascular system (Maus et al., 2019b). Briefly, individuals were placed inside the MRI scanner in a respiration chamber (Figure 1A, polyurethane; Vchamber = 1 L, including Tygon© tubing between oxygen optodes, see above) and continuously supplied with seawater from an aerated 40 L header tank, controlled for PwCO2 and temperature. Water passed through the chamber at a rate of 200–300 ml min−1. It was collected in an overflow basin and then pumped back into the header tank via a peristaltic pump. To keep the animals’ carapace in place, it was attached to the removable lid with Velcro©. Three animals were subjected to MRI experiments under both hypercapnic and normocapnic conditions. Two other crabs were only subjected here to either normocapnic or hypercapnic warming (n = 4 per CO2 treatment).
Magnetic resonance images were acquired with a 154-mm-diameter 1H-tunable transmit-receive volume resonator, pre-configured for application on seawater samples (Bruker BioSpin). Adjustments of the magnetic field homogeneity, receiver gain, and reference power followed standardized protocols, integrated into the software ParaVision (v6.0.1; Bruker BioSpin).
Sagittal and coronal T1-weighted overview scans revealed the location of the heart and major blood vessels in the animal, such as the arteria sternalis and branchial veins. The scan parameters were; sequence = flow-compensated fast low-angle shot (FcFLASH); echo time (TE) = 12 ms; repetition time (TR) = 103.4 ms; flip angle = 60°; slice thickness (SI) = 1.5 mm; field of view (FOV) = 120 × 60 mm2; 256 × 128 pixels; and eight averages. Visual inspection of these overview scans confirmed developed gonads and no apparent differences in size and structure of the cardiac muscle in all experimental animals.
Ventilatory water flow and hemolymph flow velocities in the branchial veins and arteria sternalis were quantified using flow-weighted gradient-echo MRI (Bock et al., 2001; Maus et al., 2019b; Supplementary Figure S1). Scan parameters: phase-contrast MRI (FLOWMAP); TE = 12 ms; TR = 25 ms; flip angle = 30°; SI = 1.2 mm; FOV = 100 × 100 mm2; 256 × 256 pixels; 16 averages; and velocity encoding = 12 cm s−1. Hemolymph and water flow velocities were determined in manually set regions of interest (ROI) in the Image Display and Processing platform within ParaVision. Hemolymph flow was quantified in the inner (efferent) branchial veins of gills 6–8 on both sides of the animals, as well as the sternal artery. Left and right branchial hemolymph flow velocities were averaged for these three gills, respectively. Ventilatory water flow was taken from the anterior transition of the branchial chamber to the excurrent channel. Water flow through the branchial chamber is linearly correlated with scaphognathite beating during forward ventilation (McDonald et al., 1980). The slice position was adjusted to cover a coronal cross-section of the respective blood vessels and the excurrent channel. Since the side of perfusion/ventilation was arbitrary and subject to change during the acquisition, the flow velocities for left and right gill chambers are presented here as sums for both sides.
Axial single-slice IntraGate© CINE MRI scans were performed to visualize cardiac contractility directly. Contractility is defined here as change in distance between the two lateral ostia between end-diastolic and end-systolic phases. The scan parameters were: sequence = IgFLASH; TE = 3.885 ms; TR = 8 ms; flip angle = 60°; SI = 1.2 mm; FOV = 120 × 60 mm2; 256 × 125 pixels; 100 oversampling steps; and 10 cardiac frames. Contractility was determined through the difference in lateral diameter of the ventricle between the two in-plane ostia between end-diastole and end-systole using ParaVision’s image viewer.
Magnetic resonance images were recorded for the last 4–5 h of each temperature step (i.e., 12, 14, 16, 18, and 20°C; Figure 2). One CINE scan every 15 min (four per hour) was followed by three flow velocity measurements (12 per hour).
Infrared Photoplethysmography
Heart rates (HR) were derived together with a stroke volume proxy (SVP) from IR-PPG recordings of individual crabs (isiTEC, Bremerhaven, Germany; Depledge, 1984). The animal chamber for these measurements was slightly larger than the one used for MRI experiments (V = 1.87 L) and submerged in a 40 L seawater tank (Figure 1B; Supplementary Figure S2). Aeration and control of Tw and PwCO2 was achieved as described above. The wire of the IR-PPG sensor was guided out of the chamber through a water-tight hole. Otherwise, the chamber had one inlet and one outlet to allow for the flow-through respirometry setup. Animal movement in the chamber was restricted by strapping the animal to a plastic grid with cable ties (Frederich and Pörtner, 2000). The IR-PPG sensor was attached to the cardiac region of the carapace using superglue and dental wax (Figure 1B). Signals were amplified with a 5 V amplifier, digitized by an A/D converter (Powerlab/8SP; ADInstruments, Dunedin, New Zealand) and recorded in LabChart (v7, ADInstruments, RRID:SCR_017551) at a rate of 1 k s−1. Similar to the MRI experiments, only the last 5 h were analyzed per temperature step.
Raw IR-PPG signals were smoothed (0.1 s) and filtered for noise (0.02 V). Positive peaks representing heart contraction were defined at a minimum peak height of 1.5–3.4-fold standard deviation and counted at 1-min-intervals. Stroke Volume Proxies (SVP) were determined from the signal integral of the raw signal relative to the absolute minimum of a 1-min-interval using the mid-point approach (Maus et al., 2019a). SVP were normalized to a mean SV of 0.2 ml beat−1 (Burnett et al., 1981; Bradford and Taylor, 1982) at 12°C normocapnia and hypercapnia to account for different signal quality. This showed relative SV changes to 12°C under both CO2 conditions and allowed for the calculation of cardiac output (CO) as the product of HR and SV.
Statistics and Data Analysis
For each combination of animal, Tw and PwCO2, the total range of was divided into quarters. The time spent in the highest and lowest 25% of the total range is given as a percentage of total time for each combination of Tw and PwCO2. This allowed for the analysis of the pattern of the changes over time (i.e., time spent at maximum or minimum activity of the periodic changes). Temperature-dependent differences in these grouped times at one PwCO2 were compared with a Kruskal Wallis test (ANOVA-on-ranks) and a Tamhane T2 post hoc test. CO2-dependent differences at one temperature were tested with the Wilcoxon rank-sum-test.
The distribution of data points for any combination of Tw and PwCO2 was tested for normal distribution (Shapiro-Wilk test) and equal variance (Levene’s test). Changes in water carbonate chemistry and cardiac lateral contractility were investigated over the temperature increase at set PwCO2 by comparing values for 12 and 20°C and for differences between normocapnic and hypercapnic conditions at set temperatures (Student’s t-test).
The inherent variability over time in metabolic rate, ventilation, hemolymph flow and cardiovascular activity led to non-normal distribution of values even at control conditions. The effects of temperature and hypercapnia on these parameters were investigated with a linear mixed effects model (R Project, RRID:SCR_001905; package lme4; Bates et al., 2015). Prior to calculations, the data were standardized. Temperature, CO2 level (i.e., normocapnia or hypercapnia) and their interaction were treated as fixed effects. Animals were treated as random effects with random intercepts. This way, for each physiological parameter, the repeated measurements on one individual and inter-individual baseline activities could be accounted for. Accordingly, collective analyzes of physiological responses to Tw and PwCO2 were possible. The inclusion of random slopes was omitted to avoid overfitting of the model, which leads to a significant loss in statistical power (inflated Type II error rate; Matuschek et al., 2017). Given the large amount of observations, the assumptions for homoscedasticity and normality of the standardized residuals are fulfilled sufficiently (see Supplementary Figure S3) and statistically relevant results with low Type I error rates can be retrieved with correct covariance structures despite small animal numbers (Oberfeld and Franke, 2013). Suitability of the model with the chosen effects was verified via likelihood-ratio-tests against models without these effects (for detailed results, see Supplementary Table S1). The model code and detailed model estimates can be retrieved from the supplementary material (estimates; Supplementary Table S2). Model estimates were extracted using the R package stargazer (Hlavac, 2018). Differences between combinations of temperature and normocapnic/hypercapnic treatments were determined through an all-pairwise-comparison of means with Tukey’s HSD correction using the R package emmeans (Lenth et al., 2020; Supplementary Table S3).
Physiological parameters are visualized through violin plots, showing the probability density distribution of the recorded data. The width of a plot corresponds to the number of measurements at this value, where narrower violin width indicates fewer instances or data points and wider width shows a larger number of instances. Since data for a specific combination of Tw and PwCO2 were recorded from a time series, a wider violin can also be interpreted as more time spent at this value (resulting in more frequent measurements).
The linear correlation between ventilatory water flow and branchial hemolymph flow was assessed from phase-contrast MRI using Pearson’s correlation coefficient. Except for the linear mixed effects model, all statistical analyzes were performed using SPSS (v25, IBM Corp., Armonk, NY, USA, RRID:SCR_002865). The level of significance for all tests was α = 0.05. If not stated otherwise, values are given as means ± standard deviation.
Results
Seawater Parameters
The seawater carbonate chemistry under different CO2 treatments is presented in Table 1 for 12 and 20°C. Significant differences in PwCO2 and seawater pH (pHw; free scale) were found between the two CO2 treatments at both temperatures. Total alkalinity (TA) and dissolved inorganic carbon (DIC) were the most variable components of the carbonate system between all groups, but changes were within 400 μmol kg−1 (<20%) throughout. At a given PwCO2, carbonate chemistry remained generally unchanged between 12 and 20°C. With one CO2 treatment, the significant differences in pHw and PwCO2 between 12 and 20°C were small on absolute scales, especially compared to the differences between the two different CO2 levels. Despite nominally identical conditions, high-CO2-conditions resulted in pHw, [HCO3−]w, TA, and DIC values were significantly different between MRI and IR-PPG experiments; still, absolute differences were not larger than between temperature treatments and thus also considered negligible. Random samples at intermittent temperatures (14, 16, or 18°C) have confirmed stable seawater conditions per treatment during the different warming steps in both experimental series (data not shown).

Table 1. Seawater parameters during MRI and IR-PPG experiments.
Time Course Variations of Metabolic Rate, Ventilation, and Cardiac Performance
Over the entire temperature range, resting animals showed periodic variations in the metabolic rate (), with values fluctuating between short, pronounced maxima, and values close to 0 nmol min−1 g−1 (at least for the lower temperatures, Figure 2). The amplitude of these periodic changes increased during warming, mainly driven by rising maxima. Minimum levels close to 0 nmol min−1 g−1 were not found above 18°C under normocapnia. On average, 1–3 peak oxygen consumption pulses per hour were found at 12°C, irrespective of PwCO2. The shape of changes was similar in the MRI and the IR-PPG setups, and across animals (Figure 3). At 12°C, maxima had a short duration (<10 min), typically followed by a steady decline to baseline levels and a phase of nearly undetectable oxygen consumption (~10 min each). The transition back to maximum values was much faster than the subsequent decline (Figures 3A,C). The time course of changes in was mirrored by changes in ventilation activity, hemolymph flow, and heart rate (HR, Figure 3). Most likely due to the lower temporal resolution of the flow measurement technique, the changes in ventilation and hemolymph flow did not perfectly match the pattern in . Still, periods of low were defined by severe hypoventilation and bradycardia. Unilateral ventilation and perfusion of branchial veins were usually found during these phases of fluctuating activities.
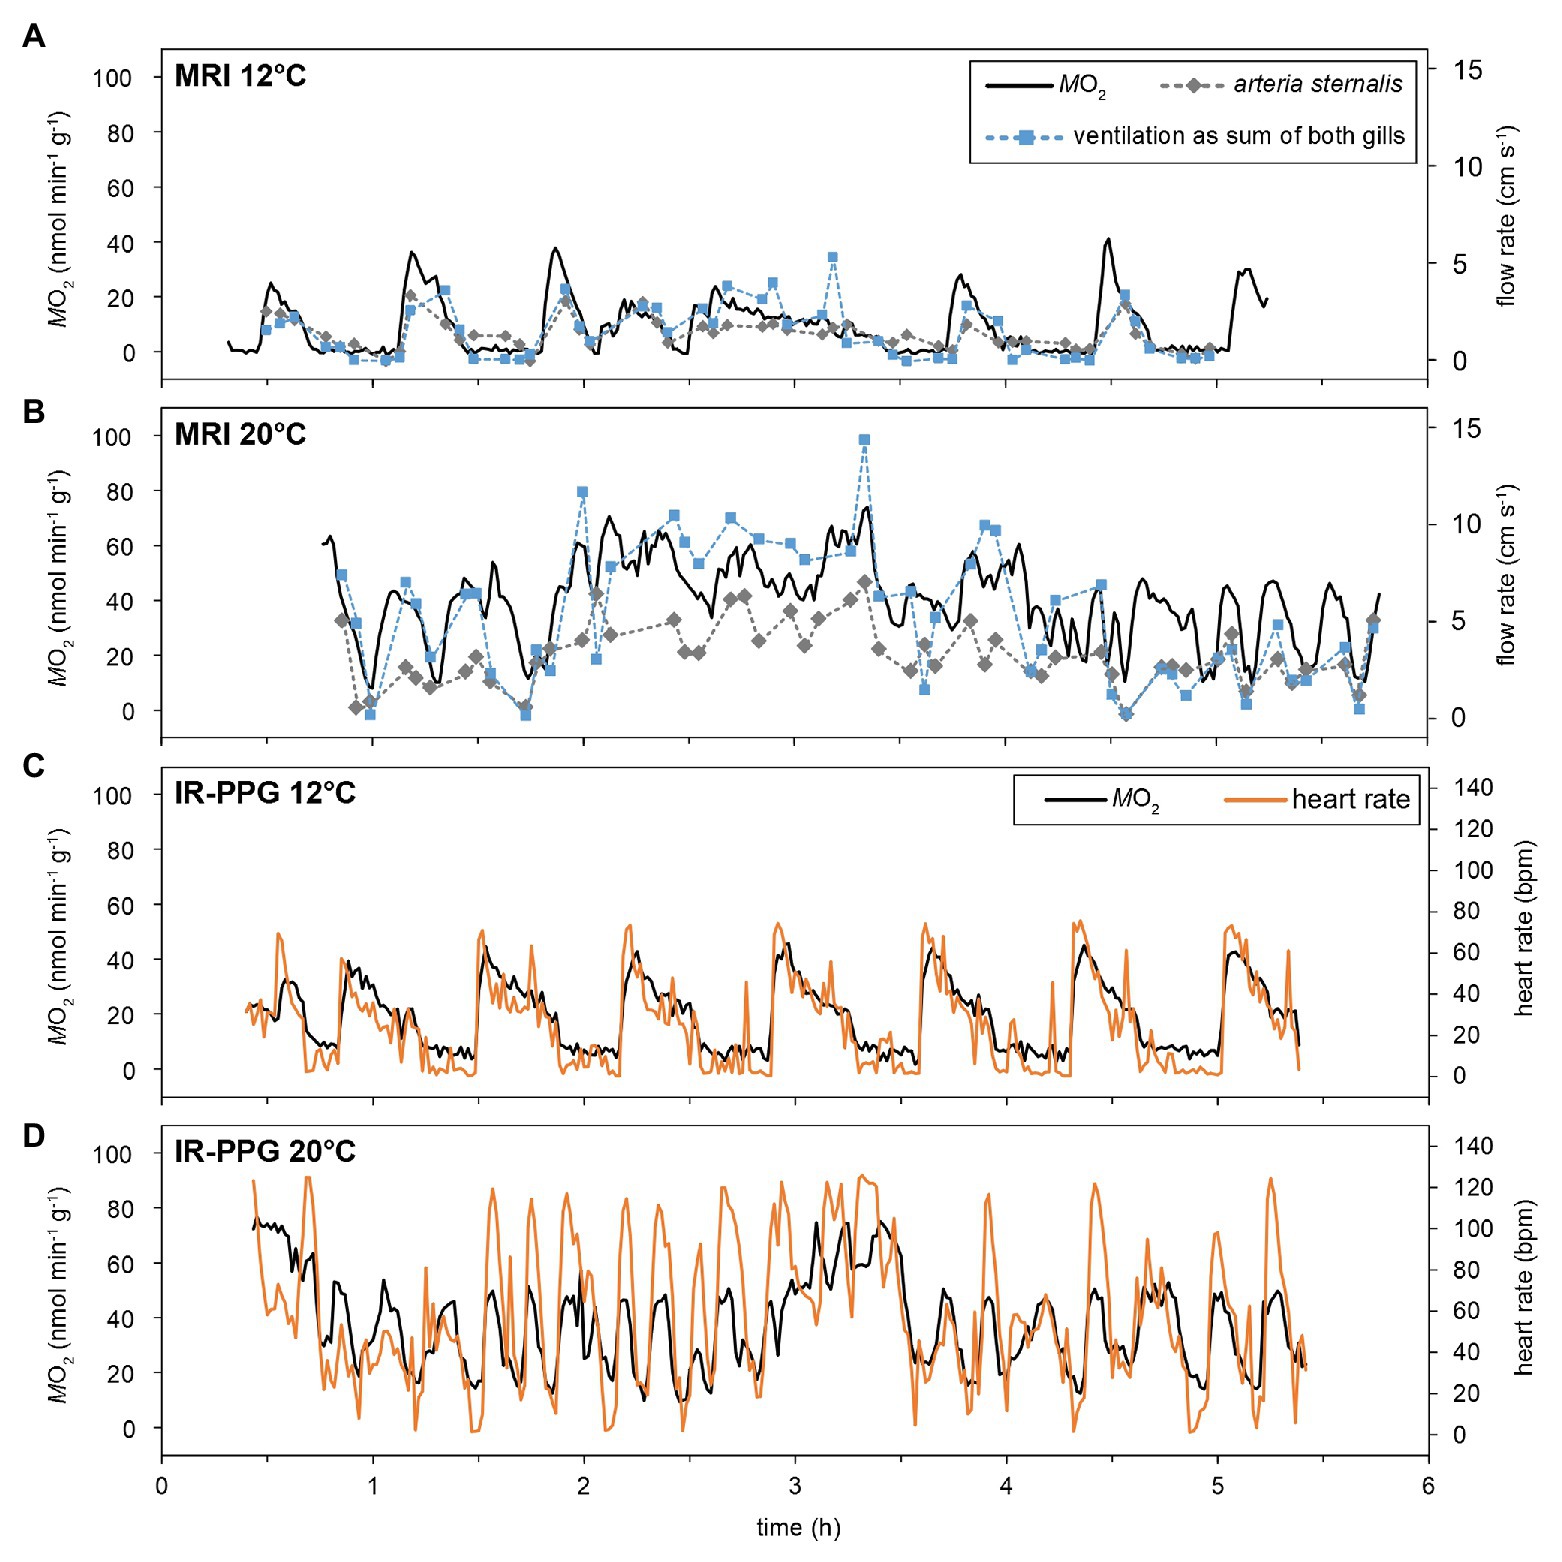
Figure 3. Effect of temperature on the time-course of oxygen consumption, ventilation, and cardiovascular performance. MRI experiments allowed for simultaneous recording of , ventilatory water flow (as sum of both gills), as well as hemolymph flow in selected vessels (A,B; for vessels please check Supplementary Figure S1). To improve visibility, only the flow in the arteria sternalis is depicted, but its time course is matched by branchial hemolymph flow. IR-PPG experiments determined together with heart rates (C,D). Metabolic rates and heart rates could be recorded at a rate of 1 min−1, whereas marks for flow velocities indicate the endpoints of a 3-min measurement. The figure shows recordings obtained from two different individuals for the two setups, however, recordings for 12 and 20°C are from the same animal within one setup.
With rising temperatures, the fluctuating pattern in activity remained persistent but periodic changes were less clearly defined than at 12°C. displayed fluctuations even at 20°C in both setups and its changes were still mirrored by fluctuating ventilation, hemolymph flow, and heart rate (Figures 3B,D). The frequency of activity changes increased with rising temperatures, but in different animals, the periodicity was lost to various degrees. Warming also resulted in more frequent phases of spontaneously elevated activity (Figures 2, 3B,C) when whole-animal activity (i.e., metabolic, ventilatory, circulatory, and cardiac performance) remained high for several hours. Bilateral ventilation and branchial perfusion were typical for these phases. Since phases of spontaneously elevated activity occurred randomly and had different magnitudes and durations, they were excluded from the subsequent analyzes (as an example see hours 2–4 in Figure 3B), focusing instead on routine activity levels across treatments.
Metabolic Rate Under Warming and Elevated CO2
Figure 3 shows the distribution of values recorded for at specific temperatures and CO2 levels. Metabolic rates were significantly different between all temperatures and CO2 levels. At 12°C, crabs mostly displayed a low around 5–10 nmol min−1 g−1 (wider violin in this range of values), though, under high CO2 only, individual peak metabolic rates already reached 75 nmol min−1 g−1 (narrow violin in this range; Figure 4A). This maximum was not substantially surpassed but more frequently reached during subsequent exposures to higher temperatures (increased width at the violin’s top with rising temperatures). Phases of undetectable metabolic activity ( = 0 nmol min−1 g−1) were recorded under normocapnia until 18°C. Under hypercapnic conditions, zero-levels in were even found at 20°C. Warming caused a rise in median , but the median under hypercapnia at 18 and 20°C was lower than the normocapnic median. Furthermore, the most frequently measured (indicated by the widest part of the violins in Figure 4A) shifted to higher values, but similar to the medians, this shift was larger under normocapnic warming across the entire temperature range. Eventually, this resulted in a more even distribution of values to both sides of the median for 18 and 20°C. Significant distribution differences were found for nearly all combinations of temperature and PwCO2. Generally, appears to scale stronger with temperature under normocapnia than under hypercapnia.
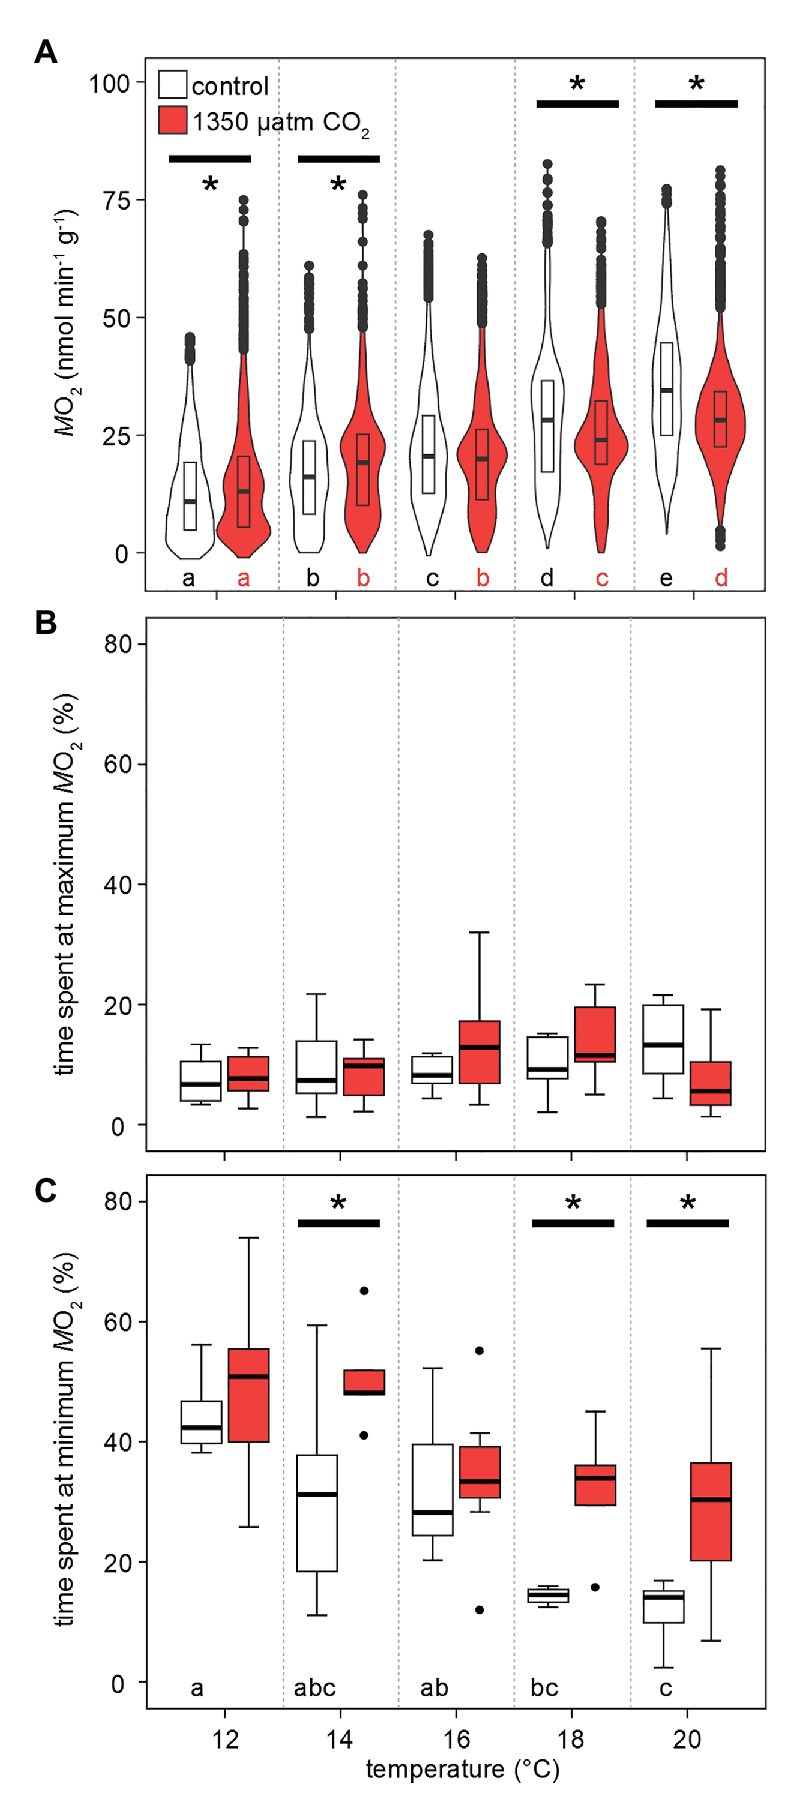
Figure 4. Effects of temperature and PwCO2 on metabolic rates. (A) Probability density distribution of metabolic rate (n = 4 from MRI experiments per PwCO2 + 3 from IR-PPG experiments). The maximum width of the violins is proportional to the overall sample size. For clarity, interquartile ranges (IQR, box) and medians (bold line) are added. Circles = data points larger than 1.5 × IQR. (B) Grouped time spent in the highest 25% and lowest 25% (C) of total amplitude during phases of fluctuating activity. These data are corrected for significant outliers (Iglewicz and Hoaglin’s robust test for multiple outliers, modified Z score ≥ 3.5). Whisker = 1.5 × interquartile range (IQR), box = IQR, bold line = median, circles = outlying data points. Asterisks denote significant differences between control and high CO2 conditions at the respective temperature (A): Tukey’s HSD all-pairwise comparisons following a linear mixed model; (B,C): Wilcoxon rank-sum test; p < 0.05. Letters show significant differences between each temperature step for a constant PwCO2 (A): Tukey’s HSD all-pairwise comparisons following a linear mixed model; (B,C): ANOVA on ranks, Tamhane T2; p < 0.05.
The shift in the distribution of the most frequently measured metabolic rates becomes more obvious when looking at the share of values in the lowest and highest quarter of the entire range of values. This division translates into the time at the minimum and maximum 25% of values during the phases of fluctuating activity. Under both PwCO2 levels and across the entire temperature range, all animals spent ~15% of the measurement time in the top quarter of activity levels (Figure 4B). On the other hand, warming reduced the time spent at minimum activities from 40 (12°C) to 17% (20°C) under normocapnia. When exposed to high-CO2 warming, animals spent significantly more time (30–50%) at low activity levels. This means that at 18 and 20°C, the animals spent nearly twice as long in the low activity range under hypercapnia when compared to control CO2 levels (Figure 4C).
Ventilatory Water Flow and Hemolymph Flow
Like , median and maximum ventilatory water flow and hemolymph flow increased with rising temperatures (Figure 5). Also, the maximum violin width shifted to higher values, indicating that higher ventilation and hemolymph flow velocities were measured more frequently with warming. Ventilatory water flow, recorded from velocity encoded phase-contrast MRI, revealed forward ventilation during virtually the entire set of measurements (negative values at the excurrent channel in Supplementary Figure S1). Toward the upper end of the temperature range, maximum ventilatory flow velocities were twice as high as at 12°C. Despite comparable peak velocities, hypercapnic conditions led to significantly lower ventilatory water flow at 20°C in comparison to normocapnic conditions (Figure 5A). A depressed ventilation under elevated CO2 is underlined by the nearly constant velocities recorded during hypercapnic warming, whereas velocities significantly increased during normocapnic warming between 16 and 20°C.
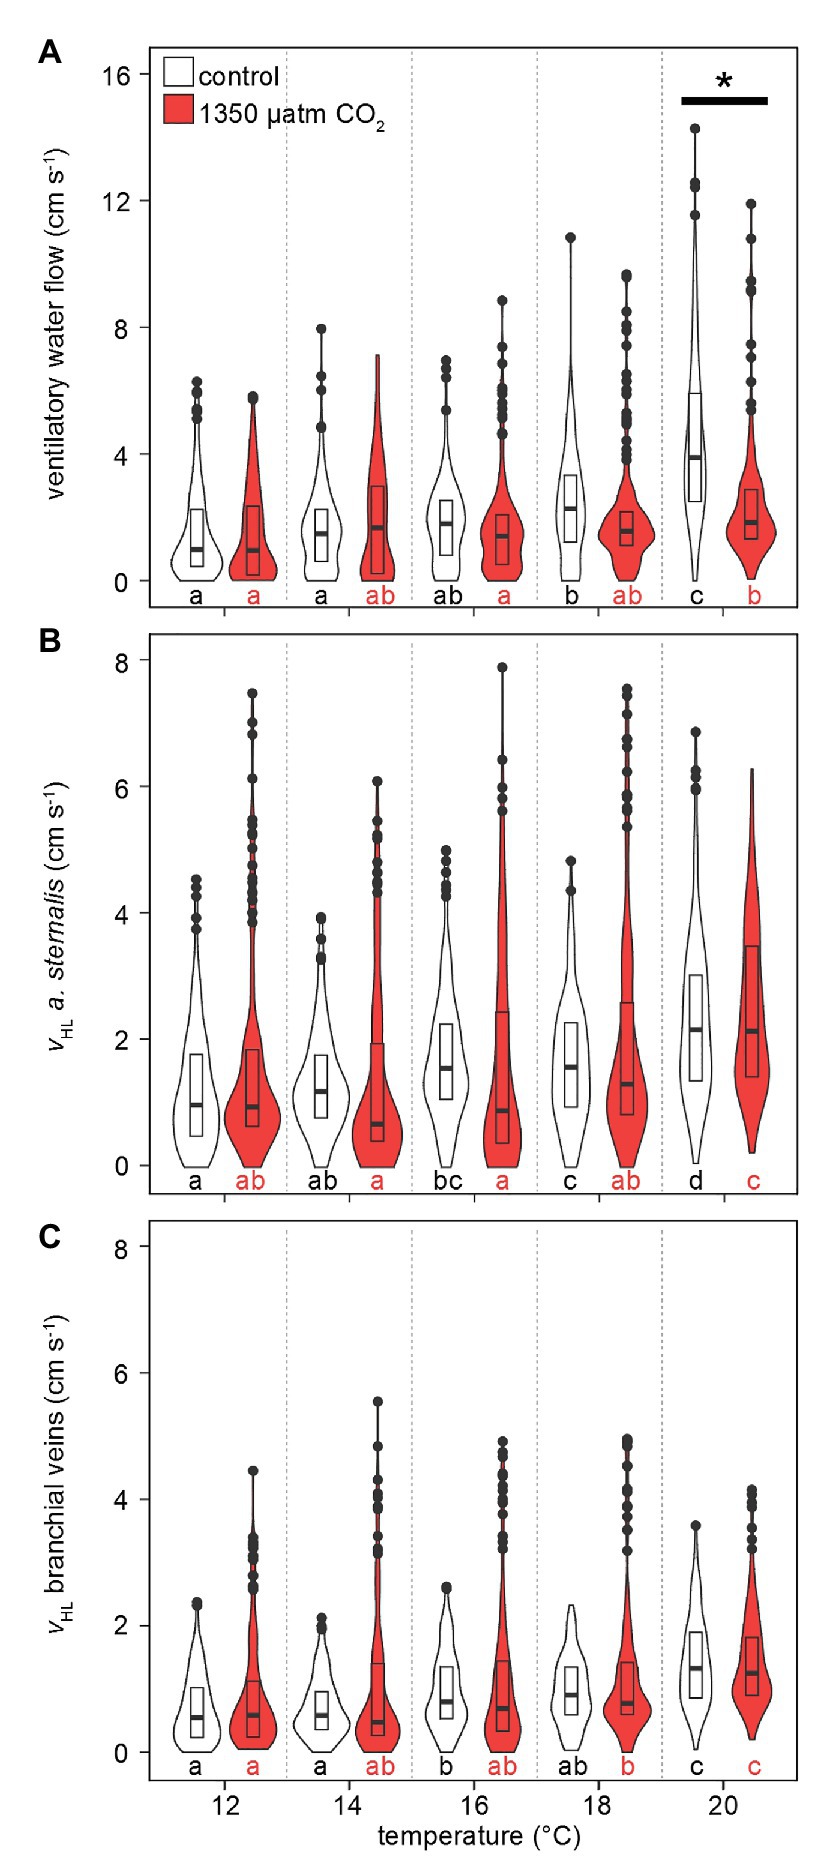
Figure 5. Effect of temperature and PwCO2 on ventilatory water flow and hemolymph flow velocity. (A) Ventilatory water flow through the branchial chamber. (B) Hemolymph flow velocity in the arteria sternalis. (C) Hemolymph flow velocity in efferent branchial veins, averaged for gills 6–8. Branchial water and hemolymph flow are presented here as sums for left and right gills, to account for shifts in unilateral gill utilization. Violins show probability density distributions of the respective parameters. The maximum width of the violins is proportional to the overall sample size (n = 4 animals per PwCO2). For clarity, interquartile ranges (IQR, box) and medians (bold line) are added. Circles = data points larger than 1.5 × IQR. Asterisks denote significant differences between control and high CO2 conditions at the respective temperature. Letters show significant differences between each temperature step for a constant PwCO2 (Tukey’s HSD all-pairwise comparisons following a linear mixed model; p < 0.05).
Warming caused an increase in hemolymph flow velocities in the arteria sternalis and the branchial veins (Figures 5B,C). Overall values were not significantly different between CO2 levels but maximum flow velocities were higher by ~2 cm s−1 under hypercapnia between 12 and 18°C. Despite the high maximum flow velocities under hypercapnia (up to 8 cm s−1 in the arteria sternalis), the most frequently measured flow velocities (widest part of the violin) between 12 and 16°C were found at relatively low values <2 cm s−1 or < 1 cm s−1 for the arteria sternalis or the branchial veins, respectively. At 18°C, the distribution of values becomes more similar for both CO2 levels in both vascular systems. At 20°C, the maximum flow velocities differed less between CO2 levels, signified by a decline in maximum flow velocities under high CO2. Consequently, both vascular systems showed nearly identical performance at 20°C, irrespective of PwCO2 (Figures 5B,C).
Figure 6 presents the correlation between ventilatory water flow and branchial hemolymph flow, separated for left and right gills, under all experimental conditions. There is a significant linear correlation between the two parameters. The lower ventilatory water flow under elevated CO2 in both gills (Figure 5A) is visible in a weaker correlation between ventilatory and hemolymph flow, resulting in a lower ventilation/perfusion ratio.
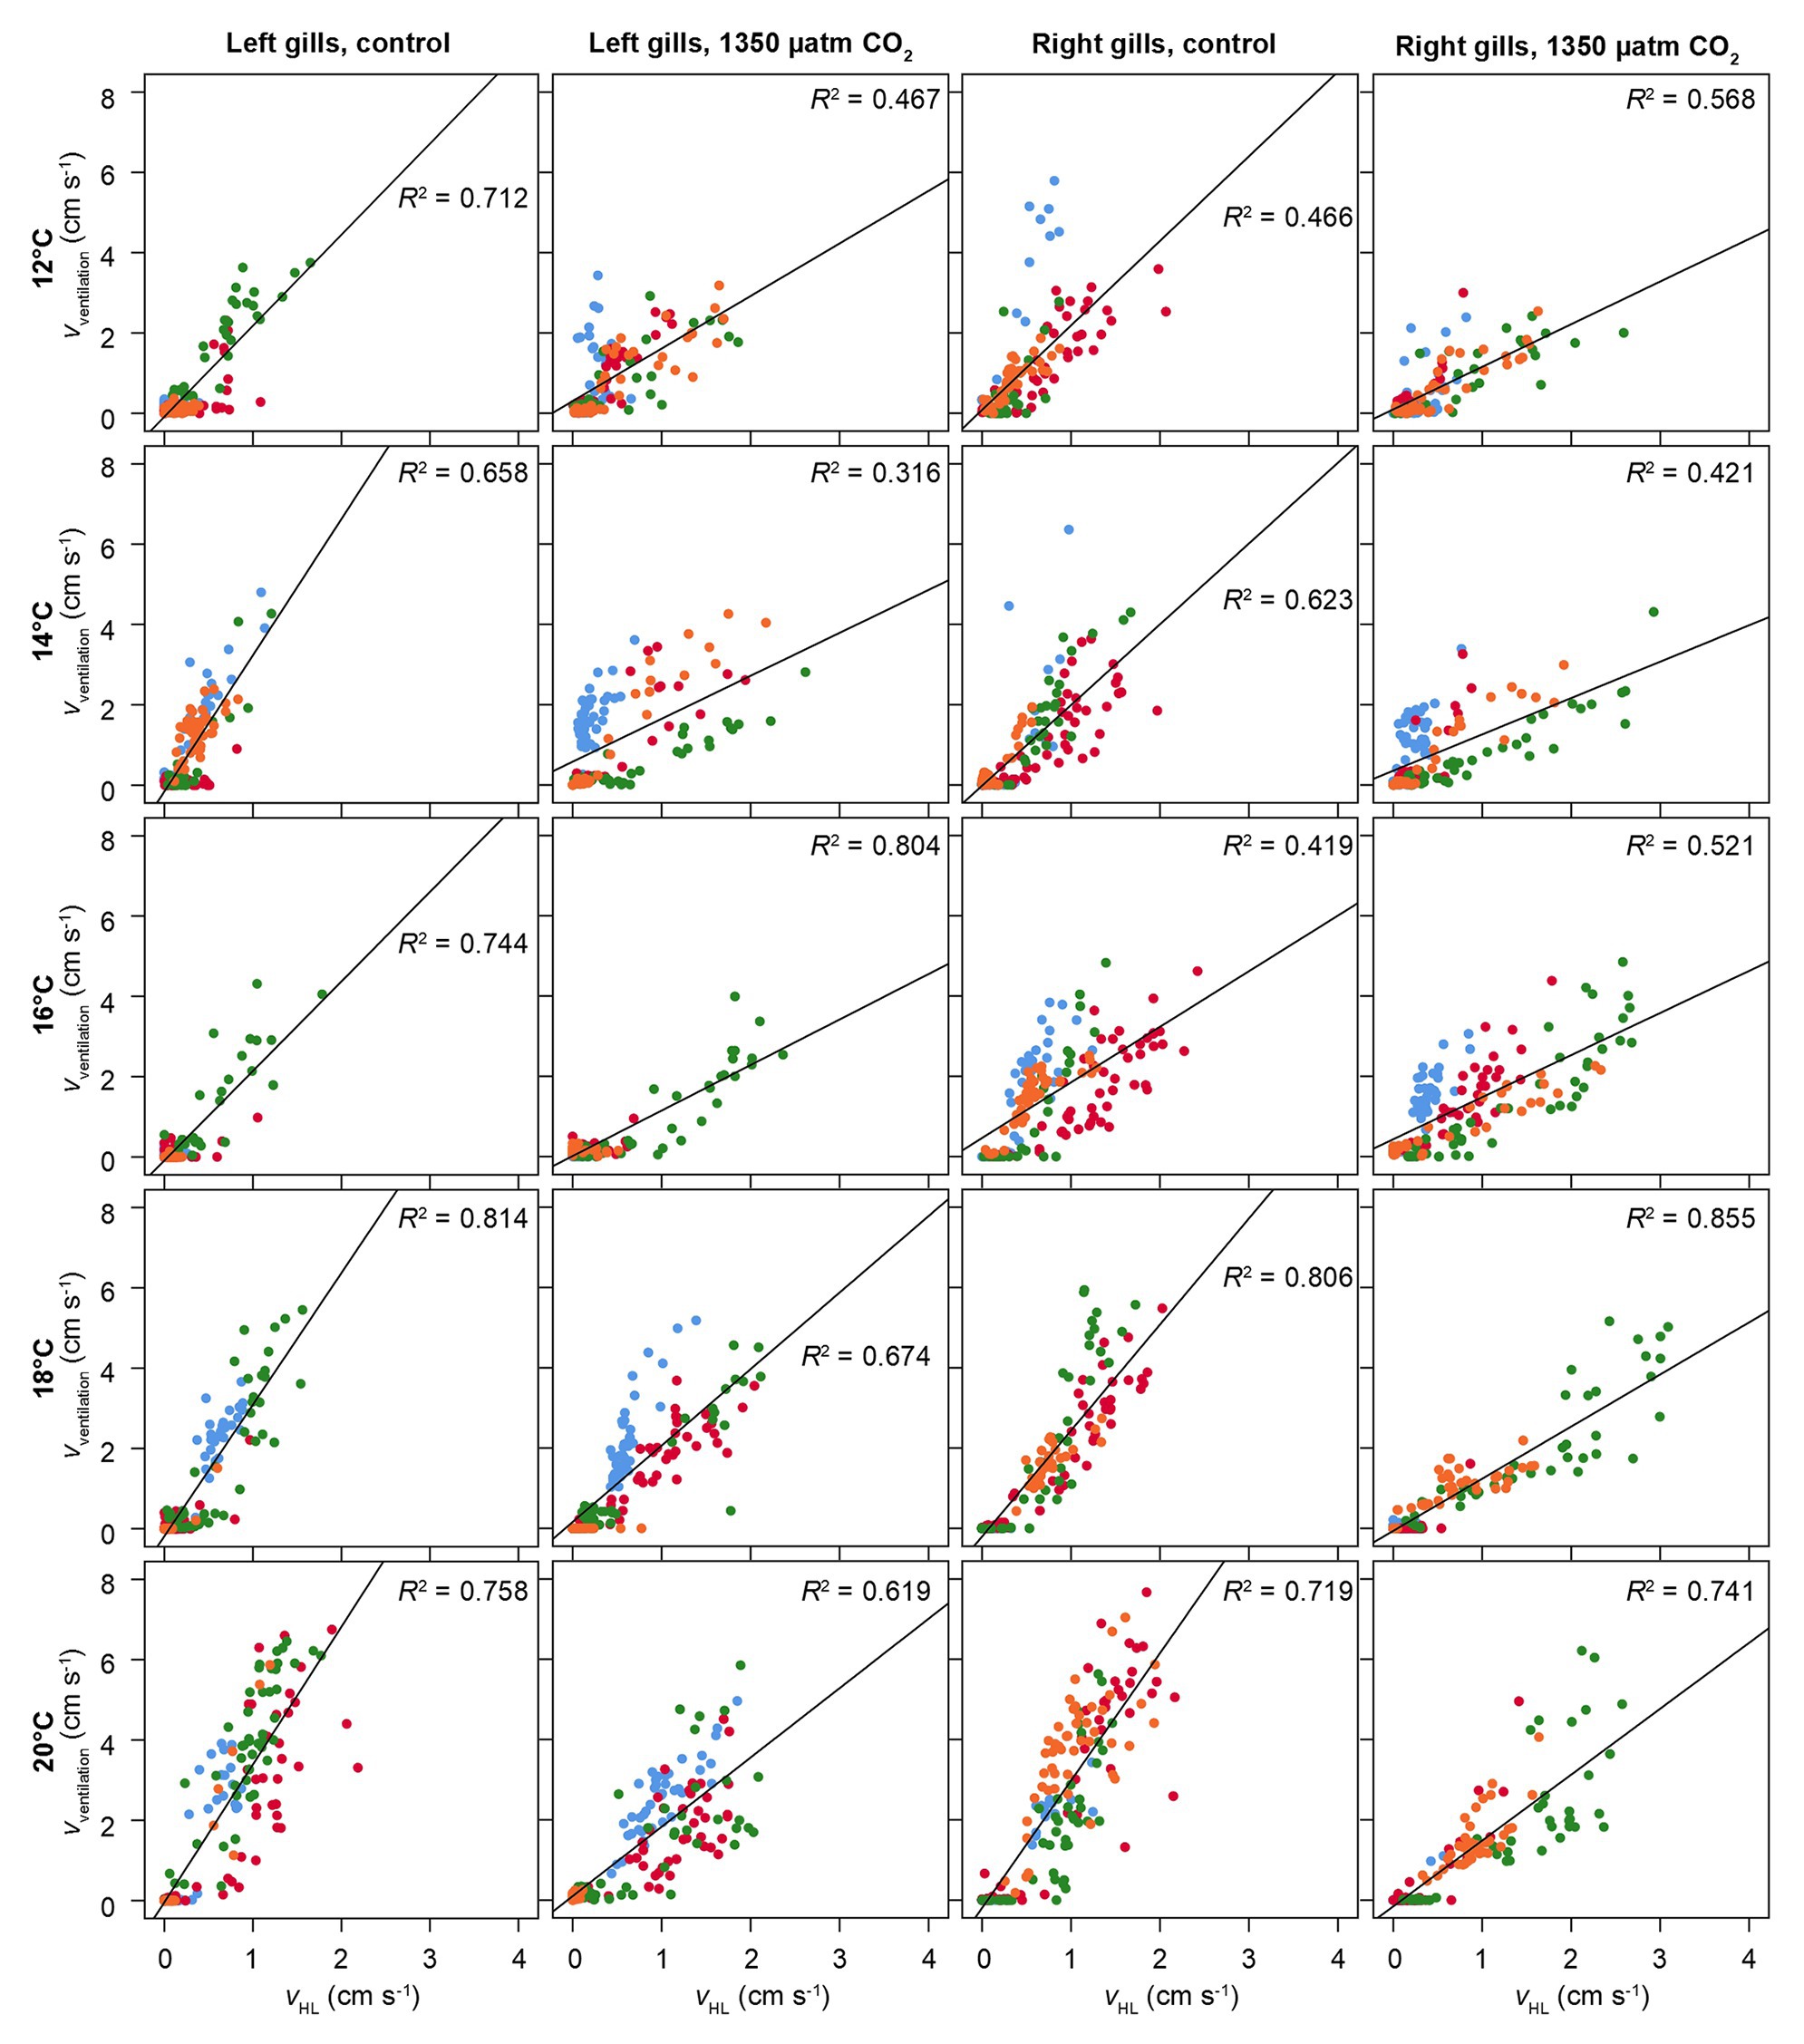
Figure 6. Correlation between hemolymph flow in branchial veins and ventilatory water flow. vventilation = velocity of ventilatory water flow. vHL = velocity of hemolymph flow in branchial veins. Different colors show different animals. Flow velocities were recorded from coronal phase-contrast MRI (for scan parameters, see text). Correlations were separated for left and right gills. Squared linear correlations coefficients (Pearson) are given, together with a linear regression line for the entire set of animals per temperature and CO2 level. Significant positive correlations between hemolymph flow and water flow were found under all conditions (p < 0.05).
Cardiac Performance
The responses of heart rates to warming under both CO2 levels were similar to those observed for metabolic rates: lower HR were recorded more frequently at low-to-medium temperatures (maximum violin width between 0 and 25 bpm at 12–16°C, Figure 7A). This distribution gradually shifted to higher HR with rising temperatures, driven by rising maximum values and medians. Compared to , the temperature-dependent increase in maximum HR values was delayed, as temperature-dependent differences were found in two steps: at 16°C and then at 18–20°C. At 12 and 14°C, maximum HRs were below 100 bpm. Highest HRs (~125 bpm) were found at 18°C and beyond. Hypercapnic HR medians were lower than normocapnic medians throughout, but this difference became significant only at Tw > 16°C, i.e., once the temperature effect on HR became significant. Conclusively, hypercapnia caused relatively depressed HR at the higher temperatures in this experiment.
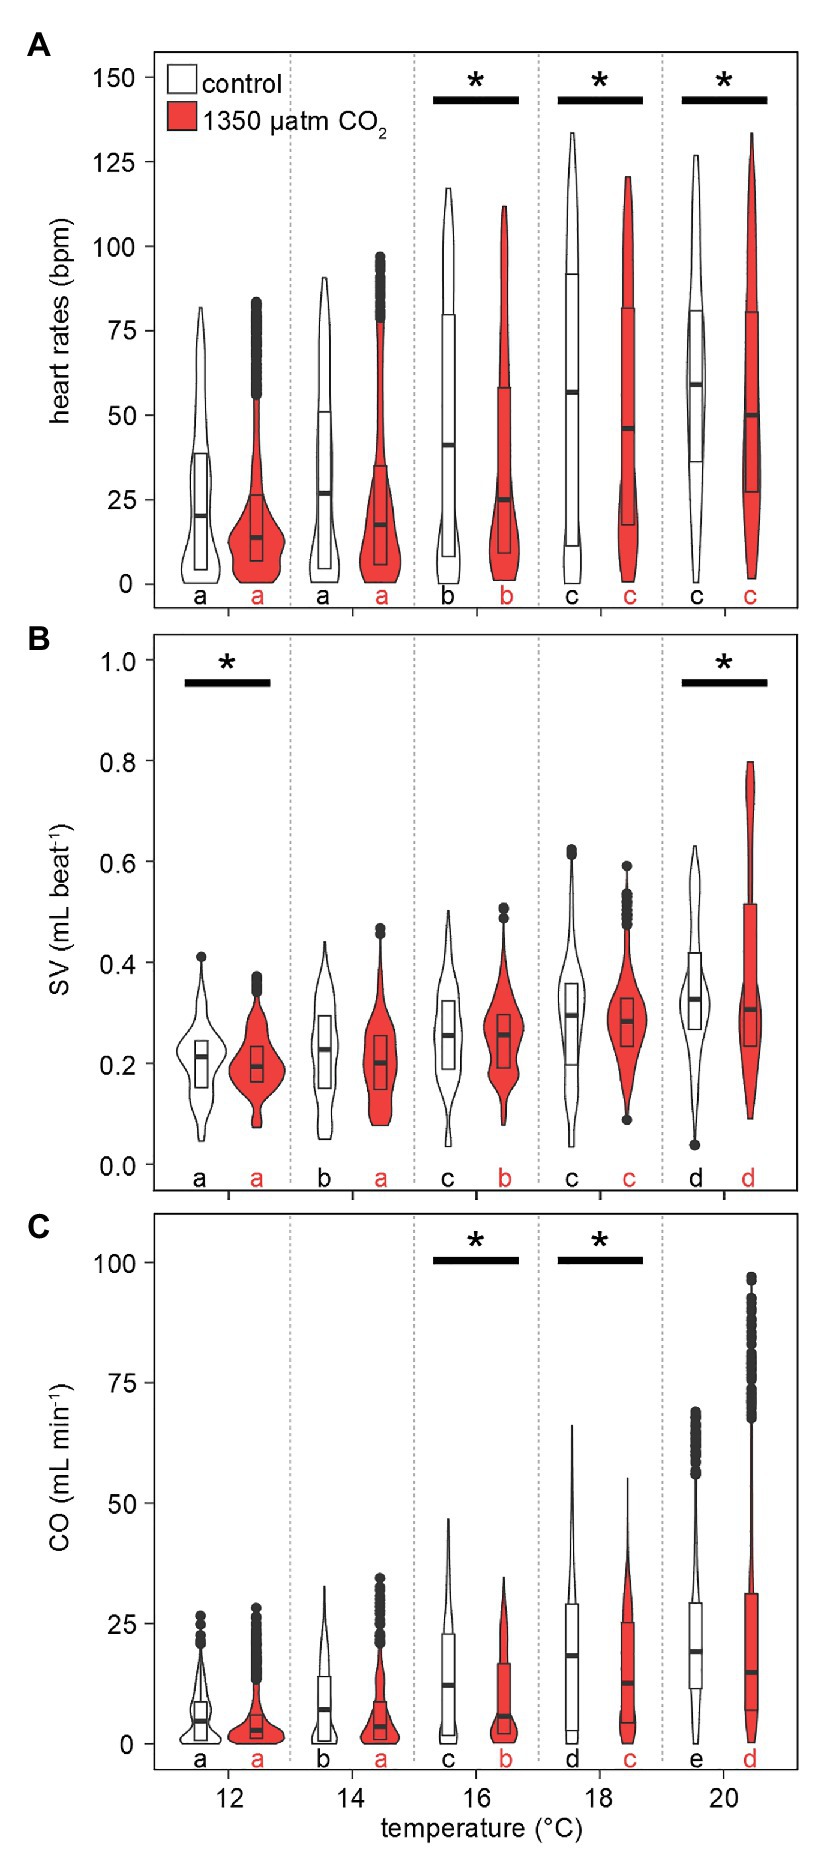
Figure 7. Effects of temperature and PwCO2 on cardiac performance. (A) Heart rates. (B) Stroke volume proxy, normalized to the 12°C mean of 0.2 ml under normocapnia and hypercapnia, respectively. (C) Cardiac output as a product of HR and SV. Violins show probability density distributions of the respective parameters. The maximum width of the violins is proportional to the overall sample size (n = 3 animals). For clarity, interquartile ranges (IQR, box) and medians (bold line) are added. Circles = data points larger than 1.5 × IQR. Asterisks denote significant differences between control and high CO2 conditions at the respective temperature. Letters show significant differences between each temperature step for a constant PwCO2 (Tukey’s HSD all-pairwise comparisons following a linear mixed model; p < 0.05).
Stroke volumes (SV) under both CO2 levels were in the range of 0.05–0.4 ml at 12°C (Figure 7B). SVs differed significantly between normo‐ and hypercapnia at 12 and 20°C: Contrasting the slightly lower HR under elevated CO2 at 20°C, maximum hypercapnic SVs at 20°C were 0.2 ml higher, compared to maximum normocapnic SVs at this temperature. Furthermore, at 20°C the position of the third quartile was 0.1 ml higher under hypercapnia and while the minimum normocapnic SV remained below 0.1 ml during temperature increases, the minimum hypercapnic SV was higher throughout, surpassing 0.1 ml at 18°C. An increase in contractility (magnitude of heart contraction) under hypercapnic exposure at 20°C was confirmed by CINE MRI (Figure 8). Here, the lateral diameter of the heart changed by 2.8 ± 0.6 mm (13% of end-diastolic diameter) during contraction under hypercapnia and by 2.04 ± 0.55 mm (10% of end-diastolic diameter) under control CO2 levels (Figure 8). Both absolute and relative increases in contractility between low and high PwCO2 were significant (t-test; p < 0.05), supporting the idea of an increased SV at hypercapnic 20°C.
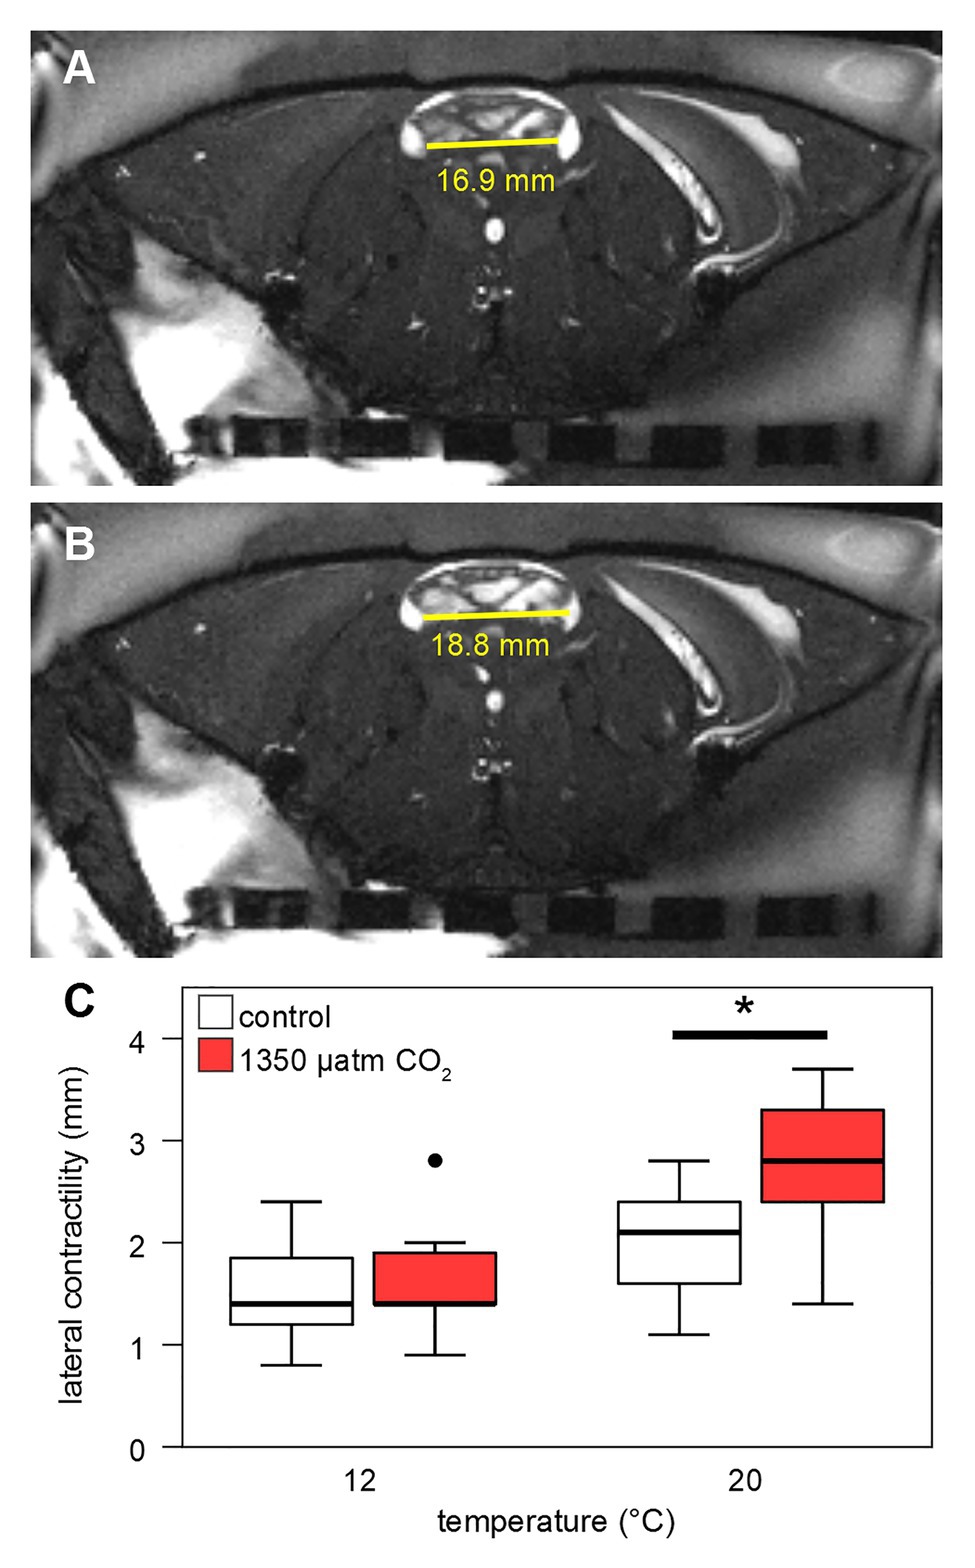
Figure 8. Contractility of the heart. Contractility was calculated from CINE MRI as difference between end-systolic (A) and end-diastolic (B) lateral diameter of the heart, in an axial slice including the two lateral ostia (endpoints of the horizontal yellow line). (C) Lateral contractility of the heart (in mm) is shown for 12 and 20°C control and high CO2-levels. Whisker = 1.5 × interquartile range (IQR), box = IQR, bold line = median, and circle = outlying data point. Hypercapnia caused a significant increase in contractility at 20°C (Student’s t-test, p < 0.05).
Maximum values for cardiac outputs (CO) increased continuously with rising temperatures for both normocapnic and hypercapnic conditions (Figure 7C). Again, a broad density distribution at low cardiac outputs between 12 and 16°C shifted to higher maximum and median values. Significant differences in CO under hypercapnia were found at 16 and 18°C. Following the trend in SV, hypercapnia delayed the temperature-dependent increase in CO, setting in only at 16°C and not already at 14°C (normocapnia). Still, the highest CO was recorded at hypercapnic 20°C, with values approaching 100 ml min−1, i.e., 25 ml min−1 higher than values at normocapnic 20°C.
Discussion
This study investigated how elevated CO2 affects the temperature response of key components of respiratory and cardiac systems and how these parameters are differently affected by high ambient CO2 levels. A comparative, non-invasive multi-parameter approach was designed to better understand the mechanisms behind the previously reported enhanced thermal sensitivity under hypercapnia (Metzger et al., 2007; Walther et al., 2009).
Maximum habitat temperatures at the North Sea seafloor rarely exceed 20°C, but this temperature has been recorded during recent summers. Daily temperature fluctuations of 2–4°C were common in recent summers at 10 m water depth (Supplementary Figure S4). Given that the North Sea is projected to warm faster than 90% of the other oceans (Hobday and Pecl, 2014), maximum temperatures exceeding 20°C are likely to occur in the foreseeable future. Even under the temperature regime applied here, C. pagurus displayed limited ventilation and an altered mode of cardiac work if warming was combined with exposure to elevated PwCO2. Daily and especially seasonal fluctuations of PwCO2 are reported for the North Sea (Atamanchuk et al., 2014; Melzner et al., 2020). The present results highlight how a large decapod crustacean may respond to acute warming under different CO2 levels in its habitat.
Methodology
The recorded values for PwCO2 and pHw reflected the normocapnic and hypercapnic treatments, with consequences for physiological patterns. While significant differences in [HCO3−]w were found in the IR-PPG experiments, they are an order of magnitude lower than what was reported to affect whole-animal activity (Maus et al., 2018). Overall, the variations in DIC and TA between treatments were similar to values reported in other studies (Lannig et al., 2010).
Due to the complexity of the measurements and limited animal availability at that time, the study is restricted to comparatively low animal numbers and an uneven inclusion of male and female crabs. The generality of the present results is thus limited, but a conclusive picture is still retrievable in the context of this work: animals showed similar behaviors during experiments in the MRI scanner and in the IR-PPG setup. Metabolic rates showed no differences at 12°C between repeated measurements on individuals or when comparing both setups. The continuous measurements revealed pausing behavior for about 80% of total experimental time across animals, indicating prevalent resting conditions in any setup. The results obtained by IR-PPG are supported well by separate MRI: CINE MRI determined a higher contractility under hypercapnic warming (corresponding to higher SV) and flow velocity measurements showed stable hemolymph flow patterns (corresponds to stable CO).
Simultaneous analyzes of multiple cardiovascular, ventilatory and metabolic parameters considerably limit the number of applicable non-invasive methods. For the present study, non-invasive measurements of restraint animals were selected because the confinement in a box with the limited ability to move its legs was considered as a minor disturbance for the animal compared to conventional invasive techniques. Effects of the fixation on the animals’ metabolic rate and cellular energy reserves have not been found in previous studies (Maus et al., 2018, 2019a,b); however, these studies did not investigate animals for more than 1–2 days. At 12°C, pausing behavior and unilateral ventilation persisted for 5 days (Supplementary Figure S5). While not obvious in these trials, prolonged starvation has been shown to lower metabolic rates (Ansell, 1973; Wallace, 1973). Considering the higher energy demand at higher temperatures and starvation theoretically decreasing the amplitude of cycles, the results at 20°C may be an underestimation depending on the degree of starvation. Separate experiments with long-term acclimated crabs at different temperatures and PwCO2 could help to identify the impact of starvation on the present data, also considering the negative impact of hypercapnia on feeding behavior and energy reserves of C. pagurus (Wang et al., 2018). Measurement times on acclimated crabs will also be shorter, reducing potential impacts of restraint on the cardiac responses (McGaw et al., 2018). Still, our results compare well to other reports on in situ HR (Ansell, 1973), including thermal responses of HR in large, unrestraint crustacea (Frederich and Pörtner, 2000).
Inconclusive results exist about the impact of sex on HR. While sex affected especially prolonged HR measurements, this impact was also shown to be minor compared to the effects of temperature, molting stage, and interindividual variability (Aagaard, 1996). This is in line with our results, where combined effects of temperature and CO2 have the largest impact on HR in our experiments (Supplementary Table S1). Follow-up experiments should nevertheless aim for a more balanced sex ratio.
To harmonize the variable routine activities of undisturbed crabs between setups and treatments, only phases of fluctuating activity were analyzed (pausing behavior; Ansell, 1973; McDonald et al., 1977,1980; Burnett and Bridges, 1981). The fluctuations in were comparable across individuals and setups under given conditions. Temporal changes in cardiovascular performance paralleled the patterns in and similar changes are also reported for hemolymph oxygen saturation (Burnett and Bridges, 1981; Frederich and Pörtner, 2000; Metzger et al., 2007). Three animals from the initial cohort showed non-fluctuating, stable performance levels, that were almost unaffected by temperature increases over an entire week of experiments. Such behavior was not related to feeding status, sex or size but displayed by animals with multiple missing appendages and regenerating limb buds. These animals were excluded from the present analysis, as regeneration of missing appendages affects metabolic rates (Skinner, 1962) and focusing on the pausing behavior was a key feature of this study.
Crabs modulate their ventilatory water current mainly through changes in scaphognathite stroke frequency, as the scaphognathite’s stroke volume is relatively constant for a given animal size (Cumberlidge and Uglow, 1977; Mercier and Wilkens, 1984). The detected changes in ventilatory water flow should, therefore, translate directly into changes in scaphognathite beat frequency and give an idea of oxygen supply capacities via ventilation (Batterton and Cameron, 1978; McDonald et al., 1980). Changes in the resistance of inhalant openings may also alter water flow through the gills, but should only shift the relationship between water flow and scaphognathite frequency and not its general interdependence.
The range of the cardiac stroke volume (SV) at 12°C control conditions was comparable to direct quantifications via MRI (Maus et al., 2019a), even after normalization to a mean SV of 0.2 ml. The maximum range of SV determined at 20°C was similar to values determined via the thermo-dilution technique and the Fick principle (Burnett et al., 1981; Bradford and Taylor, 1982). Values for weight-specific cardiac output (CO) lie in the range of those reported for Maja squinado and Metacarcinus magister, obtained with implanted Doppler flowmeters (De Wachter and McMahon, 1996; Frederich et al., 2000). The absolute accuracy of the CO depends on the accuracy of the stroke volume proxy (i.e., the plethysmograph signal), which in turn is affected by the position of the IR sensor on the carapace. Still, changes in SV and CO relative to a 12°C mean could be reliably derived for crabs exposed to either water CO2 level.
Metabolic Activity
Whole-animal metabolic rates serve as a general integrator of animal activity. Pauses in oxygen consumption actually represent minimum systemic activity and the periodic peaks in were no experimental artifact elicited by the outwash of deoxygenated branchial water upon resumption of ventilation. This was previously confirmed in C. pagurus through direct measurements of the difference between post-branchial and pre-branchial PeO2. During ventilatory and metabolic pauses, this difference became zero and there were also no changes in the PO2 of branchial waters and hemolymph PCO2. Furthermore, no anaerobic metabolism was detected either during a pause (Burnett and Bridges, 1981). Shorter pauses as found under normocapnic warming might be the simple thermal response of a higher energy (and thus oxygen) demand under warming. Continuously long pauses, as under hypercapnic warming, would then result in a reduced capacity for aerobic performance over time. Since the spike in after a pause is no longer under hypercapnia, more net time is spent in a hypometabolic state with low hemolymph oxygen levels. While hemolymph PO2 was not measured here, a limited capacity for aerobic performance may indicate some degree of oxygen limitation when C. pagurus experience sub-critical warming under elevated CO2 levels. This, and the hypoventilation found under hypercapnia at 18–20°C, corroborate the results by Metzger et al. (2007), where severe hypercapnia led to reduced hemolymph oxygen levels at lower temperatures. The potentially narcotic effect of CO2 on whole-animal activity (prolonged phases of low ) is in line with the reduced foraging behavior displayed by C. pagurus after prolonged exposure to high CO2 levels (Wang et al., 2018). Phases of spontaneously elevated were not covered here but should also be considered in the future, since their scope is affected by seawater carbonate chemistry in Carcinus maenas even after prolonged exposure (Maus et al., 2018).
A functional correlation of with cardiovascular activities was already proposed by Ansell (1973). Periodic fluctuations in respiratory and cardiac activity at rest were later attributed to central nervous pacemakers regulating animal activity (Taylor, 1982). Combined with the results on metabolic rates, the present findings on cardiovascular and ventilatory performance contribute to a causal explanation of reduced hemolymph PO2 under hypercapnic warming.
Ventilatory Performance and Cardiovascular Function
Exposure to elevated CO2 levels suppressed the warming-induced increase in ventilation, i.e., causing a relative hypoventilation compared to normocapnic warming at 18–20°C. In the branchial veins, which constitute the venous return in Decapoda, hemolymph flow velocities remained unaffected by hypercapnia and showed a thermal stimulation similar to normocapnia. A stable venous return is supported by a high cardiac output (CO). Impaired ventilation at stable cardiovascular performance (branchial perfusion and CO) was already reported for Maja squinado: There, it is indicative of normocapnic pejus temperatures, where temperature-dependent tissue oxygen demand cannot be met by the rate of ventilatory oxygen uptake (Frederich and Pörtner, 2000). A limited capacity for oxygen uptake due to a reduced ventilation/perfusion ratio may now explain the reduced PeO2 in the pericardial sinus of C. pagurus during rapid warming and severe hypercapnia (Metzger et al., 2007).
Since ventilation continued to increase with temperature under normocapnia, the normocapnic Tp (indicated by the onset of a temperature-insensitive ventilation), is most likely beyond the present-day maximum habitat temperatures of 20°C (Supplementary Figure S4) in the southern North Sea. A negative impact of hypercapnia on thermal tolerance is still implied here: while warming stimulated ventilation under normocapnia until 20°C, hypercapnia suppressed this stimulation, resulting in a significant hypoventilation at 20°C. Hypoventilation coincided with changes in cardiac work: slightly lower HRs under hypercapnia were offset by elevated SVs. Within the constraints placed by small numbers of experimental animals, C. pagurus appear to respond to hypercapnic warming with less-frequent but stronger heart beats, resulting in a net constant cardiac output. Based on relative hypoventilation, bradycardia, and the prolonged time spent in a low metabolic state (all compared to normocapnic values), we conclude that temperatures between 18 and 20°C may characterize the hypercapnic pejus temperatures for C. pagurus in the present experiments.
Pejus temperatures are the first indicators of thermal limitation and will be experienced by wild stocks more frequently than critical temperatures. Since limitations in aerobic performance beyond Tp translate into reduced growth and reduced scope for activity, sub-critical performance limitations may already prove detrimental for a population’s long-term abundance (Pörtner and Knust, 2007; Rutterford et al., 2015; Pörtner et al., 2017). Given that oceans take up excess CO2 from the atmosphere in an ongoing process called ocean acidification (Le Quéré et al., 2010), the present results underline the need for a more detailed understanding of the physiological implications of a high-CO2 world. This will be crucial for reasonable projections on ecosystem levels.
While the effect of CO2 on ventilation now contributes to explain reduced thermal tolerance under hypercapnia, the role of the cardiac muscle’s oxygen demand in shaping thermal sensitivity under hypercapnia (Walther et al., 2009) requires further investigation of the complex interplay of HR and SV in shaping CO (see section Introduction). Constant mean HR between 18 and 20°C under both hypercapnia or normocapnia could diminish the role for HR in defining CO between these temperatures. Compensating for (albeit slightly) reduced HR through elevated SV is a common response to hypoxia in Brachyura and the effect of hemolymph oxygen levels in setting cardiac work is well-described (Wilkens, 1993; Airriess and McMahon, 1994). While the cardiac responses to warming under hypercapnic conditions were not as severe as the responses to severe hypoxia, it appears that similar modifications in myocardial function are employed to maintain CO here. The limited oxygen uptake due to hypoventilation under hypercapnic warming causes hypoxemia, which in turn causes changes in cardiac work. Hypoxia-associated bradycardia is affected by reduced burst activity of the oxygen-sensitive cardiac ganglion (Wilkens, 1993). A concomitant increase in SV is less clearly explained but may be affected through combined neuronal and hormonal control (Wilkens and McMahon, 1992; McMahon, 2001). The effects may depend on the degree of hypoxemia, since the post-branchial PeO2 associated with bradycardia under severe hypoxia is reportedly lower than the PeO2 found at pejus temperatures in C. pagurus (Bradford and Taylor, 1982; Metzger et al., 2007). Even beyond direct effects of hypoxemia on the cardiac muscle, mitochondrial dysfunction can limit the capacity to increase HR in response to acute warming (Oellermann et al., 2020).
CO2 may yet have a superimposed effect on the heart of a decapod crustacean since hypercapnia caused tachycardia during acute warming (1°C h−1) in Hyas araneus (Walther et al., 2009). In any case, tachycardia or elevated SV should both maintain branchial perfusion as confirmed here, despite potential implications for the oxygen demand of the cardiac muscle. The different cardiac responses between 1°C h−1 warming in H. araneus (Walther et al., 2009) and 0.2°C h−1 warming in C. pagurus (present study) indicate complex relationships between CO2 exposure time, dose, and the rate of temperature change. Employing variable temperature and CO2 regimes is envisioned for future experiments to improve transferability to ecology and our general understanding of cardio-physiological plasticity in Decapoda.
Similar to the heart, the scaphognathites are sensitive to hemolymph oxygen levels but the critical PeO2 causing ventilation to fail is far below the PeO2 associated with Tp (Bradford and Taylor, 1982; Metzger et al., 2007). In the range of hypercapnic warming applied here, hypoxemia is an effect of low ventilation rather than its cause. It is worth noting that the post-branchial PeO2 associated with declining ventilation matches the PeO2 found at critical temperatures (Tc) at ~2 kPa. At this PeO2, hemocyanin is no longer saturated, coinciding with breakpoints in and cardiac output and the onset of anaerobiosis (Bradford and Taylor, 1982; Metzger et al., 2007). Systemic oxygen limitation sets in at the Tc of C. pagurus, preceded by an already low hemolymph oxygen content following hypoventilation at Tp.
Ventilation in water breathing crabs is mainly driven by the demand for oxygen. Metabolic CO2 is released to the water along with the diffusion gradient and due to its high solubility (Batterton and Cameron, 1978). High ventilation rates still improve CO2 diffusion to the water (Wheatly and Taylor, 1981), so hypoventilation in response to hypercapnia at elevated temperatures was an unexpected response. On the other hand, hypoventilation reduces the substantial costs for ventilation in a viscous medium (McDonald et al., 1980), allowing the animal to spend more time in a hypometabolic state (Figure 4C). Reducing aerobic costs for ventilation over time may be a transient response to relatively acute changes in water temperature and PCO2. The present results should be complemented by long-term studies to elucidate potential adaptation responses as the reduced oxygen uptake capacities may not be sustainable for extended periods of time.
It remains unclear if limited ventilation and the associated consequences of a reduced metabolic activity are a behavioral response to transient, unfavorable conditions, or a functional limitation under combined warming and hypercapnia. Functional limitations and shifts in ion exchange processes cause metabolic depression in invertebrates under adverse environmental conditions, including hypercapnia (Pörtner et al., 1998, 2000). Exposure to hypercapnic warming causes changes in extracellular ion concentration (Rastrick et al., 2014; Klymasz-Swartz et al., 2019). Considering the temperature-dependent permeability of ion channels (O’Leary and Marder, 2016), additional disruptions in ion and pH homeostasis following hypercapnic ion exchange potentially lead to a tipping point for neuronal function (Robertson and Money, 2012). Exposure to elevated CO2 levels and associated compensatory acid-base regulation may become intolerable at high temperatures. As a hypothesis, CO2-associated hypoventilation in the present study may be caused by neuronal malfunction due to shifting ion and pH gradients over neuron cell membranes. Osmoregulating crabs are able to withstand disturbances of ion and pH homeostasis during warming, so their systemic Tp is at higher temperatures compared to crabs with weak osmoregulation capacities, like C. pagurus (Jost et al., 2012). Further studies are required to characterize potential limitations of ion regulation mechanisms at Tp.
The involvement of acid-base balance in setting thermal tolerance is supported by the fact that active acid-base regulation fails and temperature-dependent changes in pHi and pHe diverge to more alkaline values above Tp (Wood and Cameron, 1985; van Dijk et al., 1997; Mark et al., 2002). The additional exposure to hypercapnia induces non-linear deviations from the normocapnic temperature-dependent changes in body fluid pH in vivo (Zittier et al., 2013; Rastrick et al., 2014; Klymasz-Swartz et al., 2019).
Impaired neuronal functions may affect the ventilatory control more strongly than cardiac control because of the comparatively more complex structure of the network controlling ventilation (Taylor, 1982; Robertson and Money, 2012). Furthermore, the scaphognathite motion requires coordinated levator and depressor action to drive a ventilatory water current through the gills and this coordination could – in theory – be disturbed by ionic imbalances over the membranes of associated neurons. It is currently not known if these variable responses in acid-base regulation to warming and hypercapnia are species-dependent and thus functional or if they are defined by the experimental conditions.
Conclusions and Perspectives
The present findings are the first to indicate a ventilatory response by an aquatic crustacean model to combined hypercapnia and warming. Due to its effect on oxygen uptake, limited ventilation may contribute to explain reduced thermal tolerance of a crustacean under the effects of CO2. Less frequent but stronger heart beats were confirmed by two non-invasive setups. They stabilize branchial perfusion but appear to be a response to reduced oxygen uptake that is initially caused by limited ventilation. To investigate the generality of the present results, a larger scale study is envisioned, where measurements also account for the animals’ characteristic pausing behavior. The observed responses to comparatively benign warming and hypercapnia are hidden within the changes of the animals’ routine activities. Fluctuating baseline activities with pronounced peaks and depressions cast doubt on the usefulness of mean values alone, as analyses of frequencies and patterns over time seem necessary. However, frequency changes are displayed to different degrees by different animals, complicating this approach. If hypoventilation in response to high-CO2 warming proves to be a general response among Brachyura, more detailed studies on the roles of ion and pH regulation in thermal tolerance are encouraged, too. The effects of CO2 on temperature-dependent acid-base regulation have thus far been tested only in a few studies and they may have an impact on neuronal functions setting systemic responses.
Data Availability Statement
The datasets generated for this study can be found in the public repository PANGAEA: doi.pangaea.de/10.1594/PANGAEA.924119.
Ethics Statement
Ethical review and approval was not required for the animal study because experiments were performed on crustaceans.
Author Contributions
BM, CB, and HOP conceived the study design and experimental setup. BM and SG performed the experiments and analyzed the data. All authors interpreted the data, wrote the manuscript, and approved of its final version.
Funding
The study is a contribution to the PACES II research program (WP 1.6) of the Alfred-Wegener-Institute and funded by the Helmholtz Association.
Conflict of Interest
The authors declare that the research was conducted in the absence of any commercial or financial relationships that could be construed as a potential conflict of interest.
Acknowledgments
We thank Fredy Veliz Moraleda for assistance in animal care and Rolf Wittig for assistance in the development of the experimental setup. A preliminary version of the manuscript is part of the doctoral thesis of Bastian Maus published at the University of Bremen and is in line with the author’s university policy (Maus, 2019).
Supplementary Material
The Supplementary Material for this article can be found online at: https://www.frontiersin.org/articles/10.3389/fphys.2020.596529/full#supplementary-material
Abbreviations
CINE, Cinematography; CO, Cardiac output; DIC, Dissolved inorganic carbon; FR, Flow rate; HR, Heart rate; IR-PPG, Infrared photoplethysmography; , Whole-animal metabolic rate; MRI, Magnetic resonance imaging; PeO2, Extracellular/hemolymph partial pressure of oxygen; PwCO2, Partial pressure of CO2 in water; SV, Stroke volume; SVP, Stroke volume proxy; TA, Total seawater alkalinity; Tc, Critical temperature; Tp, Pejus temperature; Tw, Water temperature; wf, Fresh weight.
References
Aagaard, A. (1996). In situ variation in heart rate of the shore crab Carcinus maenas in relation to environmental factors and physiological condition. Mar. Biol. 125, 765–772. doi: 10.1007/BF00349259
Airriess, C. N., and McMahon, B. R. (1994). Cardiovascular adaptations enhance tolerance of environmental hypoxia in the crab Cancer magister. J. Exp. Biol. 190, 23–41.
Ansell, A. D. (1973). Changes in oxygen consumption, heart rate and ventilation accompanying starvation in the decapod crustacean Cancer pagurus. Neth. J. Sea Res. 7, 455–475.
Artioli, Y., Blackford, J. C., Butenschön, M., Holt, J. T., Wakelin, S. L., Thomas, H., et al. (2012). The carbonate system in the North Sea: sensitivity and model validation. J. Mar. Syst. 102–104, 1–13. doi: 10.1016/j.jmarsys.2012.04.006
Atamanchuk, D., Tengberg, A., Aleynik, D., and Fietzek, P. (2014). Detection of CO2 leakage from a simulated sub-seabed storage site using three different types of pCO2 sensors. Int. J. Greenh. Gas Con. 38, 121–134. doi: 10.1016/j.ijggc.2014.10.021
Bates, D., Mächler, M., Bolker, B., and Walker, S. (2015). FItting linear mixed-effects models using lme4. J. Stat. Softw. 67, 1–48. doi: 10.18637/jss.v067.i01
Batterton, C. V., and Cameron, J. N. (1978). Characteristics of resting ventilation and response to hypoxia, hypercapnia, and emersion in the blue crab Callinectes sapidus (Rathbun). J. Exp. Zool. 203, 403–418. doi: 10.1002/jez.1402030308
Bock, C., Frederich, M., Wittig, R. -M., and Pörtner, H. -O. (2001). Simultaneous observations of haemolymph flow and ventilation in marine spider crabs at different temperatures: a flow weighted MRI study. Magn. Reson. Imaging 19, 1113–1124. doi: 10.1016/S0730-725X(01)00414-3
Boutilier, R. G., Heming, T. A., and Iwama, G. K. (1984). “Appendix: physicochemical parameters for use in fish respiratory physiology” in Fish physiology. eds. W. S. Hoar and D. J. Randall (Amsterdam: Elsevier), 403–430.
Bradford, S. M., and Taylor, A. C. (1982). The respiration of Cancer pagurus under normoxic and hypoxic conditions. J. Exp. Biol. 97, 273–288.
Burnett, L. E., and Bridges, C. R. (1981). The physiological properties and function of ventilatory pauses in the crab Cancer pagurus. J. Comp. Physiol. 145, 81–88.
Burnett, L. E., Defur, P. L., and Jorgensen, D. D. (1981). Application of the thermodilution technique for measuring cardiac output and assessing cardiac stroke volume in crabs. J. Exp. Zool. 218, 165–173.
Chandrapavan, A., Caputi, N., and Kangas, M. I. (2019). The decline and recovery of a crab population from an extreme marine heatwave and a changing climate. Front. Mar. Sci. 6:510. doi: 10.3389/fmars.2019.00510
Cumberlidge, N., and Uglow, R. F. (1977). Size, temperature, and scaphognathite frequency-dependent variations of ventilation volumes in Carcinus maenas (L.). J. Exp. Mar. Biol. Ecol. 30, 85–93. doi: 10.1016/0022-0981(77)90029-6
De Wachter, B., and McMahon, B. R. (1996). Haemolymph flow distribution, cardiac performance and ventilation during moderate walking activity in Cancer magister (Dana) (Decapoda, Crustacea). J. Exp. Biol. 199, 627–633.
Depledge, M. H. (1984). Photoplethysmography—a non-invasive technique for monitoring heart beat and ventilation rate in decapod crustaceans. Comp. Biochem. Physiol. A Physiol. 77, 369–371. doi: 10.1016/0300-9629(84)90075-6
Dickson, A. G. (1990). Standard potential of the reaction: AgCl(s) + 1/2H2(g) = Ag(s) + HCl(aq), and the standard acidity constant of the ion HSO4− in synthetic sea water from 273.15 to 318.15 K. J. Chem. Thermodyn. 22, 113–127. doi: 10.1016/0021-9614(90)90074-Z
Dickson, A. G. (2010). “The carbon dioxide system in seawater: equilibrium chemistry and measurements” in Guide to best practices in ocean acidification research and data reporting. eds. U. Riebesell, V. J. Fabry, L. Hansson, and J. -P. Gattuso (Brussels: European Comission, Directorate-General for Research), 17–40.
Field, L. H. (1977). A description and experimental analysis of a stereotyped Cheliped flexion behaviour in hermit crabs. Behaviour 61, 147–179. doi: 10.1163/156853977X00333
Frederich, M., DeWachter, B., Sartoris, F. -J., and Pörtner, H. -O. (2000). Cold tolerance and the regulation of cardiac performance and Hemolymph distribution in Maja squinado (Crustacea: Decapoda). Physiol. Biochem. Zool. 73, 406–415. doi: 10.1086/317735
Frederich, M., and Pörtner, H. -O. (2000). Oxygen limitation of thermal tolerance defined by cardiac and ventilatory performance in spider crab, Maja squinado. Am. J. Phys. Regul. Integr. Comp. Phys. 279, R1531–R1538. doi: 10.1152/ajpregu.2000.279.5.R1531
Giomi, F., and Pörtner, H. -O. (2013). A role for haemolymph oxygen capacity in heat tolerance of eurythermal crabs. Front. Physiol. 4:110. doi: 10.3389/fphys.2013.00110
Hlavac, M. (2018). stargazer: Well-Formated Regression and Summary Statistics Tables. Available at: https://cran.r-project.org/package=stargazer (Accessed December 17, 2020).
Hobday, A. J., and Pecl, G. T. (2014). Identification of global marine hotspots: sentinels for change and vanguards for adaptation action. Rev. Fish Biol. Fish. 24, 415–425. doi: 10.1007/s11160-013-9326-6
Jost, J. A., Podolski, S. M., and Frederich, M. (2012). Enhancing thermal tolerance by eliminating the pejus range: a comparative study with three decapod crustaceans. Mar. Ecol. Prog. Ser. 444, 263–274. doi: 10.3354/meps09379
Klymasz-Swartz, A. K., Allen, G. J. P., Treberg, J. R., Yoon, G. R., Tripp, A., Quijada-Rodriguez, A. R., et al. (2019). Impact of climate change on the American lobster (Homarus americanus): physiological responses to combined exposure of elevated temperature and pCO2. Comp. Biochem. Physiol. A Mol. Integr. Physiol. 235, 202–210. doi: 10.1016/j.cbpa.2019.06.005
Lannig, G., Eilers, S., Pörtner, H. -O., Sokolova, I. M., and Bock, C. (2010). Impact of ocean acidification on energy metabolism of oyster, Crassostrea gigas—changes in metabolic pathways and thermal response. Mar. Drugs 8, 2318–2339. doi: 10.3390/md8082318
Le Quéré, C., Takahashi, T., Buitenhuis, E. T., Rödenbeck, C., and Sutherland, S. C. (2010). Impact of climate change and variability on the global oceanic sink of CO2. Glob. Biogeochem. Cycles 24, 1–10. doi: 10.1029/2009GB003599
Lenth, R., Singmann, H., Love, J., Buerkner, P., and Herve, M. (2020). Emmeans: estimated marginal means, aka least-squares means. Available at: https://cran.r-project.org/package=emmeans (Accessed August 31, 2020).
Linneaus, C. (1758). Systema Naturae per regna tria naturae, secundum classes, ordines, genera, species, cum characteribus, differentiis, synonymis, locis. 10th Edn. Holmiae: Impensis Direct. Laurentii Salvii.
Mark, F. C., Bock, C., and Pörtner, H. -O. (2002). Oxygen-limited thermal tolerance in Antarctic fish investigated by MRI and (31)P-MRS. Am. J. Phys. Regul. Integr. Comp. Phys. 283, R1254–R1262. doi: 10.1152/ajpregu.00167.2002
Matuschek, H., Kliegl, R., Vasishth, S., Baayen, H., and Bates, D. (2017). Balancing type I error and power in linear mixed models. J. Mem. Lang. 94, 305–315. doi: 10.1016/j.jml.2017.01.001
Maus, B. (2019). Cardiovascular physiology of the edible crab Cancer pagurus under Ocean Warming and Acidification. Available at: http://nbn-resolving.de/urn:nbn:de:gbv:46-00108573-12 (Accessed December 17, 2020).
Maus, B., Bock, C., and Pörtner, H. -O. (2018). Water bicarbonate modulates the response of the shore crab Carcinus maenas to ocean acidification. J. Comp. Physiol. B Biochem. Syst. Environ. Physiol. 188, 749–764. doi: 10.1007/s00360-018-1162-5
Maus, B., Gutsfeld, S., Pörtner, H. -O., and Bock, C. (2019a). Non-invasive quantification of cardiac stroke volume in the edible crab Cancer pagurus. Front. Zool. 16:46. doi: 10.1186/s12983-019-0344-7
Maus, B., Pörtner, H. -O., and Bock, C. (2019b). Studying the cardiovascular system of a marine crustacean with magnetic resonance imaging at 9.4 T. MAGMA 32, 567–579. doi: 10.1007/s10334-019-00752-4
McDonald, D. G., McMahon, B. R., and Wood, C. M. (1977). Patterns of heart and scaphognathite activity in the crab Cancer magister. J. Exp. Zool. 202, 33–43. doi: 10.1002/jez.1402020105
McDonald, D. G., Wood, C. M., and McMahon, B. R. (1980). Ventilation and oxygen consumption in the Dungeness crab, Cancer magister. J. Exp. Zool. 213, 123–136.
McGaw, I. J., and McMahon, B. R. (1998). Endogenous rhythms of haemolymph flow and cardiac performance in the crab Cancer magister. J. Exp. Mar. Biol. Ecol. 224, 127–142. doi: 10.1016/S0022-0981(97)00191-3
McGaw, I. J., Steell, S. C., Van Leeuwen, T. E., Eliason, E. J., and Cooke, S. J. (2018). Application of miniature heart rate data loggers for use in large free-moving decapod crustaceans: method development and validation. Physiol. Biochem. Zool. 91, 731–739. doi: 10.1086/695839
McMahon, B. R. (2001). Respiratory and circulatory compensation to hypoxia in crustaceans. Respir. Physiol. 128, 349–364. doi: 10.1016/S0034-5687(01)00311-5
McMahon, B. R., and Burnett, L. E. (1990). The crustacean open circulatory system: a Reexamination. Physiol. Zool. 63, 35–71.
McMahon, B. R., and Wilkens, J. L. (1977). Periodic respiratory and circulatory performance in the red rock crab Cancer productus. J. Exp. Zool. 202, 363–374. doi: 10.1002/jez.1402020307
Melzner, F., Mark, F. C., Seibel, B. A., and Tomanek, L. (2020). Ocean acidification and coastal marine invertebrates: tracking CO2 effects from seawater to the cell. Annu. Rev. Mar. Sci. 12, 499–523. doi: 10.1146/annurev-marine-010419-010658
Mercier, A. J., and Wilkens, J. L. (1984). Analysis of the scaphognathite ventilatory pump in the shore crab Carcinus maenas. I. Work and power. J. Exp. Biol. 113, 55–68.
Metzger, R., Sartoris, F. -J., Langenbuch, M., and Pörtner, H. -O. (2007). Influence of elevated CO2 concentrations on thermal tolerance of the edible crab Cancer pagurus. J. Therm. Biol. 32, 144–151. doi: 10.1016/j.jtherbio.2007.01.010
Millero, F. J. (2010). Carbonate constants for estuarine waters. Mar. Freshw. Res. 61:139. doi: 10.1071/MF09254
O’Leary, T., and Marder, E. (2016). Temperature-robust neural function from activity-dependent Ion Channel regulation. Curr. Biol. 26, 2935–2941. doi: 10.1016/j.cub.2016.08.061
Oberfeld, D., and Franke, T. (2013). Evaluating the robustness of repeated measures analyses: the case of small sample sizes and nonnormal data. Behav. Res. Methods 45, 792–812. doi: 10.3758/s13428-012-0281-2
Oellermann, M., Hickey, A. J. R., Fitzgibbon, Q. P., and Smith, G. (2020). Thermal sensitivity links to cellular cardiac decline in three spiny lobsters. Sci. Rep. 10:202. doi: 10.1038/s41598-019-56794-0
Pierrot, D., Lewis, E., and Wallace, D. W. R. (2006). MS Excel Program Developed for CO2 System Calculations.
Pörtner, H. -O., Bock, C., and Mark, F. C. (2017). Oxygen‐ and capacity-limited thermal tolerance: bridging ecology and physiology. J. Exp. Biol. 220, 2685–2696. doi: 10.1242/jeb.134585
Pörtner, H. -O., Bock, C., and Reipschläger, A. (2000). Modulation of the cost of pHi regulation during metabolic depression: a 31P-NMR study in invertebrate (Sipunculus nudus) isolated muscle. J. Exp. Biol. 203, 2417–2428.
Pörtner, H. -O., and Knust, R. (2007). Climate change affects marine fishes through the oxygen limitation of thermal tolerance. Science 315, 95–97. doi: 10.1126/science.1135471
Pörtner, H. -O., Reipschläger, A., and Heisler, N. (1998). Acid-base regulation, metabolism and energetics in Sipunculus nudus as a function of ambient carbon dioxide level. J. Exp. Biol. 201, 43–55.
Rastrick, S. P. S., Calosi, P., Calder-Potts, R., Foggo, A., Nightingale, G., Widdicombe, S., et al. (2014). Living in warmer, more acidic oceans retards physiological recovery from tidal emersion in the velvet swimming crab, Necora puber. J. Exp. Biol. 217, 2499–2508. doi: 10.1242/jeb.089011
Robertson, R. M., and Money, T. G. A. (2012). Temperature and neuronal circuit function: compensation, tuning and tolerance. Curr. Opin. Neurobiol. 22, 724–734. doi: 10.1016/j.conb.2012.01.008
Rutterford, L. A., Simpson, S. D., Jennings, S., Johnson, M. P., Blanchard, J. L., Schön, P. J., et al. (2015). Future fish distributions constrained by depth in warming seas. Nat. Clim. Chang. 5, 569–573. doi: 10.1038/nclimate2607
Skinner, D. M. (1962). The structure and metabolism of a crustacean integumentary tissue during a Molt cycle. Biol. Bull. 123, 635–647. doi: 10.2307/1539584
Steffensen, J. F. (1989). Some errors in respirometry of aquatic breathers: how to avoid and correct for them. Fish Physiol. Biochem. 6, 49–59. doi: 10.1007/BF02995809
Taylor, E. W. (1982). Control and co-ordination of ventilation and circulation in crustaceans: responses to hypoxia and exercise. J. Exp. Biol. 100, 289–319.
Uppström, L. R. (1974). The boron/chlorinity ratio of deep-sea water from the Pacific Ocean. Deep-Sea Res. Oceanogr. Abstr. 21, 161–162. doi: 10.1016/0011-7471(74)90074-6
van Dijk, P. L. M., Hardewig, L., and Pörtner, H. -O. (1997). Temperature-dependent shift of pH(i) in fish white muscle: contributions of passive and active processes. Am. J. Phys. Regul. Integr. Comp. Phys. 272, R84–R89. doi: 10.1152/ajpregu.1997.272.1.r84
Wallace, J. C. (1973). Feeding, starvation and metabolic rate in the shore crab Carcinus maenas. Mar. Biol. 20, 277–281. doi: 10.1007/bf00354271
Walther, K., Sartoris, F. -J., Bock, C., and Pörtner, H. -O. (2009). Impact of anthropogenic ocean acidification on thermal tolerance of the spider crab Hyas araneus. Biogeosciences 6, 2207–2215. doi: 10.5194/bgd-6-2837-2009
Wang, Y., Hu, M., Wu, F., Storch, D., and Pörtner, H. -O. (2018). Elevated pCO2 affects feeding behavior and acute physiological response of the Brown crab Cancer pagurus. Front. Physiol. 9:1164. doi: 10.3389/fphys.2018.01164
Waters, J. F., and Millero, F. J. (2013). The free proton concentration scale for seawater pH. Mar. Chem. 149, 8–22. doi: 10.1016/j.marchem.2012.11.003
Wheatly, M. G., and Taylor, E. W. (1981). The effect of progressive hypoxia on heart rate, ventilation, respiratory gas exchange and acid-base status in the crayfish Austropotamobius pallipes. J. Exp. Biol. 92, 125–141.
Wilkens, J. L. (1993). Re-evaluation of the stretch sensitivity hypothesis of crustacean hearts: hypoxia, not lack of stretch, causes reduction in heart rate of isolated hearts. J. Exp. Biol. 176, 223–232.
Wilkens, J. L., and McMahon, B. R. (1992). Intrinsic properties and extrinsic neurohormonal control of crab cardiac hemodynamics. Experientia 48, 827–834. doi: 10.1007/BF02118415
Wood, C. M., and Cameron, J. N. (1985). Temperature and the physiology of intracellular and extracellular Acid-Base regulation in the blue crab Callinectes sapidus. J. Exp. Biol. 114, 151–179.
Zittier, Z. M. C., Bock, C., Lannig, G., and Pörtner, H. -O. (2015). Impact of ocean acidification on thermal tolerance and acid-base regulation of Mytilus edulis (L.) from the North Sea. J. Exp. Mar. Biol. Ecol. 473, 16–25. doi: 10.1016/j.jembe.2015.08.001
Keywords: respirometry, pausing behavior, hypercapnia, non-invasive, crustacea, cardiovascular system, magnetic resonance imaging
Citation: Maus B, Gutsfeld S, Bock C and Pörtner H-O (2021) Non-invasive MRI Studies of Ventilatory and Cardiovascular Performance in Edible Crabs Cancer pagurus During Warming Under Elevated CO2 Levels. Front. Physiol. 11:596529. doi: 10.3389/fphys.2020.596529
Edited by:
Youji Wang, Shanghai Ocean University, ChinaReviewed by:
Zhiguo Dong, Jiangsu Ocean University, ChinaMeng-LI Tsai, National Ilan University, Taiwan
Nia M. Whiteley, Bangor University, United Kingdom
Copyright © 2021 Maus, Gutsfeld, Bock and Pörtner. This is an open-access article distributed under the terms of the Creative Commons Attribution License (CC BY). The use, distribution or reproduction in other forums is permitted, provided the original author(s) and the copyright owner(s) are credited and that the original publication in this journal is cited, in accordance with accepted academic practice. No use, distribution or reproduction is permitted which does not comply with these terms.
*Correspondence: Christian Bock, Y2hyaXN0aWFuLmJvY2tAYXdpLmRl
†Present address: Bastian Maus Experimental NMR, Clinic for Radiology, University Hospital Münster, Münster, Germany
‡ORCID: Bastian Maus orcid.org/0000-0003-1872-9097
Sebastian Gutsfeld orcid.org/0000-0001-5250-3695
Hans-Otto Pörtner orcid.org/0000-0001-6535-6575
Christian Bock orcid.org/0000-0003-0052-3090