 Jan Burke
 Alexey Pak1,2†
- 1Fraunhofer Institute of Optronics, System Technologies and Image Exploitation (IOSB), Karlsruhe, Germany
- 2Fraunhofer Center for Machine Learning, Fraunhofer Institute of Optronics, System Technologies and Image Exploitation (IOSB), Karlsruhe, Germany
- 3Vision and Fusion Laboratory (IES), Department of Informatics, Institute of Technology (KIT), Karlsruhe, Germany
Deflectometry as a technique to assess reflective surfaces has now existed for some 40 years. Its different aspects and variations have been studied in multiple theses and research articles; reviews are available for certain subtopics. Still a field of active development with many unsolved problems, deflectometry now encompasses a large variety of application domains, hardware setup types, and processing workflows for different purposes, and spans a range from qualitative defect inspection of large vehicles to precision measurements of microscopic optics. Over these years, many exciting developments have accumulated in the underlying theory, in the systems design, and in the implementation specifics. This diversity of topics is difficult to grasp for experts and non-experts alike and may present an obstacle to a wider acceptance of deflectometry as a useful tool for research and industrial applications. This paper presents an attempt to summarize the status of deflectometry and to map relations between its notable branches. Its aim is to provide a communication basis for experienced practitioners and also to offer a convenient entry point for those interested in learning about the method. The list of references introduces some prominent trends and established research groups in order to facilitate further self-directed exploration.
1 Introduction
If a ray of light reflects from a smooth surface, the resulting angular distribution can in general be separated into two components. The diffuse reflection spans a relatively broad range of angles, and the specular component is to the first approximation perfectly collimated along the direction prescribed by the reflection law (Figure 1). The higher the surface quality (i.e., the smaller the scale of the residual roughness), the more prominent the specular component becomes. For mirrors, the predominantly specular reflection is the primary purpose of polishing; for other technical surfaces it may be a by-product of precision manufacturing. Measuring high-quality polished surfaces with low uncertainty in slopes or shape is an important problem in metrology.
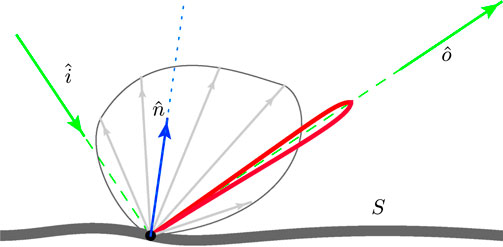
FIGURE 1. Diffuse and specular reflection from a surface. A ray of light is incident along a direction
Polished surfaces typically require delicate handling. When measuring them, it is therefore natural to give preference to non-contact optical techniques. Of the latter, methods relying on diffuse reflection (e.g., fringe projection, laser triangulation) are usually inapplicable and one should either use interferometry (accurate but expensive for large areas or complex surface shapes) or embrace specular reflection and wield the power of deflectometry.
Humans seem to intuitively know how to exploit specularities when inspecting mirrors. Given a glossy surface such as in Figure 2A, we adjust the viewing angle in order to observe virtual (reflected) images of contrast-rich objects in the environment. Any imperfection in the surface shape leads to a visible distortion in this virtual scene. In order to enhance the signal, we may slightly move our head or the studied object and observe how the reflection changes. The largest variations then would typically correspond to regions with higher curvature on the reflecting surface—i.e., defects or non-uniformities. This simple recipe allows even untrained observers to detect slope variations at the level of mrad (Section 2.1). Automated industrial deflectometry relies on similar principles to measure objects such as in Figure 2B, where target slope uncertainties may reach a few μrad.
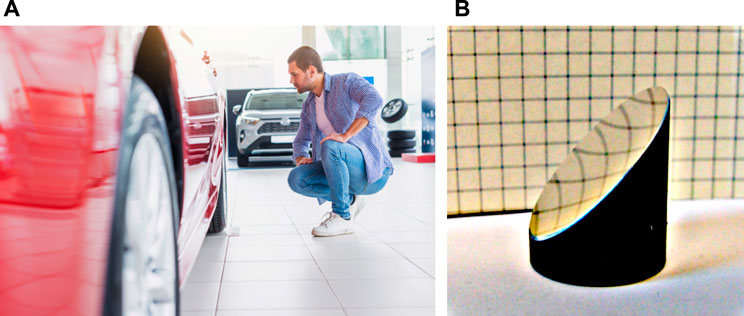
FIGURE 2. Examples of surfaces amenable to deflectometric inspection, (A) manual: car inspection during purchase (image by Freepik), and (B) automated: a high-quality off-axis parabolic mirror (photo by Marc Sandner).
Historically, deflectometry has been studied in at least two different research communities with rather different objectives. In computer vision the problem of reconstructing mirror shapes from images is known as “shape from specular reflection” or “shape from specularities,” whereas in optical metrology the terms “reflection grating method” and “deflectometry” are more common. Some sources also mention “reflectometry”; we would like to discourage the use of this term as it encompasses much more than deflectometry and lacks a precise definition. In what follows, “deflectometry” (DM) will refer to any method that relies on specular reflection and treats diffusely reflected light as noise. This abbreviation stands for “deformable mirror” in other contexts, but we will re-define it for the scope of this paper, bearing in mind that mirror forms and deformations are still partially our subject here.
For the purposes of the following discussion let us introduce three specific implementations of DM (Figure 3). In the “direct” scheme, a collimated (e.g., laser) beam reflects from the surface and arrives as a (possibly blurred) dot on, e.g., a CMOS matrix; in order to assess an extended object, one has to scan it mechanically while tracking the position of the reflected beam. The “inverse” approach employs inexpensive flat screens and digital cameras and may inspect relatively large object patches without movement. If we assume that the position of the emitting pixel and the direction of the respective camera’s “view ray” are known, then the symmetry of the reflection law guarantees the optical equivalence to the “direct” scheme. In reality, this technology becomes viable only when coupled with coded pattern sequences. Without them, pixels on the screen must be turned on and off one by one in order to scan the screen surface so that only a single point emits light as the camera makes a shot. This procedure would lead to extremely lengthy measurements. Instead, a handful of special patterns can be displayed on the screen such that the position of each screen pixel is unambiguously encoded in the sequence of gray-scale values and can later be identified based on the recorded camera frames (Section 4). Since it is the most popular scheme in applications, we will also refer to the setup in Figure 3B as to “basic.” Finally, one may extend the “basic” scheme as shown in Figure 3C: a curved screen covers a larger solid angle and thus accelerates the inspection of small convex objects. However, a practical implementation of this idea may be relatively complex and involve, e.g., a projector that illuminates a pre-designed surface.
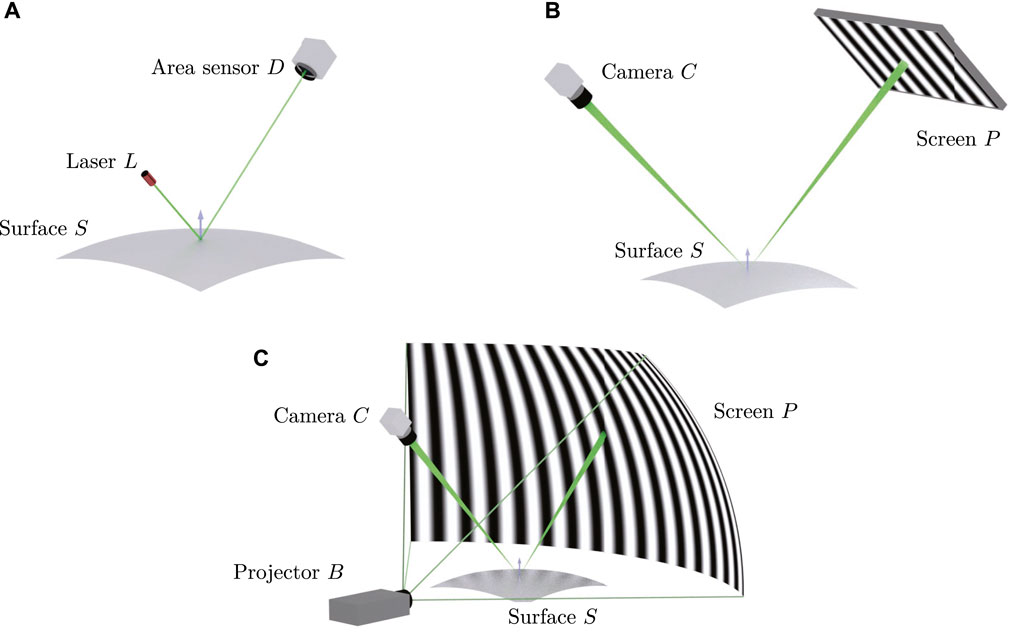
FIGURE 3. Three main deflectometric schemes: (A) “direct”: a collimated light source L illuminates the surface S, the reflected ray is detected by the area sensor D. (B) “inverse” or “basic” setup: a pixel on a flat screen P emits un-directed light, a camera C registers its reflection in the surface. (C) “inverse” scheme with a curved screen: a projector B illuminates a screen that provides the reference pattern and allows coverage of a larger solid angle around the object S. Note that in (B, C) the camera is focused on the object; this gives the best lateral resolution of the surface but sacrifices some angular resolution (cf. Section 3.1.1).
We know from our everyday experience that specularities are very sensitive to changes of the surface slope. In terms of the “basic” scheme of Figures 3B if the normal vector direction changes by a small angle, the direction of the reflected “view ray” changes by twice as much as shown in Figure 4B. Moreover, the sensitivity in the measured reflection angle increases as the distance between the surface S and the screen P or the area sensor D grows. Of course, it is not possible to reduce errors arbitrarily by placing P infinitely far away from the object. At some point wave optics and sensor properties will dominate: one cannot expect nrad-level results without extra effort. A more detailed analysis (Faber, 2012) places limits on the achievable angular resolution for surface slopes that appear to be on par with those typical to interferometry. For a method using non-coherent light and no precision reference objects, this is a tall order! By contrast, no such scaling law exists for triangulation by fringe projection (Gayton et al., 2021).
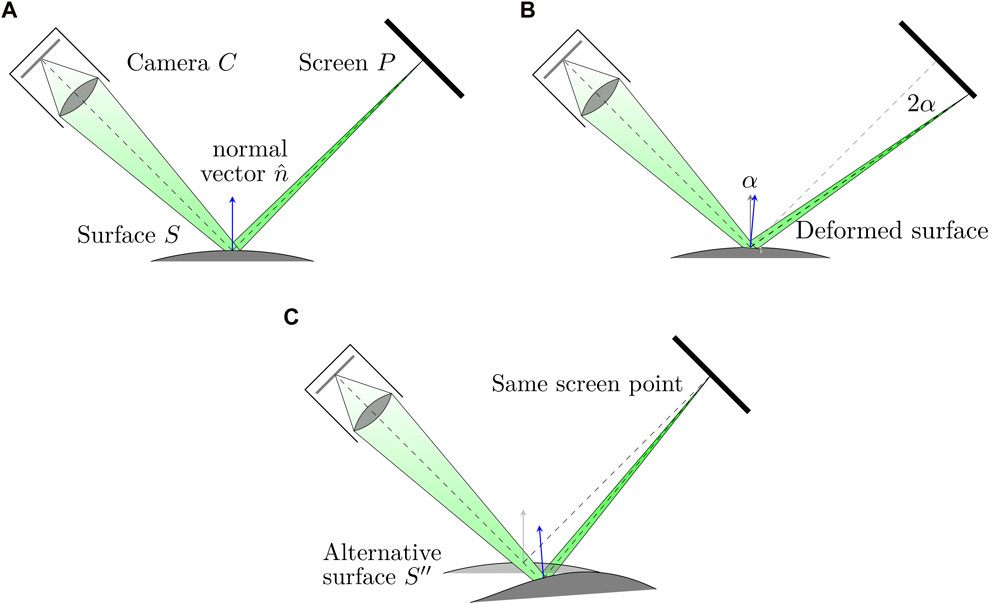
FIGURE 4. (A) Schematic ray paths in the “basic” DM setup, notations as in Figure 3B. The lens is focused on the screen. (B) If the surface tilts by an angle α in the incidence plane, the direction of the reflected ray changes by θ =2α. The detected displacement on the screen grows linearly with the distance between the surface S and the screen P, while the measurement uncertainty of the surface inclination angle decreases. (C) Point-wise deflectometric observations are inherently ambiguous: for any detection there exists a continuum of possible surface positions and shapes that are consistent with the recorded reflections. Here the camera is focused on the screen, which gives the best angular resolution—but at the cost of the object surface being less finely resolved and its curvatures modifying the observation geometry (cf. Section 3.1.1).
The same reflection law determines also the main disadvantage of DM—its poor sensitivity to the absolute surface position. Given a fixed “view ray” of the camera and the respective decoded origin point on the screen, one can find infinitely many surface positions and inclinations consistent with a given observation as schematically shown in Figure 4C. The surface shape reconstruction in DM therefore typically requires some “regularization” (Werling, 2011) (Section 2.5.2) in order to constrain the absolute surface position.
Today, different versions of DM are employed in a wide range of applications such as industrial quality control for household items, mobile phones, automotive parts (Lippincott and Stark, 1982; Höfling et al., 2000; Skydan et al., 2007; Armesto et al., 2011; Arnal et al., 2017; Molina et al., 2017; Zhou et al., 2019), reflective sheet, rod, or tape materials (Hung and Shang, 2003; Caulier et al., 2008; Sárosi et al., 2010), Fresnel lenses (Kiefel et al., 2016; Kiefel and Nitz, 2016), solar concentrator mirrors (Arqueros et al., 2003; Fontani et al., 2005; Heimsath et al., 2008; Scott and Burgess, 2010; Wang et al., 2010; Ulmer et al., 2011; Campos-García et al., 2015a; El Ydrissi et al., 2019), and even astronomical and synchrotron mirrors of various sizes (Parks et al., 2011; Schulz et al., 2011; Su et al., 2012a; Su et al., 2012b; Su P. et al., 2013; Hofbauer et al., 2013; Burge et al., 2014; Olesch et al., 2014; Oh et al., 2016; Davies et al., 2017; Wu et al., 2022). We have last summarized the state of the art over a decade ago (Werling et al., 2009; Balzer and Werling, 2010); driven by applications, the discipline has seen many exciting advances since then. Although brief summaries have appeared on subtopics (Huang et al., 2018; Xu et al., 2020; Zhang Z. et al., 2021), we believe that a stock-take of a broader scope is due once again.
Our present tour begins with an exercise in classification and delineation of the field, followed by a brief outline of its history. Section 2 provides an overview of the theoretical concepts involved and challenges inherent to the interpretation of reflections. In Section 3 we discuss some prominent schemes and variations of practical DM systems. Robust and accurate detection of reflections is of crucial importance to all implementations of DM; Section 4 is therefore devoted to coding methods and signal processing. Finally, Section 5 concludes the paper.
1.1 What deflectometry is, and what it is not
In Figure 5 we offer a pictorial representation of where deflectometry sits in the larger taxonomy of optical metrology; but of the latter, we will show only a few adjacent disciplines relevant in this context. The tree or map of deflectometry cannot be shown in a uniquely ordered and perfectly branched way: there are many cross-links between different approaches, and in the interest of clarity, the diagram includes only the most important ones. Although DM does not necessarily result in 3-D coordinates, it is still always a geometrical measurement technique where at least 2-D coordinates must be found and mapped. The native measurand is the intensity in one or more images—this is also true in interferometry, but the intensity encodes a different quantity there. Although phase-measuring DM is still intensity-based, we delineate them from, e.g., line scanning, schlieren and other methods that rely on approaches other than phase shifting to extract geometrical information from the image(s) recorded.
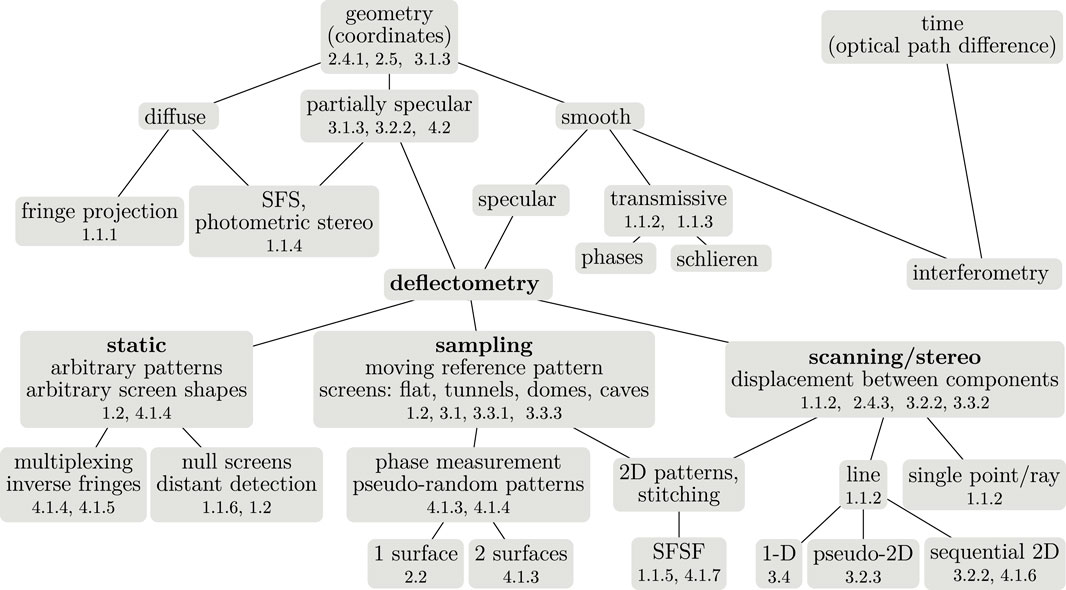
FIGURE 5. Mapping of the “optical metrology space” around deflectometry. Where entries are discussed in the text, the pertinent section numbers are given in the respective boxes. The top half of the diagram is a pruned part of a larger tree [see, e.g., (Beyerer et al., 2016), p. 357], including some closely related “not deflectometry” disciplines; the bottom half is the content of this overview.
1.1.1 Deflectometry vs. fringe projection
Novices to DM often assume that a pattern or a reference structure must be projected onto the surface as in the fringe projection (FP) method; this is not the case. Using Figures 3B, 6, the most obvious differences can be summarized as follows: FP applies to diffusely reflective, DM to specular surfaces; in FP, a projector creates a pattern on the surface as a bright (emissive) texture, in DM a bright texture is displayed on a flat screen and is not projected anywhere.
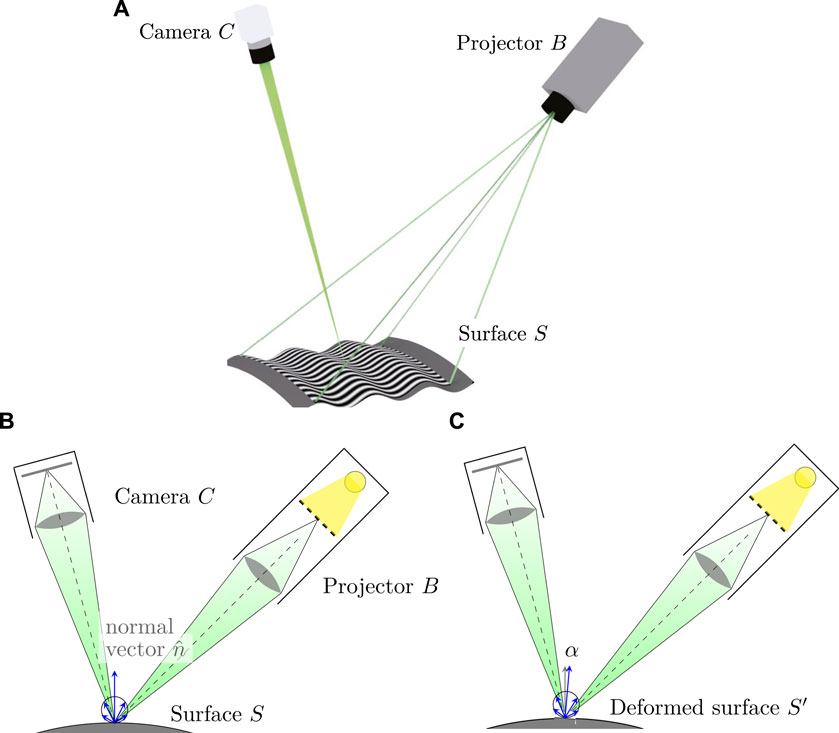
FIGURE 6. (A) A fringe projection setup: camera C observes a diffusely reflective surface S onto which projector B projects patterns. Object points act as un-directed light emitters; the directions of the incident light and the view rays do not need to satisfy the reflection law, and indeed, should not, so as to avoid specular reflections from B. (B) Optical scheme of FP. The registration is sensitive to point positions but not to local slopes, cf. Figure 4A. The circle and arrows indicate the scattering lobe for the incident illumination. (C) Tilting a surface element in the same way as in Figure 4B: besides a small change in scattered intensity (see Section 1.1.4), the signal on the camera sensor remains unchanged.
In practice, in any structured illumination setup such as FP one tries to avoid capturing the direct specular reflections of the projector beam—otherwise a bright mirror reflection of the exit lens will appear as a virtual image and overlap or even outshine the useful signal of the fringe patterns.
Also, the projection and the observation angles in FP are constrained mainly by the object geometry (e.g., shadowing must be avoided if possible), and to a lesser extent by the reflective properties of the surface. Multiple scattering here contributes to random noise or even systematic phase-measurement errors but is permissible.
In contrast to this, in DM the illumination and the observation directions must obey the reflection law. This places much tighter constraints on the setup geometry and introduces a stronger dependence on the object shape. For example, convex surfaces create very small virtual images even of large reference screens, so that only a small portion of the surface can be inspected at once. Multiple reflections from the same surface (sometimes referred to as “inter-reflections”) cannot be tolerated at all as they render the data undecodable; we are not aware of even partial solutions to this problem. On the other hand, there exist methods to separate mixed reflections from different surfaces of a transparent object (cf. Section 4.1.6).
In order to recover the surface shape in FP, one finds matches between the outgoing ray directions of the projector and the view rays of the camera and establishes the distance to each surface point by triangulation. The method is therefore sensitive to the absolute surface point positions in space (zeroth order derivatives of the surface shape). In theory, FP is uniformly sensitive to all spatial frequencies, i.e., the global object shape as well as small-scale surface variations should be recovered equally well. In practice, however, the sensitivity to small defects suffers disproportionately due to the decreasing MTF and the surface roughness.
As discussed above, DM measures slopes (first order derivatives of the shape). The sensitivity to higher spatial frequencies is therefore amplified, resulting in excellent (sometimes excessive) sensitivity for small-scale irregularities and at the same time poor sensitivity and stability for low-order surface features. Reconstruction of the surface is more challenging than in FP: one first extracts partial shape derivatives from observations and then integrates them under some boundary conditions (Section 2.5).
As an alternative use of DM data, one may differentiate them and recover surface curvatures (combinations of second order shape derivatives; typically one uses Gaussian or mean curvature). Unlike point positions and slopes, the latter are intrinsic local characteristics of the surface (Weingaertner et al., 2001; Pak, 2017) that are independent of its embedding in 3D space. As such, curvature maps are useful observables for various quality inspection tasks. Derivation of curvatures is less error-prone than shape integration and does not require accurate prior knowledge of the distance to the object. Differentiation amplifies noise (Komander, 2019; Komander et al., 2019) but—unlike integration—does not spread correlated errors over the surface.
In order to decide whether the sensitivity profile of DM suits a given application, in addition to the above considerations one has to analyze task-specific objectives of the inspection and the statistics of surface features for typical samples. Respective power spectra for certain types of technical surfaces can be found in the literature (Falconi, 1964; Wagner and Häusler, 2003; Su et al., 2015; Choi et al., 2021; Coniglio et al., 2021).
1.1.2 Scanning deflectometric techniques
In some applications, the basic setup of Figure 3B is impractical or even impossible to implement; the reasons can be quite diverse, as are workarounds developed to take advantage of the high sensitivity of DM anyway.
For surfaces too complex to measure with the “inverse” setup, e.g., the so-called “wild aspherics” or free-form shapes, one can use point-scanning techniques. This approach is also known as “experimental ray tracing” (Häusler and Schneider, 1988; Binkele et al., 2021): a single, narrow, well-collimated (typically laser) beam probes a reflective surface in a scanning pattern and produces a grid of deflection measurements using the “direct” scheme of Figure 3A. The process is slow but can achieve high performance in practice—uncertainties in the surface shape of tens to hundreds of nm have been reported (Ceyhan, 2013).
Low-uncertainty flatness tests are usually accomplished with interferometry. Remarkably, some varieties of DM are able to improve on its performance and reach down to sub-nm uncertainty levels (Illemann et al., 2002; Pedreira et al., 2019; Siewert et al., 2019; Ehret et al., 2021). Slope maps are recorded here with a scanning autocollimator, and the surface reconstruction is based on several 1D scans. The advantage over interferometers is that large objects (of sizes of order 1 m) can be measured without an extremely large and well-calibrated aperture and/or that the added complication of sub-aperture stitching can be avoided.
Yet another scanning technique enables the inspection of nearly-flat objects in a linear motion [e.g., on a conveyor belt (Wedowski et al., 2012a; Wedowski et al., 2012b; Hügel et al., 2016; Meguenani et al., 2019; Penk et al., 2020)]. A laser line illuminates the surface and reflects towards a flat diffusely reflective or transmissive projection screen while a camera observes it; or a line camera observes a reflection of a moving flat or a rotated cylinder (Gielinger et al., 2022). From the recorded images, one extracts the (distorted) curve shape. In case the deviations of the surface from a plane are small, this suffices to constrain one of the two slope components, which is often good enough for industrial use.
For wavelengths outside the visible range, rapidly switchable display screens are not easily available. Scanning techniques again may be the solution; however, here one typically keeps the object at rest and moves the reference structure. For example, in thermal-infrared deflectometry (Section 3.2.2) one can use specialized image-generating devices [see the references in (Höfer, 2017)]. More affordable solutions, however, rely on tension-loaded heated wires or other static emissive structures (Graves et al., 2019a) that have a high contrast in thermal IR and a simple geometry. In a typical implementation, such a structure makes two scanning passes in two orthogonal directions (Su et al., 2013b; Su, 2014; Höfer and Beyerer, 2016; Höfer et al., 2016), sweeping the surface of some “virtual screen,” as shown in Figure 7. Point positions on this “virtual screen” are found using pattern recognition, and the subsequent processing proceeds as in “standard” DM.
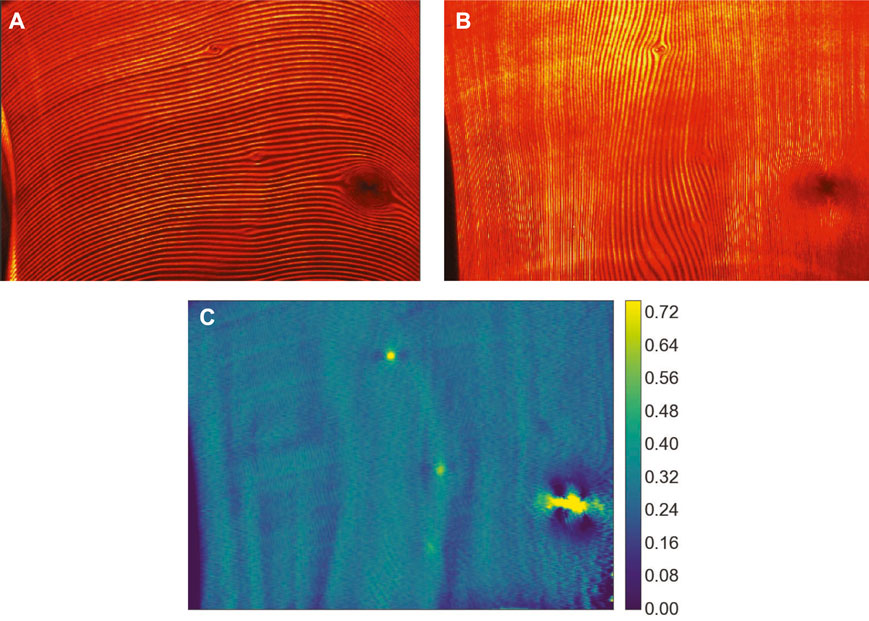
FIGURE 7. Sample data from 2D scanning IRDM inspection. (A, B): composite images from vertical and horizontal line scans, respectively. Brighter colors correspond to higher recorded temperatures (relative units). (C): magnitudes of combined slope gradients after decoding, in relative units. Images: S. Höfer.
A variation of this technique that uses only one scanning direction but records both spatial derivatives is also known for DM in the ultraviolet range, with the purpose of suppressing double reflections (Sprenger et al., 2010) (Section 3.2.3).
1.1.3 Deflectometry in transmission
With some minor modifications, DM can be applied to transparent objects as in Figure 8. The same pattern sequences and decoding algorithms as in the reflective case can be used to obtain the deflection maps. The latter, however, now characterize the refraction of light by the outer surfaces, and possibly additional internal deflections due to discontinuities and gradients of the refractive index inside the studied object. Depending on the setup, external and internal reflections may also contribute to the signal. Data processing in this case significantly differs from solely reflection-based shape reconstruction: instead of a single surface, one typically has to recover the entry and exit surface shapes and at the same time map the volumetric distributions of the refractive index. The theory and implementation of such schemes are non-trivial and deserve a separate review; therefore, we exclude them from the subsequent discussion and in the rest of this section only briefly mention some notable developments.
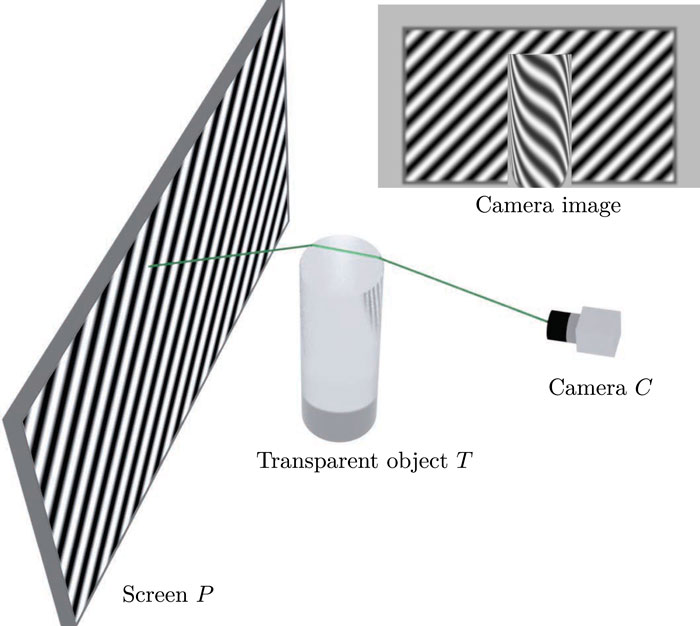
FIGURE 8. DM in transmission: a camera observes a pattern through a transparent studied object. View rays deflect due to reflection and refraction on the outer surfaces and on the inhomogeneities inside the object. Inset picture shows the view of the camera with the fringe distortions as measurand.
A number of schemes for DM in transmission have been proposed in the metrology (Kafri and Glatt, 1985; Massig, 1999; Canabal and Alonso, 2002; Vargas et al., 2010; Atcheson, 2012; Mériaudeau, 2012; Fischer, 2016; Li et al., 2018a; Wang et al., 2018; Binkele et al., 2019; Wang et al., 2020; Wang C. et al., 2021) as well as in the computer vision (Trifonov et al., 2006; Kutulakos and Steger, 2007; Yamazaki et al., 2007) communities, often under the title of “optical deflectometric tomography” (González et al., 2013; Sudhakar et al., 2015). Various proposed implementations use laser scanning, active and static patterns, distant detection (Fourier regime), etc. However, most schemes assume very small deflection angles (or, equivalently, small variations of the refractive index) and therefore apply only to simple object shapes and/or require that the studied object be immersed in an index-matching fluid. Alternative (large-deflection) approaches often simplify the problem and, e.g., assume that the refractive index inside the object is constant and only recover its shape (Petz et al., 2009) or focus on selected (application-specific) optical parameters of samples (such as “refractive power”) (Knauer et al., 2008; Vargas et al., 2010; Yu et al., 2022). The traditional schlieren technique, a form of deflectometry (Toepler, 1864; Greenberg et al., 1995), has also been studied in combination with moiré (L’Esperance and Buckner, 2017) and phase-shifting methods (Joannes et al., 2003; Beghuin et al., 2009; Antoine et al., 2019) in order to characterize optical components in direct transmission or tomographically (Foumouo et al., 2010; González et al., 2011).
1.1.4 Shape from shading
Let us assume that the studied surface reflects diffusely according to some simple (e.g., Lambertian) reflectance model (cf. Figure 1). Under illumination at some fixed angle, the intensity of the reflected light along a given observation direction is sensitive to the surface slope. This combination of diffuse reflective geometry measurement with radiometry is known as “shape from shading” (SFS) (Szeliski, 1991; Zheng and Chellappa, 1991; Balzer et al., 2006; Prados and Faugeras, 2006; Lellmann et al., 2008; Beyerer et al., 2016). Typically (but not necessarily) objects are illuminated at a shallow angle and observed from a nearly normal direction in order to increase sensitivity. With proper radiometric calibration, SFS can measure very small surface slopes and locate minor defects. SFS can be considered a subset of the “photometric stereo” methods (Woodham, 1980; Ikeuchi, 1981; Woodham, 1989; Stephan et al., 2016) that use active illumination and multiple exposures. Similarly to DM, it is best suited for the detection and estimation of local variations of slope. An example SFS measurement is shown in Figure 9.
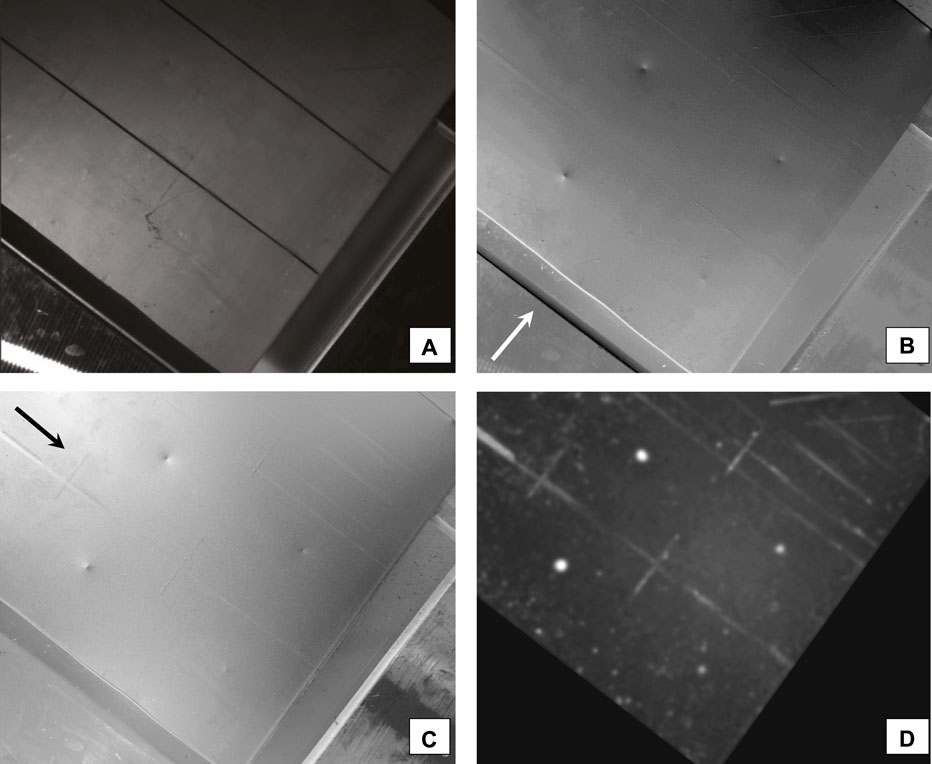
FIGURE 9. SFS measurement of a metal sheet with sample dents and bumps. (A) Appearance of the object in undirected illumination. (B, C): slope maps obtained under two different orthogonal directions of incident illumination, indicated by arrows. The “relief” impression is not coincidental but reveals the principle and gives an idea of the sensitivity. (D): magnitudes of the detected slope gradients. Images: S. Werling/M. Heizmann.
1.1.5 Shape from specular flow
Arguably the most “natural” kind of DM, the shape-from-specular flow (SFSF) approach in computer vision has been proposed by Roth and Black (2006) based on differential analysis by Blake and Bülthoff (1991). Unlike “canonical” DM, SFSF aims to recover shapes of mirrors in motion by observing the evolution of reflections without control over (or prior knowledge of) the reflected environment. We intuitively use SFSF when, e.g., we look at a shiny car on the street—slightly moving the head helps us notice surface defects even if we do not know the geometry of the surrounding buildings or trees. Similarly, in SFSF one slightly changes the setup geometry (e.g., adjusts the camera position or rotates the object) while letting the camera record successive frames. As in DM, the camera here observes a specular object that reflects some uncalibrated environment. From its raw frames, one then derives an optical flow (OF) field: a dense map of apparent 2D displacements of prominent image elements (edges, corners) or pixel values between the subsequent camera images. This field then serves as input for surface shape reconstruction (often under the assumption of an infinitely distant environment) or is used in qualitative analysis.
While virtually unknown in the metrology community, OF is the foundation of numerous applications in computer vision. Its estimation is an important research field and multiple algorithms are implemented in popular libraries (Bradski, 2000). If the OF corresponds to a moving reflection in a curved mirror, it is known as specular flow (SF). Conceptually, OF and SF are the same quantity; but the motion fields of specularities often feature large irregularities (distortions and discontinuities). This impacts various statistics and necessitates dedicated estimation algorithms (Canas et al., 2009a; Adato et al., 2010a; Adato et al., 2011). Despite its inherently heuristic nature, under certain conditions OF or SF can be estimated with sub-pixel uncertainty which potentially may enable novel metrological methods such as shown in (Zhang Y. et al., 2022).
In the original formulation SFSF was only used to estimate parameters of primitive shapes. Later, the problem was re-formulated in terms of global variational reconstruction (Solem et al., 2004; Lellmann et al., 2008). Adato and others (Adato et al., 2007; Canas et al., 2009a; Adato et al., 2010b; Vasilyev et al., 2011) suggested a general reconstruction method based on a system of linear partial differential equations. In their setup, a telecentric camera is fixed with respect to the object and the distant textured environment undergoes a global rigid rotation. Later, SFSF equations and reconstruction methods have been extended (Pak, 2016a; Pak, 2017) to a theoretically more demanding but also more realistic scenario where a perspective camera linearly moves with respect to a static object and a static environment. These developments appear promising; unfortunately, a solid experimental validation beyond a basic proof of principle is still missing.
One notable statement of (Pak, 2017) is that SF is fundamentally sensitive to the curvatures of the mirror surface (second order shape derivatives) and has thus even better sensitivity to high spatial frequencies than “canonical” DM. An interesting direction of future research could be a combination of DM and SFSF in a single inspection setup in order to mimic the human assessment as in Figure 2A.
1.1.6 Fourier and telecentric techniques
Consider a special version of the setup in Figure 3A where the object is small compared to the distance d between object and detector, and is fully illuminated by a collimated light source. In this “Fourier regime”1 [also known as “direction-coded deflectometry” (Seßner and Häusler, 2004; Seßner, 2009)] the geometrical equations simplify (d drops out) and the detected signal can be directly converted to deflection angles, from which one can easily recover the surface shape. This simplification happens at the cost of more expensive telecentric optics, whose quality (angular uncertainty, or “non-parallelism” of rays) then directly contributes to the residual measurement errors.
In a related technique, the intensity of a uniform parallel beam of light is re-distributed by small irregularities of the reflective surface, which causes a spatial modulation of irradiance incident on a distant radiometric sensor. This “Makyoh imaging” scheme owes its name to the ancient art of making “magic mirrors”: a master would emboss secret symbols on the back side of a polished metal mirror. Invisible in direct inspection, the symbols can be revealed by reflecting sunlight onto a distant wall.
The theory behind the method is well studied (Saines and Tomilin, 1999; Berry, 2005; Riesz, 2011); its sensitivity is sufficient to, e.g., inspect semiconductor wafers for irregularities (Kugimiya, 1988; Blaustein and Hahn, 1989; Hahn et al., 1990; Szabó et al., 1995; von Finck et al., 2009; Tobisch et al., 2012; Hologenix, 2020).
1.1.7 Qualitative and semi-qualitative methods
Typical uses of DM for qualitative surface inspection will be outlined in Section 4.3; here we mention some alternative ideas that have caught our attention. They mostly originate from the computer vision community and typically deal with incomplete data and/or uncalibrated configurations.
An interesting DM setup for industrial QA has been reported in (Tornero et al., 2012) where a camera that is fixed with respect to the object (a car body) moves along with it through a light tunnel. The captured frames are accumulated into a synthetic “integral image,” from which one can easily identify defects as local extrema of pixel values (too dark or too bright spots) according to a pre-defined mask.
Another work (Godard et al., 2015) reports the qualitative shape reconstruction of small reflective objects based on multi-stereo views and panoramic environment maps. Unlike the exact DM reconstruction, normal vectors here are matched probabilistically based on local color distributions in the environment. Similarly, Jaquet et al. (2013) demonstrates the reconstruction of nearly-flat reflective surfaces under the assumption that the reflected scene contains only straight lines that appear upon reflection as curves in the camera images (a typical scenario is a shop window in a city that reflects the surrounding office buildings). Using even less prior information, local curvatures of a smooth mirror can be deduced from auto-correlation patterns in the images captured within a sufficiently richly-textured environment (Tappen, 2011). Finally, reflective shapes may be partially recovered based on certain invariants identified in the images captured in an unknown environment (Sankaranarayanan et al., 2010).
More recently, artificial neural networks (ANNs) have been employed in order to identify defects in DM data [see, e.g. (Maestro-Watson et al., 2018; Zhang et al., 2019; Zhou et al., 2020; Guan et al., 2022)], sometimes with pre-processing by classical image processing (Qi et al., 2020). As with many other applications of ANNs, it remains unclear to which extent the models trained in a given constellation with certain objects can be transferred to different problems. Presently we leave these methods out of the discussion until their “generalization power” (Zuo et al., 2022) is understood better.
1.2 Historical overview
The “magic mirrors” mentioned in Section 1.1.6 may well be the first documented utilization of the high sensitivity of specularities to slope variations of a mirror, discovered centuries or even millennia ago (Saines and Tomilin, 1999). The opposite case (manufacturing of mirrors that do not create patterns in the reflected wavefront) has been documented in the past two centuries as the wire test (Malacara-Hernández, 2006; Juárez-Reyes et al., 2018) and the Foucault test (Foucault, 1858). The goal of these methods was to provide sensitive visual cues for defects or aberrations in the context of manual fabrication of optics; and although the (quantitative) theory of reflection was well understood, it was mainly used to create qualitative indication tools.
In parallel, schlieren techniques (based chiefly on the redistribution of intensity) have been developed for the inspection of optics in transmission (Toepler, 1864; Kafri, 1980; Marguerre, 1985; Settles, 2001; Settles and Hargather, 2017).
Testing apertures evolved over time: from the initial pinholes, slits or wires, the principle was extended to one- and two-dimensional grids (Hartmann, 1907; Ronchi, 1927; Malacara-Hernández and Malacara-Doblado, 2015; Hernández-Delgado et al., 2022). Later, these works have paved the way for quantitative evaluations (Rayces, 1964; Salas-Peimbert et al., 2005). There exists considerable freedom to choose the shapes of static reference patterns, sometimes designed as “null screens” (Carmona-Paredes and Díaz-Uribe, 2007): in addition to generic planes (Díaz-Uribe, 2000), also cylinders (Díaz-Uribe and Campos-García, 2000; Campos-García et al., 2004), cones (Campos-García et al., 2015b; Campos-García et al., 2022), boxes (Campos-García et al., 2011), rings (Quach et al., 2022a) and custom geometries (Pérard, 2001) have been used. One may assemble points or lines into 1D or 2D arrays; otherwise, one may use rectangular, Gaussian or sinusoidal intensity profiles. Patterns can be printed or displayed in Cartesian, polar or spiral arrangements [e.g., (Klass, 1980; Lippincott and Stark, 1982; Massig, 2001; Díaz-Uribe et al., 2009; Li L. et al., 2014; Kludt and Burke, 2018; Riesz, 2018; Carvalho et al., 2021; Fontani et al., 2022)] or in fact with any pre-distortion that is transformed into a regular pattern if the reflective surface complies with certain specifications (Pérard, 1995; Werling and Beyerer, 2007; Liang et al., 2016; Zhang et al., 2017) (see also Section 4.1.5).
The moiré approach already used in the Ronchi test has evolved into moiré deflectometry (Kafri, 1980; Kafri and Livnat, 1981; Karny and Kafri, 1982; Ritter, 1982; Kafri and Glatt, 1985; Servin et al., 1990); its extension to two dimensions is better known as raster reflection and has been used in tests for mechanical responses to loads (Ligtenberg, 1952; Rieder and Ritter, 1965; Ritter and Hahn, 1983; Ritter and Wilke, 1991; Massig, 2001), surface defects (Lippincott and Stark, 1982; Sanderson et al., 1988), glass windows (Skydan et al., 2007; Chambard and Chalvidan, 2009; Xu et al., 2010; Aprojanz, 2019), and phase objects (Massig, 1999; Beghuin et al., 2009).
The final stepstone for convenient low-uncertainty evaluation was the introduction of the phase-shifting technique, created for interferometry in the 1970s and immediately adopted for fringe projection after sufficient digital storage and processing means became available (Takeda et al., 1982; Halioua et al., 1983; Srinivasan et al., 1984). Surprisingly, phase shifting has spread to deflectometry only around the turn of the millennium (Pfeifer et al., 1995; Höfling et al., 2000; Horneber et al., 2001; Pérard, 2001; Petz and Ritter, 2001; Bothe et al., 2004; Knauer et al., 2004; Surrel, 2004; Moreno-Oliva et al., 2008)—one reason may be that convenient flat-screen monitors for displaying modulated patterns were starting to become available at that time. As a result, moiré techniques are now largely obsolete in DM, and can in hindsight be interpreted as a complicated way (but necessary at the time) to reduce uncertainties.
Some work has also been dedicated to microscopic applications of deflectometry (Krasinski et al., 1985; Bitte, 2002; Bothe et al., 2007; Häusler et al., 2008; Huang et al., 2013a; Lu and Hua, 2016; Gu et al., 2021; Gu et al., 2022), but it appears that these have not displaced the sensitive and semi-quantitative methods that have been previously in use.
In the past century, the majority of developments have been contributed by groups in Germany (e.g., those from Braunschweig, Bremen, Erlangen and Karlsruhe); some 20 years ago, several special-interest groups have appeared, e.g., in Beer-Sheva (IL) and Mexico City. In the past decade, the field has been taken up by groups and schools in, e.g., Nivelles (BE); Arrasate, Barcelona, and València (ES); Huddersfield (United Kingdom); Singapore; Chengdu, Shanghai, and Tianjin (CN); Charlotte and Tucson (United States) as well as numerous other schools and labs with maybe fewer researchers but no lesser results. The output of the community in a wider sense also includes an astounding number of stand-alone theses at all levels, which demonstrates how quickly useful data can be obtained from deflectometry.
2 Fundamentals
In this section we discuss the physical and mathematical foundations of DM as a metrological method for measuring the shapes of specular surfaces. Unless mentioned otherwise, the notation and conclusions refer to the basic setup in Figure 3B; however, they can be easily adapted for most alternative implementations and variations of DM.
2.1 Measurement goal specification
The most essential characteristic of a metrological method is the target uncertainty of measurements. For DM, one has to specify the required sensitivity to shape deviations and defects in terms of unambiguous objective metrics. For some technical surfaces, such information is readily available: for instance, the maximum allowed divergence of the reflected rays for a telescope mirror determines the scale of tolerable deviations from the design. One convenient formulation of tolerances for such precision optics (on-axis, with round or hexagonal aperture), for instance, is in terms of Zernike coefficients (Li W. et al., 2014). In certain cases such polynomial-based models may even offer the possibility to use DM measurands directly, avoiding the integration of the surface (Burge, 2010; Dominguez et al., 2012).
However, in a quite common case when DM is used to assess surfaces that have a purely aesthetic function (e.g., car bodies), target criteria are much harder to quantify. Of course, one can design a sensor that is more sensitive than any human, but this will only increase the rate of false positives in quality control while providing no apparent benefits (why measure a car to nanometers?). When performing manual inspection, one often has to decide if a surface is “smooth” or “free from defects”—but what does that mean? One possible approach is to (painstakingly) describe various defects: their nature, primary sizes, and tolerable “severities” for different classes of surfaces. However, this solution is not perfect: the perception of smoothness depends on the wavelength of light and the surface roughness, while the visibility of defects differs from person to person (Kessler and Traue, 1997) (and buyers will judge any perceptible defect as serious in order to lower the selling price). Guided by similar considerations, multiple attempts have been made, e.g., in the automotive field to relate the visibility of surface deformations as reported by customers to measurable parameters such as defect sizes or curvatures (Kessler and Traue, 1997; Hsakou, 2006; Andersson, 2009; Fernholz, 2013; Aprojanz, 2019). Such works, however, typically analyze a very limited number of cases and make little or no effort to provide a general theoretical justification.
A recent work (Ziebarth, 2019) has proposed universal theoretical constraints on the visibility of surface defects on specular surfaces. The approach uses only a few assumptions and utilizes the concept of specular flow (Section 1.1.5) and its relation to human perception (Blake and Bülthoff, 1990; Blake and Bülthoff, 1991; Waldon and Dyer, 1993; Roth and Black, 2006); in principle, it can be adapted to arbitrary DM measurement scenarios. As of writing, though, these results still need a better validation and an extension to important practical cases (such as partially specular surfaces). Some results of (Ziebarth, 2019) are shown in Figure 10; one can see that people indeed are quite sensitive to small deformations of mirrors and that laterally smaller defects are in general easier to detect.
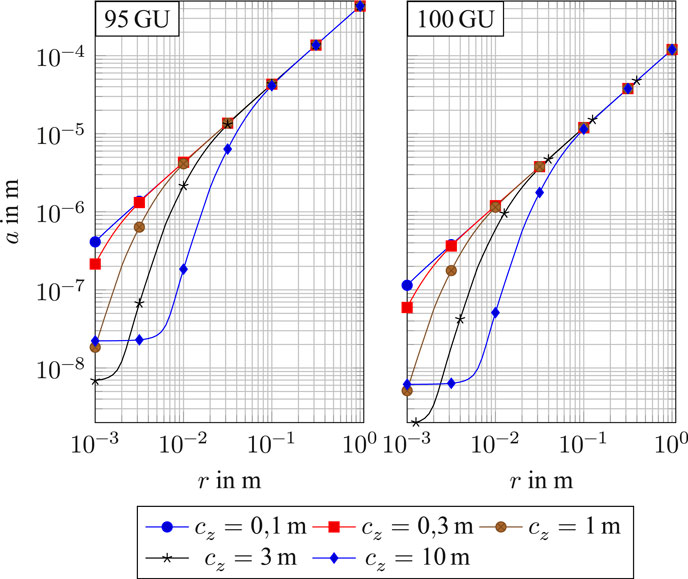
FIGURE 10. Theoretical lower bounds on the sizes of an isolated shape defect that is “barely visible” on top a planar specular surface. The plots correspond to the highest achievable acuity of human vision. The defect is modeled as a symmetric Gaussian shape with a characteristic radius r and height a; the observation point is displaced from the defect center by 1 m in the lateral and by cz in the normal direction with respect to the surface. The two panels correspond to reflectivities of 95 and 100 gloss units (GU). Using simple scaling rules, these curves may be adjusted for any alternative observation geometry. Image adopted from (Ziebarth, 2019).
2.2 Phase-shifted cosine patterns
Encoding of screen positions via pattern sequences is a vast topic; some methods relevant for DM are discussed in detail in Section 4.1. However, to facilitate the discussion in this section we very briefly introduce the most commonly used technique based on phase-shifted cosine patterns.
Consider a sequence of N grayscale patterns where the pixel value in the k-th pattern at some position (x, y) is
where A, B, and L define the mean brightness, modulation amplitude, and the period, or wavelength (inverse of spatial frequency) of the pattern, respectively. An example of such a sequence is shown in Figures 11A–D.
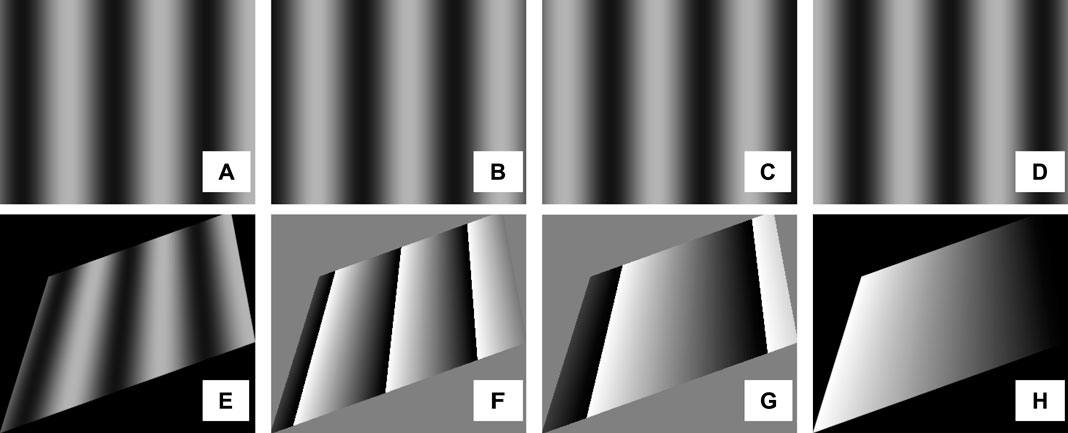
FIGURE 11. Encoding with phase-shifted cosine patterns. (A–D) patterns (Eq. 1) for N =4. (E) a sample (synthetic) camera image corresponding to a reflection of the pattern (A). (F) respective map of
The patterns are displayed on a flat screen and are eventually observed by a camera as, e.g., in the scheme of Figure 3B so that the screen pixel (x, y) maps to a camera pixel (u, v). In the simplest case, the recorded pixel value is
where C and D parameterize the transfer function. An example camera image is shown in Figure 11E. It is easy to show that x can be recovered from the sequence of N observations up to a multiple of L as follows:
It is also known that this “DFT” (discrete Fourier transform)-like formula (Surrel, 1996) is the optimal solution in the least-squares sense (Greivenkamp, 1984) when the random noise is independent of the fringe phase (Surrel, 1997a). If the period L is larger than the screen size, the decoding is unambiguous. In practice, though, large L leads to large decoding errors (the reasons are given in Section 4.1.4). Therefore, one usually uses several coding sequences with different periods L1, L2, … and then recovers the proper coordinates from the respective maps
In a similar fashion one may encode and decode the y-coordinates and thus uniquely recover the screen positions corresponding to the modulated camera pixels; in other words, each camera pixel “knows” the screen pixel that it is looking at (in DM, the respective optical path includes the reflection from the surface). As Figure 12 demonstrates, the associated deflections can be measured with an astounding SNR: with a set-up of less than 1 m3 in size and no special precautions during data acquisition, one can easily detect slopes of order 0.1 mrad and outperform human vision.
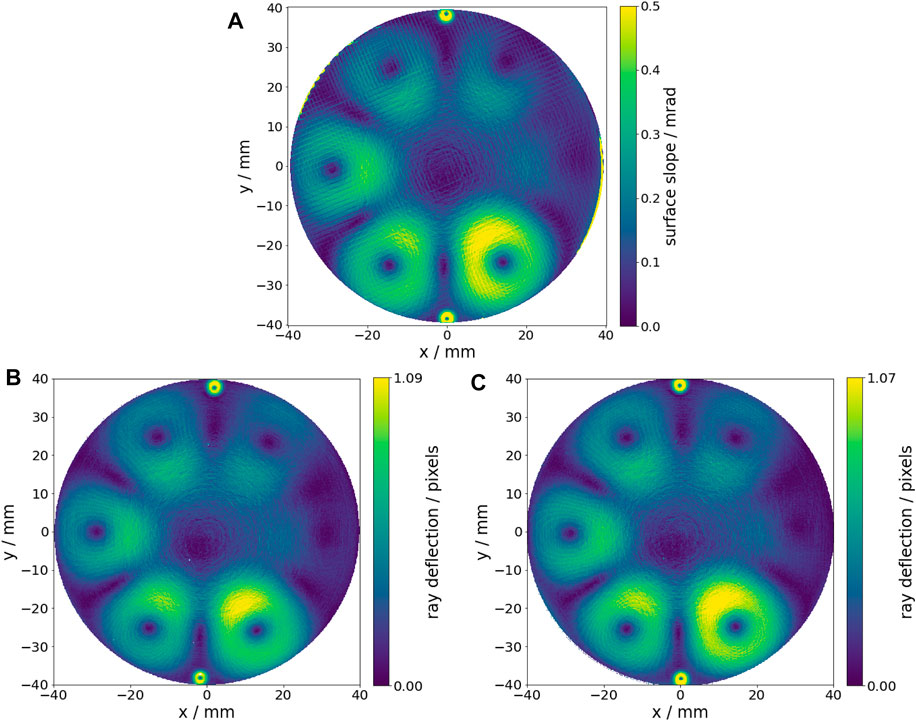
FIGURE 12. Sensitivity demonstration of phase-measuring DM with a precision-turned slope standard (≈100 GU), featuring six Gaussian peaks of different heights, designed to be at the limit of human detection capability at a distance of several meters and with suitable reflected patterns. The absolute scales are matched within about 2%. (A) Slopes inferred from a surface map, stitched together from several thousand measurements with a white-light interferometric microscope (Ziebarth, 2019): values under 0.1 mrad are detectable. (B) A DM measurement of the same object, the screen to object distance is ≈300 mm. (C) A DM measurement in a different instrument with a screen-to-object distance of ≈590 mm but larger screen pixels, leading to similar deflections in pixel units. (B, C) are uncalibrated, thus the unit is the measured ray deflection in pixels. The small features at the very top and bottom are alignment fiducials.
2.3 Basic deflectometric setup geometry
Consider a DM setup as schematically shown in Figure 13. A camera C observes a specular surface S, in which a flat screen P is reflected. We assume a pinhole camera with the projection center located at point
Equation 4 in fact defines a unit vector not only at
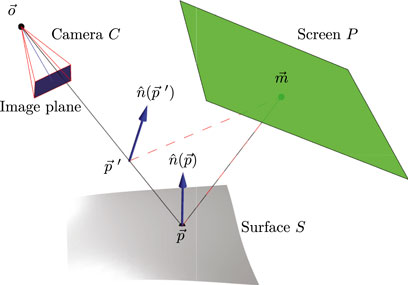
FIGURE 13. Geometry of a DM observation corresponding to the basic setup of Figure 3B; the description is in the text.
2.4 Component models and calibration
A measurement as in Figure 13 requires an accurate characterization of the camera and the screen; in addition, one needs to establish their relative positions and orientations in space. (In some cases, one also needs to know the location of the object.) The quality (uncertainty) of the respective models and parameters should be consistent throughout the setup and adequate to the requirements of the task at hand. In what follows we briefly mention several tools and techniques that have proven useful in DM applications.
2.4.1 Camera models
In terms of Figure 13, a camera model defines a mapping from image pixels to the view rays in the camera’s own reference frame. Once the respective (intrinsic) parameters are fixed, one only needs six extrinsic parameters (the 3D camera position and three Euler’s rotation angles) to completely determine all the view rays needed for the reconstruction. Camera calibration (estimation of intrinsic and extrinsic parameters) is a fundamental problem and we cannot possibly discuss it in depth here; some techniques often employed in the context of DM are as follows:
A central-projection camera with low-order polynomial distortions is the dominant model in computer vision [perhaps in part due to support by popular libraries (Bradski, 2000)]. Until about 2005, this model was frequently used in DM (Gruen and Huang, 2001; Salvi et al., 2002; Remondino and Fraser, 2006); the calibration relied on static checkerboard targets (Tsai, 1987; Zhang, 2000) that yielded a sparse array of detected points. In more demanding applications, it has now been replaced by generic camera calibration techniques.
An undistorted central projection model (with an actual pinhole aperture) is used in extremely demanding applications where it simplifies calculations and improves reconstruction results (Tang et al., 2009; Su et al., 2012b; Su et al., 2013c). However, the position of the pinhole with respect to the sensor must be controlled very carefully, and measurements can take many minutes due to the very small aperture. By contrast, the calibration is trivial and can be implemented in many ways (Huang, 2015).
Various generic camera models aim to accurately reproduce the imaging geometry of real optics; in particular, one can allow and account for non-central projection of complex multi-lens objectives and define slightly different origin points for each view ray. Another important use-case is non-standard optics (omnidirectional, telecentric, catadioptric, etc.). In precision DM, generic and model-free approaches have been shown to reduce measurement errors even for paraxial imaging, so the topic has attracted a lot of attention (Sturm and Ramalingam, 2004; Grossberg and Nayar, 2005; Wang et al., 2005; Kannala and Brandt, 2006; Barreto et al., 2008; Bothe et al., 2010; Luber, 2010; Ramalingam et al., 2010; Rosebrock and Wahl, 2012; Xiang et al., 2013; Pak, 2016b; Pak, 2016c; Prinzler et al., 2018; Schöps et al., 2020; Gauchan et al., 2021; Uhlig and Heizmann, 2021).
Any of these calibrations will benefit from better-quality input data, and printed checkerboards are not the best solution in existence (generic models, for instance, cannot rely on such sparse and noisy datasets). Ideally, calibration would require a dense collection of reference points (Sagawa et al., 2005; Forster et al., 2011; Huang et al., 2013b; Ma et al., 2014; Xu et al., 2017). Coded pattern sequences, and particularly the phase shifting technique (Section 4.1), nicely fit the bill here and are often used in practice.
2.4.2 Coding screen models
The reference screen (most often, a flat LC display) is typically modeled as a plane with pixels arranged as a rectangular grid. Scale calibration is possible even by a direct manual measurement of active area sizes—with more than 1,000 pixels in each screen direction, this yields μm uncertainty for the pixel sizes even in absence of appropriate manufacturer specifications. In more demanding cases, the details of a real LCD matrix have to be taken into account. In particular, the refraction in the cover glass may be modeled explicitly (Huang, 2015; Maestro-Watson et al., 2017; Li et al., 2018a; Bartsch et al., 2018; Petz et al., 2019; Petz et al., 2020a) or accounted for by some low-order deformation terms (Petz and Tutsch, 2004; Petz and Tutsch, 2005; Reh et al., 2014; Bartsch et al., 2019). The latter may also describe the deformation of large screens due to gravity. The estimation of respective parameters requires a dedicated measurement or may be implemented in parallel with the surface reconstruction as part of a global optimization. Curved monitor screens may be used (Liu et al., 2021), but at the price of tight geometry characterization requirements.
Other effects that may contribute to the decoding error include “jitter” in the detected pixel positions due to random scattering through the rough cover glass, and moiré-type interference between the pixel grids of the screen and the camera (both have a fill-factor below unity). We are not aware of any attempts to model and correct these effects; instead, one typically adjusts the setup in order to suppress them.
When a measurement task necessitates reference pattern sizes larger than the available LC displays, one possible solution is a projection screen illuminated by a digital projector, as shown in Figure 13C. Such systems may in many possible ways deviate from a flat or otherwise regular grid of pixels, and the complete setup geometry may be quite challenging to calibrate. The uncertainties of the projector and screen are typically much larger than those of an LC display, and the required efforts to characterize them strongly depend on the target uncertainty goals (Horbach and Dang, 2009; Hornung et al., 2014).
2.4.3 Relative component positions and orientations
When setting up a DM measurement, one points the camera at the object and then rotates and moves setup pieces until the camera can see the reflected screen. Optics may also need to be adjusted; for instance, a short-focus lens observes a larger surface patch from a shorter distance (i.e., the setup is compact). However, if the surface is convex, it magnifies the (already large) spread of reflected view rays, requiring the coding screen to cover an even larger solid angle around the object; in this situation, one may prefer a longer-focus lens placed farther from the object, as this narrows down the spread of rays again. Simple measurements can be aligned by hand; efficient multi-camera and/or multi-screen arrangements for complex surfaces need to be found via simulation-based optimization, which is a topic of active research (Section 3.5). This complexity is due to an (unknown) object being part of the optical scheme: unlike, e.g., a laser triangulation sensor, one cannot fine-tune a universal DM setup once and for all.
Once a viable configuration is fixed, it has to be characterized, which in the simplest case means finding the 3D camera position relative to the screen (six extrinsic parameters). Some DM applications tolerate a relatively low-quality setup calibration, which can be performed with the simplest means. This is often the case when measuring small differences with respect to a reference object [e.g., surface deformations (Li W. et al., 2014; Kim et al., 2021; Quach et al., 2022b; Esparza et al., 2022)], or even shearing measurements followed by a reconstruction of a quasi-flat surface (Kewei et al., 2016). However, in general the calibration uncertainty impacts the surface reconstruction quality in a non-trivial way.
Finding a camera position in space is again a well-known problem in computer vision. If the camera has a direct view of the screen, the task reduces to a straightforward bundle adjustment based on camera and screen parameters and a dataset collected with the same coding technique that is used in DM. Unfortunately, in most cases this option is excluded. Many proposed solutions to this problem therefore require an additional reflective object that optically couples the camera to the screen (Knauer et al., 2002; Bonfort et al., 2006; Höfer et al., 2010; Rodrigues et al., 2010; Werling, 2011).
This new object, in turn, introduces new uncertainties, and strategies to cope with them may be quite diverse. For instance, a calibration object may have an arbitrary geometry or be a precision mirror with a simple (flat or spherical) shape (Sigrist, 2015; Han et al., 2019; Niu et al., 2020), it may or may not carry visual markers (Knauer et al., 2004; Petz and Tutsch, 2005; Rose et al., 2009; Xiao et al., 2012), etc. Calibration procedures may involve accurately moving and tilting this object (Zhou et al., 2016), referencing the measurements against a precision mirror in nominally identical position (Kewei et al., 2017), recording the setup with multiple cameras in order to reduce ambiguity (Ren et al., 2015; Li et al., 2018b), or generating a synthetic reference pattern to guide the alignment (Kang et al., 2021).
An alternative approach that potentially may reduce the need for a precision calibration object (or eliminate it entirely) is to include these six parameters in the “global optimization loop” so that the object reconstruction and the setup calibration happen in parallel within some “holistic” or probabilistic framework. As the cost function to minimize, one often chooses ray re-projection errors or similar metrics (Olesch et al., 2010; Olesch et al., 2011; Faber, 2012; Rapp, 2012; Ren et al., 2015; Xu et al., 2018a; Allgeier et al., 2020). As a price, however, one may need to record several object poses per measurement.
In summary, the broad spectrum of ideas outlined above indicates that the questions related to achieving and maintaining a stable calibration in a deflectometric setup (as well as understanding the effects of calibration errors on the surface reconstruction outcomes) are far from settled and will keep the community occupied for years to come.
2.5 Surface reconstruction
The task of reconstructing a function from its gradients predates DM in its current form: the well-known Hartmann test is also a gradient technique whose most demanding application is adaptive optics for telescopes, and has recently also been utilized to monitor deformations while coating mirrors (Arnoult and Colin, 2021). Another major driver for wavefront reconstruction methods is shearing interferometry. As mentioned above, the integration aims to find a surface consistent at all points with the volumetric normal field
The slope reconstruction is based on the knowledge of spatial relationships between the reference structure, the tested object, and the camera. Most frequently (but not necessarily) the reference structure is a periodical pattern, and in order to find a unique mapping between the reference and the sensor coordinates one has to use a tandem of encoding and decoding (e.g., as in Section 2.2). There is no shortage of summaries on absolute position coding (Salvi et al., 2004; Höfer et al., 2013a; Falaggis and Porras-Aguilar, 2018; Gupta and Nakhate, 2018; Zhang, 2018); we mention some possible procedures in Section 4.1.
2.5.1 Integrability condition and direct reconstruction
If we parameterize the surface shape, e.g., as a function of camera pixel coordinates (u, v) and impose the consistency condition on its second derivatives, then the surface position ambiguity of Figure 4C disappears and one can explicitly find the surface point
Equivalently, the existence of a solution (a surface) at some point in space means that the longitudinal component of the normal field rotation
where we have suppressed the function arguments for clarity; Figures 14, 15 illustrate this result. (Note, however, that the rotation
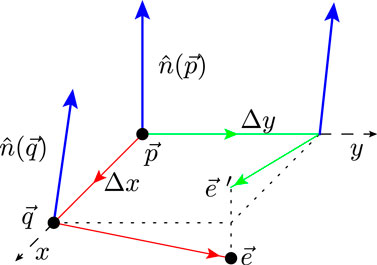
FIGURE 14. Local integrability of the normal field. Let us choose coordinates where the induced normal vector at point
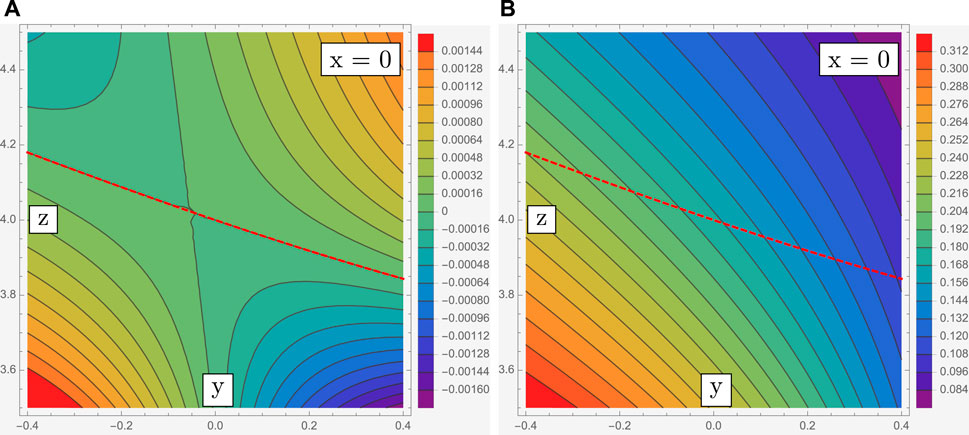
FIGURE 15. Longitudinal component
Thus, the aforementioned “depth ambiguity” in DM is in fact spurious, and no integration should be necessary to recover the surface. In practice, however, normal fields induced by smooth objects are such that their longitudinal rotation components are numerically small even far away from the true surface (cf. the scale in Figure 15A). The direct surface reconstruction then becomes very sensitive to noise, and the point-wise solutions unstable. As a remedy, one either needs to impose strong assumptions on the surface shape (Liang et al., 2019) and/or combine Eq. 5 with some global optimization scheme for robustness (Zhao et al., 2016; Graves et al., 2018). We believe that Eq. 5 should best be used as an explicit regularization for some integration technique; the potential of such schemes for high-precision measurements is yet to be explored.
2.5.2 PDE-based reconstruction and regularization
The surface reconstruction problem can in many ways be formulated as a system of partial differential equations (PDEs) (McGillem and Thurman, 1974; Freischlad, 1992; Klette and Schlüns, 1996; Elster and Weingärtner, 1999; Elster, 2000; Li et al., 2004a; Moreno et al., 2005; Velghe et al., 2005; Agrawal et al., 2006; Balzer, 2008; Moreno et al., 2013; Huang et al., 2015a; Quéau et al., 2017). One simple approach (Balzer, 2011; Werling, 2011), for instance, uses Helmholtz’s theorem to decompose a normal field as
(a Poisson’s equation), where the left-hand side is derived from the data, and the right-hand side linearly depends on a scalar function ϕ. After imposing some technical boundary conditions, we may solve Eq. 6 with e.g., finite element methods and find
Where does this ambiguity originate from? Inspecting Eq. 6, we notice that by construction it ignores the curl component in
Other (first-order) PDE formulations that directly fit surface gradients formally remain sensitive to the field rotation and should therefore converge to a unique result. However, the respective cost functions for displaced surfaces are proportional to the longitudinal rotation components of the normal field, which, as discussed above, are often very small. The optimization then in practice must be additionally constrained (regularized) based on available auxiliary measurements or prior knowledge about the studied shape.
If approximate geometry data are available, local reconstructions as in Figure 16 are reasonably fast and efficient; however, since relevant defects are almost always specified by their lateral sizes, and almost never by their height or depth, reconstructions for semi-qualitative purposes or mere visualization are quite rare in practice.
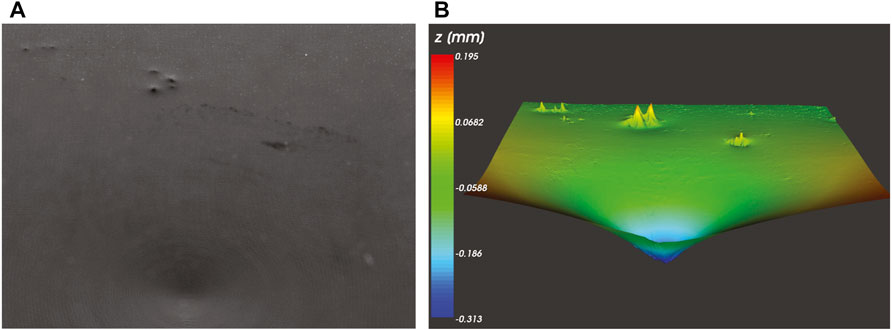
FIGURE 16. Local surface reconstruction. (A) Surface with defects; (B) local height map.
In what follows we briefly mention some other notable types of integration techniques used in practice. All of them to some extent share the general behavior discussed so far.
2.5.3 Transform-based reconstruction
Surfaces may be reconstructed in Fourier (Freischlad and Koliopoulos, 1986) or Hilbert space (Na et al., 2016), where it is also possible to formulate integrability requirements (Frankot and Chellappa, 1988) (in this case, for SFS data). The integration itself may be iterative (Huang et al., 2015b) or deterministic (Bon et al., 2012). It has been observed that the discrete cosine transform alleviates many issues related to boundaries and/or incomplete data that are an obstacle for the discrete Fourier transform (Talmi and Ribak, 2006).
2.5.4 Modal reconstruction
Constraining the surface to a combination of a few predefined shapes greatly accelerates computations. Depending on the ideal shape of the part, one typically uses Zernike, Chebyshev, or Forbes polynomials (Dai, 1996; Li and Burke, 2014; Mochi and Goldberg, 2015; Huang et al., 2016; Aftab et al., 2019; Ramirez-Andrade et al., 2020); in principle, any set of orthogonal functions can be used, which can be adapted to the aperture shape with suitable transformations (Ye et al., 2015).
2.5.5 Constrained zonal reconstruction
Tracking of small-scale features in the modal approach requires many coefficients, which may cause instabilities at the boundaries. A less rigid alternative is to use zonal techniques with adjustable stiffness/noise suppression, using, e.g., radial basis functions (Lowitzsch et al., 2005; Ettl et al., 2008; Huang and Asundi, 2013; Alinoori et al., 2016) or splines (Ettl et al., 2007; Olesch, 2007; Huang et al., 2017; Pant et al., 2018; Liu et al., 2022). An interesting new variety of this approach is emerging through the use of custom deep-learning network architectures utilizing information at multiple scales (Wu et al., 2021; Dou et al., 2022; Ma et al., 2022).
2.5.6 Zonal reconstruction
Zonal techniques aim to find the best match of the reconstructed surface to local gradient maps using least-squares methods (Fried, 1977; Southwell, 1980). As such, they suffer less from boundary artifacts, but are less resilient to noise, and are therefore often implemented as iterative schemes (Zou and Rolland, 2005; Huang et al., 2015b; Ren et al., 2016; Li et al., 2017); mixed approaches have also been demonstrated (Espinosa et al., 2010).
2.5.7 Reconstruction with additional data
Frequently, the parts to be inspected may have specular and diffuse surface properties, either as a mixture on the same surface, or on different portions of the object. This makes it possible to add a fringe-projection measurement and thus to obtain significant extra information about the shape and location of the tested object (Sandner, 2014; Sandner, 2015; Wang T. et al., 2021), although the calibration of such systems is fairly complex (Breitbarth et al., 2009; Liu et al., 2020).
2.5.8 Integration/interpolation biases
Any integration method effectively operates at the level of larger or smaller surface patches. Therefore, small errors in the DM or regularization data, sampling grid properties (Leung and Cai, 2020; Smith, 2021), or the influence of the tested surface itself (Zhang X. et al., 2021; Niu et al., 2021) may have a global effect on the reconstruction outcomes, and deviations from the true shape end up correlated at different scales (Pouya Fard and Davies, 2018). While we are not aware of a general method to predict integration uncertainties in DM, it is clear that simple quality metrics adopted, e.g., in fringe projection or laser triangulation such as “RMS height error” do not capture the statistics of errors inherent for DM. Figure 17 gives just one example: the possible effects of random noise on the reconstruction result.
FIGURE 17. Reconstruction errors (reconstructed surface profile minus ground truth and tilt artifacts) in a simulated setup (object diameter 1,420 mm, observation distance 4,000 mm, resolution 1,000 x 1,000 pixels) for four realizations of random Gaussian deflection noise of 0.025 screen pixels RMS in the underlying registration maps. The deviation color scale is from −50 nm (blue) to +50 nm (yellow) (Li and Burke, 2014).
3 System design
The apparent simplicity of DM systems and techniques (one just needs a light source, a reflecting object, and an imaging sensor) is deceptive. From the experience in our research projects, setting up a good deflectometry system and obtaining high-quality data takes weeks of training and months if not years of experience. Therefore, this section provides practical considerations for designing and using DM sensors and a closer look at how their components can be implemented.
3.1 Practical considerations and constraints
Most deflectometric systems are custom-designed for specific applications: owing to geometric constraints associated with different specimen shapes, only nearly-flat objects can be assessed in a generic manner. Even with cylindrical (light tunnel) or hemispherical (light dome) illumination geometries that accommodate a wide variety of geometries, different objects typically need different measurement constellations and/or a customized sequence of object poses.
3.1.1 Lateral vs. angular uncertainty trade-off
Very generally, the product of lateral and angular uncertainties in a DM measurement is bounded from below (Häusler et al., 2001; Ziebarth et al., 2018): in a high-precision measurement, decreasing one necessarily increases the other [although it is possible to image both the screen and the object sharply in certain cases (Li et al., 2021)]. In order to make a choice, one can adjust the camera focus to lie between the object surface and the light source. In cases when high lateral resolution on the surface is not required, optics should be focused somewhere in the vicinity of the reference screen (not directly on it, as detrimental moiré artifacts will then appear). This reduces the resulting angular uncertainty of normal directions for two reasons: i) the fringes on the reference screen appear sharper and can be made narrower, which reduces angle decoding uncertainties; ii) a larger sampled area on the surface (circle of confusion on the object) sharpens the statistical distribution of the deflected rays.
At the same time, once the focus moves away from the surface, the system is no longer in the “cat’s eye” mode—surface curvatures within the circle of confusion start acting as optical elements and may slightly bias the decoding results. In fact, similar considerations apply to the entire mirror image under any focus setting; in order to reduce these effects, one should place the camera far away from the foci or other caustics of the surface.
Finally, note that the camera can never be focused on the entire surface, since the viewing will necessarily be oblique to some extent (unless beam splitters are used) and the depth of focus plays a significant role in the measurement; this issue has been investigated in detail in (Kammel, 2004). Quite recently, this problem has been addressed by the suggestion of wavefront coding (Niu et al., 2022).
3.1.2 Surface roughness and partial specularity
The presence of roughness increases the diffuse and decreases the specular reflection of a surface; the diffuse background limits the achievable fringe contrast and hence the dynamic range of the measurement. (Painted surfaces are a common example: they are often glossy and scattering.)
It is still possible to obtain valid deflectometric data with a rough surface as long as the reference structures/fringes are wider than the main scattering lobe from the surface and a usable contrast of the reflection can be obtained, but of course finer slope details will be lost in noise. (Note also that a sensitivity at the scale of nm would be meaningless on a surface whose roughness is in the μm range.) The practical limit is reached at an Rq of ∼100–200 nm (see also Figure 19); Figure 18 gives an overview of this effect. Still, surprising detail can be reconstructed even from weakly specular surfaces, as Figure 18D shows.
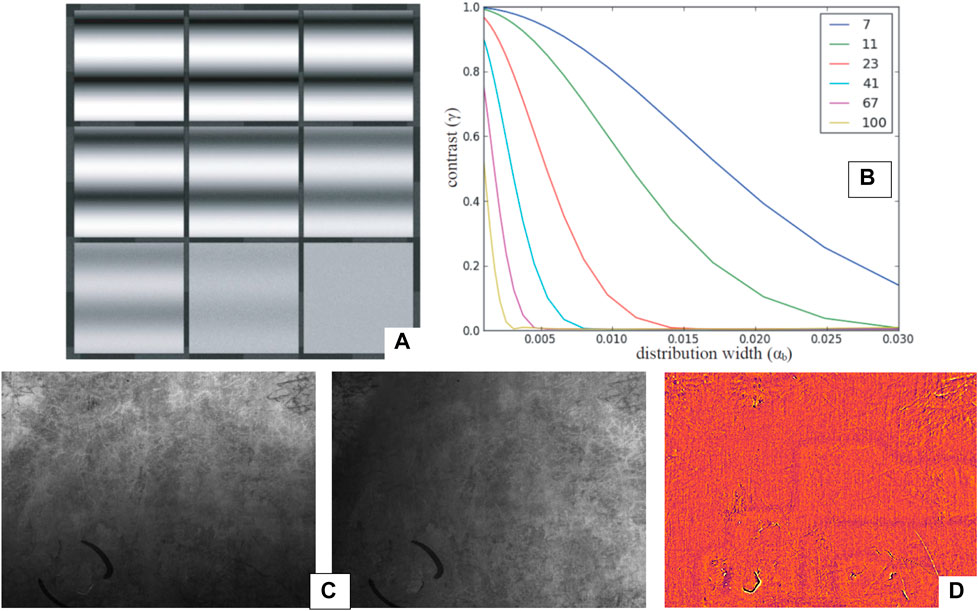
FIGURE 18. Impact of surface roughness on the fringe contrast. The rendered image (A) shows fringe reflections from surface patches with varying distribution width (αb = 0.001–0.03) at constant L (11 fringes on the screen) for a microfacet scattering model (Höfer et al., 2013a). The plot in (B) shows the calculated fringe contrast as a function of αb and for different L (7–100 fringes on screen). (C) Two images from wide-fringe sequences (vertical and horizontal) used on a die-cast surface with low specularity; size approx. 60 mm x 45 mm. (D) Resulting curvature map in false color. Despite poor SNR, the decoding has succeeded: structure print-through from rear side and casting defects are clearly recognizable.
Beyond that, one may continue with thermal infrared DM (IRDM, Section 3.2), where rough metal surfaces are specular due to a smaller ratio of roughness scale to wavelength. Although the angular and lateral resolutions in IRDM are inferior to those in the visible spectrum due to physical reasons, the approach is useful in the early inspection of raw or primed surfaces, on which defects would otherwise only become visible after painting.
On the other hand, diffuse reflection enables the combinations of DM with other methods such as laser triangulation, SFS (Balzer and Werling, 2010), or FP (Wang T. et al., 2021). Further, roughness may be anisotropic: many technical surfaces have an increased roughness in one direction and remain quasi-specular in the other. Therefore, sometimes it is still possible to assess one slope component, or to rotate the reference fringes with respect to the surface, in order to maximize the signal to noise ratio. The optimal choices for such measurements have not been formulated theoretically since the relationship between roughness and fringe contrast has not yet been modeled in a satisfactory way.
3.1.3 Calibration quality and stability
When metric measurements are needed, the system must be calibrated. This is usually (but not always) done by optimizing unknown system parameters with a known reference object. As the parameter space of a DM sensor is relatively large, this process is often performed in smaller steps, when subsystems are calibrated separately (Section 2.4). Accurate calibration is particularly important when a surface is reconstructed by integration, where errors accumulate (Li et al., 2012a). Hence, a rigid construction and high thermal stability (ensured by, e.g., low-thermal expansion materials) are important to reduce parameter drift between calibrations.
These challenges are particularly important for large setups. For solar concentrators, testing often happens outdoors upon assembly or during maintenance and re-adjustment (Heimsath et al., 2008; Wang et al., 2010). In order to reduce the negative effects of wind buffeting, it is important to record data fast. Different requirements apply to telescope mirrors: these are of course measured and polished indoors, but the slope/shape specifications are tighter by several orders of magnitude. Uncertainties here mainly depend on thermal stability; it may be necessary to continuously monitor the setup geometry with, e.g., laser trackers (Huang, 2015).
When only slopes or curvatures are needed, these requirements can be relaxed. Under certain conditions, such maps can be used as a proxy for the surface shape (Dominguez et al., 2012; Zhao and Burge, 2013; Antoine et al., 2019), e.g., for modal analyses with polynomials, as mentioned earlier. The misalignment effects then remain confined to local deviations.
3.1.4 Measurement speed
Almost all industrial applications impose some time constraints on metrology; the prescribed production cycle dictates the rate of data acquisition and processing (or, alternatively, the number of inspection stations), whether or not the inspected surfaces are in motion. The following tricks may help find the balance between the measurement duration, costs, uncertainties, and defect detection efficiencies:
• Brighter light sources (maybe operating in flash mode) reduce the exposure time.
• Lower f-numbers of the optics reduce the exposure time; the required depth of focus puts a lower bound on the permissible f-numbers. As a rule of thumb, in a diffraction-limited lens the size of a focused point on the sensor in μm roughly equals the f-number of the optic (Reichel, 2020).2 Hence, increasing the latter in order to obtain a larger depth of field (which is often useful as most surfaces in DM are observed from an oblique angle) blurs the point image and reduces the effective image resolution (note that typical pixel sizes in modern sensors are in the single-digit μm range).
• Data processing can be accelerated by performing computations asynchronously, with distributed CPUs and/or GPUs.
• Non-demanding applications may use simpler coding methods than phase shifting (it yields unmatched sensitivity but needs many camera frames).
• A lower number of fringe sequences in phase shifting (Section 2.2) may suffice. For continuous smooth surfaces one may use a single fringe sequence per direction in combination with a heuristical phase unwrapping technique (which may fail for less-trivial shapes).
• Similarly, fewer phase shifts per sequence (Section 2.2) accelerate data acquisition. (An exact solution with no additional assumptions requires N ≧ 3, but methods using more phases are significantly more stable in practice and reduce the effects of non-linearities in transfer functions).
• Multiple reference screens and/or cameras (in a single setup or as separate systems) utilize the available “light field” more efficiently.
• Single-shot methods (with static patterns that use spatial phase modulation or another principle) operate at the expense of spatial resolution and dynamic range (when multiplexed patterns are used).
• If the f-number is still too high, one may increase the camera gain as the last resort (this replaces digitization noise by electronic noise).
3.1.5 Setup geometry and size
Finding the proper spatial frequency of fringes for reference patterns is straightforward for objects of quasi-constant curvature, but may be a challenge for complex shapes.
Planar surfaces produce a largely undistorted mirror image of the reference screen. The latter then generally needs to be larger than the test piece (e.g., about twice as large in the basic geometry when the surface is placed at roughly the same distances from the camera and the screen). This situation may be compared to a fitting mirror that must be at least half the size of the person using it.
Concave surfaces magnify the reference structure. Therefore, if the latter is placed in the vicinity of a caustic of view rays (but not too close to it), a relatively small screen may enable testing of very large parts (Su et al., 2012a) (another consequence of this magnification is, of course, the reduction of the source intensity recorded by the camera). Typical examples of large optics that can be tested with DM are solar concentrators and astronomical telescope mirrors. Their radii of curvature range from several meters to tens of meters, and in the most popular approach to test them, the reference screen and the detector are placed near the center of curvature. Therefore, such set-ups typically do not use large screens or many cameras, although multi-camera examples are known (Schulz et al., 2011; Olesch et al., 2014). As a drawback of this approach, for extremely large radii of curvature (for example, the E-ELT mirror facets have a curvature radius of about 69 m) it may be impossible to find or build testing chambers that are long enough.
Convex objects are the most difficult case in practice. Many parts have edges and corners with small radii of curvature that strongly de-magnify the images of the structured light sources. In some positions even a large screen modulates only a tiny part of an edge in an object (and none of its remaining surface). In addition, since the entire screen image is compressed into a small area on the sensor, the fringes become too bright and often cannot be resolved. In such cases one may need to enclose the inspected object by reference structures (Campos-García et al., 2011; Zhang et al., 2017; Graves et al., 2019b). If large switchable structures are required, the method of choice is an array of projectors illuminating walls or scattering screens as in a “cave” (Balzer et al., 2014). In experiments, objects can be surrounded by screens on almost all sides; in practice, such systems are mostly built as tunnels or moving portals to increase the throughput. Secondary or other convex astronomical mirrors may in some cases be amenable to DM testing (Zhang and Chun, 2022).
The inspection of pieces featuring a wide range of curvatures is a serious challenge even if the specular reflectance is uniform. If the object position is known, it may be possible in some cases to use inverse fringe or spot patterns (Pérard, 1995; Díaz-Uribe and Campos-García, 2000; Mai, 2007; Tosun et al., 2007; Werling and Beyerer, 2007; Liang et al., 2016; Campos-García et al., 2019; DelOlmo-Márquez et al., 2021; Huerta-Carranza et al., 2021). Of course, sharper changes in curvature over the surface necessitate tighter constraints on the position of the sample with respect to all degrees of freedom. The problem of shadowing that is important for fringe projection is less of an issue here, as shadowing is often associated with spurious double reflections on the edges anyway. The latter are a show-stopper in DM and must be avoided at the layout stage if possible. There exist geometries (e.g., funnel-like shapes) on which deflectometric measurements cannot be made unless the sensor and the reference structure are small enough (and are, e.g., made to fit inside the cavities).
For surfaces with steps (Karaçali and Snyder, 2003; Zhang Z. et al., 2022; Gao et al., 2022; Xu et al., 2022), obscuration must be considered on the side of illumination and/or observation. Again, if possible, the optics must be modified in order to avoid this situation and ideally make the entire object surface accessible to testing. Specialized setups can make use of telecentric observation and a coaxial structured light source (Werling and Heizmann, 2015; Niu et al., 2018). Note that this case is different from the situation when discontinuities occur in the slopes of the surface (Durou et al., 2009).
Instead of building a reference structure enclosing the object, it is possible to move, e.g., a smaller screen around, so that the required solid angle is covered by its successive positions in a temporal sequence of measurements [Section 3.5 (Schwarz, 2016)]. By accounting for object and sensor locations, it is also possible to pre-distort patterns so that the resulting uncertainty is roughly the same as with a static sensor. In practice, though, this is a relatively complicated calculation. Instead, it is easier to adapt the highest spatial frequency in patterns (a single parameter) for each measurement.
In general, the characterization of components in large-scale DM systems is challenging (Section 2.4). Efforts needed to calibrate them and ensure the consistency and the stability of parameters (inside or outside of a laboratory) increase with the number and sizes of the system components.
3.1.6 Low-cost and mobile sensors in deflectometry
The increasing availability of high-quality screens and the miniaturization of electronics enables a range of new DM implementations with reduced system costs. The simplest example of a low-cost device suitable for DM is any laptop screen with a built-in web cam. Similarly, smartphones or tablets have become an ubiquitous example for the tight integration of sensors and displays in consumer electronics. They appear to be ideal platforms for rigid or hand-held DM systems, capable of qualitative measurements of small surface areas (Butel et al., 2015; Trumper et al., 2016). With additional multi-view stitching tools, their field of view may be extended (Willomitzer et al., 2020; Wei et al., 2022). Despite a typically non-ideal geometry (e.g., concerning the camera alignment with respect to the screen), such systems demonstrate respectable results. In combination with sufficiently stable (e.g., 3D-printed) spacer frames, one can even ensure reproducible calibration uncertainties and measurements.
3.1.7 Other sources of measurement errors
Given the sensitivity goals for a setup (Section 2.1), one adjusts parameters in order to assess the largest possible surface area in the shortest possible time. Apart from calibration errors (discussed above), the resulting measurement quality also depends on the performance of the sensors.
For many surfaces, typical measurement distances are in the range between 0.3 and 1 m. With typical LC displays as sources, the decoding errors (that determine the angular uncertainty of deflection maps) then significantly depend on the noise in the pixel values recorded by the camera. (This is less of an issue for the most demanding pieces measured with DM so far—astronomical and synchrotron mirrors—that have curvature radii of many meters and simple shapes and can be measured in very large setups with extremely high sensitivity.)
The SNR in modern cameras is no longer limited by the electronic noise, but rather by the photoelectron collecting capacity of pixels, which is of order 104–105 (EMVA, 2021). In combination with the quantum efficiency level of sensors (that is no longer improving) this leads to the remarkable fact that the common 8-bit digitization (24-bit for color) is (coincidentally) well matched to the underlying physics. There may be cases with exceptionally poor illumination where digitization noise does play a role, but in practice one then takes measures to increase the photon count, or uses frame averaging for the same scene.
As a direct consequence of this very well-predictable level of statistical noise, one may accurately state the uncertainty limits of phase-measurement methods (Surrel, 1997a; Horneber et al., 2002; Fischer et al., 2011; Faber, 2012; Fischer et al., 2012; Höfer et al., 2013a) and easily devise optimal encoding strategies at least in terms of reference fringe periods.
Further, in defect detection tasks one needs to consider the spatial resolution. Remarkably, defects distinctly smaller than a pixel can still be detected by DM (Bothe et al., 2004; Petz et al., 2018). Thus, the well-known rule of thumb that a defect should be resolved by two or three pixels does not necessarily apply, and the specific requirements will depend on whether defects must be only detected or also classified by type.
Apart from the systemic sources of uncertainty associated with the components and the trade-offs made in the configuration (Section 3), in practice one encounters a number of additional sources of error that interfere with measurement and classification tasks. In the remainder of this section we provide a few practical suggestions on how best to minimize or eliminate such errors and artifacts.
Contamination of surfaces is an ever-present annoyance for visual inspection (even in clean rooms). Most often it has the form of dust or marks stemming from improper handling of an object (e.g., fingerprints). Since the detectability of minute contaminations much smaller than a pixel is the same as that of actual defects, no distinction or classification of these unresolved features of unclear origin is possible. Sometimes extra signals such as fluorescence under UV light can be used to detect contamination; however, the simplest strategy by far is to keep surfaces clean. Dust is most conveniently removed with a shower of ionized air which removes particles and static charge. After that, one has about 10–20 s to measure the part before it starts attracting dust again. Other contaminations, such as fingerprints, can usually be controlled by appropriate equipment and procedures. Larger features can be distinguished to some extent by their signatures in phase and/or modulation maps (Burke and Zhong, 2017; Wu et al., 2017), but, of course, the error detection accuracy still suffers from any residual artifacts.
The stray light from external sources (e.g., sunlight, room lighting) or internal reflection on system components can introduce static or dynamic interference in the camera image. Measurements of surfaces with a relatively high diffuse reflectance are especially susceptible to surrounding light sources. In most cases, a lightproof housing and/or careful positioning of all components suppresses such interference. While it is not always necessary to cover all internal surfaces of the setup with matte black paint or foil, it is certainly a good idea to avoid glossy components. In cases where light contamination is unavoidable, solutions include constraining the measurement to a suitable undisturbed part of the light spectrum with custom light sources and spectral filters, e.g., in the near-infrared range (Chang et al., 2020), or recording the static part of the background intensity to subtract it from all recorded data later.
Stable position and alignment of all system components is vital to minimizing uncertainties. This should be taken into account at all relevant time scales. Vibrations lead to blurred images due to movement during the exposure time. This can be a non-uniform effect, depending on the recorded fringe densities and object curvatures, so that at worst the fringe decoding may fail—or a DM system may be designed that actually measures vibrations (Zhu et al., 2022). An unstable object handling system or inadequate support might shift between the frames corresponding to a coding sequence. Even if the object support is highly reproducible, the measurement system must still be able to cope with variations in object shapes from part to part. From our practical experience, it is worthwhile to characterize the variations in object shapes before designing the layout and sensitivity of the inspection system.
Finally, long-term instability due to inadequate repeatability of the handling system or thermal expansion causes a mismatch between the calibration and the actual setup geometry. This affects the degree to which the measurements can be compared (e.g., when detecting defects with respect to a reference measurement) or combined for analysis.
3.1.8 Examples of practically achieved uncertainties
The measurement noise in the derivatives is a serious problem for surface reconstruction (Freischlad, 1992; Legarda-Sáenz et al., 2000; Elster et al., 2002; Karaçali and Karaçali, 2004; Lowitzsch et al., 2005; Petz and Tutsch, 2005; Bonfort, 2006; Legarda-Sáenz, 2007; Kolhe and Agrawal, 2009; Fischer et al., 2011; Li et al., 2012a; Höfer et al., 2013a; Patel and Chellappa, 2013; Dong et al., 2014; Pak, 2014; DeMars et al., 2019) due to the low sensitivity of measured slopes to absolute surface height (Falconi, 1964). Today, only scanning techniques allow uncertainties commensurate with the tolerances of demanding optical surfaces (e.g., synchrotron mirrors) (Weingaertner et al., 2001; Elster and Weingärtner, 2002; Lammert et al., 2004; Xiao et al., 2011).
The most straightforward use of DM is of course to map and evaluate slopes. While this approach cannot guide polishing or shaping processes based on 3D models, it has proven useful, e.g., in characterization of solar mirrors (Ulmer and Röger, 2007; Andraka et al., 2009; Su et al., 2010). Achieved slope sensitivities range from 0.2 to 20 μrad, which is useful for solar mirrors whose performance specifications are typically in the range of a few mrad (Burke et al., 2013). In some cases, slope specifications can replace RMS wavefront specifications for precision optics (Burge, 2010; Li W. et al., 2014; Sironi et al., 2016; Antoine et al., 2019); the required sensitivities are in the 10 μrad–1 μrad range, which is achievable without too much effort. Higher demands, such as 10 nrad (Sironi et al., 2016), are significantly harder to satisfy, and commensurate performance has not yet been demonstrated.
The state of the art sensitivity in DM is currently at the level of a few nm for small-scale defects (Kugimiya, 1988; Hahn et al., 1990; Beyerer and Pérard, 1997; Bothe et al., 2004; Jüptner and Bothe, 2009; Burke, 2019), several tens of nm for mid-frequency errors (Su et al., 2012a; Dong et al., 2014; Su, 2014; Coniglio et al., 2021), and about 100–200 nm for flat or low-curvature surfaces (Graves et al., 2007; Ettl et al., 2008; Sandner et al., 2011; Li et al., 2012a; Liu et al., 2012; Hofbauer et al., 2013; Olesch and Häusler, 2014; Ren et al., 2015; Li et al., 2017), with smaller parts yielding even better results (Su et al., 2012b; Huang R. et al., 2013; Su et al., 2013c; Bergmann et al., 2015). As mentioned above, for best results one may replace lenses with an actual pinhole aperture (Su et al., 2013c). It has also been demonstrated that DM sensitivity in the mid-frequency range is sufficient to drive machine learning for polishing control (Coniglio et al., 2022).
Simple and accurate measurement of aspherics and free-form surfaces has been one of the hopes placed in phase-measuring deflectometry. With DM, one can indeed obtain valid data with less effort than with interferometry, but precision is so important in this discipline that interferometry or tactile methods, despite their own difficulties (Wiegmann et al., 2011; Fortmeier et al., 2016; Blalock et al., 2017; Pruss et al., 2017), have not been displaced except in niche applications. Some work has been done towards establishing traceability of and between deflectometry, interferometry, and tactile methods (Rose et al., 2009; Bergmans et al., 2015; Schachtschneider et al., 2018; Fortmeier et al., 2020), but a comprehensive assessment is not yet available as far as we know. DM systems can also be calibrated with curvature standards; the caveat here is that uniform curvature readings from larger samples are still based on whole-surface reconstructions and thus bear the same errors. We are not aware of any published efforts in the other direction, e.g., referencing waviness or even smaller defects measured with DM against other metrological tools.
3.2 Light sources for the reference pattern
3.2.1 Inspection in the visible spectrum
As mentioned above, computer monitors are convenient and affordable active reference devices. In what follows we discuss some practical details related to their use in DM.
If the reflected view rays meet the screen at a shallow angle (which occurs frequently when convex objects must be placed close to the screen), it is important that the “view angle” (angular intensity spread by screen pixels) be as large as possible. With the improved availability of IPS (in-plane switching) displays, achieving a more uniform illumination has become easier. Still, if the distance between screen and object varies significantly across the rays captured, the illumination level and slope sensitivity is bound to be highly inhomogeneous for geometrical reasons alone.
The screen’s brightness is important for fast and low-noise measurements, and all flat-screen technologies keep improving in this regard. The brightest monitors (intended for window displays or outdoor use), however, typically use non-IPS matrices and cannot be universally recommended.
Sometimes a fringe-phase measurement may succeed with a sufficiently small uncertainty using only Full-HD screen resolution. Even in such cases it may be beneficial to use monitors with more (and smaller) pixels, as the detrimental moiré structures are then easier to avoid. This becomes important when measuring complex surfaces whose geometry may create an undesirably sharp reflected image of the screen. For very demanding applications, one may consider medical monochrome monitors designed to display X-ray images; they have high brightness and dynamic range as well as a very high lateral resolution because they have no RGB matrix. Typically, these are available in useful square formats and are relatively expensive.
Matte screens are better suited for DM than glossy ones. The scattering on the surface does increase the uncertainty of the measured ray directions; however, in practice this effect is less of an error source than the ghost images in the screen created via multiple reflections (especially when the screen is close to the object). Fortunately, large screens are primarily available with matte finish.
Most screens are not designed for non-conventional mounting angles (e.g., parallel to the floor) and may deform or break under their own weight when tilted so. Certainly it is possible to mitigate such effects with extra support frames, but this may involve difficult and/or expensive modifications. The larger a screen, the more fragile it is; for, e.g., moving systems on robotic supports, safe ranges of accelerations have to be established by trial and error.
Systems where reference patterns are projected on some surface are significantly more flexible. While the geometry of such patterns is not nearly as easy to characterize as LCD screens (Section 2.4.2), considerable freedom exists in placing and orienting projectors and projection surfaces. Similarly, pre-printed passive reference screens can be made in almost any shape and orientation, and a wide variety of illumination options exists, including very fast flash or strobe illumination. Uniform diffuse (isotropic) scattering by the material of such screens is beneficial for DM measurements.
3.2.2 Inspection with infrared light
In applications where surfaces have insufficient specular reflection to apply “normal” DM, light with longer wavelengths may help. This is the field of “infrared deflectometry” (IRDM), to be delineated against short-wave infrared deflectometry (Chang et al., 2020) and thermal pattern projection (Landmann et al., 2020; Landmann et al., 2021).
While “infrared” (IR) commonly refers to the entire range from just beyond the visible (VIS) to millimeter-wave radiation, IRDM is most often implemented in the long-wave infrared (LWIR), or thermal spectrum. It corresponds to wavelengths of 8–14 μm, where affordable imaging sensors (thermal cameras) are available.
As already noted for regular DM in Section 1.1.1, the IR radiation is reflected by the surface: no patterns are projected on it, nor is the material heated intentionally. Instead, IRDM exploits the wavelength-dependent scattering off the surface microstructure. The latter may appear as a result of machining or just be the raw state of the material’s surface. While their typical scales are not resolved by DM, the roughness per se, nonetheless, affects scattering and leads to “blurring” of the reflected images, as shown in Figure 19.
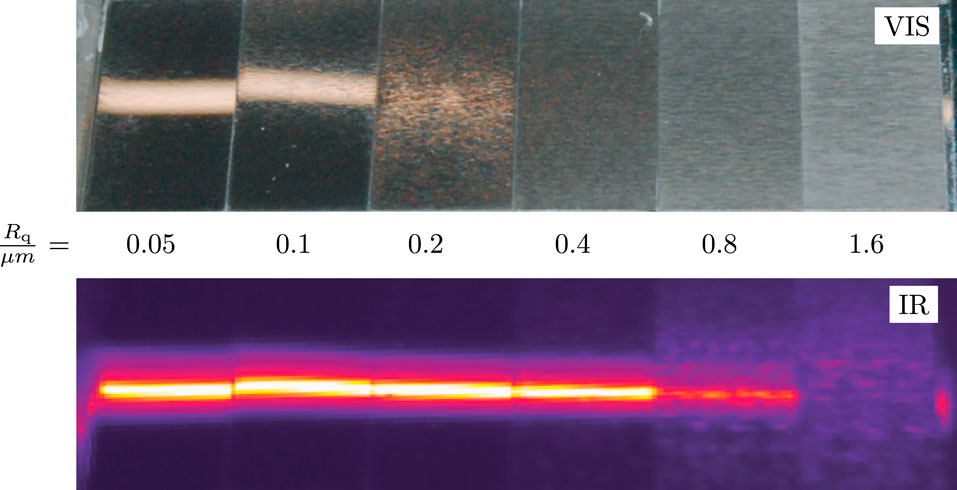
FIGURE 19. Scattering by calibrated surface roughness standards in the visible (λ =0.4–0.7 μm) and long-wave infrared (λ =8–14 μm) spectra. The RMS surface roughness Rq is indicated for each sample. Images from (Höfer et al., 2016).
As a rule of thumb, for the reflection to be considered “specular,” the wavelength λ of light and the root mean square (RMS) roughness of the surface Rq must satisfy
where θ is the incidence angle (in terms of Figure 1,
While thermal imaging cameras are available, the pattern creation remains a challenge in IRDM: there exist no off-the-shelf parts like monitors or projectors for LWIR similar to those operating with visible light. Starting from the initial experiments (Horbach and Kammel, 2005) to recent applications (Su et al., 2011; Höfer et al., 2016; Toniuc and Pierron, 2019), one mostly uses static patterns. Harnessing dynamic thermal processes in order to generate patterns still remains a challenging engineering endeavor (Höfer et al., 2013b; Höfer, 2017; Graves et al., 2019a).
Known applications of IRDM usually focus on materials with “intermediate” surface properties, i.e., those that are too glossy for inspection with FP and at the same time too rough for regular DM. Prominent examples include the inspection of car body parts (Horbach and Kammel, 2005; Höfer et al., 2016; Höfer, 2017) in early production (before they are painted), or, in precision manufacturing, the measurement of large free-form optics during the grinding stage (Su et al., 2011; Su et al., 2013b; Su, 2014; Lowman et al., 2018; Graves et al., 2019a).
Aside from creating specular reflections on rough surfaces, LWIR is also useful for some materials that are transparent in the visible light but opaque in the LWIR, such as glass or some plastics. By suppressing transparency and back-reflections, IRDM here facilitates the dedicated inspection of outer surfaces (Höfer et al., 2016).
3.2.3 Inspection with ultraviolet light
When inspecting glass optics (e.g., lenses) in visible light, the “parasitic” reflex from the back side may overlap with the front side reflection and corrupt the decoded data (Faber et al., 2009). The obvious solution—covering the back side with non-reflecting paint—is only practical in low-volume tests or for reference pieces (Schachtschneider et al., 2018), and is not suitable for serial production and/or finishing.
Since most glass types are opaque in UV light, it has been suggested to suppress the back-side reflection in DM measurements by using UV illumination (Sprenger et al., 2010). As with IR, however, no cheap high-resolution displays are available for the UV spectrum. Therefore, static patterns (e.g., slit masks in front of a UV emitter) must be used with or without scanning. Note that the camera of course needs a lens that transmits UV and a detector that captures it (typically a “backlit” chip). UVDM systems are therefore slower, less versatile, and more expensive than the “standard” DM, and are only useful for special applications.
Recently a UV-compatible scheme has been suggested for testing circular optical surfaces that can bring the strengths of phase measurement to bear in UVDM. It is based on multiplexed spiral reference patterns that can be evaluated spatially or (in case the pattern is a rotating mask) temporally; from the recorded phase data, one may decode spatial positions (Kludt and Burke, 2018). Figure 20 gives a simple example.
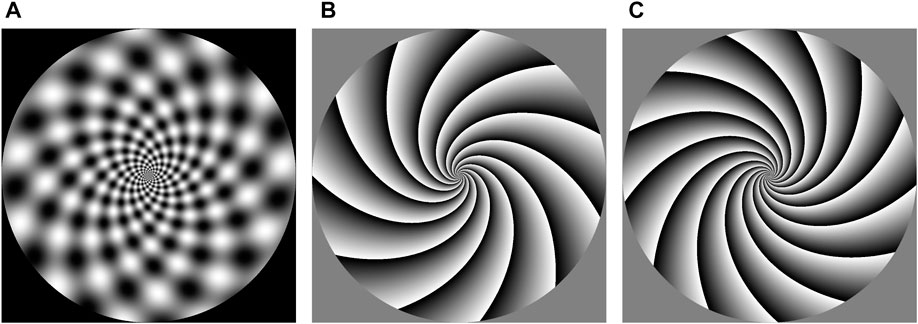
FIGURE 20. Using logarithmic spirals as coding patterns allows keeping the angle constant between the fringes and the radial/tangential directions. (A) Example with 11 fringes bending clockwise and 13 fringes bending counterclockwise. The natural widening of the fringes creates a (non-adjustable) form of pre-distortion for testing highly curved surfaces. (B, C) phases of the respective fringe patterns. Note that both sets of fringes must have a radial component for the measurement to work by rotation of a static pattern.
3.3 Imaging systems
As stated earlier, the photon accumulation by camera sensors is now very efficient and approaches the respective physical limits. When transporting photons to the sensor, most camera lenses designed for industrial vision have a remarkably accurate center of projection and low distortion; in our experience, the image geometry is seldom a cause for concern. On the other hand, the selection of lenses with appropriate resolution remains a challenge since MTFs have many parameters and are usually shown in data sheets only for selected settings. For sensors of ordinary sizes and aspect ratios (e.g., between 4:3 and 16:9), the statements by the manufacturers about the designed pixel size or the sensor resolution are reliable. However, even for high-quality lenses, the resolution is highest near the axis and decreases (sometimes to less than half the maximum) towards the field-of-view boundaries. We have found that many lenses work best at an f-number around 4, and attempts to increase the depth of focus by stopping down the aperture may lead to an unacceptable loss of resolution especially near the edges and corners of the image. No overviews nor plausible taxonomies of system layouts are available in the literature, possibly because one cannot study and compare different approaches with the same test piece, since—once again—the measurement geometry must be closely adapted to the geometry of the studied specimen.
3.3.1 Single camera, single screen
This configuration is the entry point to DM; it has no moving parts and is easy to implement on the hardware level, but the concessions to be made may include sometimes insufficient surface coverage of complex objects and/or difficult or only approximate geometrical calibration.
3.3.2 Multiple cameras, single screen
There are several reasons to use many cameras in a DM setup, the most common being that several views are needed to cover a sufficient portion of the object surface. In a multi-view setup it is likely that the view fields overlap; such overlapping datasets can be matched correctly if all cameras have been calibrated and their relative orientations are known. For one object position, this is sufficient to synthesize a result; if data from several object positions are combined, relations between them must be known as well. Note that one cannot use common stitching methods in order to align datasets, since multi-camera observations do not automatically yield normal fields that can be compared and merged. In fact, every camera has its own sensitivity field due to varying distances and angles across its image field. If the overlaps between camera fields are large enough, they may be suitable for the application of stereo techniques (Wang R. et al., 2021).
In stereo or light-field deflectometry (Horneber et al., 2001; Xu et al., 2018b; Uhlig and Heizmann, 2018; Ziebarth et al., 2018; Meguenani et al., 2021), two or more cameras (or pixels) record the same part of the object (or its entire surface) from different locations and angles. Given the intrinsic and extrinsic camera parameters, it is then possible to reconcile the measured deflections from each camera in a so-called stereo regularization (Werling and Beyerer, 2010), find consistent surface normals, and reconstruct the surface in metric units (Kickingereder and Donner, 2004; Werling and Beyerer, 2011).
The stereo positions do not necessarily have to be recorded with different cameras: it is possible to cover a surface with measurements from a single camera being moved from position to position and, if all its positions are known with respect to the object, to reconstruct the object surface with a so-called virtual stereo technique (Balzer et al., 2011).
3.3.3 Single camera, multiple screens
It is also possible to improve the surface coverage with more reference screens, either as an actual simultaneous set-up or sequentially by moving the screen to some pre-defined positions. (The latter option is also a relatively popular regularization method: since the screen is moved by a known distance, one may match the respective normal fields and select the unique surface position reconciling them.) The challenges with several screens are similar to those associated with multiple cameras: one cannot always assume that they are identical, which complicates the calibration and data fusion. Using the same system for multiple positions partially avoids these problems but obviously incurs longer measurement times, and it is still necessary to combine individual measurements. Custom illumination devices such as arcs, tunnels or domes can be built to cover a much larger solid angle around the object than flat screens, but at a greatly increased expense for assembly and control.
3.4 Surfaces in motion
Sometimes it is desirable to scan the object in a linear motion even if it could potentially be covered with a sequence of static measurements, because i) the sensor may be more compact and ii) some production lines never stop. Tracking the relative positions of components (or exactly adhering to the design) is an important issue here, as an incorrect spatial assignment (especially in a cyclic motion) immediately causes artifacts in the results, which often take the form of temporal sequences of line data stacked into synthetic 2D maps as in Figure 7.
Unsurprisingly, the necessary amounts of data correlate with the required detection performance (in terms of sizes and severity of defects to be identified). As an example, hail damage scanners are designed to find defects with lateral sizes of several cm, and depth in the mm range. These are easily detectable with one-dimensional stripe patterns, typically implemented as luminous portal structures. Phase shifting and evaluation of spatial derivatives here are unnecessary (i.e., data volumes can be reduced thanks to a-priori knowledge about the defect shapes). Moreover, the object may move past the sensor at an uncontrolled (but range-limited) velocity.
Similarly, error detection is possible on moving objects in industrial inspection for production. The typical approach here is also to use a single bright line whose reflection is then captured on a scattering screen (Seulin et al., 2001; Wedowski et al., 2012b; Hügel et al., 2016; Meguenani et al., 2019). The exact registration of positions is not very important here either, since the task is simply the detection of defects.
In order to achieve a finer resolution on the surface and a more accurate localization of defects, the object movement must be controlled more tightly (e.g., with a conveyor belt), or alternatively the object should be stopped for a measurement (during which the reference structures move). This appears to be a practical way to obtain decent spatial registration, since the relative movement between the object and cameras introduces unwanted uncertainties. As a result, moving cameras are not used in any systems that we are aware of, other than robotic systems with cameras and screens moving as a unit. Other solutions may involve semi-qualitative evaluation (Arnal et al., 2017) as well as custom reference structures that allow two-dimensional decoding and even surface reconstruction (Penk et al., 2020) from the temporal sequence of reflection data.
Finally, robotic applications with a moving object and adapted active fringe patterns have been reported but they remain rare and relatively complex (Schwarz, 2016).
3.5 Optimal inspection planning
As discussed in Section 3.1.5, large or high-curvature convex surfaces may require multiple measurements with different placements of cameras and light sources in order to assess the entire surface. Finding the optimal placement manually is time-consuming and complex; automated optimization of DM setup parameters aims to mitigate this problem. Whether or not multi-pose procedures are the goal, starting with detailed simulations of the measurements (Li et al., 2012b; Li and Burke, 2014; Huang et al., 2016; Xu et al., 2018b; Nimier-David et al., 2019; Li et al., 2022) is almost always a good idea. On the other hand, all simulations end up with more or less deviation from actual experimental data. Unfortunately, we are not aware of any systematic attempts to explore and compare the reliability of simulation approaches; this may be due to the role of specific implementations, which are typically not being published.
The optimization complexity depends on whether the setup is static or dynamic. In a static setup, the placement of light source(s), camera(s), and the studied surface(s) is optimized at the design phase and remains fixed during measurements. In a dynamic setup, at least one component can be adjusted during the measurement. For example, an integrated sensor consisting of a display and a camera can be mounted on an industrial robot for a total of six “active” degrees of freedom. In this case one needs a plan—a sequence of configurations for the controllable element.
While static setups usually allow faster measurements (multiple cameras can be used in parallel to capture images), dynamic systems are sequential and require longer cycle times. On the other hand, depending on the available degrees of freedom, dynamic setups can be more efficient when inspecting complex shapes and multiple surface variants according to different respective plans.
Only a few publications address the automated optimal design of DM constellations. Incipient stages of design optimization in DM can be found in (Kammel, 2004) where a semi-automatic method is presented to position a camera and a display relative to the test surface for a single measurement. Iterations of bounding-box and fringe visibility computations are reported in (Xu et al., 2012); (Lobachev et al., 2013) describes a device for the detection of hail dents on passenger cars and introduces a method to find the optimal camera positions for a static setup with fixed displays (projection screens). The algorithm minimizes a cost function that takes the visibility of multiple cars into account.
While these works focus on the visibility (coverage) as the optimization criterion, Roschani (2020) uses probabilistic methods to optimize the measurement uncertainty. More specifically, the proposed algorithm minimizes the residual uncertainty of normal vectors or derived heights and attempts to reduce them to or below the level specified by the inspection task.
All of the methods cited above assume that the reference surface is known. This is true in inspection tasks and considerably simplifies the planning process. In some applications, however, such information is not available. The optimization of DM inspection plans without prior knowledge of the reference surface or other simplifying assumptions about the studied object remains an important open problem.
4 Data acquisition and processing
We have already discussed the optical aspects of obtaining the reflected images of the reference screen and the integration of metric slope data. Here we concern ourselves with obtaining the slope maps from the captured information, and with the alternative uses of that data when the 3D reconstruction is not needed. In most practical cases one can get away without it—or conversely, since it is quite difficult, practice has evolved to avoid it where possible.
Depending on the nature and purpose of the measurement, there is an ever-widening selection of ways to acquire the necessary data, where of course the choice is affected by the available hardware for a given system design—for it is the object’s geometry that determines the possible system constellations. Once again due to the law of reflection, there is considerably less freedom for cherry-picking coding schemes in DM than, e.g., in fringe projection (Gockel, 2006; Salvi et al., 2010; Zhang Z., 2012; Zuo et al., 2016; Zhang, 2018; Zuo et al., 2018; Xu and Zhang, 2020). The choices that do exist can be weighted by a custom merit function as in the example in (Butel et al., 2012), and many coding methods developed and refined in fringe projection are equally as applicable in DM (which is why we present some methods here that have not yet been used in DM). Our categorization below is a best effort, but cannot be completely sharp because techniques are increasingly being combined as they evolve further.
We are not aware of any open-source deflectometry software readily available that can record and process data and reconstruct geometrical parameters; one may use the fairly mature and actively maintained ITOM suite (Gronle et al., 2014) to begin. When starting from scratch, Python is the fastest way forward; most cameras come with a convenient Python API today, and today there are many mature open-source image-processing and visualization libraries (some with GPU support) that allow quick progress when prototyping an experiment. Unfortunately there is no universal recipe for controlling projectors and/or monitors, as this depends a great deal on the hardware itself.
The most difficult part is surely the development and/or adaptation of code for the geometrical system calibration; for internal camera calibration, again open-source modules like OpenCV may be used, unless the uncertainty specifications require custom calibrations with more detail.
For speed-critical applications, the Python code can be compiled into Cython, which offers many optimizations and can generate very fast code. Alternatively, since most open-source image processing libraries are written in C++ anyway, they can also be used without Python wrapper code; in that case, only the function-calling control code must be re-written in C++.
There are also commercial packages that offer tool boxes for hardware control and fast image processing with the option of compiling to machine code; our experience with closed-source software has been that bugs are harder to track down and can require workarounds that then tend to persist.
4.1 Position correspondence coding
In most cases, at least a qualitative description of relative ray directions is necessary to take advantage of the natural sensitivity of DM. As we will see, there are many ways to obtain this information.
4.1.1 Scanning methods
In Section 1.1.2 we have already described point and line scanning techniques for deflectometry for which there is little alternative outside the visible range; in this context, let us point out that point-scanning techniques can yield one surface normal per measurement, whereas line-scanning techniques create ambiguity in the direction of the reflected line that must be resolved by scanning again in the orthogonal direction (Höfer and Beyerer, 2016). In general, scanning techniques are useful where otherwise the evaluation may be impaired by the superposition of signals corresponding to multiple surfaces [or, when inspecting diffractive optics, to multiple diffraction orders (Chen et al., 2020)]. The position in this case is often found as the centroid of the captured intensities for each location of the scanning unit; the latter must be sufficiently accurate in order to avoid wave-like artifacts on the reconstructed surface.
4.1.2 Discrete codes
An early example of location coding is the family of binary (i.e., dark/bright) patterns known as Gray codes (Gray, 1953), where the name refers to the inventor, not to the pattern. Originally designed as an error-suppressing data transmission scheme [where the original “reflected” binary approach indeed provides the best error suppression (Agrell et al., 2004)], Gray codes can theoretically be used without gray-level calibrations. On the downside, finer spatial encoding requires a large number of frames and is bound to encounter difficulties when the reflected code pattern becomes blurred; for solutions to a subset of the issues, see (Butel et al., 2014). Nonetheless, binary patterns are no longer in common use in DM or fringe projection. Figure 21 demonstrates a set of binary images (but note that the checkerboard patterns as shown are not a coding sequence).
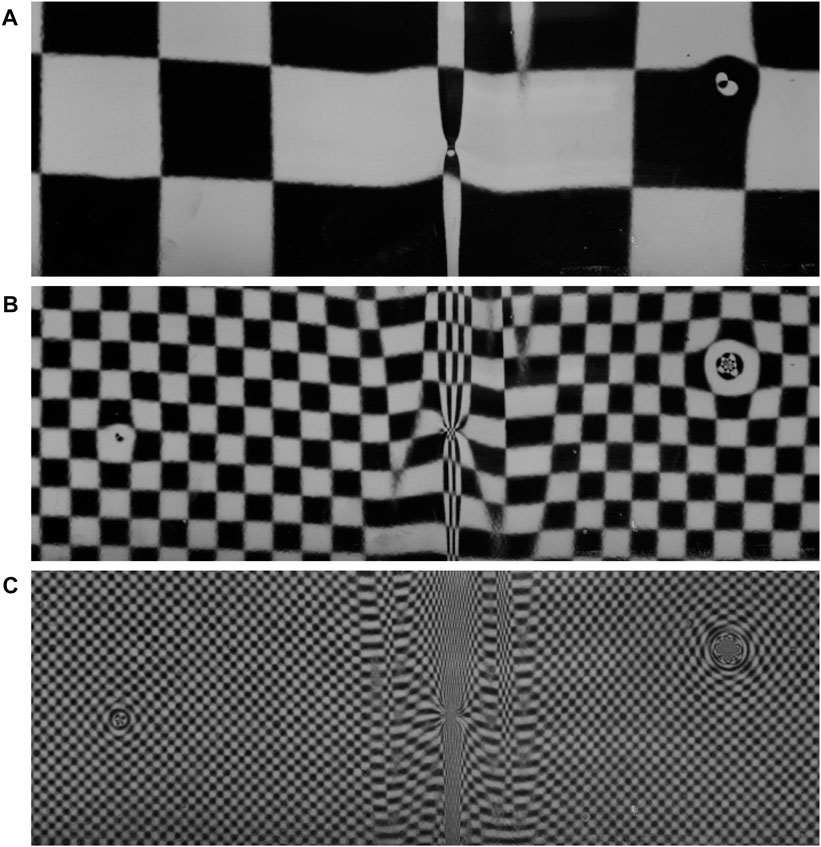
FIGURE 21. Reflections of checkerboard patterns from black painted metal sheet with kinks and dents; square sizes on screen are 240 pixels (A) to 60 pixels (B) to 15 pixels (C), in geometric progression. The dent on the right is always visible, but the reflections are difficult to interpret even in (A); the kink in the center demagnifies the squares strongly in the horizontal direction; the defect on the left is initially invisible; several smaller defects are hardly noticeable even with the smallest checkerboard pattern.
One possible upgrade has been the addition of dense phase data only in the last encoding stage, with coarser spatial assignments given by Gray codes (Sansoni et al., 1999; Yu et al., 2018). Figure 22 gives an impression of the benefit of this approach by way of just one fringe pattern per direction.
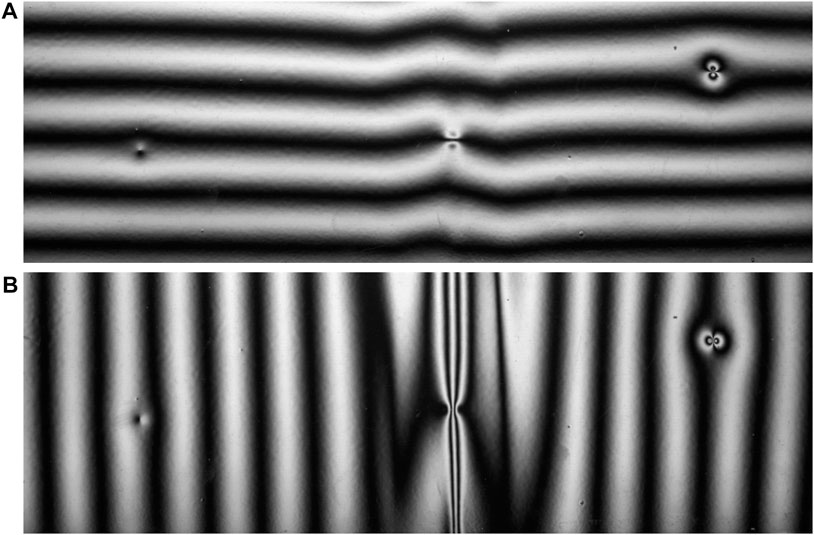
FIGURE 22. Reflections of cosine fringes from the same part as in Figure 21, horizontal (A) and vertical (B); note how the smooth intensity profile of the reference pattern makes all kinds of defects more visible and thus more detectable.
A comparison of the coding efficiency and error tolerance between Gray codes and phase measurement has been given in (Porras-Aguilar and Falaggis, 2016). Various attempts with ternary and quaternary Gray and gray codes have been reported (Zhang S., 2012; Xu et al., 2016; Zheng et al., 2017; He et al., 2019; Yang et al., 2021), and it has been shown that the measurement benefits from ordering the codes for minimal spatial intensity gradients (Porras-Aguilar et al., 2017; Falaggis and Porras-Aguilar, 2018).
4.1.3 Aperiodic and pseudo-random codes
Besides deterministic code sequences, it is also possible to encode positions via pseudorandom patterns (Sjödahl and Synnergren, 1999; Wiegmann et al., 2006; Heist et al., 2016; Pak et al., 2019). In comparisons with phase-shifting sequences (Kühmstedt et al., 2007; Heist et al., 2015), it has been shown that the correspondence assignment with pseudo-random sequences can be almost as reliable (Lutzke et al., 2013; Schaffer et al., 2014)—and potentially much faster—if the pattern parameters are chosen correctly (Große et al., 2013; Heist et al., 2018). The reported frame rates are in the kHz range and rely on fast custom projector units; with LC displays one must expect much longer measurement times since these are often surprisingly slow to switch from one pattern to the next one.
4.1.4 Phase-measuring methods
The high resolution and low uncertainty of the phase-shifting method (Section 2.2; see also Section 1.2) has unlocked the full potential of DM, not least because a defocused or otherwise smoothed cosine is still a cosine (albeit with lower contrast) (Huang et al., 2014). That means the decision where the camera is focused in the instrument will not affect the validity of the decoding results. Also, there are no undesired phase shifts once the fringe pattern is steady on the projector or LC display; thus the entire body of research dealing with phase-shift miscalibrations is unnecessary for DM, and a generic four-step phase-shifting method can usually be used with no penalties. However, when measuring partially specular surfaces, variations in background light or even re-distribution of scattering in the instrument due to switching fringe patterns may cause changes in the background intensity; hence, it may be necessary to compensate for background variations (Surrel, 1997b). Likewise, in most computer screens and projectors the relationship between the digital gray level and luminance depends on the graphics driver and its setting, is usually non-linear, and often does not span the full input or output range. These deviations may be interpreted as harmonics in the fringe profile, and comprehensive recipes have been given on how to suppress them by an appropriate design of the phase-reconstruction method (Surrel, 2000; Burke, 2012); however, typically the screen or projector is linearized by a look-up table or a fitted function before use (Ma et al., 2012; Zhang, 2014). Thus, systematic phase errors can be removed almost completely.
The remaining statistical errors mostly come from the camera as electronic and photonic noise (Rathjen, 1995; Surrel, 1997a; Belsher et al., 1999); digitization noise is, in our practical experience, very seldom an issue, even for 8-bit cameras. Electronic noise only plays a role when the fringe modulation is very low (less than 3 bit); under practical conditions, photon shot noise is the main noise source (Walkup and Goodman, 1973; Belsher et al., 1999). The physics of camera sensors has been thoroughly described and characterized in the EMVA 1288 guideline (EMVA, 2021) and has been utilized for understanding phase errors since (Fischer et al., 2011; Fischer et al., 2012). Importantly, the measurement will benefit from choosing a phase-reconstruction method whose statistical error does not oscillate with the phase (Bothe, 2008). Also, a higher static background intensity contributes extra photon noise, but no signal; therefore, measurements on partially specular surfaces are best carried out in the darkest possible environment.
As opposed to the three previous methods, the fringe patterns used in phase-measuring DM are 2D and periodic. The maximum sensitivity corresponds to the smallest possible fringe period, which results in many nominally identical fringes being present in the captured images, and the necessity to “unwrap” the phase. For continuous surfaces, the simplest approach is to use localized intensity alterations as markers, in one or several locations (Zhang and Yau, 2006; Gai and Da, 2010; Cui et al., 2012; Liu et al., 2014; Xing et al., 2017; Hu et al., 2018), or even on every fringe (Budianto et al., 2014; Budianto and Lun, 2016), and apply spatial phase unwrapping from the reference point or line to recover the positions. In well-controlled geometries where the sample can be placed in the same position as the calibration surface, it is also possible to refer to calibration data for the correct geometry reconstruction.
The necessary sequence of fringe patterns is certainly a burden on the measurement time; but in contrast to binary sequences, the result is more than just ray correspondences: by virtue of Eqs. 1–3, one also obtains fringe-modulation and reflectivity data for each phase-shift sequence with N ≧ 3, so that various properties of the surface can be inspected at once. Figure 23 shows an example with curvature and modulation data from the same test piece.
FIGURE 23. Test of the same surface as in Figure 21 with measurands derived from phase-shifted fringe patterns. (A) Curvature: kinks, dents, dust inclusions, and “orange-peel” paint waviness can be readily distinguished. (B) Fringe modulation amplitude as a proxy for glossiness; minor contamination not visible in Figure 21 or Figure 22 is easily detectable.
Spatial-only phase coding, and thereby one-shot recording of derivatives, requires de-multiplexing signals from crossed fringes (mostly by appropriate filtering in frequency space, but also wavelet transforms (Budianto et al., 2014; Liang et al., 2020), regularization (Villa et al., 2000) and deep-learning methods (Qiao et al., 2020; Qin et al., 2020; Fan et al., 2022)) and has been demonstrated mostly for flat mirrors or other optical elements that do not strongly affect the fringe spacing (Nguyen et al., 2021), with pre-distorted fringe patterns (Massig, 2001; Massig et al., 2005; Surrel, 2006; Liu et al., 2009; Huang et al., 2011; Flores et al., 2013; Liu et al., 2015; Liang et al., 2016; Trumper et al., 2016; Wu et al., 2016; Nguyen et al., 2019), or fitting the distorted fringe pattern (Luo et al., 2020). Again, the well-controlled geometry and/or differential nature of these measurements makes it possible to use only one coding frequency per direction. This approach should be preferred if possible, since superimposed reference patterns must share the dynamic ranges of screen and camera, which results in a lower modulation amplitude and thus SNR for each.
All of these methods are inapplicable if the fringes cannot be tracked reliably, which happens, e.g., either on surfaces with height steps, or (in the context of DM) in the presence of slope steps or peaks: large curvatures may create unresolvable or interrupted images of fringe patterns, which causes failures in decoding and unwrapping.
Therefore, it is quite common to code positions with a sequence of phase measurements at different L and then to use temporal phase unwrapping techniques for unique position recovery. Originating from two-wavelength interferometry, much research has been dedicated to finding the largest unambiguous range with the highest reliability. For integer ratios between the fringe periods, there exist number-theoretical tools that enhance the measurement range (Gushov and Solodkin, 1991; Guzhov et al., 2013). Further research (Osten et al., 1996; Surrel, 1997c; Towers et al., 2004; Xia and Liu, 2005; Falaggis et al., 2011; Falaggis et al., 2013; Falaggis et al., 2014; Li et al., 2016; Wei et al., 2017; Xiao et al., 2017; Allgeier et al., 2019; Petz et al., 2020b) has provided an even better understanding of the available options (Falaggis et al., 2018). An exciting new trend in multi-period coding is to make use of the sum of individual phases (as opposed to the difference) to achieve narrow virtual fringe spacings that are no longer resolvable optically (Servin et al., 2015; Xiong et al., 2017; Servin et al., 2018; Wang, 2018; DeMars et al., 2019; Xie et al., 2019). The actual narrow fringe patterns are best designed so that their period (and their advancement during phase stepping) is an integer number of pixels. This can help to avoid issues with another possible source of digitization noise: with only a few intensity samples per fringe period on the fringe display, the modulation sequence computed and shown by the display can depend on the relative phase between the fringes and the pixel matrix, depending on the monitor electronics and graphics driver. If relative-prime unwrapping methods are used, this design can only be used for one pattern in the sequence, so as to steer clear of common denominators.
Temporal position coding is the safest approach for complex objects; if one can assume that the fringe patterns do not deform much, it is also possible to encode the required frequencies into one phase-shifting sequence in a so-called composite fringe pattern (Li et al., 1997; Guan et al., 2003; Sansoni and Redaelli, 2005; Su and Liu, 2006; Kim et al., 2009; Liu et al., 2010; Kludt and Burke, 2018; Xie et al., 2019). Above, we have discussed crossed fringes and how they must share the dynamic range, and the same is of course true of signals mixed for a pseudo-temporal phase shift.
The techniques described so far ensure either a unique coding for one spatial derivative, or coding for both directions that still needs to be regularized. Unsurprisingly, even more development was devoted to multiplexing all the information into one pattern at once. For fringe projection, the correspondence problem is easier to solve, and crossed fringes have been used in combination with advanced unwrapping approaches (Takeda et al., 1997; Zhong and Zhang, 2001; Choudhury and Takeda, 2002).
The addition of color information allows simultaneous three-step phase shifting (Tarini et al., 2005; Castillo et al., 2013; Flores et al., 2015; Trumper et al., 2016), multi-frequency display (Zhang et al., 2006), or direction separation by color (Liu et al., 2009; Wu et al., 2016; Ma et al., 2018; Xie et al., 2019), including simple multi-frequency coding for easier unwrapping. Even discrete codes have been explored for use with colors (Xu et al., 2016; Zhou et al., 2017), and a combination of color and direction coding has been presented as well (Poirier-Herbeck et al., 2021). Color techniques of course work best on mirrors and glass, i.e., surfaces or media with no color of their own; but even then, one has to deal with the cross-talk between channels and the spectral dependence of the photon conversion efficiency. Moreover, on a patterned sensor, the color capability is traded for spatial resolution, while true three-color sensing amounts to tripling the number of sensors. On the other hand, the issue of limited dynamic ranges per signal is less important or can be avoided in this way; and if desired, object colors can be captured as well (Willomitzer et al., 2020). Dispersion effects and the sub-pixel location dependence of the color channels in LCD screens are always implicit, and this is true even when “white” light is used.
4.1.5 Inverse patterns
In serial tests of similar objects, one can alleviate the decoding difficulties that stem from excessive shape, modulation, or color-related effects on the reflected fringe patterns by pre-conditioning the patterns themselves. In other words, one generates “inverse patterns” such that they appear very regular upon reflection from an object of the prescribed (reference) geometry (Haist and Tiziani, 2002; Li et al., 2004b; Massig et al., 2005; Tosun et al., 2007; Werling and Beyerer, 2007; Caulier et al., 2011; Liang et al., 2016; Kludt and Burke, 2018; Campos-García et al., 2019). Although computationally demanding, such methods may provide easy visual cues and simplify automatic evaluation and/or error detection, as seen in Figure 24.
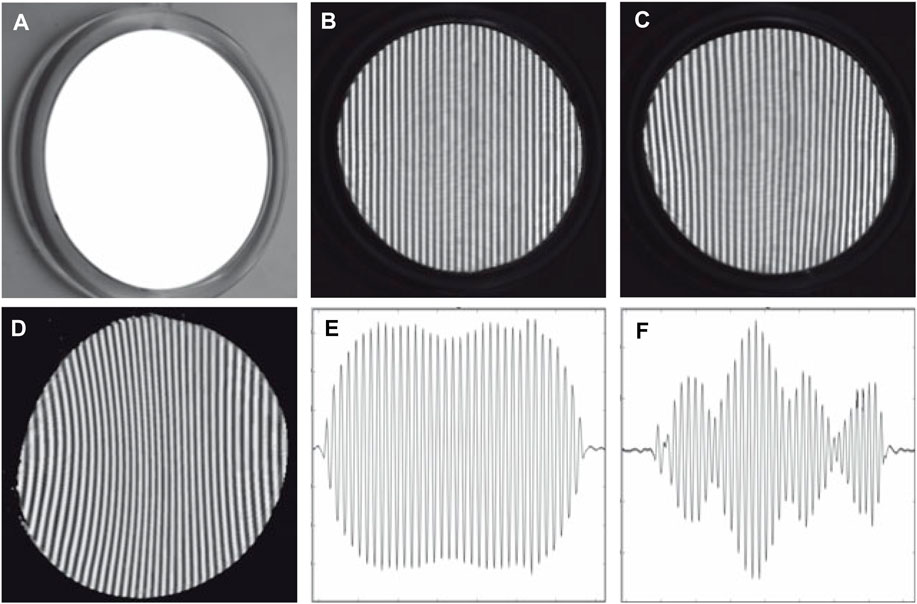
FIGURE 24. Inverse patterns for DM inspection of a magnifying mirror (Werling and Beyerer, 2007): (A) reference object; (B) DM image of intact reference object; (C) DM image of deformed object, here a curved shaving mirror; (D) inverse pattern displayed on screen; (E) evaluation for reference object, vertical projection of (B); (F) evaluation for deformed object, vertical projection of (C).
4.1.6 Handling multiple reflections
Multiple reflections from the same surface, which cannot be avoided for some object geometries, are an unresolved problem so far—unlike multiple reflections from different surfaces, such as two interfaces of a lens or another transparent object. Before the introduction of suitable decoding methods for mixed signals in DM, the obvious approach was to suppress the effects of transparency, either by eliminating the rear-side reflection (Synowicki, 2008) or by using wavelengths for which the specimen is opaque (Sprenger et al., 2010). Known intensity differences between front and rear side reflection can be accounted for by intensity thresholding (Xu et al., 2010; Xu et al., 2012).
As mentioned before, scanning techniques can be suitable to avoid superposition of signals, either as a single line or, if the object is sufficiently uniform, with the densest possible array of bright or (to enable phase measurements) sinusoidally modulated lines (Gühring, 2000; Faber et al., 2009; Wang et al., 2019).
Unless the object is almost flat on both sides, however, it is still difficult to avoid a superposition of reflections. In an interesting analogy to interferometry, where wavelength tuning was used to assess multiple surfaces at once (Okada et al., 1990; Deck, 2001; Burke et al., 2007), it was found that the frequency-variation approach also works in DM. In this case, multiple measurements with varied fringe periods allow one to separate several mixed signals (Faber et al., 2009; Huang and Asundi, 2012; Ye et al., 2021; Leung and Cai, 2022; Ordones et al., 2022; Zheng et al., 2022). Attempts have also been reported to use a model of the optical system’s transfer function for signal separation (Wang, 2018; Tao et al., 2019). We are currently unaware of any efforts to implement the multi-frequency approach by means of any of the multiplexing schemes mentioned above.
Unique encoding can also be achieved by a sequence of stochastic band-limited gray-scale patterns (Pak et al., 2019); in this case, the signals are separated by finding peaks in signal correlations with the coding sequences. Figure 25 shows an example.
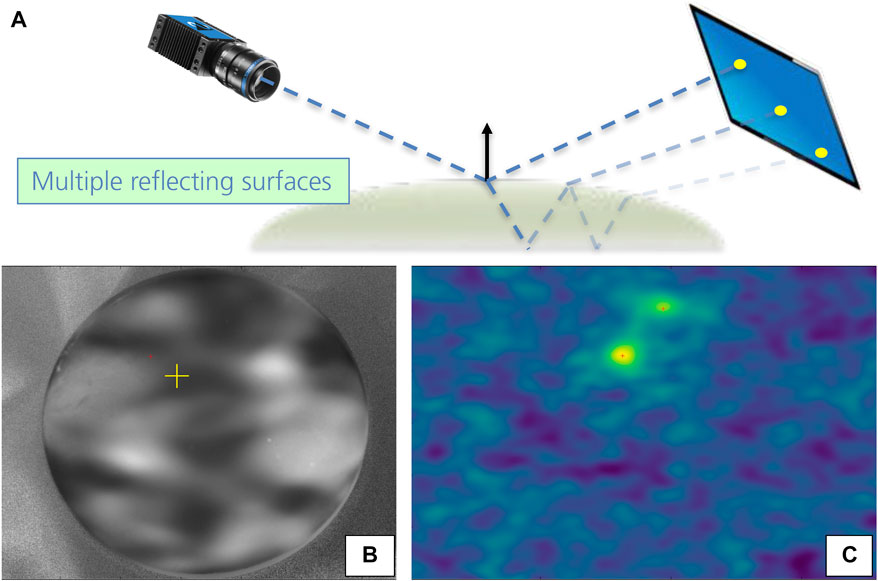
FIGURE 25. Multi-valued deflectometric decoding for a plano-convex lens. (A) Scheme of ray paths during the inspection of the lens. (B) Camera image of a lens reflecting one stochastic pattern of the correlation sequence. The reflections from the front-side and the back-side superimpose; higher-order reflections are suppressed. (C) The 2D map of decoded correlations for a camera pixel indicated by the yellow cross in (B). The scale is from −25 (blue) to +200 (yellow). The coordinates in the map correspond to the coding screen positions; higher correlations denote higher probabilities that the signal originates in the respective screen pixel. The two peaks correspond to the two contributing paths (Pak et al., 2019).
4.1.7 Structured backgrounds for specular flow
A generalization of all previous approaches, in the sense that deflectometry attempts to measure what humans perceive while moving past a specular surface, is the concept of specular flow (see also 1.1.5; here we focus on the encoding requirements relevant for SFSF methods). The properties of SF are quite different from those of diffuse OF (Lellmann et al., 2008; Adato et al., 2011; Dövencioğlu et al., 2017); a number of works investigate how the brain converts moving reflections into depth cues, i.e., how humans determine the shape of a specular object. Some good pictorial statements of the problem can be found in (Fleming et al., 2004; Roth and Black, 2006; Doerschner et al., 2011; Muryy et al., 2013).
When using static backgrounds, there are currently no objective prescribed requirements on sufficient encoding. Quite generally, it is necessary for the background to have enough structure on multiple scales, so that the SF field can be assessed either by a motion of the observer or via a quasi-motion (implemented by several identical imaging systems located in close proximity that observe the same scene) (Wang and Inokuchi, 1993; Oren and Nayar, 1997; Savarese et al., 2004; Vasilyev et al., 2008; Canas et al., 2009b; Pak, 2012; Pak, 2013; Pak, 2016c; Pak, 2017). Reconstructing object curvature and shape accurately then relies chiefly on a sufficiently distant background and/or assumptions/constraints on the smoothness and curvature of a surface. The attractiveness of this approach lies in the access to object shapes (including simple spheres) that can be evaluated only in small patches with backgrounds such as a screen or projector, which cover only a very small solid angle or must be arranged to surround the object on all sides (Balzer et al., 2014).
If the restrictions are accepted, the usual coding screens can be used as moving backgrounds (Tarini et al., 2005; Bonfort et al., 2006; Lellmann et al., 2008; Nehab et al., 2016); the assumptions about a distant background are usually replaced by a careful geometrical calibration in this case, and unique position coding is again possible.
4.1.8 Polarization
It is tempting to try and use the strongly polarized light from LC screens to achieve some form of reflection angle coding via polarization effects; but according to some tests we did in 2013, the resulting polarization changes are very difficult to measure accurately enough to be of use in DM. Still, there is a body of work dedicated to the relationship of surface normals and polarization changes, applied mostly to computer vision (Rahmann and Canterakis, 2001; Rahmann, 2003; Morel et al., 2006; Garcia et al., 2015).
4.2 Measuring roughness
It is known to every practitioner that the fringe contrast is affected not only by the focus setting, but also by the properties of the surface. We have discussed partial specularity above; here we list a few attempts to use the fringe contrast as an indicator for surface roughness. The research started with moiré deflectometry (Glatt et al., 1984), and the trade-off between angular and spatial resolution was noticed very early on (Keren and Kafri, 1985; Keren et al., 1988), leading to the development of an instrument to quantify partial specularity (Keren et al., 1990). There has been much subsequent research on quantifying the surface roughness (particularly with speckle methods) that we cannot list here, so we restrict ourselves to a relatively recent comparison between deflectometry and speckle methods (Abheiden, 2014) and an investigation of deflectometry for small-scale waviness characterization (Ziebarth et al., 2014).
One way to increase the amount of information gathered for this complicated problem is to use the wavelength dependence of scattering, and there have been a couple of attempts in this direction (Shafer, 1985; Abheiden, 2014). When using ordinary LC displays for recording fringe patterns in different colors, the data are typically compromised by the relatively low brightness available in the blue channel. Presently, it does not appear that there are any more efforts underway to use deflectometry for surface roughness characterization.
4.3 Defect detection and classification
In Section 1.1.7 we have already touched on some data-processing techniques to facilitate easier error detection; here we will compile some general guidelines and observations. Depending on the size and nature of defects to be found, the required encoding can be simple grid patterns (Lippincott and Stark, 1982; Rystrom, 1987) (e.g., to detect dents in metal); for a wider range of defect amplitudes and sizes, once again phase-measuring methods or at least sinusoidal patterns are being used for very good sensitivity in absolute, “inverse-fringe” or differential measurements (Werling and Beyerer, 2007; Chan and Yeung, 2008; Li W. et al., 2014; Macher, 2014). A quick comparison of two techniques is shown in Figure 26.
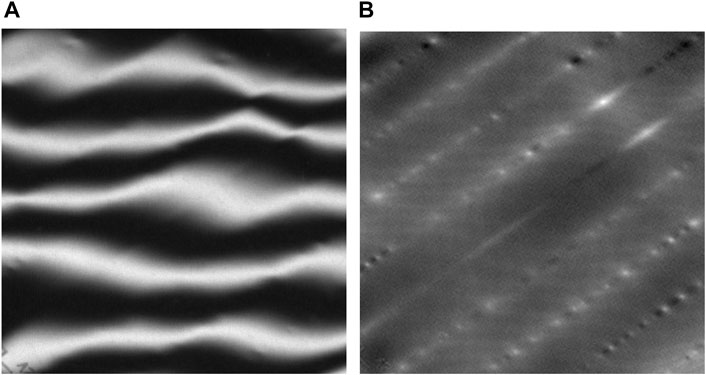
FIGURE 26. Measurements of a wavy surface (image dimensions approx. 46 mm x 46 mm). (A) Distorted-fringe image indicates waviness qualitatively; (B) false-color curvature map from phase-shifting DM reveals much more detail; the estimated waviness is in the 50 μm range.
One difficulty with phase shifting is that defects featuring step-like changes in reflectivity induce artifacts in the measurement data that need to be accounted for to assess defects correctly (Gühring, 2000; Macher et al., 2014; Burke and Zhong, 2017; Wu et al., 2017; Patra et al., 2019; Tao et al., 2019). For such defects, it is sometimes sufficient to observe the fringe modulation only (Petz et al., 2018; Huang et al., 2019). In general, more complex surfaces tend to feature design elements that are hard to delineate against defects, “cross-talk” between measurands can occur, and easy recipes are elusive. Robust error detection has predominantly been demonstrated on simple surfaces under controlled conditions, and is an unsolved problem for the rest of the parameter space. One notable attempt besides classical image processing with steerable filters, etc. explores the use of wavelets for size-sensitive error detection (Rosenboom et al., 2011; Hahn et al., 2013; Le et al., 2013; Greiner et al., 2016; Le et al., 2016). Figure 27 shows a result from one of these efforts.
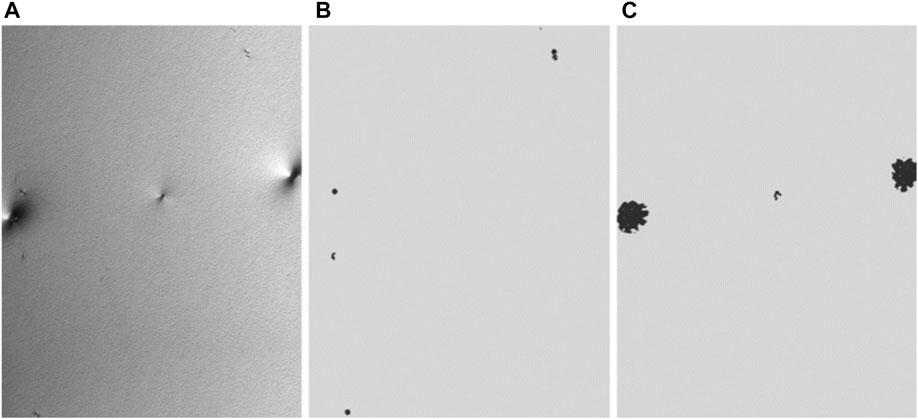
FIGURE 27. Example for detection and classification of surface defects with detection of dents with multi-scale wavelets; lateral extent of samples is approx. 100 mm x 150 mm. (A) One component of surface curvature; (B) automatic detection of dust inclusions; (C) automatic detection of dents. Classifier sizes can be scaled and adapted to the respective lateral resolution (Greiner et al., 2016).
Another attempt to cope with the multitude of intentional structures and features of industrial mass products is to train and apply neural networks for error detection on DM data (Kuosmanen, 2017; Maestro-Watson et al., 2018; Maestro-Watson et al., 2020); first results look promising, but as mentioned above, no evidence exists yet as to the transferability of the results.
5 Concluding assessment and prospects
As we have seen, the variety of specular objects that one can test with DM, along with the wide qualitative and quantitative range of specifications, facilitates an astounding breadth of research activities and system designs. Phase-measuring DM is an extremely versatile technique that offers very good sensitivity at moderate effort. Depending on the application, one may or may not need to perform a full geometrical calibration, registration and reconstruction of the rays and surface normals. We see three main research trends for the future.
For metrological tasks, one needs to bear in mind and use the strengths of deflectometry, which are the ease of application, high dynamic range, and excellent sensitivity in the medium to high spatial frequencies. Measurements of global shape and large and smooth surface features (corresponding to, e.g., lower-order polynomial terms) should be conducted and interpreted with caution; so far no procedure has been demonstrated or accepted in practice that can seriously compete with interferometry (Häusler et al., 2013). The theoretical side of the problem appears solid, but in practice, the noise and calibration uncertainties are still impeding the path to even more accurate surface reconstructions. Still, DM has been successfully used for all but the most demanding metrological specifications. While further progress may still be possible, it remains to be shown that the associated practical efforts are manageable.
In defect detection, the high sensitivity of DM to small-scale features is used to its fullest, providing an excellent measurement technique to match and surpass the human eye. The challenge lies in finding defects in an inspection lasting a few seconds or minutes, where the consumer might take hours to go over each detail. Aesthetic surfaces often have design elements of high curvature and/or contrast, and distinguishing these from unwanted features or contamination is particularly challenging due to the very high sensitivity of DM to small and even unresolved features. The practical demands of DM data processing and the large number of parameters to optimize imply that it may be worthwhile to harness modern machine learning approaches to further improve the accuracy of defect detection.
Although the basics of image formation and processing are well understood, there is no measurement workflow that is optimal for more than one type of work piece. Today the design process is mostly based on customized simulations by experts. Especially for the larger parameter space of multiple camera/screen positions, much work remains to be done in devising and hopefully automating the shortest path to a quick and efficient measurement workflow.
To summarize, in this paper we have made an effort to describe today’s deflectometric universe and to point out the “white spots” and possibilities on its map that we have noticed. Hopefully this will ignite discussions and stimulate further research.
Author contributions
All authors listed have made a substantial, direct, and intellectual contribution to the work and approved it for publication.
Funding
Funding for this effort was provided by our department—many thanks for allowing us to do this thoroughly.
Acknowledgments
We thank all the inspiring and resourceful people in the deflectometric community for pushing the boundaries and sharing the fascination and passion with us; we have made our best attempt to do justice to all known efforts and achievements in this overview. Apologies for not listing our personal friends and acquaintances by name here: the list would be too long—you know who you are. Also, we thank our industrial customers for constantly providing benchmarks for the practical challenges and difficulties. On the technical level that has made this paper possible, we thank the open-source communities, listing (non-exhaustively) Python, OpenCV, Mitsuba, Overleaf, TikZ, orcid.org, and doi.org. Thanks to our colleague Christian Kludt for providing the first fresh pair of eyes, and to the reviewers for their insightful suggestions, particularly the unanimous request for a pictorial map of the area, which we feel is indeed a very useful guide through the many sub-topics discussed.
Conflict of interest
The authors declare that the research was conducted in the absence of any commercial or financial relationships that could be construed as a potential conflict of interest.
Publisher’s note
All claims expressed in this article are solely those of the authors and do not necessarily represent those of their affiliated organizations, or those of the publisher, the editors and the reviewers. Any product that may be evaluated in this article, or claim that may be made by its manufacturer, is not guaranteed or endorsed by the publisher.
This manuscript was transferred from Walter De Gruyter GmbH to Frontiers Media SA. The peer review for this paper was conducted in full by Walter De Gruyter GmbH. In accordance with their peer review, editor names and reviewer names have not been published. For any queries regarding the peer review of this manuscript, please contact YWR2YW5jZWRvcHRpY3MuZWRpdG9yaWFsLm9mZmljZUBmcm9udGllcnNpbi5vcmc=.
Abbreviations
ANN, artificial neural network; CMOS, complementary metal-oxide-semiconductor; DFT, discrete Fourier transform; DM, deflectometry; E-ELT, European Extremely Large Telescope; EMVA, European Machine Vision Association; FP, fringe projection; GPU, graphics processing unit; GU, gloss units; HD, high definition; IPS, in-plane switching; IRDM, infrared deflectometry; LC, liquid crystal; LWIR, long-wave infrared; MTF, modulation transfer function; OF, optical flow; PDE, partial differential equation; QA, quality assurance; RMS, root-mean-square; SF, specular flow; SFS, shape from shading; SFSF, shape from specular flow; SNR, signal-to-noise ratio; UVDM, ultraviolet deflectometry.
Footnotes
1Not to be confused with Fourier decoding mentioned in Section 4.1.4.
2Reichel, S. (2020). F-number (F#) und Beugungsscheibchen, personal communication.
References
Abheiden, M. (2014). “Optische Methoden zur Bestimmung von Oberflächenrauheiten,”. Master thesis (Bremen: Carl von Ossietzky Universität Oldenburg).
Adato, Y., Vasilyev, Y., Ben-Shahar, O., and Zickler, T. (2007). “Toward a theory of shape from specular flow,” in Proceedings of the IEEE Int. Conference on Computer Vision 11, Rio de Janeiro, Brazil, 14-21 October 2007. doi:10.1109/ICCV.2007.4408883
Adato, Y., Vasilyev, Y., Zickler, T., and Ben-Shahar, O. (2010b). Shape from specular flow. IEEE Trans. Pattern Analysis Mach. Intell. 32 (11), 2054–2070. doi:10.1109/tpami.2010.126
Adato, Y., Zickler, T., and Ben-Shahar, O. (2011). “A polar representation of motion and implications for optical flow,” in Conference on Computer Vision and Pattern Recognition, Colorado Springs, CO, USA, 20-25 June 2011, 1145–1152. doi:10.1109/CVPR.2011.5995419
Adato, Y., Zickler, T., and Ben-Shahar, O. (2010a). Toward robust estimation of specular flow. Procedings Br. Mach. Vis. Conf. 2010 11, 22. doi:10.5244/C.24.22
Aftab, M., Graves, L. R., Burge, J. H., Smith, G. A., Oh, C. J., and Kim, D. (2019). Rectangular domain curl polynomial set for optical vector data processing and analysis. Opt. Eng. 58 (09), 1. doi:10.1117/1.oe.58.9.095105
Agrawal, A., Raskar, R., and Chellappa, R. (2006). “What is the range of surface reconstructions from a gradient field?,” in European conference on computer vision (ECCV) 9, vol. 3951 of lecture notes in computer science (LNCS) (Berlin, Heidelberg: Springer), 578–591.
Agrell, E., Lassing, J., Strom, E. G., and Ottosson, T. (2004). On the optimality of the binary reflected gray code. IEEE Trans. Inf. Theory 50 (12), 3170–3182. doi:10.1109/tit.2004.838367
Alinoori, A., Essameldin, M., Fleischmann, F., and Henning, T. (2016). Topography measurement of freeform specular surfaces using experimental ray tracing and radial basis functions. SPIE Proc. 9961, 99610S. doi:10.1117/12.2237665
Allgeier, S., Gengenbach, U., Köhler, B., Reichert, K.-M., and Hagenmeyer, V. (2020). Reproducibility of two calibration procedures for phase-measuring deflectometry. Interferom. XX 11490, 114900G. doi:10.1117/12.2567092
Allgeier, S., Gengenbach, U., Köhler, B., Reichert, K.-M., and Hagenmeyer, V. (2019). “Robust phase unwrapping based on non-coprime fringe pattern periods for deflectometry measurements,” in Proceedings volume 11061 Automated Visual Inspection and Machine Vision III, Munich, Germany, 24-27 JUNE 2019 (SPIE). doi:10.1117/12.2523564
Andersson, A. (2009). Evaluation and visualisation of surface defects on auto-body panels. J. Mater. Process. Technol. 209 (2), 821–837. doi:10.1016/j.jmatprotec.2008.02.078
Andraka, C. E., Sadlon, S., Myer, B., Trapeznikov, K., and Liebner, C. (2009). Rapid reflective facet characterization using fringe reflection techniques. ASME 2009 3International Conf. Energy Sustain. 2, 643–653. doi:10.1115/es2009-90163
Antoine, P., Boussemaere, L., Bouwens, A., Moreau, V., Borguet, B., and Sharshavina, K. (2019). Full-field deflectometry for optical characterization of high-precision mirrors. Opt. Meas. Syst. Industrial Insp. XI 11056, 1105619. doi:10.1117/12.2530380
Aprojanz, S. (2019). “Untersuchung zur Objektivierung der visuellen Beurteilung von Frontscheiben durch deflektometrische Messtechnik,” Phd thesis (Braunschweig: TU Braunschweig).
Armesto, L., Tornero, J., Herráez, Á., and Asensio, J. (2011). “Inspection system based on artificial vision for paint defects detection on cars bodies,” in International Conference on Robotics and Automation, Shanghai, China, 09-13 May 2011, 1–4. doi:10.1109/ICRA.2011.5980570
Arnal, L., Solanes, J. E., Molina, J., and Tornero, J. (2017). Detecting dings and dents on specular car body surfaces based on optical flow. J. Manuf. Syst. 45, 306–321. doi:10.1016/j.jmsy.2017.07.006
Arnoult, A., and Colin, J. (2021). Magnification inferred curvature for real-time curvature monitoring. Sci. Rep. 11 (1), 9393. doi:10.1038/s41598-021-88722-6
Arqueros, F., Jiménez, A., and Valverde, A. (2003). A novel procedure for the optical characterization of solar concentrators. Sol. Energy 75 (2), 135–142. doi:10.1016/j.solener.2003.07.008
Balzer, J., Acevedo-Feliz, D., Soatto, S., Höfer, S., Hadwiger, M., and Beyerer, J. (2014). “Cavlectometry: Towards holistic reconstruction of large mirror objects,” in International Conference 2 on 3D Vision, Tokyo, Japan, 08-11 December 2014, 448–455.
Balzer, J., Höfer, S., and Beyerer, J. (2011). “Multiview specular stereo reconstruction of large mirror surfaces,” in Proceedings of the IEEE Computer Vision and Pattern Recognition Workshops (CVPRW), Colorado Springs, CO, USA, 20-25 June 2011, 2537–2544. doi:10.1109/CVPR.2011.5995346
Balzer, J. (2008). “Regularisierung des Deflektometrieproblems - Grundlagen und Anwendung,” Phd thesis (Karlsruhe: KIT).
Balzer, J. (2011). “Shape from specular reflection in calibrated environments and the integration of spatial normal fields,” in International Conference 18 on Image Processing, Brussels, Belgium, 11-14 September 2011, 21–24. doi:10.1109/ICIP.2011.6116071
Balzer, J., Werling, S. B., and Beyerer, J. (2006). Regularization of the deflectometry problem using shading data. SPIE Proc. 6382, 63820B. doi:10.1117/12.685388
Balzer, J., and Werling, S. B. (2010). Principles of shape from specular reflection. Measurement 43 (10), 1305–1317. doi:10.1016/j.measurement.2010.07.013
Barreto, J. P., Santos, J. M., Menezes, P., and Fonseca, F. (2008). “Ray-based calibration of rigid medical endoscopes,” in Workshop 8 on Omnidirectional Vision, Camera Networks and Non-classical Cameras (OMNIVIS), 1–14.
Bartsch, J., Kalms, M. K., and Bergmann, R. B. (2019). Improving the calibration of phase measuring deflectometry by a polynomial representation of the display shape. J. Eur. Opt. Soc. - Rapid Publ. 15, 20. doi:10.1186/s41476-019-0116-1
Bartsch, J., Nüß, J. R., Prinzler, M. H. U., Kalms, M. K., and Bergmann, R. B. (2018). Effects of non-ideal display properties in phase measuring deflectometry: A model-based investigation. Proc. SPIE Opt. Micro- Nanometrology VII 10678, 1–10. doi:10.1117/12.2306463
Beghuin, D., Dubois, X., and Joannes, L. (2009). Phase object power mapping and cosmetic defects enhancement by fourier-based deflectometry. SPIE Proc. 7389. doi:10.1117/12.827670
Belsher, J. F., Gamiz, V. L., and Roberts, P. H. (1999). “Phase-dependent Poisson noise when estimating fringe phase from patterns of multiple fringes,” in Proceedings Digital Image Recovery and Synthesis IV, Denver, Colorado, 20-21 July 1999 (SPIE), 30–41.
Bergmann, R. B., Burke, J., and Falldorf, C. (2015). Precision optical metrology without lasers. SPIE Proc. 9524, 952403. doi:10.1117/12.2183451
Bergmans, R. H., Nieuwenkamp, H. J., Kok, G. J. P., Blobel, G., Nouira, H., Küng, A., et al. (2015). Comparison of asphere measurements by tactile and optical metrological instruments. Meas. Sci. Technol. 26 (10), 105004. doi:10.1088/0957-0233/26/10/105004
Berry, M. V. (2005). Oriental magic mirrors and the Laplacian image. Eur. J. Phys. 27 (1), 109–118. doi:10.1088/0143-0807/27/1/012
Beyerer, J., and Pérard, D. (1997). Automatische Inspektion spiegelnder Freiformflächen anhand von Rasterreflexionen. Tm. - Tech. Mess. 64 (10), 394–400. doi:10.1524/teme.1997.64.jg.394
Beyerer, J., Puente León, F., and Frese, C. (Editors) (2016). Machine vision - automated visual inspection: Theory, practice and applications: Automated visual inspection: Theory, practice and applications (Heidelberg: Springer-Verlag).
Binkele, T., Dylla-Spears, R., Johnson, M. A., Hilbig, D., Essameldin, M., Henning, T., et al. (2019). “Characterization of gradient index optical components using experimental ray tracing,” in Proceedings of SPIE Photonic Instrumentation Engineering VI, San Francisco, CA, February 2-7, 2019, 109250D.
Binkele, T., Hilbig, D., Essameldin, M., Henning, T., Fleischmann, F., and Lang, W. (2021). Characterization of specular freeform surfaces from reflected ray directions using experimental ray tracing. J. Sensors Sens. Syst. 10 (2), 261–270. doi:10.5194/jsss-10-261-2021
Bitte, F. (2002). “Ein Spiegelmatrix-basiertes optisches 3D-Messsystem für die Mikrostrukturprüfung,” Phd thesis (Aachen: TH Aachen).
Blake, A., and Bülthoff, H. H. (1990). Does the brain know the physics of specular reflection? Nature 343, 165–168. doi:10.1038/343165a0
Blake, A., and Bülthoff, H. H. (1991). Shape from specularities: Computation and psychophysics. Philosophical Trans. R. Soc. Lond. Ser. B, Biol. Sci. 331 (1260), 237–252. doi:10.1098/rstb.1991.0012
Blalock, T., Myer, B., Ferralli, I., Brunelle, M., and Lynch, T. (2017). Metrology for the manufacturing of freeform optics. Optifab 2017, 1044817. doi:10.1117/12.2279819
Blaustein, P., and Hahn, S. (1989). Realtime inspection of wafer surfaces. Solid State Technol. 32 (12), 27–29.
Bon, P., Monneret, S., and Wattellier, B. (2012). Noniterative boundary-artifact-free wavefront reconstruction from its derivatives. Appl. Opt. 51 (23), 5698–5704. doi:10.1364/ao.51.005698
Bonfort, T. (2006). Reconstruction de surfaces réfléchissantes à partir d’images. Phd thesis (Grenoble: Institut National Polytechnique De Grenoble). Available at: https://hal.inria.fr/tel-00083540.
Bonfort, T., Sturm, P. F., and Gargallo, P. (2006). General specular surface triangulation. Comput. Vis. Proc. Asian Conf. 73852, 872–881.
Bothe, T., Gesierich, A., and Schulte, M. (2007). Device for the optical measurement of objects. Patent no: WO2008000630A1.
Bothe, T. (2008). “Grundlegende Untersuchungen zur Formerfassung mit einem neuartigen Prinzip der Streifenprojektion und Realisierung in einer kompakten 3D-Kamera,”. Phd thesis (Bremen: Uni Bremen).
Bothe, T., Li, W., Schulte, M., von Kopylow, C., Bergmann, R. B., and Jüptner, W. P. O. (2010). Vision ray calibration for the quantitative geometric description of general imaging and projection optics in metrology. Appl. Opt. 49 (30), 5851–5860. doi:10.1364/ao.49.005851
Bothe, T., Li, W., von Kopylow, C., and Jüptner, W. P. O. (2004). High-resolution 3d shape measurement on specular surfaces by fringe reflection. Proc. SPIE Int. Soc. Opt. Eng. 5457, 411–422. doi:10.1117/12.545987
Breitbarth, M., Kühmstedt, P., and Notni, G. (2009). Calibration of a combined system with phase measuring deflectometry and fringe projection. SPIE Proc. 7389, 738909. doi:10.1117/12.828130
Budianto, B., and Lun, D. P. K. (2016). Robust fringe projection profilometry via sparse representation. IEEE Trans. Image Process. 25 (4), 1726–1739. doi:10.1109/tip.2016.2530313
Budianto, B., Lun, P. K. D., and Hsung, T.-C. (2014). Marker encoded fringe projection profilometry for efficient 3d model acquisition. Appl. Opt. 53 (31), 7442–7453. doi:10.1364/ao.53.007442
Burge, J. H., Su, P., Butel, G. P., Huang, R., Maldonado, A. V., and Su, T. (2014). Measuring large mirrors using Scots: The software configurable optical test system. Adv. Opt. Mech. Technol. Telesc. Instrum. 9151, 91510Z. doi:10.1117/12.2057726
Burge, J. H. (2010). The use of slope specifications for optical components. Tucson, AZ: University of Arizona.
Burke, J. (2019). Deflectometry. Proc. SPIE Opt. Meas. Syst. Industrial Insp. XI 11056. doi:10.1117/12.2531869
Burke, J., Hibino, K., Hanayama, R., and Oreb, B. F. (2007). Simultaneous measurement of several near-parallel surfaces with wavelength-shifting interferometry and a tunable phase-shifting method. Opt. Lasers Eng. 45 (2), 326–341. doi:10.1016/j.optlaseng.2005.12.009
Burke, J. (2012). How to remove fundamental-frequency phase errors from phase-shifting results. SPIE Proc. Interferom. XVI Tech. Analysis 8493, 84930I. doi:10.1117/12.928687
Burke, J., Li, W., Heimsath, A., Kopylow, C. v., and Bergmann, R. B. (2013). Qualifying parabolic mirrors with deflectometry. J. Eur. Opt. Soc. - Rapid Publ. 8, 13014. doi:10.2971/jeos.2013.13014
Burke, J., and Zhong, L. (2017). Suppression of contrast-related artefacts in phase-measuring structured light techniques. Opt. Meas. Syst. Industrial Insp. X 10329, 103290T. doi:10.1117/12.2269946
Butel, G. P., Smith, G. A., and Burge, J. H. (2014). Binary pattern deflectometry. Appl. Opt. 53 (5), 923–930. doi:10.1364/ao.53.000923
Butel, G. P., Smith, G. A., and Burge, J. H. (2015). Deflectometry using portable devices. Opt. Eng. 54 (2), 025111. doi:10.1117/1.oe.54.2.025111
Butel, G. P., Smith, G. A., and Burge, J. H. (2012). Optimization of dynamic structured illumination for surface slope measurements. SPIE Proc. 8493, 84930S. doi:10.1117/12.928973
Campos-García, M., Aguirre-Aguirre, D., Lechuga-Núñez, J. A., and Peña-Conzuelo, A. (2019). Design of a null-screen for a compact corneal topographer. Model. Aspects Opt. Metrology VII 11057, 110570I. doi:10.1117/12.2526241
Campos-García, M., Bautista-Clemente, F. J., Cruz-Félix, Á. S., Santiago-Alvarado, A., Huerta-Carranza, O., Aguirre-Aguirre, D., et al. (2022). “Improved quantitative testing of a non-symmetric convex surface using a conical null-screen,” in Optical manufacturing and testing XIV (SPIE), 260–267.
Campos-García, M., Cossio-Guerrero, C., Moreno-Oliva, V. I., and Huerta-Carranza, O. (2015b). Surface shape evaluation with a corneal topographer based on a conical null-screen with a novel radial point distribution. Appl. Opt. 54 (17), 5411–5419. doi:10.1364/ao.54.005411
Campos-García, M., Díaz-Uribe, R., and Granados-Agustín, F. (2004). Testing fast aspheric convex surfaces with a linear array of sources. Appl. Opt. 43 (34), 6255–6264. doi:10.1364/ao.43.006255
Campos-García, M., Huerta-Carranza, O., Díaz-Uribe, J. R., and Moreno-Oliva, V. I. (2015a). “Analysis of defects on the slopes on a parabolic trough solar collector with null-screens,” in Optical Systems Design 2015: Optical Fabrication, Testing, and Metrology V, Jena, Germany, 7-10 September 2015, 96281E. doi:10.1117/12.2192136
Campos-García, M., Iván Moreno-Oliva, V., Díaz-Uribe, R., Granados-Agustín, F., and Santiago-Alvarado, A. (2011). Improving fast aspheric convex surface tests with dynamic null screens using lcds. Appl. Opt. 50 (19), 3101. doi:10.1364/ao.50.003101
Canabal, H., and Alonso, J. (2002). Automatic wavefront measurement technique using a computer display and a charge-coupled device camera. Opt. Eng. 41 (4), 822–826. doi:10.1117/1.1459055
Canas, G. D., Vasilyev, Y., Adato, Y., Zickler, T., Gortler, S. J., and Ben-Shahar, O. (2009a). “A linear formulation of shape from specular flow,” in IEEE 12th International Conference on Computer Vision, Kyoto, Japan, 9 September 2009 - 02 October 2009, 191–198. doi:10.1109/ICCV.2009.5459164
Canas, G. D., Vasilyev, Y., Adato, Y., Zickler, T., Gortler, S. J., and Ben-Shahar, O. (2009b). Unique specular shape from two specular flows. tech. rep. Cambridge, MA, USA: Harvard Computer Science Group.
Carmona-Paredes, L., and Díaz-Uribe, J. R. (2007). Geometric analysis of the null screens used for testing convex optical surfaces. Rev. Mex. Física 53 (5), 421.
Carvalho, M. J. F., Veiga, C. L. N., and Albertazzi Gonçalves, A. (2021). Roundness measurement with deflectometry: Principles and first results. Opt. Meas. Syst. Industrial Insp. XII 11782, 246–256. doi:10.1117/12.2593196
Castillo, O. E., Legarda-Sáenz, R., Flores, J. L., and Garcia-Torales, G. (2013). “Measurement of phase objects by the use of color phase-shifting technique,” in Proceedings volume 8867 Infrared Remote Sensing and Instrumentation XXI, San Diego, California, USA, 26–27 August 2013 (SPIE).
Caulier, Y., Nicolini, A., Sequeira, J., and Verdonck, J.-F. (2011). “Free-form specular surface inspection with adapted coded-light,” in proceedings of the IASTED International Conference 12 on Signal Processing, Pattern Recognition and Applications, IASTED International Conference 8 on and Computer Graphics and Imaging.
Caulier, Y., Spinnler, K., Bourennane, S., and Wittenberg, T. (2008). New structured illumination technique for the inspection of high-reflective surfaces: Application for the detection of structural defects without any calibration procedures. EURASIP J. Image Video Process. 2008, 1–14. doi:10.1155/2008/237459
Ceyhan, U. (2013). “Characterization of aspherical lenses by experimental ray tracing,”PhD thesis (Bremen: Jacobs University).
Chambard, J.-P., and Chalvidan, V. (2009). A structured lighting for 3d shape measurement of glass surface. Glass Perform. Days 2009, 917–919.
Chan, F. W. Y., and Yeung, T. W. (2008). Non-destructive evaluation of adhesive bonding using reflective fringe pattern technique. J. Nondestruct. Eval. 27 (4), 105–114. doi:10.1007/s10921-008-0038-0
Chang, C., Zhang, Z., Gao, N., and Meng, Z. (2020). Improved infrared phase measuring deflectometry method for the measurement of discontinuous specular objects. Opt. Lasers Eng. 134, 106194. doi:10.1016/j.optlaseng.2020.106194
Chen, Z., Zhao, W., and Zhang, Q. (2020). Wavefront measurement of membrane diffractive lens using line structured light deflectometry. Proc. SPIE Int. Conf. Optoelectron. Microelectron. Technol. Appl. 11617, 116172W. doi:10.1117/12.2585388
Choi, H., Palisoc, A., Pandde, A. V., Esparza, M., Berkson, J., Takashima, Y., et al. (2021). Mid-to-high frequency characterization of inflatable membrane optics. Astronomical Opt. Des. Manuf. Test Space Ground Syst. III 11820, 303–312. doi:10.1117/12.2594412
Choudhury, D., and Takeda, M. (2002). Frequency-multiplexed profilometric phase coding for three-dimensional object recognition without 2\textpi: Phase ambiguity. Opt. Lett. 27 (16), 1466–1468. doi:10.1364/ol.27.001466
Coniglio, J., Beck, J., Odle, J., Murty, S., Brooks, D. R., and DeGroote Nelson, J. (2022). Force controlled mid-spatial frequency error smoothing using machine learning. Adv. Opt. Mech. Technol. Telesc. Instrum. V 12188, 239–249. doi:10.1117/12.2627969
Coniglio, J., Quattrociocchi, N., Eisner, M., Beagley, S., Beck, J., Brooks, D. R., et al. (2021). Smoothing mid-spatial frequency (msf) errors on freeform optics with an algorithm-based robotic platform utilizing deflectometry input. Optifab 2021, 229–239. doi:10.1117/12.2602729
Cui, H., Liao, W., Dai, N., and Cheng, X. (2012). A flexible phase-shifting method with absolute phase marker retrieval. Measurement 45 (1), 101–108. doi:10.1016/j.measurement.2011.09.014
Dai, G. m. (1996). Modal wave-front reconstruction with zernike polynomials and karhunen–loève functions. J. Opt. Soc. Am. A 13 (6), 1218. doi:10.1364/josaa.13.001218
Davies, A. D., Vann, T., Evans, C. J., and Butkiewicz, M. (2017). Phase measuring deflectometry for determining 5 dof misalignment of segmented mirrors. Appl. Opt. Metrol. II 10373, 103730H–1H–103730H–10. doi:10.1117/12.2276947
Deck, L. L. (2001). Multiple surface phase-shifting interferometry. Opt. Manuf. Test. IV 4451, 424–431. doi:10.1117/12.453640
DelOlmo-Márquez, J., Castillo-Santiago, G., Avendaño-Alejo, M., Moreno, I., Román-Hernández, E., and López-Bautista, M. C. (2021). Ronchi-Hartmann type null screens for testing a plano-freeform surface with a detection plane inside a caustic surface. Opt. Express 29 (15), 23300. doi:10.1364/oe.432007
DeMars, L. A., Ramirez-Andrade, A. H., Porras-Aguilar, R., and Falaggis, K. (2019). Super sensitive phase measurement deflectometry with effective fringe periods beyond the mtf limit. Proc. OSA Opt. Des. Fabr. Free. OFT) 2019, OW4A6. doi:10.1364/OFT.2019.OW4A.6
Díaz-Uribe, R., and Campos-García, M. (2000). Null-screen testing of fast convex aspheric surfaces. Appl. Opt. 39 (16), 2670–2677. doi:10.1364/ao.39.002670
Díaz-Uribe, R., Granados-Agustín, F., and Cornejo-Rodríguez, A. (2009). Classical hartmann test with scanning. Opt. Express 17 (16), 13959–13973. doi:10.1364/oe.17.013959
Díaz-Uribe, R. (2000). Medium-precision null-screen testing of off-axis parabolic mirrors for segmented primary telescope optics: The large millimeter telescope. Appl. Opt. 39 (16), 2790–2804. doi:10.1364/ao.39.002790
Doerschner, K., Fleming, R. W., Yilmaz, O., Schrater, P. R., Hartung, B., and Kersten, D. J. (2011). Visual motion and the perception of surface material. Curr. Biol. 21 (23), 2010–2016. doi:10.1016/j.cub.2011.10.036
Dominguez, M. Z., Armstrong, J., Su, P., Parks, R. E., and Burge, J. H. (2012). Scots: A useful tool for specifying and testing optics in slope space. SPIE Proc. 8493, 84931D. doi:10.1117/12.931112
Dong, Y., Hosseinimakarem, Z., Davies, A. D., and Evans, C. J. (2014). Spurious mid-spatial frequency structure on optical surfaces reconstructed from surface slope measurements. SPIE Proc. 9203, 92030G. doi:10.1117/12.2061247
Dou, J., Wang, D., Yu, Q., Kong, M., Liu, L., Xu, X., et al. (2022). Deep-learning-based deflectometry for freeform surface measurement. Opt. Lett. 47 (1), 78–81. doi:10.1364/ol.447006
Dövencioğlu, D. N., Ben-Shahar, O., Barla, P., and Doerschner, K. (2017). Specular motion and 3d shape estimation. J. Vis. 17 (6), 3. doi:10.1167/17.6.3
Durou, J.-D., Aujol, J.-F., and Courteille, F. (2009). “Integrating the normal field of a surface in the presence of discontinuities,” in Energy Minimization Methods in Computer Vision and Pattern Recognition, Bonn, Germany, August 24-27, 2009, 261–273.
Ehret, G., Spichtinger, J., and Schulz, M. (2021). Status of highly accurate flatness metrology at ptb for optics up to 1.5 meters in diameter. Opt. Metrology Insp. Industrial Appl. VIII 11899, 2021. doi:10.1117/12.2602680
El Ydrissi, M., Ghennioui, H., Bennouna, E. G., and Farid, A. (2019). A review of optical errors and available applications of deflectometry technique in solar thermal power applications. Renew. Sustain. Energy Rev. 116, 109438. doi:10.1016/j.rser.2019.109438
Elster, C. (2000). Exact two-dimensional wave-front reconstruction from lateral shearing interferograms with large shears. Appl. Opt. 39 (29), 5353–5359. doi:10.1364/ao.39.005353
Elster, C., Gerhardt, J., Thomsen-Schmidt, P., Schulz, M., and Weingärtner, I. (2002). Reconstructing surface profiles from curvature measurements. Optik 113 (4), 154–158. doi:10.1078/0030-4026-00138
Elster, C., and Weingärtner, I. (2002). High-accuracy reconstruction of a function f(x) when only df(x)/dx or d2f(x)/dx2 is known at discrete measurement points. Proc. SPIE X-Ray Mirrors, Cryst. Multilayers II 4782, 12–20. doi:10.1117/12.450459
Elster, C., and Weingärtner, I. (1999). Solution to the shearing problem. Appl. Opt. 38 (23), 5024–5031. doi:10.1364/ao.38.005024
EMVA (2021). Standard for characterization and presentation of specification data for image sensors and cameras. EMVA - European Machine Vision Association.
Esparza, M. A., Laverty, K., Chalifoux, B. D., and Kim, D. (2022). Differential phase measuring deflectometry for on-machine metrology of ultrafast laser stress figuring. Opt. Manuf. Test. XIV 12221, 15–23. doi:10.1117/12.2633694
Espinosa, J., Mas, D., Pérez, J., and Illueca, C. (2010). Optical surface reconstruction technique through combination of zonal and modal fitting. J. Biomed. Opt. 15 (2), 1. doi:10.1117/1.3394260
Ettl, S., Kaminski, J., Knauer, M. C., and Häusler, G. (2008). Shape reconstruction from gradient data. Appl. Opt. 47 (12), 2091–2097. doi:10.1364/ao.47.002091
Ettl, S., Kaminski, J., Olesch, E., Strauß, H., and Häusler, G. (2007). Fast and robust 3d shape reconstruction from gradient data. DGaO Proc. 108, P26.
Faber, C., Knauer, M. C., and Häusler, G. (2009). Can deflectometry work in presence of parasitic reflections? DGaO Proc. 110, A10.
Falaggis, K., and Porras-Aguilar, R. (2018). Grey-level coding for structured-light illumination systems. Interferom. XIX 10749, 107490F. doi:10.1117/12.2322050
Falaggis, K., Ramirez-Andrade, A. H., Towers, D. P., Towers, C. E., and Porras-Aguilar, R. (2018). “Multi-wavelength phase unwrapping: A versatile tool for extending the measurement range, breaking the nyquist limit, and encrypting optical communications,” in Proceedings volume 10749 Interferometry XIX, California, USA, 19-23 AUGUST 2018 (SPIE).
Falaggis, K., Towers, D. P., and Towers, C. E. (2014). Algebraic solution for phase unwrapping problems in multiwavelength interferometry. Appl. Opt. 53 (17), 3737–3747. doi:10.1364/ao.53.003737
Falaggis, K., Towers, D. P., and Towers, C. E. (2013). Method of excess fractions with application to absolute distance metrology: Analytical solution. Appl. Opt. 52 (23), 5758–5765. doi:10.1364/ao.52.005758
Falaggis, K., Towers, D. P., and Towers, C. E. (2011). “Unified theory of phase unwrapping approaches in multiwavelength interferometry,” in Proceedings volume 8011 22nd Congress of the International Commission for Optics, Puebla, Mexico, 15-19 AUGUST 2011 (SPIE), 80117H. doi:10.1117/12.902646
Falconi, O. (1964). Maximum sensitivities of optical direction and twist measuring instruments. J. Opt. Soc. Am. 54 (11), 1315–1320. doi:10.1364/josa.54.001315
Fan, L., Wu, Z., Wang, J., Wei, C., Yue, H., and Liu, Y. (2022). Deep learning-based phase measuring deflectometry for single-shot 3d shape measurement and defect detection of specular objects. Opt. Express 30 (15), 26504–26518. doi:10.1364/oe.464452
Fernholz, K. (2013). Quantifying the visibility of surface distortions in class “A” automotive exterior body panels. J. Manuf. Sci. Eng. 135 (1), 011001. doi:10.1115/1.4007984
Fischer, M. (2016). “Deflektometrie in Transmission - ein neues Messverfahren zur Erfassung der Geometrie asphärischer refraktiver Optiken,”. Phd thesis (Braunschweig: TU Braunschweig).
Fischer, M., Petz, M., and Tutsch, R. (2011). “Online phase noise estimation in structured illumination measurement systems,” in International Symposium 10 on Measurement Technology and Intelligent Instruments, 1–8.
Fischer, M., Petz, M., and Tutsch, R. (2012). Vorhersage des Phasenrauschens in optischen Messsystemen mit strukturierter Beleuchtung. teme 79 (10), 451–458. doi:10.1524/teme.2012.0256
Fleming, R. W., Torralba, A., and Adelson, E. H. (2004). Specular reflections and the perception of shape. J. Vis. 4 (9), 10. doi:10.1167/4.9.10
Flores, J. L., Bravo-Medina, B., and Ferrari, J. A. (2013). One-frame two-dimensional deflectometry for phase retrieval by addition of orthogonal fringe patterns. Appl. Opt. 52 (26), 6537–6542. doi:10.1364/ao.52.006537
Flores, J. L., Legarda-Sáenz, R., and García-Torales, G. (2015). Color deflectometry for phase retrieval using phase-shifting methods. Opt. Commun. 334 (0), 298–302. doi:10.1016/j.optcom.2014.08.030
Fontani, D., Francini, F., Jafrancesco, D., Mercatelli, L., and Sansoni, P. (2005). Mirror shape detection by reflection grating moiré method with optical design validation. Opt. Meas. Syst. Industrial Insp. IV 5856, 377–384. doi:10.1063/1.5117629
Fontani, D., Sansoni, P., Francini, F., and Jafrancesco, D. (2022). Optical control for solar mirrors. Opt. Lasers Eng. 150, 106835. doi:10.1016/j.optlaseng.2021.106835
Forster, F., Forster, F., and Angelopoulou, E. (2011). Camera calibration: Active versus passive targets. Opt. Eng. 50 (11), 113601. doi:10.1117/1.3643726
Fortmeier, I., Schachtschneider, R., Ledl, V., Matousek, O., Siepmann, J., Harsch, A., et al. (2020). Round robin comparison study on the form measurement of optical freeform surfaces. J. Eur. Opt. Soc. - Rapid Publ. 16 (1), 2–15. doi:10.1186/s41476-019-0124-1
Fortmeier, I., Stavridis, M., Wiegmann, A., Schulz, M., Osten, W., and Elster, C. (2016). Evaluation of absolute form measurements using a tilted-wave interferometer. Opt. Express 24 (4), 3393–3404. doi:10.1364/oe.24.003393
Foucault, J. B. L. (1858). Description des procédées employés pour reconnaître la configuration des surfaces optiques. CR Acad. Sci. Paris 47 (958), 27.
Foumouo, E., Dewandel, J.-L., Joannes, L., Beghuin, D., Jacques, L., and Antoine, P. (2010). Optical tomography based on phase-shifting schlieren deflectometry. Opt. Sens. Detect. 7726, 77260U. doi:10.1117/12.854063
Frankot, R. T., and Chellappa, R. (1988). A method for enforcing integrability in shape from shading algorithms. IEEE Trans. Pattern Analysis Mach. Intell. 10 (4), 439–451. doi:10.1109/34.3909
Freischlad, K. R., and Koliopoulos, C. L. (1986). Modal estimation of a wavefront from difference measurements using the discrete Fourier transform. J. Opt. Soc. Am. A 3 (11), 1852–1861. doi:10.1364/josaa.3.001852
Freischlad, K. R. (1992). Wave-front integration from difference data. Proc. SPIE Interferom. VI Tech. Analysis 1755, 212–218. doi:10.1117/12.140771
Fried, D. L. (1977). Least-square fitting a wave-front distortion estimate to an array of phase-difference measurements. J. Opt. Soc. Am. 67, 370–375. doi:10.1364/josa.67.000370
Gai, S., and Da, F. (2010). A novel phase-shifting method based on strip marker. Opt. Lasers Eng. 48 (2), 205–211. doi:10.1016/j.optlaseng.2009.03.020
Gao, F., Xu, Y., and Jiang, X. (2022). Near optical coaxial phase measuring deflectometry for measuring structured specular surfaces. Opt. Express 30 (10), 17554–17566. doi:10.1364/oe.457198
Garcia, N. M., de Erausquin, I., Edmiston, C., and Gruev, V. (2015). Surface normal reconstruction using circularly polarized light. Opt. Express 23 (11), 14391–14406. doi:10.1364/oe.23.014391
Gauchan, S., Bartsch, J., and Bergmann, R. B. (2021). Vision threads: A novel approach to generic camera calibration. Automated Vis. Insp. Mach. Vis. IV 11787, 119–127. doi:10.1117/12.2592296
Gayton, G., Isa, M., Su, R., and Leach, R. (2021). “Evaluating and propagating uncertainty in digital fringe projection systems,” in Optical Measurement Systems for Industrial Inspection XII, Kassel, Germany, 26 - 29 June 2023, 302–316. doi:10.1117/12.2592426
Gielinger, S., Bohn, G., Deinzer, F., and Linke, A. (2022). Investigation of an inline inspection method for the examination of cylinder-like specular surfaces using deflectometry. Appl. Sci. 12 (13), 6449. doi:10.3390/app12136449
Glatt, I., Livnat, A., and Kafri, O. (1984). Beam-quality analysis of surface finish by moiré deflectometry. Exp. Mech. 24 (3), 248–251. doi:10.1007/bf02323173
Gockel, T. (2006). “Interaktive 3D Modellerfassung mittels One-Shot-Musterprojektion und schneller Registrierung,”. Phd thesis (Karlsruhe: KIT).
Godard, C., Hedman, P., Li, W., and Brostow, G. J. (2015). “Multi-view reconstruction of highly specular surfaces in uncontrolled environments,” in International Conference on 3D Vision (3DV), Lyon, France, 19-22 October 2015, 19–27. doi:10.1109/3DV.2015.10
González, A., Jacques, L., de Vleeschouwer, C., and Antoine, P. (2013). Compressive optical deflectometric tomography: A constrained total-variation minimization approach. arXiv:1209.0654.
González, A., Jacques, L., Foumouo, E., and Antoine, P. (2011). “Primal-dual tv reconstruction in refractive deflectometry,” in Signal Processing with Adaptive Sparse Structured Representations (SPARS11), Edinburgh, Scotland, UK, June 27-30, 2011.
Graves, K., Nagarajah, R., and Stoddart, P. R. (2007). Analysis of structured highlight stereo imaging for shape measurement of specular objects. Opt. Eng. 46 (8), 083601. doi:10.1117/1.2769607
Graves, L. R., Choi, H., Zhao, W., Oh, C. J., Su, P., Su, T., et al. (2018). Model-free deflectometry for freeform optics measurement using an iterative reconstruction technique. Opt. Lett. 43 (9), 2110–2113. doi:10.1364/ol.43.002110
Graves, L. R., Quach, H., Choi, H., and Kim, D. (2019b). Infinite deflectometry enabling 2π-steradian measurement range. Opt. Express 27 (5), 7602–7615. doi:10.1364/oe.27.007602
Graves, L. R., Quach, H., Koshel, R. J., Oh, C. J., and Kim, D. (2019a). High contrast thermal deflectometry using long-wave infrared time modulated integrating cavity source. Opt. Express 27 (20), 28660–28678. doi:10.1364/oe.27.028660
Greenberg, P. S., Klimek, R. B., and Buchele, D. R. (1995). Quantitative rainbow schlieren deflectometry. Appl. Opt. 34 (19), 3810–3825. doi:10.1364/ao.34.003810
Greiner, T., Le, T.-T., Ziebarth, M., and Heizmann, M. (2016). Multiskalige Oberflächeninspektion mit Wavelets und Deflektometrie. Tm. - Tech. Mess. 83 (11), 617–627. doi:10.1515/teme-2015-0047
Greivenkamp, J. E. (1984). Generalized data reduction for heterodyne interferometry. Opt. Eng. 23 (4), 234350. doi:10.1117/12.7973298
Gronle, M., Lyda, W., Wilke, M., Kohler, C., and Osten, W. (2014). itom: an open source metrology, automation, and data evaluation software. Appl. Opt. 53 (14), 2974–2982. doi:10.1364/ao.53.002974
Grossberg, M. D., and Nayar, S. K. (2005). The raxel imaging model and ray-based calibration. Int. J. Comput. Vis. 61, 119–137. doi:10.1023/b:visi.0000043754.56350.10
Große, M., Schaffer, M., Harendt, B., and Kowarschik, R. M. (2013). Influence of the structured illumination frequency content on the correspondence assignment precision in stereophotogrammetry. SPIE Proc. 8788, 878816. doi:10.1117/12.2020448
Gruen, A., and Huang, T. S. (Editors) (2001). Calibration and orientation of cameras in computer vision (New York, NY: Springer).
Gu, H., Wang, D., Gu, Z., Kong, M., Liu, L., Lei, L., et al. (2021). High-accuracy deflectometric microscope system with a large slope range. Opt. Lett. 46 (9), 2011–2014. doi:10.1364/ol.420447
Gu, Z., Wang, D., Ruan, Y., Kong, M., Xu, X., and Liang, R. (2022). Design and error calibration of an on-axis deflectometric microscope system. Appl. Opt. 61 (10), 2856–2863. doi:10.1364/ao.455760
Guan, C., Hassebrook, L. G., and Lau, D. L. (2003). Composite structured light pattern for three-dimensional video. Opt. Express 11 (5), 406–4017. doi:10.1364/oe.11.000406
Guan, J., Li, J., Yang, X., Chen, X., and Xi, J. (2022). Defect detection method for specular surfaces based on deflectometry and deep learning. Opt. Eng. 61 (06), 061407. doi:10.1117/1.oe.61.6.061407
Gühring, J. (2000). “Dense 3d surface acquisition by structured light using off-the-shelf components,” in Proceedings videometrics and optical methods for 3D shape measurement (SPIE).
Gupta, M., and Nakhate, N. (2018). “A geometric perspective on structured light coding,” in Computer vision - European conference 15, proceedings, lecture notes in computer science (Cham, Switzerland: Springer, Cham), 90–107.
Gushov, V. I., and Solodkin, Y. N. (1991). Automatic processing of fringe patterns in integer interferometers. Opt. Lasers Eng. 14 (4 - 5), 311–324. doi:10.1016/0143-8166(91)90055-x
Guzhov, I. I., Il’inykh, S. P., Kuznetsov, R. A., and Vagizov, A. R. (2013). Solution of the problem of phase ambiguity by integer interferometry. Optoelectron. Instrum. Data Process. 49 (2), 178–183. doi:10.3103/s8756699013020106
Hahn, A., Ziebarth, M., Heizmann, M., and Rieder, A. (2013). “Defect classification on specular surfaces using wavelets,” in Scale space and variational methods in computer vision lecture notes in computer science (LNCS) (Berlin, Germany: Springer), 7893, 501–512.
Hahn, S., Kugimiya, K., Yamashita, M., Blaustein, P. R., and Takahashi, K. (1990). Characterization of mirror-like wafer surfaces using the magic mirror method. J. Cryst. Growth 103 (1), 423–432. doi:10.1016/0022-0248(90)90221-6
Haist, T., and Tiziani, H. J. (2002). Farbkodierte objektangepasste Streifenprojektion für die schnelle 2d-und 3d-Qualitätsprüfung (color-coded object-adapted fringe projection for two- and threedimensional quality control). teme 69 (9), 367. doi:10.1524/teme.2002.69.9.367
Halioua, M., Krishnamurthy, R. S., Liu, H., and Chiang, F.-P. (1983). Projection moire with moving gratings for automated 3-d topography. Appl. Opt. 22 (6), 850–855. doi:10.1364/ao.22.000850
Han, H., Wu, S., and Song, Z. (2019). An accurate calibration means for the phase measuring deflectometry system. Sensors 19 (24), 5377. doi:10.3390/s19245377
Hartmann, J. (1907). “Eine Verbesserung des Foucaultschen Messerschneiden-verfahrens zur Untersuchung von Fernrohrobjektiven,” in Halbband 2, juli-december, sitzungsberichte der Kgl. Preußischen akademie der Wissenschaften (Berlin: Georg Reimer), 935–940.
Häusler, G., Faber, C., Olesch, E., Ettl, S., Lehmann, P. H., Osten, W., et al. (2013). “Deflectometry vs. interferometry,” in Proceedings volume 8788 Optical Measurement Systems for Industrial Inspection VIII, Munich, Germany, 13-16 MAY 2013 (SPIE).
Häusler, G., Horneber, C., and Knauer, M. C. (2001). Physical limits of phase measuring deflectometry. tech. rep. Erlangen: Uni Erlangen.
Häusler, G., Richter, C., Leitz, K.-H., and Knauer, M. C. (2008). Microdeflectometry - a novel tool to acquire three-dimensional microtopography with nanometer height resolution. Opt. Lett. 33 (4), 396–398. doi:10.1364/ol.33.000396
Häusler, G., and Schneider, G. (1988). Testing optics by experimental ray tracing with a lateral effect photodiode. Appl. Opt. 27 (24), 5160–5164. doi:10.1364/ao.27.005160
He, X., Zheng, D., Kemao, Q., and Christopoulos, G. (2019). Quaternary gray-code phase unwrapping for binary fringe projection profilometry. Opt. Lasers Eng. 121, 358–368. doi:10.1016/j.optlaseng.2019.04.009
Heimsath, A., Platzer, W., Bothe, T., and Li, W. (2008). “Characterization of optical components for linear fresnel collectors by fringe reflection method,” in SolarPACES International Symposium 14, Solar Power and Chemical Energy Systems Conference, Las Vegas, NV, March 4-7, 2008.
Heist, S., Dietrich, P., Landmann, M., Kühmstedt, P., Notni, G., and Tünnermann, A. (2018). Gobo projection for 3d measurements at highest frame rates: A performance analysis. Light Sci. Appl. 7 (1), 71. doi:10.1038/s41377-018-0072-3
Heist, S., Kühmstedt, P., Tünnermann, A., and Notni, G. (2015). Theoretical considerations on aperiodic sinusoidal fringes in comparison to phase-shifted sinusoidal fringes for high-speed three-dimensional shape measurement. Appl. Opt. 54 (35), 10541–10551. doi:10.1364/ao.54.010541
Heist, S., Lutzke, P., Schmidt, I., Dietrich, P., Kühmstedt, P., Tünnermann, A., et al. (2016). High-speed three-dimensional shape measurement using gobo projection. Opt. Lasers Eng. 87, 90–96. doi:10.1016/j.optlaseng.2016.02.017
Hernández-Delgado, J., Malacara-Hernández, Z., Malacara-Doblado, D., Vázquez-Dorrío, B., and Malacara-Hernández, D. (2022). Local curvatures and its measurements of an optical surface or a wavefront: A review. Opt. Eng. 61 (05), 050901. doi:10.1117/1.oe.61.5.050901
Hofbauer, E., Rascher, R., Stubenrauch, T., Liebl, J., Maurer, R., Zimmermann, A., et al. (2013). Approach to the measurement of astronomical mirrors with new procedures. SPIE Proc. 8788, 13. doi:10.1117/12.2020414
Höfer, S., and Beyerer, J. (2016). Scannende Infrarotdeflektometrie für die Inspektion diffus spiegelnder Oberflächen. Tm. - Tech. Mess. 83 (6), 374–385. doi:10.1515/teme-2016-0004
Höfer, S., Burke, J., and Heizmann, M. (2016). Infrared deflectometry for the inspection of diffusely specular surfaces. Adv. Opt. Technol. 5 (5), 377–387. doi:10.1515/aot-2016-0051
Höfer, S., Roschani, M., and Werling, S. B. (2013a). Pattern coding strategies for deflectometric measurement systems. Videometrics, Range Imaging, Appl. XII; Automated Vis. Insp. 8791, 87911O. doi:10.1117/12.2022133
Höfer, S. (2017). “Untersuchung diffus spiegelnder Oberflächen mittels Infrarotdeflektometrie,”. PhD thesis (Karlsruhe: Karlsruher Institut für Technologie).
Höfer, S., Werling, S. B., and Beyerer, J. (2010). “Neuartige Strategie zur vollständigen Kalibrierung eines Sensorsystems zur automatischen Sichtprüfung spiegelnder Oberflächen,” in Forum bildverarbeitung (KIT Scientific publishing), 25.
Höfer, S., Werling, S. B., and Beyerer, J. (2013b). Thermal pattern generation for infrared deflectometry. Proc. Sens. 2013 2013, 785–790. doi:10.5162/sensor2013/P5.4
Höfling, R., Aswendt, P., and Neugebauer, R. (2000). Phase reflection - a new solution for the detection of shape defects on car body sheets. Opt. Eng. 39 (1), 175–182. doi:10.1117/1.602349
Hologenix (2020). Defect detection for ultra-flat wafers. Los Angeles, California: hologenix international technologies.
Horbach, J. W., and Dang, T. (2009). 3d reconstruction of specular surfaces using a calibrated projector - camera setup. Mach. Vis. Appl. 21 (3), 331–340. doi:10.1007/s00138-008-0165-8
Horbach, W., and Kammel, S. (2005). Deflectometric inspection of diffuse surfaces in the far-infrared spectrum. Proc. SPIE Mach. Vis. Appl. Industrial Insp. XIII 5679, 108–117. doi:10.1117/12.586612
Horneber, C., Knauer, M. C., and Häusler, G. (2001). Phase measuring deflectometry - a new method to measure reflecting surfaces. tech. rep. Erlangen: Uni Erlangen.
Horneber, C., Knauer, M. C., and Häusler, G. (2002). Reaching the physical limits of phase measuring deflectometry. tech. rep. Erlangen: Uni Erlangen.
Hornung, T., Kiefel, P., Heimsath, A., Schmid, T., Schmidt, T., and Nitz, P. (2014). “Characterization of optics for concentrating photovoltaic and solar thermal applications,” in Optics for Solar Energy, Canberra Australia, 2–5 December 2014.
Hsakou, R. (2006). Curvature: The relevant criterion for class-A surface quality. JEC Compos. Mag. 23 (3), 105–108.
Hu, Y., Chen, Q., Zhang, Y., Feng, S., Tao, T., Li, H., et al. (2018). Dynamic microscopic 3d shape measurement based on marker-embedded Fourier transform profilometry. Appl. Opt. 57 (4), 772–780. doi:10.1364/ao.57.000772
Huang, H.-Q., Fang, X.-Z., and Zhang, W. (2014). Defocusing rectified multi-frequency patterns for high-precision 3d measurement. Meas. Sci. Technol. 25 (3), 035009. doi:10.1088/0957-0233/25/3/035009
Huang, L., and Asundi, A. K. (2013). Framework for gradient integration by combining radial basis functions method and least-squares method. Appl. Opt. 52 (24), 6016–6021. doi:10.1364/ao.52.006016
Huang, L., and Asundi, A. K. (2012). Phase retrieval from reflective fringe patterns of double-sided transparent objects. Meas. Sci. Technol. 23 (8), 085201. doi:10.1088/0957-0233/23/8/085201
Huang, L., Idir, M., Zuo, C., and Asundi, A. K. (2018). Review of phase measuring deflectometry. Opt. Lasers Eng. 107, 247–257. doi:10.1016/j.optlaseng.2018.03.026
Huang, L., Idir, M., Zuo, C., Kaznatcheev, K., Zhou, L., and Asundi, A. K. (2015a). Comparison of two-dimensional integration methods for shape reconstruction from gradient data. Opt. Lasers Eng. 64, 1–11. doi:10.1016/j.optlaseng.2014.07.002
Huang, L., Idir, M., Zuo, C., Kaznatcheev, K., Zhou, L., and Asundi, A. K. (2015b). Shape reconstruction from gradient data in an arbitrarily-shaped aperture by iterative discrete cosine transforms in southwell configuration. Opt. Lasers Eng. 67, 176–181. doi:10.1016/j.optlaseng.2014.11.011
Huang, L., Ng, C. S., and Asundi, A. K. (2011). Dynamic three-dimensional sensing for specular surface with monoscopic fringe reflectometry. Opt. Express 19 (13), 12809–12814. doi:10.1364/oe.19.012809
Huang, L., Wong, J. X., and Asundi, A. K. (2013a). Specular 3d shape measurement with a compact fringe reflection system. SPIE Proc. 8769, 87691K. doi:10.1117/12.2018927
Huang, L., Xue, J., Gao, B., McPherson, C., Beverage, J., and Idir, M. (2016). Modal phase measuring deflectometry. Opt. Express 24 (21), 24649–24664. doi:10.1364/oe.24.024649
Huang, L., Xue, J., Gao, B., Zuo, C., and Idir, M. (2017). Spline based least squares integration for two-dimensional shape or wavefront reconstruction. Opt. Lasers Eng. 91, 221–226. doi:10.1016/j.optlaseng.2016.12.004
Huang, L., Zhang, Q., and Asundi, A. K. (2013b). Camera calibration with active phase target: Improvement on feature detection and optimization. Opt. Lett. 38 (9), 1446–1448. doi:10.1364/ol.38.001446
Huang, R. (2015). “High precision optical surface metrology using deflectometry,”. Phd thesis (Uni Arizona).
Huang, R., Su, P., Burge, J. H., and Idir, M. (2013c). X-ray mirror metrology using Scots/deflectometry. SPIE Proc. 8848, 88480G. doi:10.1117/12.2024500
Huang, Y., Yue, H., Fang, Y., Wang, W., and Liu, Y. (2019). Structured-light modulation analysis technique for contamination and defect detection of specular surfaces and transparent objects. Opt. Express 27 (26), 37721–37735. doi:10.1364/oe.27.037721
Huerta-Carranza, O., Avendaño-Alejo, M., and Díaz-Uribe, R. (2021). Null screens to evaluate the shape of freeform surfaces: Progressive addition lenses. Opt. Express 29 (17), 27921. doi:10.1364/oe.434289
Hügel, C., Kostka, G., Schmitt, P., and Seifert, L. (2016). Device and method for sensing at least one partially specular surface. Patent No: US20160169798A1.
Hung, M. Y. Y., and Shang, H. M. (2003). Nondestructive testing of specularly reflective objects using reflection three-dimensional computer vision technique. Opt. Eng. 42 (5), 1343–1347. doi:10.1117/1.1567264
Ikeuchi, K. (1981). Determining surface orientations of specular surfaces by using the photometric stereo method. IEEE Trans. Pattern Analysis Mach. Intell. PAMI-3 (6), 661–669. doi:10.1109/TPAMI.1981.4767167
Illemann, J., Geckeler, R. D., Weingärtner, I., Schlewitt, C., Grubert, B., and Schnabel, O. (2002). Topography measurement of nanometer synchrotron optics. SPIE Proc. 4782, 29–37. doi:10.1117/12.450982
Jaquet, B., Hane, C., Koser, K., and Pollefeys, M. (2013). “Real-world normal map capture for nearly flat reflective surfaces,” in International Conference on Computer Vision, Sydney, NSW, Australia, 01-08 December 2013, 713–720. doi:10.1109/ICCV.2013.94
Jing, X., Cheng, H., Wen, Y., Gao, K., Wang, H., and Yang, H. (2018). Shape reconstruction based on zero-curl gradient field estimation in a fringe reflection technique. Appl. Opt. 57 (15), 4135–4144. doi:10.1364/ao.57.004135
Joannes, L., Dubois, F., and Legros, J.-C. (2003). Phase-shifting schlieren: High-resolution quantitative schlieren that uses the phase-shifting technique principle. Appl. Opt. 42 (25), 5046. doi:10.1364/ao.42.005046
Juárez-Reyes, S. A., Sosa-Sánchez, C. T., Silva-Ortigoza, G., Cabrera-Rosas, O. d. J., Espíndola-Ramos, E., and Ortega-Vidals, P. (2018). The wire optical test: A thorough analytical study in and out of caustic surface, and advantages of a dynamical adaptation. J. Opt. 20 (3), 035602. doi:10.1088/2040-8986/aaa719
Jüptner, W. P. O., and Bothe, T. (2009). Sub-nanometer resolution for the inspection of reflective surfaces using white light. SPIE Proc. 7405, 740502. doi:10.1117/12.838373
Kafri, O., and Glatt, I. (1985). Moire deflectometry: A ray deflection approach to optical testing. Opt. Eng. 24 (6), 944–960. doi:10.1117/12.7973607
Kafri, O., and Livnat, A. (1981). Reflective surface analysis using moiré deflectometry. Appl. Opt. 20 (18), 3098–3100. doi:10.1364/ao.20.003098
Kafri, O. (1980). Noncoherent method for mapping phase objects. Opt. Lett. 5 (12), 555–557. doi:10.1364/ol.5.000555
Kammel, S. (2004). “Deflektometrische Untersuchung spiegelnd reflektierender Freiformflächen,”. Phd thesis (Karlsruhe: KIT).
Kang, H., Quach, H., Berkson, J., Aftab, M., Smith, G., Choi, H., et al. (2021). Computational vector fiducial for deflectometry system alignment. Opt. Lett. 46 (22), 5571–5574. doi:10.1364/ol.442223
Kannala, J., and Brandt, S. S. (2006). A generic camera model and calibration method for conventional, wide-angle, and fish-eye lenses. IEEE Trans. Pattern Analysis Mach. Intell. 28 (8), 1335–1340. doi:10.1109/tpami.2006.153
Karaçali, B., and Karaçali, B. (2004). Noise reduction in surface reconstruction from a given gradient field. Int. J. Comput. Vis. 60 (1), 25–44. doi:10.1023/b:visi.0000027788.50090.b6
Karaçali, B., and Snyder, W. (2003). Reconstructing discontinuous surfaces from a given gradient field using integrability. Comput. Vis. Image Underst. 92 (1), 78–111. doi:10.1016/s1077-3142(03)00095-x
Karny, Z., and Kafri, O. (1982). Refractive-index measurements by moire deflectometry. Appl. Opt. 21 (18), 3326–3328. doi:10.1364/ao.21.003326
Keren, E., and Kafri, O. (1985). Diffraction effects in moiré deflectometry. J. Opt. Soc. Am. A 2 (2), 111. doi:10.1364/josaa.2.000111
Keren, E., Kreske, K. M., and Livnat, A. (1990). “Measurement of surface quality using a moire deflectometer,” in Proceedings volume 1266 In-Process Optical Measurements and Industrial Methods, The Hague, Netherlands, 12-16 March 1990 (SPIE), 207–214.
Keren, E., Livnat, A., and Kafri, O. (1988). Unified theory for the optical transfer function: Ray-optical approach. J. Opt. Soc. Am. A 5 (8), 1213. doi:10.1364/josaa.5.001213
Kessler, M., and Traue, H. (1997). Kundenklinik Fahrzeugoberfläche (Lack): Psychologische Untersuchungen zur Wahrnehmung von Oberflächenfehlern. tech. rep. Ulm, Germany: Uni Ulm, Abteilung für Medizinische Psychologie.
Kewei, E., Li, D., Yang, L., Guo, G., Li, M., Wang, X., et al. (2017). Novel method for high accuracy figure measurement of optical flat. Opt. Lasers Eng. 88, 162–166. doi:10.1016/j.optlaseng.2016.07.011
Kewei, E., Li, D., Zhang, C., Zhang, T., Li, M., Wang, Q., et al. (2016). Four-step shear method for the absolute measurement of a flat surface based on phase measuring deflectometry. Appl. Opt. 55 (30), 8419–8425. doi:10.1364/AO.55.008419
Kickingereder, R., and Donner, K. (2004). “Stereo vision on specular surfaces,” in Proceedings of International IASTED Conference 4 on Visualization, Imaging, and Image Processing, Marbella, Spain, September 6 – 8, 2004, 335–339.
Kiefel, P., Hornung, T., Nitz, P., and Reinecke, H. (2016). Slope-deviation measurement of fresnel-shaped mold surfaces. Appl. Opt. 55 (8), 2091–2097. doi:10.1364/ao.55.002091
Kiefel, P., and Nitz, P. (2016). Quality control of fresnel lens molds using deflectometry. AIP Conf. Proc. 1766 (1), 050004. doi:10.1063/1.4962086
Kim, D., Smith, G. A., Dubin, M., Lowman, A., Oh, C. j., Quach, H., et al. (2021). Advances in reconfigurable optical design, metrology, characterization, and data analysis. J. Phys. Photonics 3 (2), 022003. doi:10.1088/2515-7647/abde86
Kim, E.-H., Hahn, J., Kim, H., and Lee, B. (2009). Profilometry without phase unwrapping using multi-frequency and four-step phase-shift sinusoidal fringe projection. Opt. Express 17 (10), 7818. doi:10.1364/oe.17.007818
Klass, R. (1980). Correction of local surface irregularities using reflection lines. Computer-Aided Des. 12 (2), 73–77. doi:10.1016/0010-4485(80)90447-9
Klette, R., and Schlüns, K. (1996). Height data from gradient fields. Proc. SPIE Mach. Vis. Appl. Archit. Syst. Integration V 2908, 12. doi:10.1117/12.257265
Kludt, C., and Burke, J. (2018). “Coding strategies for static patterns suitable for uv deflectometry,” in Forum bildverarbeitung (KIT Publisher), 1–12.
Knauer, M. C., Horneber, C., and Häusler, G. (2002). Metric calibration of phase measuring deflectometry. tech. rep. Erlangen: Uni Erlangen.
Knauer, M. C., Kaminski, J., and Häusler, G. (2004). Phase measuring deflectometry: A new approach to measure specular free-form surfaces. Proc. SPIE Opt. Metrology Prod. Eng. 5457, 366–376. doi:10.1117/12.545704
Knauer, M. C., Richter, C., and Häusler, G. (2008). Measuring the refractive power with deflectometry in transmission. DGaO Proc. 109, A24. doi:10.3807/KJOP.2014.25.6.326
Kolhe, P. S., and Agrawal, A. K. (2009). Abel inversion of deflectometric data: Comparison of accuracy and noise propagation of existing techniques. Appl. Opt. 48 (20), 3894–3902. doi:10.1364/ao.48.003894
Komander, B., Lorenz, D. A., and Vestweber, L. (2019). Denoising of image gradients and total generalized variation denoising. J. Math. Imaging Vis. 61 (1), 21–39. doi:10.1007/s10851-018-0819-8
Krasinski, J., Heller, D. F., and Kafri, O. (1985). Phase object microscopy using moire deflectometry. Appl. Opt. 24 (18), 3032. doi:10.1364/ao.24.003032
Kugimiya, K. (1988). Characterization of polished mirror surfaces by the ’makyoh’ principle. Mater. Lett. 7 (5), 229–233. doi:10.1016/0167-577x(88)90017-1
Kühmstedt, P., Munckelt, C., Heinze, M., Bräuer-Burchardt, C., and Notni, G. (2007). 3d shape measurement with phase correlation based fringe projection. SPIE Proc. 6616, 66160B. doi:10.1117/12.726119
Kuosmanen, P. M. (2017). Data mining on deflectometric data of surface defects. Msc thesis (Tampere, FI: TU Tampere).
Kutulakos, K. N., and Steger, E. (2007). A theory of refractive and specular 3d shape by light-path triangulation. Int. J. Comput. Vis. 76 (1), 13–29. doi:10.1007/s11263-007-0049-9
Lammert, H., Noll, T., Schlegel, T., Siewert, F., and Zeschke, T. (2004). Xuv-Optik, messung mit der Nano-Optik-Messmaschine - nom - bei BESSY. DGaO Proc. 105, A11.
Landmann, M., Heist, S., Dietrich, P., Speck, H., Kühmstedt, P., Tünnermann, A., et al. (2020). 3d shape measurement of objects with uncooperative surface by projection of aperiodic thermal patterns in simulation and experiment. Opt. Eng. 59 (09), 094107. doi:10.1117/1.oe.59.9.094107
Landmann, M., Speck, H., Dietrich, P., Heist, S., Kühmstedt, P., Tünnermann, A., et al. (2021). High-resolution sequential thermal fringe projection technique for fast and accurate 3d shape measurement of transparent objects. Appl. Opt. 60 (8), 2362–2371. doi:10.1364/ao.419492
Le, T.-T., Ziebarth, M., Greiner, T., and Heizmann, M. (2013). “Inspection of specular surfaces using optimized m-channel wavelets,” in 2013 IEEE International Conference on Acoustics, Speech and Signal Processing, Vancouver, BC, Canada, 26-31 May 2013, 2405–2409.
Le, T.-T., Ziebarth, M., Greiner, T., and Heizmann, M. (2016). “Systematic design of object shape matched wavelet filter banks for defect detection,” in 2016 39th International Conference on Telecommunications and Signal Processing (TSP), Vienna, Austria, 27-29 June 2016. doi:10.1109/TSP.2016.7760923
Legarda-Sáenz, R., Rivera, M., Rodríguez-Vera, R., and Trujillo-Schiaffino, G. (2000). Robust wave-front estimation from multiple directional derivatives. Opt. Lett. 25 (15), 1089–1091. doi:10.1364/ol.25.001089
Legarda-Sáenz, R. (2007). Robust wavefront reconstruction using multiple directional derivatives and computer monitor. SPIE Proc. 6422, 64220W. doi:10.1117/12.742643
Lellmann, J., Balzer, J., Rieder, A., and Beyerer, J. (2008). Shape from specular reflection and optical flow. Int. J. Comput. Vis. 80 (2), 226–241. doi:10.1007/s11263-007-0123-3
L’Esperance, D., and Buckner, B. D. (2017). Focusing schlieren systems using digitally projected grids. Appl. Opt. Metrol. II 10373, 103730R. doi:10.1117/12.2274079
Leung, Y.-C., and Cai, L. (2020). 3d reconstruction of specular surface by combined binocular vision and zonal wavefront reconstruction. Appl. Opt. 59 (28), 8526–8539. doi:10.1364/ao.397376
Leung, Y.-C., and Cai, L. (2022). Untangling parasitic reflection in phase measuring deflectometry by multi-frequency phase-shifting. Appl. Opt. 61 (1), 208–222. doi:10.1364/ao.443274
Li, C., Li, Y., Xiao, Y., Zhang, X., and Tu, D. (2018a). Phase measurement deflectometry with refraction model and its calibration. Opt. Express 26 (26), 33510–33522. doi:10.1364/oe.26.033510
Li, C., Zhang, X., and Tu, D. (2018b). Posed relationship calibration with parallel mirror reflection for stereo deflectometry. Opt. Eng. 57 (03), 1. doi:10.1117/1.oe.57.3.034103
Li, J.-L., Su, H.-J., and Su, X. (1997). Two-frequency grating used in phase-measuring profilometry. Appl. Opt. 36 (1), 277–280. doi:10.1364/ao.36.000277
Li, L., Zhao, W., Wu, F., and Liu, Y. (2014a). Flat mirror tilt and piston measurement based on structured light reflection. Opt. Express 22 (22), 27707–27716. doi:10.1364/oe.22.027707
Li, M., Li, D., Jin, C., Kewei, E., Yuan, X., Xiong, Z., et al. (2017). Improved zonal integration method for high accurate surface reconstruction in quantitative deflectometry. Appl. Opt. 56 (13), F144–F151. doi:10.1364/ao.56.00f144
Li, W., Bothe, T., Osten, W., and Kalms, M. K. (2004b). Object adapted pattern projection - part i: Generation of inverse patterns. Opt. Lasers Eng. 41 (1), 31–50. doi:10.1016/s0143-8166(02)00116-1
Li, W., Bothe, T., von Kopylow, C., and Jüptner, W. P. O. (2004a). Evaluation methods for gradient measurement techniques. Opt. Metrology Prod. Eng. 5457, 300–311. doi:10.1117/12.546002
Li, W., Burke, J., Gesierich, A., and von Kopylow, C. (2012b). “Simulation study of deflectometry systems,” in EOS Annual Meeting, Scotland, UK, 25-27 September 2012.
Li, W., and Burke, J. (2014). Simulation of deformation measurements with deflectometry. DGaO Proc. B27.
Li, W., Huke, P., Burke, J., von Kopylow, C., and Bergmann, R. B. (2014b). Measuring deformations with deflectometry. SPIE Proc. 9203, 92030F. doi:10.1117/12.2063446
Li, W., Sandner, M. P., Gesierich, A., and Burke, J. (2012a). Absolute optical surface measurement with deflectometry. SPIE Proc. 8494, 84940G. doi:10.1117/12.928690
Li, X., Xia, X.-G., Wang, W., and Wang, W. (2016). A robust generalized Chinese remainder theorem for two integers. IEEE Trans. Inf. Theory 62 (12), 7491–7504. doi:10.1109/tit.2016.2614322
Li, Z., Liu, X., Chang, C., Shi, Y., Gao, N., Meng, Z., et al. (2021). Clear imaging specular surface and fringe patterns by using a concave mirror in phase measuring deflectometry. Opt. Metrology Insp. Industrial Appl. VIII 11899, 25–33. doi:10.1117/12.2600851
Li, Z., Yin, D., Zhang, Q., and Gong, H. (2022). Monoscopic phase measuring deflectometry simulation and verification. Electronics 11 (10), 1634. doi:10.3390/electronics11101634
Liang, H., Olesch, E., Yang, Z., and Häusler, G. (2016). Single-shot phase-measuring deflectometry for cornea measurement. Adv. Opt. Technol. 5 (5-6), 433–438. doi:10.1515/aot-2016-0049
Liang, H., Sauer, T., and Faber, C. (2020). “Using wavelet transform to evaluate single-shot phase measuring deflectometry data,” in Applications of Digital Image Processing XLIII, 24 AUGUST - 4 SEPTEMBER 2020, 115101S.
Liang, H., Zimmermann, A., Kickingereder, R., and Faber, C. (2019). A new method for solving the height problem in deflectometry. Appl. Opt. Metrol. III 11102, 111020P. doi:10.1117/12.2527747
Ligtenberg, F. K. (1952). Over een methode, om door een eenvoudig experiment de momenten in stijve platen te bepalen. De Ing. 64 (9), 42–46.
Lippincott, H. W., and Stark, H. (1982). Optical-digital detection of dents and scratches on specular metal surfaces. Appl. Opt. 21 (16), 2875–2881. doi:10.1364/ao.21.002875
Liu, C., Gao, N., Meng, Z., Zhang, Z., Gao, F., and Jiang, X. (2022). B-spline surface based 3d reconstruction method for deflectometry. Opt. Express 30 (15), 28207–28219. doi:10.1364/oe.466069
Liu, C., Zhang, Z., Gao, N., and Meng, Z. (2021). Large-curvature specular surface phase measuring deflectometry with a curved screen. Opt. Express 29 (26), 43327–43341. doi:10.1364/oe.447222
Liu, K., Wang, Y., Lau, D. L., Hao, Q., and Hassebrook, L. G. (2010). Dual-frequency pattern scheme for high-speed 3-d shape measurement. Opt. Express 18 (5), 5229–5244. doi:10.1364/oe.18.005229
Liu, M., Hartley, R. I., and Salzmann, M. (2015). Mirror surface reconstruction from a single image. IEEE Trans. Pattern Analysis Mach. Intell. 37 (4), 760–773. doi:10.1109/tpami.2014.2353622
Liu, X., Zhang, Z., Gao, N., and Meng, Z. (2020). 3d shape measurement of diffused/specular surface by combining fringe projection and direct phase measuring deflectometry. Opt. Express 28 (19), 27561–27574. doi:10.1364/oe.402432
Liu, Y., Lehtonen, P., and Su, X. (2012). High-accuracy measurement for small scale specular objects based on pmd with illuminated film. Opt. Laser Technol. 44 (2), 459–462. doi:10.1016/j.optlastec.2011.08.012
Liu, Y., Olesch, E., Yang, Z., and Häusler, G. (2014). Fast and accurate deflectometry with crossed fringes. Adv. Opt. Technol. 3, 441–445. doi:10.1515/aot-2014-0032
Liu, Y., Su, X., and Zhang, Q. (2009). “Study on bi-color phase measurement deflectometry,” in Proceedings of 4th International Symposium on Advanced Optical Manufacturing and Testing Technologies (AOMATT), Chengdu, China, 19-21 NOVEMBER 2008 (SPIE). doi:10.1117/12.828819
Lobachev, O., Schmidt, M., and Guthe, M. (2013). Optimizing multiple camera positions for the deflectometric measurement of multiple varying targets. J. WSCG 21 (2), 145–152.
Lowitzsch, S., Kaminski, J., Knauer, M. C., and Häusler, G. (2005). “Vision and modeling of specular surfaces,” in Vision, Modeling and Visualization, Erlangen, Germany, November 16-18, 2005, 479–486.
Lowman, A. E., Yoo, H., Smith, G. A., Oh, C. J., and Dubin, M. (2018). Improvements in the scanning long-wave optical test system. Opt. Manuf. Test. XII 48. doi:10.1117/12.2321265
Lu, S.-H., and Hua, H. (2016). Structured illumination assisted microdeflectometry with optical depth scanning capability. Opt. Lett. 41 (17), 4114–4117. doi:10.1364/ol.41.004114
Luber, A. (2010). “A unified calibration approach for generic cameras,” in International Archives of Photogrammetry, Remote Sensing and Spatial Information Sciences (IAPRS) Commission V Symposium, Newcastle upon Tyne, UK, 21.-24. June 2010, 399–404.
Luo, P., Li, D., Wang, R., Zhang, X., Li, X., and Zhao, W. (2020). Phase-extraction algorithm for a single-shot spatial-carrier orthogonal fringe pattern with least squares method. Opt. Eng. 59 (02), 1. doi:10.1117/1.oe.59.2.024103
Lutzke, P., Schaffer, M., Kühmstedt, P., Kowarschik, R. M., and Notni, G. (2013). Experimental comparison of phase-shifting fringe projection and statistical pattern projection for active triangulation systems. SPIE Proc. 8788, 878813. doi:10.1117/12.2020910
Ma, M. C., Chen, X. C., and Wang, K. Y. (2014). Camera calibration by using fringe patterns and 2d phase-difference pulse detection. Optik 125 (2), 671–674. doi:10.1016/j.ijleo.2013.07.055
Ma, S., Lu, G., Dai, F., Zeng, C., and Shen, H. (2018). “Spatial color-encoded phase-shifting technique for phase measuring deflectometry,” in Proceedings Volume 10827 6th International Conference on Optical and Photonic Engineering, Shanghai, China, 8-11 MAY 2018 (SPIE). doi:10.1117/12.2500564#
Ma, S., Quan, C., Zhu, R., and Tay, C. J. (2012). Investigation of phase error correction for digital sinusoidal phase-shifting fringe projection profilometry. Opt. Lasers Eng. 50 (8), 1107–1118. doi:10.1016/j.optlaseng.2012.01.021
Ma, T., Fan, X., Li, C., Li, Y., Liu, S., and Chen, H. (2022). A deep learning-based approach to solve the height-slope ambiguity in phase measuring deflectometry. SSRN Electron. J. doi:10.2139/ssrn.4282757
Macher, J., Gruber, D. P., Altenbuchner, T., Pacher, G. A., Berger, G. R., and Friesenbichler, W. (2014). A novel sink mark model for high gloss injection molded parts – correlation of deflectometric and topographic measurements. Polym. Test. 39, 12–19. doi:10.1016/j.polymertesting.2014.07.001
Macher, J. (2014). “Sink mark detection on highly reflective plastics surfaces,”. Phd thesis (Leoben: Uni Leoben).
Maestro-Watson, D., Balzategui, J., Eciolaza, L., and Arana-Arexolaleiba, N. (2018). “Deep learning for deflectometric inspection of specular surfaces,” in International joint conference SOCO’18-cisis’18-iceute’18 advances in intelligent systems and computing (Cham, Switzerland: springer cham), 27, 280–290.
Maestro-Watson, D., Balzategui, J., Eciolaza, L., and Arana-Arexolaleiba, N. (2020). Deflectometric data segmentation for surface inspection: A fully convolutional neural network approach. J. Electron. Imaging 29 (04), 1. doi:10.1117/1.jei.29.4.041007
Maestro-Watson, D., Izaguirre, A., and Arana-Arexolaleiba, N. (2017). “Lcd screen calibration for deflectometric systems considering a single layer refraction model,” in IEEE International Workshop of Electronics, Control, Measurement, Signals and their Application to Mechatronics, Donostia, Spain, 24-26 May 2017, 1–6. doi:10.1109/ECMSM.2017.7945890
Mai, M. (2007). “Schnelle Oberflächenprüfung durch Applikation inverser Muster,”. Diploma thesis (Karlsruhe: Uni Karlsruhe).
Malacara-Hernández, D. (Editor) (2006). Optical shop testing (Hoboken, NJ, US: John Wiley & Sons, Inc).
Malacara-Hernández, D., and Malacara-Doblado, D. (2015). What is a Hartmann test? Appl. Opt. 54 (9), 2296–2301. doi:10.1364/ao.54.002296
Marguerre, H. (1985). Ein neues inkohärentes Schlierenverfahren mit Retroreflektor. Optik 71 (3), 105–112.
Massig, J. H. (2001). Deformation measurement on specular surfaces by simple means. Opt. Eng. 40 (10), 2315–2318. doi:10.1117/1.1403453
Massig, J. H., Lingelbach, E., and Lingelbach, B. (2005). Videokeratoscope for accurate and detailed measurement of the cornea surface. Appl. Opt. 44 (12), 2281–2287. doi:10.1364/ao.44.002281
Massig, J. H. (1999). Measurement of phase objects by simple means. Appl. Opt. 38 (19), 4103–4105. doi:10.1364/ao.38.004103
McGillem, C. D., and Thurman, L. A. (1974). Reconstruction of target reflecting surface using differential geometry. IEEE Trans. Aerosp. Electron. Syst. AES-10 (6), 887–891. doi:10.1109/TAES.1974.307902
Meguenani, A., Chambard, J.-P., Maillot, Y., and Cudel, C. (2019). “Deflectometry based inline inspection of linearly moving plastic parts,” in Proceedings of SPIE Quality Control by Artificial Vision, International Conference 14, Mulhouse, France, 15-17 May 2019, 111720V. doi:10.1117/12.2521721
Meguenani, A., Tout, K., Kohler, S., Bazeille, S., Chambard, J.-P., and Cudel, C. (2021). Deflectometry based on light-field imaging. Proc. SPIE Int. Conf. 15 Qual. Control by Artif. Vis. 11794, 49–56. doi:10.1117/12.2588988
Mériaudeau, F. (2012). Review and comparison of non-conventional imaging systems for three-dimensional digitization of transparent objects. J. Electron. Imaging 21 (2), 021105. doi:10.1117/1.jei.21.2.021105
Mochi, I., and Goldberg, K. A. (2015). Modal wavefront reconstruction from its gradient. Appl. Opt. 54 (12), 3780. doi:10.1364/ao.54.003780
Molina, J., Solanes, J. E., Arnal, L., and Tornero, J. (2017). On the detection of defects on specular car body surfaces. Robotics Computer-Integrated Manuf. 48, 263–278. doi:10.1016/j.rcim.2017.04.009
Morel, O., Stolz, C., Mériaudeau, F., and Gorria, P. (2006). Active lighting applied to three-dimensional reconstruction of specular metallic surfaces by polarization imaging. Appl. Opt. 45 (17), 4062–4068. doi:10.1364/ao.45.004062
Moreno, A., Campos, J., and Yaroslavsky, L. P. (2005). Frequency response of five integration methods to obtain the profile from its slope. Opt. Eng. 44, 033604. doi:10.1117/1.1872896
Moreno, A., Espínola, M., Martínez, J., and Campos, J. (2013). Methods to obtain the waveform profile from slope measurements. SPIE Proc. 8788, 87881F. doi:10.1117/12.2020534
Moreno-Oliva, V. I., Campos-García, M., Bolado-Gómez, R., and Díaz-Uribe, R. (2008). Point shifting in the optical testing of fast aspheric concave surfaces by a cylindrical screen. Appl. Opt. 47 (5), 644–651. doi:10.1364/ao.47.000644
Muryy, A., Welchman, A., Blake, A., and Fleming, R. W. (2013). Specular reflections and the estimation of shape from binocular disparity. Proc. Natl. Acad. Sci. 110 (6), 2413–2418. doi:10.1073/pnas.1212417110
Na, S., Yu, Y., and Shin, S. (2016). Three-dimensional measurements by using deflectometry and the double hilbert transform. J. Korean Phys. Soc. 69 (3), 286–290. doi:10.3938/jkps.69.286
Nehab, D., Weyrich, T., and Rusinkiewicz, S. (2016). “Dense 3d reconstruction from specularity consistency,” in IEEE Conference on Computer Vision and Pattern Recognition, (CVPR), Las Vegas, NV, USA, 27-30 June 2016, 1–8.
Nguyen, M. T., Ghim, Y.-S., and Rhee, H.-G. (2021). One-shot deflectometry for high-speed inline inspection of specular quasi-plane surfaces. Opt. Lasers Eng. 147, 106728. doi:10.1016/j.optlaseng.2021.106728
Nguyen, M. T., Ghim, Y.-S., and Rhee, H.-G. (2019). Single-shot deflectometry for dynamic 3d surface profile measurement by modified spatial-carrier frequency phase-shifting method. Sci. Rep. 9 (1), 3157–3215. doi:10.1038/s41598-019-39514-6
Nimier-David, M., Vicini, D., Zeltner, T., and Jakob, W. (2019). Mitsuba 2. ACM Trans. Graph. 38 (6), 1–17. doi:10.1145/3355089.3356498
Niu, Z., Gao, N., Zhang, Z., Gao, F., and Jiang, X. (2018). 3d shape measurement of discontinuous specular objects based on advanced pmd with bi-telecentric lens. Opt. Express 26 (2), 1615–1632. doi:10.1364/oe.26.001615
Niu, Z., Wang, J., Tian, Y., Wu, Z., Wei, C., and Shao, J. (2022). Wavefront-coded phase measuring deflectometry for the all-focused measurement. Opt. Lett. 47 (18), 4770–4773. doi:10.1364/ol.470949
Niu, Z., Zhang, X., Ye, J., Ye, L., Zhu, R., and Jiang, X. (2021). Adaptive phase correction for phase measuring deflectometry based on light field modulation. IEEE Trans. Instrum. Meas. 70, 1–10. doi:10.1109/tim.2021.3067954
Niu, Z., Zhang, X., Ye, J., Zhu, Y., Xu, M., and Jiang, X. (2020). Flexible one-shot geometric calibration for off-axis deflectometry. Appl. Opt. 59 (13), 3819–3824. doi:10.1364/ao.388143
Oh, C. J., Lowman, A. E., Smith, G. A., Su, P., Huang, R., Su, T., et al. (2016). Fabrication and testing of 4.2m off-axis aspheric primary mirror of Daniel K. Inouye solar telescope. SPIE Proc. 9912, 99120O. doi:10.1117/12.2229324
Okada, K., Sakuta, H., Ose, T., and Tsujiuchi, J. (1990). Separate measurements of surface shapes and refractive index inhomogeneity of an optical element using tunable-source phase shifting interferometry. Appl. Opt. 29 (22), 3280–3285. doi:10.1364/ao.29.003280
Olesch, E. (2007). “3D-Oberflächenrekonstruktion aus gemessenen Neigungsdaten mittels B-Splines,”. Diploma thesis (Erlangen: Uni Erlangen).
Olesch, E., Faber, C., and Häusler, G. (2011). Deflectometric self-calibration for arbitrary specular surfaces. DGaO Proc. 112, A3.
Olesch, E., Faber, C., Seraphim, M. C., and Häusler, G. (2010). Neue gesamtheitliche selbstkalibrierung für deflektometrische sensoren. DGaO Proc. 111, P33.
Olesch, E., Häusler, G., Wörnlein, A., Stinzing, F., and van Eldik, C. (2014). Deflectometric measurement of large mirrors. Adv. Opt. Technol. 3 (3), 335–343. doi:10.1515/aot-2014-0023
Ordones, S., Park, J.-H., Quach, H., Kim, D., and Choi, H. (2022). Spatial–temporal phase demodulation decoding superimposed ghost reflections in optical testing. Opt. Lett. 47 (16), 4135. doi:10.1364/ol.468063
Oren, M., and Nayar, S. K. (1997). A theory of specular surface geometry. Int. J. Comput. Vis. 24 (2), 105–124. doi:10.1023/a:1007954719939
Osten, W., Nadeborn, W., and Andrä, P. (1996). “General hierarchical approach in absolute phase measurement,” in Proceedings of Laser Interferometry VIII Techniques and Analysis, Denver, CO, US, 4-9 AUGUST 1996 (SPIE), 2–13. doi:10.1117/12.276292
Pak, A. (2013). “Local shape from specular flow,” in Joint 2012 workshop of Fraunhofer IOSB and Institute for anthropomatics, vision and fusion laboratory (Karlsruher Schriften zur Anthropomatik), 53–59.
Pak, A. (2017). Measuring shape of a mirror with a moving camera. Proc. SPIE Model. Aspects Opt. Metrology VI 10330, 103300O. doi:10.1063/5.0103130
Pak, A. (2012). “Recovering shapes of specular objects in motion via normal vector map consistency,” in Proceedings volume 8493 Interferometry XVI Techniques and Analysis, San Diego, California, US, 12-16 August 2012 (SPIE), 8493OT. doi:10.1117/12.954564
Pak, A. (2016a). “Specular flow and weingarten map,” in Joint 2015 Workshop of Fraunhofer IOSB and Institute for Anthropomatics, Vision and Fusion Laboratory of Karlsruher Schriften zur Anthropomatik (KIT Scientific Publishing), 167–176.
Pak, A. (2014). Stability of absolute depth reconstruction from deflectometric measurement data. SPIE Proc. 9203, 92030E. doi:10.1117/12.2061647
Pak, A. (2016b). The concept and implementation of smooth generic camera calibration. SPIE Proc. 9960, 99600I. doi:10.1117/12.2237589
Pak, A. (2016c). The concept of smooth generic camera calibration for optical metrology. Tm. - Tech. Mess. 83 (1), 25–35. doi:10.1515/teme-2015-0097
Pant, K. K., Burada, D. R., Bichra, M., Ghosh, A., Khan, G. S., Sinzinger, S., et al. (2018). Weighted spline based integration for reconstruction of freeform wavefront. Appl. Opt. 57 (5), 1100–1109. doi:10.1364/ao.57.001100
Parks, R. E., Su, P., Zobrist, T., Su, T., Park, W. H., Dominguez, M. Z., et al. (2011). “Slope measuring metrology for precision free-form surfaces,” in Spring Topical Meeting, Proceedings of the ASPE, Charlotte, NC, US, 6-11, Mar 2011, 43–48.
Patel, V. M., and Chellappa, R. (2013). “Approximation methods for the recovery of shapes and images from gradients,” in Excursions in harmonic analysis, volume 1, applied and numerical harmonic analysis (Boston: Birkhäuser), 377–398.
Patra, S. K., Bartsch, J., Kalms, M. K., and Bergmann, R. B. (2019). “Phase measurement deviations in deflectometry due to properties of technical surfaces,” in Proceedings volume 11102 Applied Optical Metrology III, San Diego, California, US, 11-15 AUGUST 2019 (SPIE), 111020Q.
Pedreira, P., Nicolas, J., Šics, I., Heinis, D., Fontserè, A., Crisol, A., et al. (2019). Deflectometry encoding the measured angle in a time-dependent intensity signal. Rev. Sci. Instrum. 90 (2), 021707. doi:10.1063/1.5057768
Penk, D., Sturm, R., Seifert, L., Stamminger, M., and Greiner, G. (2020). “Reflective surface reconstruction from inverse deflectometric measurements,” in Computer Vision, Imaging and Computer Graphics Theory and Applications, Proceedings of International Joint Conference 15, Valetta, Malta, 27-29 February, 2020.
Pérard, D. (2001). “Automated visual inspection of specular surfaces with structured-lighting reflection techniques,”. Phd thesis (Karlsruhe: KIT).
Pérard, D. (1995). Surface quality measurement with an adaptive grating reflection method. Jahresbericht / IAR, Deutsch-Französisches Institut für Automation und Robotik.
Petz, M., Dierke, H., and Tutsch, R. (2020a). “Advances in deflectometric form measurement,” in Forum bildverarbeitung, 157–169.
Petz, M., Dierke, H., and Tutsch, R. (2019). Photogrammetric determination of the refractive properties of liquid crystal displays. Tm. - Tech. Mess. 86 (6), 319–324. doi:10.1515/teme-2018-0088
Petz, M., Dierke, H., and Tutsch, R. (2020b). Wellenlängenoptimierung bei Heterodyn-Phasenschiebeverfahren. Tm. - Tech. Mess. 87 (10), 599–613. doi:10.1515/teme-2019-0136
Petz, M., Fischer, M., and Tutsch, R. (2018). Defekterkennung an spiegelnden und transparenten Oberflächen durch Abbildung einer örtlich modulierbaren Lichtquelle. Tm. - Tech. Mess. 85 (2), 79–87. doi:10.1515/teme-2017-0088
Petz, M., Fischer, M., and Tutsch, R. (2009). Three-dimensional shape measurement of aspheric refractive optics by pattern transmission photogrammetry. Three-Dimensional Imaging Metrol. 7239, 723906. doi:10.1117/12.810530
Petz, M., and Ritter, R. (2001). Reflection grating method for 3d measurement of reflecting surfaces. SPIE Proc. 4399, 35–41. doi:10.1117/12.445587
Petz, M., and Tutsch, R. (2004). Rasterreflexions-Photogrammetrie zur Messung spiegelnder Oberflächen (Reflection Grating Photogrammetry for the Measurement of Specular Surfaces). Tm. - Tech. Mess. 71 (7–8), 389–397. doi:10.1524/teme.71.7.389.36694
Petz, M., and Tutsch, R. (2005). Reflection grating photogrammetry: A technique for absolute shape measurement of specular free-form surfaces. SPIE Proc. 5869, 58691D. doi:10.1117/12.617325
Pfeifer, T., Wang, B., Evertz, J., and Tutsch, R. (1995). Phase-shifting moiré deflectometry. Optik 98 (4), 158–162.
Poirier-Herbeck, L., Aubreton, O., and Fofi, D. (2021). “3d reconstruction of mirror-like surfaces by smart deflectometry,” in Proceedings volume 11794 15th International Conference on Quality Control by Artificial Vision, Tokushima, Japan, 12-14 MAY 2021 (SPIE), 117940D. doi:10.1117/12.2589165
Porras-Aguilar, R., and Falaggis, K. (2016). Absolute phase recovery in structured light illumination systems: Sinusoidal vs. intensity discrete patterns. Opt. Lasers Eng. 84, 111–119. doi:10.1016/j.optlaseng.2016.04.010
Porras-Aguilar, R., Falaggis, K., and Ramos-Garcia, R. (2017). Error correcting coding-theory for structured light illumination systems. Opt. Lasers Eng. 93, 146–155. doi:10.1016/j.optlaseng.2017.02.002
Pouya Fard, A., and Davies, A. D. (2018). Characterization of the interpolation bias in the analysis of deflectometry measurement data. Interferom. XIX 10749, 107490G. doi:10.1117/12.2323420
Prados, E., and Faugeras, O. D. (2006). “Shape from shading,” in Handbook of mathematical models in computer vision (Berlin, Germany: Springer-Verlag), 375–388.
Prinzler, M. H. U., Kalms, M., Bergmann, R. B., and Bartsch, J. (2018). Metric for comparison of generic camera calibration. Reflect. Scatt. Diffr. Surfaces VI 10750, 107500I. doi:10.1117/12.2319366
Pruss, C., Baer, G. B., Schindler, J., and Osten, W. (2017). Measuring aspheres quickly: Tilted wave interferometry. Opt. Eng. 56 (11), 111713. doi:10.1117/1.oe.56.11.111713
Qi, Z., Wang, Z., Huang, J., Duan, Q., Xing, C., and Gao, J. (2020). Phase-modulation combined deflectometry for small defect detection. Appl. Opt. 59 (7), 2016–2023. doi:10.1364/ao.382104
Qiao, G., Huang, Y., Song, Y., Yue, H., and Liu, Y. (2020). A single-shot phase retrieval method for phase measuring deflectometry based on deep learning. Opt. Commun. 476, 126303. doi:10.1016/j.optcom.2020.126303
Qin, Y., Wan, S., Wan, Y., Weng, J., Liu, W., and Gong, Q. (2020). Direct and accurate phase unwrapping with deep neural network. Appl. Opt. 59 (24), 7258–7267. doi:10.1364/ao.399715
Quach, H., Kang, H., Jeong, B., Choi, H., and Kim, D. (2022a). Non-planar illumination deflectometry for axicon metrology. Opt. Lett. 47 (15), 3636–3639. doi:10.1364/ol.465046
Quach, H., Kang, H., Sirsi, S., Chandra, A., Choi, H., Esparza, M., et al. (2022b). Surface measurement of a large inflatable reflector in cryogenic vacuum. photonics 9 (1), 1. doi:10.3390/photonics9010001
Quéau, Y., Durou, J.-D., and Aujol, J.-F. (2017). Normal integration: A survey. tech. rep. doi:10.48550/arXiv.1709.05940
Rahmann, S., and Canterakis, N. (2001). “Reconstruction of specular surfaces using polarization imaging,” in Proceedings of the 2001 IEEE Computer Society Conference on Computer Vision and Pattern Recognition. CVPR 2001, Kauai, HI, USA, 08-14 December 2001, 1–149. doi:10.1109/CVPR.2001.990468
Rahmann, S. (2003). “Reconstruction of quadrics from two polarization views,” in Pattern recognition and image analysis, volume 2652 of lecture notes in computer science (Berlin, Germany: Springer), 810–820. doi:10.1007/978-3-540-44871-6_94
Ramalingam, S., Sturm, P. F., and Lodha, S. K. (2010). Generic self-calibration of central cameras. Comput. Vis. Image Underst. 114 (2), 210–219. doi:10.1016/j.cviu.2009.07.007
Ramirez-Andrade, A. H., Porras-Aguilar, R., and Falaggis, K. (2020). Numerical integration of slope data with application to deflectometry. Interferom. XX 11490, 1149009. doi:10.1117/12.2570600
Rapp, H. H. (2012). “Reconstruction of specular reflective surfaces using auto-calibrating deflectometry,”. Phd thesis (Karlsruhe: KIT).
Rathjen, C. (1995). Statistical properties of phase-shift algorithms. J. Opt. Soc. Am. A 12 (9), 1997–2008. doi:10.1364/josaa.12.001997
Rayces, J. L. (1964). Exact relation between wave aberration and ray aberration. Opt. Acta Int. J. Opt. 11 (2), 85–88. doi:10.1080/713817854
Reh, T., Li, W., Burke, J., and Bergmann, R. B. (2014). Improving the generic camera calibration technique by an extended model of calibration display. J. Eur. Opt. Soc. - Rapid Publ. 9, 14044. doi:10.2971/jeos.2014.14044
Remondino, F., and Fraser, C. S. (2006). “Digital camera calibration methods: Considerations and comparisons,” in Image Engineering and Vision Metrology Symposium of International Archives of Photogrammetry, Remote Sensing and Spatial Information Sciences (IAPRS), Dresden, Germany, 25-27 September 2006, 266–272.
Ren, H., Gao, F., and Jiang, X. (2015). Iterative optimization calibration method for stereo deflectometry. Opt. Express 23 (17), 22060–22068. doi:10.1364/oe.23.022060
Ren, H., Gao, F., and Jiang, X. (2016). Least-squares method for data reconstruction from gradient data in deflectometry. Appl. Opt. 55 (22), 6052–6059. doi:10.1364/ao.55.006052
Rieder, G., and Ritter, R. (1965). Krümmungsmessung an belasteten Platten nach dem Ligtenbergschen moiré-Verfahren. Forsch. Im. Ingenieurwes. 31 (2), 33–44. doi:10.1007/bf02560467
Riesz, F. (2011). Sensitivity and detectability in makyoh imaging. Optik 122 (11), 1005–1009. doi:10.1016/j.ijleo.2010.06.038
Riesz, F. (2018). Structured-illumination makyoh-topography: Optimum grid position and its constraints. Surf. Topogr. Metrology Prop. 6 (4), 045009. doi:10.1088/2051-672x/aaeb86
Ritter, R., and Hahn, R. (1983). Contribution to analysis of the reflection grating method. Opt. Lasers Eng. 4 (1), 13–24. doi:10.1016/0143-8166(83)90003-9
Ritter, R. (1982). Reflection moire methods for plate bending studies. Opt. Eng. 21 (4), 663–671. doi:10.1117/12.7972962
Ritter, R., and Wilke, W. (1991). Slope and contour measurement by the reflection grating method and the photogrammetric principle. Opt. Lasers Eng. 15 (2), 103–113. doi:10.1016/0143-8166(91)90027-q
Rodrigues, R., Barreto, J. P., and Nunes, U. (2010). “Camera pose estimation using images of planar mirror reflections,” in Computer vision lecture notes in computer science (LNCS) (Berlin, Heidelberg: Springer), 6314, 382–395. doi:10.1007/978-3-642-15561-1_28
Ronchi, V. (1927). Due nuovi metodi per lo studio delle superficie e dei sistemi ottici. Ann. della Scuola Norm. Super. Pisa - Cl. Sci. 1 (15), 1–50.
Roschani, M. (2020). “Probabilistische Planungsverfahren für die deflektometrische Oberflächeninspektion,”. Phd thesis (Karlsruhe: KIT).
Rose, P., Surrel, Y., and Becker, J. M. (2009). Specific design requirements for a reliable slope and curvature measurement standard. Meas. Sci. Technol. 20 (9), 095110. doi:10.1088/0957-0233/20/9/095110
Rosebrock, D., and Wahl, F. M. (2012). “Generic camera calibration and modeling using spline surfaces,” in Intelligent Vehicles Symposium (IV), Madrid, Spain, 03-07 June 2012, 51–56. doi:10.1109/IVS.2012.6232156
Rosenboom, L., Kreis, T. M., and Jüptner, W. P. O. (2011). Surface description and defect detection by wavelet analysis. Meas. Sci. Technol. 22 (4), 045102. doi:10.1088/0957-0233/22/4/045102
Roth, S., and Black, M. J. (2006). “Specular flow and the recovery of surface structure,” in Conference on Computer Vision and Pattern Recognition (CVPR), New York, NY, USA, 17-22 June 2006, 1869–1876. doi:10.1109/CVPR.2006.290
Rystrom, L. (1987). Detection of flaws in curved metal surfaces. Appl. Opt. 26 (19), 4045–4048. doi:10.1364/ao.26.004045
Sagawa, R., Takatsuji, M., Echigo, T., and Yagi, Y. (2005). “Calibration of lens distortion by structured-light scanning,” in Proceedings of the International Conference on Intelligent Robots and Systems, Edmonton, AB, Canada, 02-06 August 2005, 1349–1354. doi:10.1109/IROS.2005.1545167
Saines, G., and Tomilin, M. G. (1999). Magic mirrors of the orient. J. Opt. Technol. 66 (8), 758. doi:10.1364/jot.66.000758
Salas-Peimbert, D. P., Malacara-Doblado, D., Durán-Ramírez, V. M., Trujillo-Schiaffino, G., and Malacara-Hernández, D. (2005). Wave-front retrieval from hartmann test data. Appl. Opt. 44 (20), 4228–4238. doi:10.1364/ao.44.004228
Salvi, J., Armangué, X., and Batlle, J. (2002). A comparative review of camera calibrating methods with accuracy evaluation. Pattern Recognit. 35 (7), 1617–1635. doi:10.1016/s0031-3203(01)00126-1
Salvi, J., Fernandez, S., Pribanić, T., and Llado, X. (2010). A state of the art in structured light patterns for surface profilometry. Pattern Recognit. 43 (8), 2666–2680. doi:10.1016/j.patcog.2010.03.004
Salvi, J., Pagès, J., and Batlle, J. (2004). Pattern codification strategies in structured light systems. Pattern Recognit. 37 (4), 827–849. doi:10.1016/j.patcog.2003.10.002
Sanderson, A. C., Weiss, L. E., and Nayar, S. K. (1988). Structured highlight inspection of specular surfaces. IEEE Trans. Pattern Analysis Mach. Intell. 10 (1), 44–55. doi:10.1109/34.3866
Sandner, M. P. (2014). Hybrid reflectometry - 3d shape measurement on scattering and reflective surfaces. DGaO Proc. 115, B29.
Sandner, M. P., Li, W., Bothe, T., Burke, J., von Kopylow, C., and Bergmann, R. B. (2011). Absolut-Abstandsreferenz für die Streifenreflexionstechnik zur Verringung systematischer Messfehler. DGaO Proc. 112, A2.
Sandner, M. P. (2015). “Optical measurement of partially specular surfaces by combining pattern projection and deflectometry techniques,”. Master thesis (Bremen: FernUniversität Hagen).
Sankaranarayanan, A. C., Veeraraghavan, A., Tuzel, O., and Agrawal, A. (2010). “Image invariants for smooth reflective surfaces,” in European conference 11 on computer vision (Berlin, Heidelberg: Springer), 6312, 237–250. doi:10.1007/978-3-642-15552-9_18
Sansoni, G., Carocci, M., and Rodella, R. (1999). Three-dimensional vision based on a combination of gray-code and phase-shift light projection: Analysis and compensation of the systematic errors. Appl. Opt. 38 (31), 6565–6573. doi:10.1364/ao.38.006565
Sansoni, G., and Redaelli, E. (2005). A 3d vision system based on one-shot projection and phase demodulation for fast profilometry. Meas. Sci. Technol. 16 (5), 1109–1118. doi:10.1088/0957-0233/16/5/009
Sárosi, Z., Knapp, W., Kunz, A., and Wegener, K. (2010). Detection of surface defects on sheet metal parts by using one-shot deflectometry in the infrared range. InfraMation Proc., 1–10. doi:10.3929/ethz-a-006206898
Savarese, S., Li, F.-F., and Perona, P. (2004). “What do reflections tell us about the shape of a mirror?,” in Proceeding of the 1st Symposium on Applied Perception in Graphics and Visualization, APGV ’04, Los Angeles, California, USA, August 7-8, 2004, 115–118. doi:10.1145/1012551.1012571
Schachtschneider, R., Fortmeier, I., Stavridis, M., Asfour, J.-M., Berger, G., Bergmann, R. B., et al. (2018). Interlaboratory comparison measurements of aspheres. Meas. Sci. Technol. 29 (5), 055010. doi:10.1088/1361-6501/aaae96
Schaffer, M., Große, M., Harendt, B., and Kowarschik, R. M. (2014). Statistical patterns: An approach for high-speed and high-accuracy shape measurements. Opt. Eng. 53 (11), 112205. doi:10.1117/1.OE.53.11.112205
Schöps, T., Larsson, V., Pollefeys, M., and Sattler, T. (2020). “Why having 10,000 parameters in your camera model is better than twelve,” in Conference on Computer Vision and Pattern Recognition, Seattle, WA, USA, 13-19 June 2020, 2532–2541. doi:10.1109/CVPR42600.2020.00261
Schulz, A., Krobot, R., Olesch, E., Faber, C., Stinzing, F., Stegmann, C., et al. (2011). “Methods for the characterization of mirror facets for imaging atmospheric cherenkov telescopes,” in International Cosmic Ray Conference 32 (ICRC), Beijing, China, 11-18 August 2011, 34.
Scott, P. M., and Burgess, G. (2010). “Measurement of mirror panels using coloured-pattern deflectometry,” in SolarPACES International Symposium 16, Solar Power and Chemical Energy Systems Conference, Perpignan, France, 21 – 24. September 2010.
Servin, M., Padilla, J. M., Gonzalez, A., and Garnica, G. (2015). Temporal phase-unwrapping of static surfaces with 2-sensitivity fringe-patterns. Opt. Express 23 (12), 15806–15815. doi:10.1364/oe.23.015806
Servin, M., Padilla, M., and Garnica, G. (2018). Super-sensitive two-wavelength fringe projection profilometry with 2-sensitivities temporal unwrapping. Opt. Lasers Eng. 106, 68–74. doi:10.1016/j.optlaseng.2018.02.012
Servin, M., Rodriguez-Vera, R., Carpio, M., and Morales, A. (1990). Automatic fringe detection algorithm used for moire deflectometry. Appl. Opt. 29 (22), 3266–3270. doi:10.1364/ao.29.003266
Settles, G. S., and Hargather, M. J. (2017). A review of recent developments in schlieren and shadowgraph techniques. Meas. Sci. Technol. 28 (4), 042001. doi:10.1088/1361-6501/aa5748
Settles, G. S. (2001). “Schlieren and shadowgraph techniques,” in Experimental fluid mechanics (Berlin and Heidelberg: Springer).
Seulin, R., Merienne, F., and Gorria, P. (2001). “Dynamic lighting system for specular surface inspection”. SPIE Proc. 4301, 199–206. doi:10.1117/12.420913
Seßner, R. (2009). “Richtungscodierte Deflektometrie durch Telezentrie,”. Phd thesis (Erlangen: Uni Erlangen).
Shafer, S. A. (1985). Using color to separate reflection components. Color Res. Appl. 10 (4), 210–218. doi:10.1002/col.5080100409
Siewert, F., Buchheim, J., Gwalt, G., and Viefhaus, J. (2019). On the characterization of ultra-precise XUV-focusing mirrors by means of high angular resolution slope-measuring deflectometry. Adv. Metrology X-Ray EUV Opt. VIII 11109, 155–165. doi:10.1117/12.2529308
Sigrist, B. (2015). “Evaluation von Verfahren zur Kalibrierung eines deflektometrischen Messsystems,”. Diploma thesis (KIT).
Sironi, G., Canestrari, R., Tayabaly, K., and Pareschi, G. (2016). Evaluation of novel approach to deflectometry for high accuracy optics. SPIE Proc. 9912, 991213. doi:10.1117/12.2233328
Sjödahl, M., and Synnergren, P. (1999). Measurement of shape by using projected random patterns and temporal digital speckle photography. Appl. Opt. 38 (10), 1990–1997. doi:10.1364/ao.38.001990
Skydan, O. A., Lalor, M. J., and Burton, D. R. (2007). 3d shape measurement of automotive glass by using a fringe reflection technique. Meas. Sci. Technol. 18 (1), 106–114. doi:10.1088/0957-0233/18/1/013
Smith, G. A. (2021). 2d zonal integration with unordered data. Appl. Opt. 60 (16), 4662–4667. doi:10.1364/ao.426162
Solem, J. E., Aanæs, H., and Heyden, A. (2004). “A variational analysis of shape from specularities using sparse data,” in Visualization and Transmission, International Symposium 2 on 3D Data Processing, Thessaloniki, Greece, 09-09 September 2004, 26–33. doi:10.1109/TDPVT.2004.1335137
Southwell, W. H. (1980). Wave-front estimation from wave-front slope measurements. J. Opt. Soc. Am. 70 (8), 998–1006. doi:10.1364/josa.70.000998
Sprenger, D., Faber, C., Seraphim, M. C., and Häusler, G. (2010). Uv-deflectometry: No parasitic reflections. DGaO Proc. 111, A19.
Srinivasan, V., Liu, H. C., and Halioua, M. (1984). Automated phase-measuring profilometry of 3-d diffuse objects. Appl. Opt. 23 (18), 3105–3108. doi:10.1364/ao.23.003105
Stephan, T., Dürrwang, J., Burke, J., Werling, S. B., and Beyerer, J. (2016). “Extended photometric stereo model,” in Forum bildverarbeitung (Karlsruhe Deutschand, 149–160.
Sturm, P. F., and Ramalingam, S. (2004). “A generic concept for camera calibration,” in Computer vision - eccv 2004 (Heidelberg: Springer), 3022, 1–13.
Su, P., Khreishi, M. A. H., Su, T., Huang, R., Dominguez, M. Z., Maldonado, A. V., et al. (2013a). Aspheric and freeform surfaces metrology with software configurable optical test system: A computerized reverse Hartmann test. Opt. Eng. 53 (3), 031305. doi:10.1117/1.oe.53.3.031305
Su, P., Parks, R. E., Wang, L., Angel, R. P., and Burge, J. H. (2010). Software configurable optical test system: A computerized reverse Hartmann test. Appl. Opt. 49 (23), 4404–4412. doi:10.1364/ao.49.004404
Su, P., Wang, S., Khreishi, M. A. H., Wang, Y., Su, T., Zhou, P., et al. (2012a). Scots: A reverse Hartmann test with high dynamic range for giant Magellan telescope primary mirror segments. SPIE Proc. 8450, 9. doi:10.1117/12.926719
Su, P., Wang, Y., Burge, J. H., Kaznatcheev, K., and Idir, M. (2012b). Non-null full field x-ray mirror metrology using Scots: A reflection deflectometry approach. Opt. Express 20, 12393–12407. doi:10.1364/oe.20.012393
Su, T. (2014). “Aspherical metrology for non-specular surfaces with the scanning long-wave optical test system,”. Phd thesis (Tucson, AZ, USA: Uni Arizona).
Su, T., Maldonado, A. V., Su, P., and Burge, J. H. (2015). Instrument transfer function of slope measuring deflectometry systems. Appl. Opt. 54 (10), 2981–2990. doi:10.1364/ao.54.002981
Su, T., Maldonado, A. V., Su, P., Zhou, P., and Burge, J. H. (2013c). Study of the instrument transfer function of a free-form optics metrology system: Scots. SPIE Proc. 9046, 904602. doi:10.1117/12.2037040
Su, T., Park, W. H., Parks, R. E., Su, P., and Burge, J. H. (2011). Scanning long-wave optical test system: A new ground optical surface slope test system. SPIE Proc. 8126, 81260E. doi:10.1117/12.892666
Su, T., Wang, S., Parks, R. E., Su, P., and Burge, J. H. (2013b). Measuring rough optical surfaces using scanning long-wave optical test system. 1. principle and implementation. Appl. Opt. 52 (29), 7117–7126. doi:10.1364/ao.52.007117
Su, W.-H., and Liu, H. (2006). Calibration-based two-frequency projected fringe profilometry: A robust, accurate, and single-shot measurement for objects with large depth discontinuities. Opt. Express 14, 9178–9210. doi:10.1364/oe.14.009178
Sudhakar, P., Jacques, L., Dubois, X., Antoine, P., and Joannes, L. (2015). Compressive imaging and characterization of sparse light deflection maps. SIAM J. Imaging Sci. 8 (3), 1824–1856. doi:10.1137/140974341
Surrel, Y. (2006). “Absolute flatness measurement with 10 nm resolution over a 400 mm field,” in Proceedings Speckles, From Grains to Flowers, Nimes, France, 13-15 SEPTEMBER 2006 (SPIE). doi:10.1117/12.696010
Surrel, Y. (1997a). Additive noise effect in digital phase detection. Appl. Opt. 36 (1), 271–276. doi:10.1364/ao.36.000271
Surrel, Y. (2004). “Deflectometry: A simple and efficient noninterferometric method for slope measurement,” in Experimental & applied mechanics, international congress & exposition 10 on, inverse problem approaches to material parameter identification from full-field measurements (Composites).
Surrel, Y. (1996). Design of algorithms for phase measurements by the use of phase stepping. Appl. Opt. 35 (1), 51–60. doi:10.1364/ao.35.000051
Surrel, Y. (1997b). Design of phase-detection algorithms insensitive to bias modulation. Appl. Opt. 36 (4), 805–807. doi:10.1364/ao.36.000805
Surrel, Y. (2000). “Fringe analysis,” in Photomechanics topics in applied physics (Berlin Heidelberg: Springer), 77, 55–102.
Surrel, Y. (1997c). “Two-step temporal phase unwrapping in profilometry,” in Proceedings volume 3098 Optical Inspection and Micromeasurements II, Munich, Germany, 16-20 JUNE 1997 (SPIE), 271–282. doi:10.1117/12.281170
Synowicki, R. (2008). Suppression of backside reflections from transparent substrates. Phys. status solidi C. 5 (5), 1085–1088. doi:10.1002/pssc.200777873
Szabó, J., Riesz, F., and Szentpáli, B. (1995). Wafer curvature and flatness measurements using the magic-mirror (makyoh) method. MRS Proc. 379, 103–108. doi:10.1557/PROC-379-103
Szeliski, R. (1991). Fast shape from shading. CVGIP Image Underst. 53, 129–153. doi:10.1016/1049-9660(91)90023-i
Takeda, M., Gu, Q., Kinoshita, M., Takai, H., and Takahashi, Y. (1997). Frequency-multiplex fourier-transform profilometry: A single-shot three-dimensional shape measurement of objects with large height discontinuities and/or surface isolations. Appl. Opt. 36 (22), 5347–5354. doi:10.1364/ao.36.005347
Takeda, M., Ina, H., and Kobayashi, S. (1982). Fourier-transform method of fringe-pattern analysis for computer-based topography and interferometry. J. Opt. Soc. Am. 72 (1), 156–160. doi:10.1364/JOSA.72.000156
Talmi, A., and Ribak, E. N. (2006). Wavefront reconstruction from its gradients. J. Opt. Soc. Am. A 23 (2), 288–297. doi:10.1364/josaa.23.000288
Tang, Y., Su, X., Wu, F., and Liu, Y. (2009). A novel phase measuring deflectometry for aspheric mirror test. Opt. Express 17 (22), 19778–19784. doi:10.1364/oe.17.019778
Tao, S., Yue, H., Chen, H., Wang, T., Cai, J., Wu, Y., et al. (2019). Elimination of parasitic reflections for objects with high transparency in phase measuring deflectometry. Results Phys. 15, 102734. doi:10.1016/j.rinp.2019.102734
Tappen, M. F. (2011). “Recovering shape from a single image of a mirrored surface from curvature constraints,” in Conference on Computer Vision and Pattern Recognition, Colorado Springs, CO, USA, 20-25 June 2011, 2545–2552. doi:10.1109/CVPR.2011.5995376
Tarini, M., Lensch, H. P. A., Goesele, M., and Seidel, H.-P. (2005). 3d acquisition of mirroring objects using striped patterns. Graph. Models 67 (4), 233–259. doi:10.1016/j.gmod.2004.11.002
Tobisch, A., Schellenberger, M., and Pfitzner, L. (2012). The ’magic mirror’ method. Laser Photonics 4, 38–41.
Toniuc, H., and Pierron, F. (2019). Infrared deflectometry for slope deformation measurements. Exp. Mech. 59 (8), 1187–1202. doi:10.1007/s11340-019-00480-9
Tornero, J., Armesto, L., Mora, M. C., Montés, N., Herráez, Á., and Asensio, J. (2012). Detección de defectos en carrocerías de vehículos basado en visión artificial: Diseño e implantación. Rev. Iberoam. Automática Inform. Ind. RIAI 9 (1), 93–104. doi:10.1016/j.riai.2011.11.010
Tosun, E., Gingold, Y. I., Reisman, J., and Zorin, D. (2007). “Shape optimization using reflection lines,” in Eurographics symposium on geometry processing, 1–10.
Towers, C. E., Towers, D. P., and Jones, J. D. C. (2004). Time efficient Chinese remainder theorem algorithm for full-field fringe phase analysis in multi-wavelength interferometry. Opt. Express 12 (6), 1136–1143. doi:10.1364/opex.12.001136
Trifonov, B., Bradley, D., and Heidrich, W. (2006). Tomographic reconstruction of transparent objects. Proc. EGSR 2006, 51–60. doi:10.1145/1179849.1179918
Trumper, I., Choi, H., and Kim, D. (2016). Instantaneous phase shifting deflectometry. Opt. Express 24 (24), 27993–28007. doi:10.1364/oe.24.027993
Tsai, R. Y. (1987). A versatile camera calibration technique for high-accuracy 3d machine vision metrology using off-the-shelf tv cameras and lenses. IEEE J. Robotics Automation 3 (4), 323–344. doi:10.1109/jra.1987.1087109
Uhlig, D., and Heizmann, M. (2021). “A calibration method for the generalized imaging model with uncertain calibration target coordinates,” in Computer vision – accv 2020 (Cham: Springer), 12624, 541–559. doi:10.1007/978-3-030-69535-4_33
Uhlig, D., and Heizmann, M. (2018). Multi-Stereo-Deflektometrie mit einer Lichtfeldkamera/Multi-stereo deflectometry with a light-field camera. Tm. - Tech. Mess. 85 (S1), 59–65. doi:10.1515/teme-2018-0042
Ulmer, S., März, T., Prahl, C., Reinalter, W., and Belhomme, B. (2011). Automated high resolution measurement of heliostat slope errors. Sol. Energy 85 (4), 681–687. doi:10.1016/j.solener.2010.01.010
Ulmer, S., and Röger, M. (2007). Automatisierte hochaufgelöste vermessung der spiegelfehler von heliostaten. Kölner Sonnenkolloquium 10, 1–3.
Vargas, J., Gòmez-Pedrero, J. A., Alonso, J., and Quiroga, J. A. (2010). Deflectometric method for the measurement of user power for ophthalmic lenses. Appl. Opt. 49 (27), 5125–5132. doi:10.1364/ao.49.005125
Vasilyev, Y., Adato, Y., Zickler, T., and Ben-Shahar, O. (2008). “Dense specular shape from multiple specular flows,” in 2008 IEEE Conference on Computer Vision and Pattern Recognition, Anchorage, AK, USA, 23-28 June 2008, 1–8. doi:10.1109/CVPR.2008.4587685
Vasilyev, Y., Zickler, T., Gortler, S. J., and Ben-Shahar, O. (2011). “Shape from specular flow: Is one flow enough?,” in Proceedings of the IEEE Computer Vision and Pattern Recognition Workshops (CVPRW), Colorado Springs, CO, USA, 20-25 June 2011, 2561–2568. doi:10.1109/CVPR.2011.5995662
Velghe, S., Primot, J., Guérineau, N., Cohen, M., and Wattellier, B. (2005). Wave-front reconstruction from multidirectional phase derivatives generated by multilateral shearing interferometers. Opt. Lett. 30, 245–247. doi:10.1364/ol.30.000245
Villa, J., Quiroga, J. A., and Servín, M. (2000). Improved regularized phase-tracking technique for the processing of squared-grating deflectograms. Appl. Opt. 39 (4), 502–508. doi:10.1364/ao.39.000502
von Finck, A., Duparré, A., and Pfeffer, M. (2009). Makyoh-Imaging zur Charakterisierung reflektierender OberflächenSurface Structure Analysis by Makyoh-Imaging. Tm. - Tech. Mess. 76 (1), 26–33. doi:10.1524/teme.2009.0940
Wagner, C., and Häusler, G. (2003). Information theoretical optimization for optical range sensors. Appl. Opt. 42 (27), 5418–5426. doi:10.1364/ao.42.005418
Waldon, S., and Dyer, C. (1993). “Dynamic shading, motion parallax and qualitative shape,” in Proc. IEEE Workshop Qualitative Vision, New York, NY, USA, 14-14 June 1993, 61–70. doi:10.1109/WQV.1993.262949
Walkup, J. F., and Goodman, J. W. (1973). Limitations of fringe-parameter estimation at low light levels. J. Opt. Soc. Am. 63, 399. doi:10.1364/josa.63.000399
Wang, C., Chen, N., and Heidrich, W. (2021a). Towards self-calibrated lens metrology by differentiable refractive deflectometry. Opt. Express 29 (19), 30284–30295. doi:10.1364/oe.433237
Wang, D., Xu, P., Gong, Z., Xie, Z., Liang, R., Xu, X., et al. (2018). Transmitted wavefront testing with large dynamic range based on computer-aided deflectometry. J. Opt. 20 (6), 065705. doi:10.1088/2040-8986/aac3a7
Wang, D., Xu, P., Wu, Z., Fu, X., Wu, R., Kong, M., et al. (2020). Simultaneous multisurface measurement of freeform refractive optics based on computer-aided deflectometry. Optica 7 (9), 1056. doi:10.1364/optica.394526
Wang, K., Xing, B., Konecny, P., and Kaufman, A. E. (2005). Structural and sorption characteristics of adsorbed humic acid on clay minerals. J. Environ. Qual. 34, 342–349. doi:10.2134/jeq2005.0342
Wang, L., Su, P., Parks, R. E., Angel, R. P., Sasián, J. M., and Burge, J. H. (2010). A low-cost, flexible, high dynamic range test for free-form illumination optics. SPIE Proc. 7652, 76521H. doi:10.1117/12.873980
Wang, R., Li, D., Xu, K., Zhang, X., and Luo, P. (2019). Parasitic reflection elimination using binary pattern in phase measuring deflectometry. Opt. Commun. 451, 67–73. doi:10.1016/j.optcom.2019.06.009
Wang, R., Li, D., Zhang, X., Zheng, W., Yu, L., and Ge, R. (2021c). Marker-free stitching deflectometry for three-dimensional measurement of the specular surface. Opt. Express 29 (25), 41851. doi:10.1364/oe.444205
Wang, R. (2018). Surface shape measurement of transparent planar elements with phase measuring deflectometry. Opt. Eng. 57 (10), 1. doi:10.1117/1.oe.57.10.104104
Wang, T., Schiffers, F., Willomitzer, F., and Cossairt, O. (2021b). “A Mitsuba-based study on trade-offs between projection and reflection based systems in structured-light 3d imaging,” in Computational Optical Sensing and Imaging, Washington, DC, US, 19–23 July 2021.
Wang, Z., and Inokuchi, S. (1993). “Determining shape of specular surfaces,” in 8th Scandinavian Conference on Image Analysis, Tromso, Norway, May 25-28, 1993, 1187–1194.
Wedowski, R. D., Atkinson, G. A., Smith, M. L., and Smith, L. N. (2012a). A system for the dynamic industrial inspection of specular freeform surfaces. Opt. Lasers Eng. 50 (5), 632–644. doi:10.1016/j.optlaseng.2011.11.007
Wedowski, R. D., Atkinson, G. A., Smith, M. L., and Smith, L. N. (2012b). Dynamic deflectometry: A novel approach for the on-line reconstruction of specular freeform surfaces. Opt. Lasers Eng. 50 (12), 1765–1778. doi:10.1016/j.optlaseng.2012.07.003
Wei, L., Qi, W., Xu, Y., and Xu, B. (2017). Closed-form, robust and accurate multi-frequency phase unwrapping: Frequency design and algorithm. Signal Process. 138, 159–166. doi:10.1016/j.sigpro.2017.03.018
Wei, X., Zhang, H., Zou, T., and Wang, Z. (2022). Three-dimensional stitching of stereo-deflectometry based on marker points. Appl. Opt. 61 (25), 7323–7329. doi:10.1364/ao.464504
Weingaertner, I., Schulz, M., Thomsen-Schmidt, P., and Elster, C. (2001). “Measurement of steep aspheres: A step forward to nanometer accuracy”. SPIE Proc. 4449, 195–204. doi:10.1117/12.450095
Werling, S. B., and Beyerer, J. (2007). Automatische Inspektion spiegelnder Oberflächen mittels inverser Muster (inspection of specular surfaces with inverse patterns). Tm. - Tech. Mess. 74 (4), 217–223. doi:10.1524/teme.2007.74.4.217
Werling, S. B., and Beyerer, J. (2011). Oberflächenrekonstruktion mittels Stereodeflektometrie. teme 78 (9), 398–405. doi:10.1524/teme.2011.0157
Werling, S. B., and Beyerer, J. (2010). “Stereobasierte Regularisierung des deflektometrischen Rekonstruktionsproblems,” in Forum bildverarbeitung (KIT Scientific Publishing), 349–364.
Werling, S. B. (2011). “Deflektometrie zur automatischen Sichtprüfung und Rekonstruktion spiegelnder Oberflächen,”. Phd thesis (Karlsruhe: KIT).
Werling, S. B., and Heizmann, M. (2015). Vorrichtung und Verfahren zur Bestimmung der Topografie einer Oberfläche. Patent no.: DE102014210024A1.
Werling, S. B., Mai, M., Heizmann, M., and Beyerer, J. (2009). Inspection of specular and partially specular surfaces. Metrology Meas. Syst. 16 (3), 415–431. doi:10.1063/1.4716309
Wiegmann, A., Schulz, M., Yoshizumi, K., Kubo, K., and Ramm, D. (2011). “Comparison of a scanning interferometric profile measurement method and an ultra-precise coordinate measuring machine,” in 10 IMEKO TC14 Symposium on Laser Metrology for Precision Measurement and Inspection in Industry, Braunschweig, Germany, 2011, September 12-14, 1–8.
Wiegmann, A., Wagner, H., and Kowarschik, R. M. (2006). Human face measurement by projecting bandlimited random patterns. Opt. Express 14 (17), 7692–7698. doi:10.1364/oe.14.007692
Willomitzer, F., Yeh, C.-K., Gupta, V., Spies, W., Schiffers, F., Katsaggelos, A. K., et al. (2020). Hand-guided qualitative deflectometry with a mobile device. Opt. Express 28 (7), 9027–9038. doi:10.1364/oe.383475
Woodham, R. J. (1989). “Determining surface curvature with photometric stereo,” in 1989 IEEE International Conference on Robotics and Automation, Scottsdale, AZ, USA, 14-19 May 1989, 36–42. doi:10.1109/ROBOT.1989.100060
Woodham, R. J. (1980). Photometric method for determining surface orientation from multiple images. Opt. Eng. 19 (1), 191139. doi:10.1117/12.7972479
Wu, M., Han, J., Hu, W., Li, M., Yang, F., and Sheng, W. (2022). Enhanced-spatial-resolution optical surface profiler based on focusing deflectometry. Opt. Express 30 (25), 45918. doi:10.1364/oe.462784
Wu, Y., Dantanarayana, H. G., Yue, H., and Huntley, J. M. (2017). Accurate characterisation of hole geometries by fringe projection profilometry. Videometrics, Range Imaging, Appl. XIV 10332, 1033204. doi:10.1117/12.2270210
Wu, Y., Yue, H., Yi, J., Li, M., and Liu, Y. (2016). Dynamic specular surface measurement based on color-encoded fringe reflection technique. Opt. Eng. 55 (2), 024104. doi:10.1117/1.oe.55.2.024104
Wu, Z., Wang, D., Dou, J., Kong, M., Lei, L., and Liang, R. (2021). “Deep-learning-based deflectometry for simultaneous multi-surface measurement of freeform refractive optics,” in Proceedings of SPIE Optical Design and Testing XI, Nantong, China, 10-12 Oct, 2021, 1189504. doi:10.1117/12.2601184
Xia, X.-G., and Liu, K. (2005). A generalized Chinese remainder theorem for residue sets with errors and its application in frequency determination from multiple sensors with low sampling rates. IEEE Signal Process. Lett. 12 (11), 768–771. doi:10.1109/lsp.2005.856877
Xiang, Z., Dai, X., and Gong, X. (2013). Noncentral catadioptric camera calibration using a generalized unified model. Opt. Lett. 38 (9), 1367–1369. doi:10.1364/ol.38.001367
Xiao, L., Xia, X.-G., and Huo, H. (2017). Towards robustness in residue number systems. IEEE Trans. Signal Process. 65 (6), 1497–1510. doi:10.1109/tsp.2016.2641398
Xiao, M., Jujo, S., Takahashi, S., and Takamasu, K. (2011). “Nanometer profile measurement of large aspheric optical surface by scanning deflectometry with rotatable devices,” in Proceedings of SPIE Optical Manufacturing and Testing IX. doi:10.1117/12.893393
Xiao, Y.-L., Su, X., and Chen, W. (2012). Flexible geometrical calibration for fringe-reflection 3d measurement. Opt. Lett. 37 (4), 620–622. doi:10.1364/ol.37.000620
Xie, Z., Wang, D., Gu, H., Kong, M., Liang, R., and Zhang, W. (2019). “Instantaneous wavefront measurement based on deflectometry,” in Proceedings volume 11185 Optical Design and Testing IX, Hangzhou, China, 20-23 OCTOBER 2019 (SPIE), 111850Q. doi:10.1117/12.2537148
Xing, S., Chen, P., and Xiao, Y. (2017). “Single-shot color fringe projection profilometry using two-step phase shifting and centerline marker,” in Proceedings of 5th International Conference on Optical and Photonics Engineering, Singapore, Singapore, 4-7 APRIL 2017 (SPIE), 1044922. doi:10.1117/12.2270797
Xiong, J., Zhong, L., Liu, S., Qiu, X., Zhou, Y., Tian, J., et al. (2017). Improved phase retrieval method of dual-wavelength interferometry based on a shorter synthetic-wavelength. Opt. Express 25 (7), 7181–7191. doi:10.1364/oe.25.007181
Xu, J., Xi, N., Zhang, C., Shi, Q., and Gregory, J. (2010). A geometry and optical property inspection system for automotive glass based on fringe patterns. Opt. Appl. 40 (4), 827–841.
Xu, J., Xi, N., Zhang, C., Shi, Q., and Gregory, J. (2012). A robot-assisted back-imaging measurement system for transparent glass. IEEE/ASME Trans. Mechatronics 17 (4), 779–788. doi:10.1109/tmech.2011.2119376
Xu, J., and Zhang, S. (2020). Status, challenges, and future perspectives of fringe projection profilometry. Opt. Lasers Eng. 135, 106193. doi:10.1016/j.optlaseng.2020.106193
Xu, X., Zhang, X., and Xu, M. (2016). “Dynamic three-dimensional shape measurement for specular freeform surfaces with the quaternary orthogonal grid fringes,” in Optical measurement technology and instrumentation, 101553Y. doi:10.1117/12.2247604
Xu, Y., Gao, F., and Jiang, X. (2020). A brief review of the technological advancements of phase measuring deflectometry. PhotoniX 1 (1), 14. doi:10.1186/s43074-020-00015-9
Xu, Y., Gao, F., and Jiang, X. (2018b). Performance analysis and evaluation of geometric parameters in stereo deflectometry. Engineering 4 (6), 806–815. doi:10.1016/j.eng.2018.10.007
Xu, Y., Gao, F., Ren, H., Zhang, Z., and Jiang, X. (2017). An iterative distortion compensation algorithm for camera calibration based on phase target. Sensors 17 (6), 1188. doi:10.3390/s17061188
Xu, Y., Gao, F., Zhang, Z., and Jiang, X. (2018a). A holistic calibration method with iterative distortion compensation for stereo deflectometry. Opt. Lasers Eng. 106, 111–118. doi:10.1016/j.optlaseng.2018.02.018
Xu, Y., Wang, Y., Gao, F., and Jiang, X. (2022). Segmentation phase measuring deflectometry for measuring structured specular surfaces. Int. J. Adv. Manuf. Technol. 119 (3-4), 2271–2283. doi:10.1007/s00170-021-08439-8
Yamazaki, M., Iwata, S., and Xu, G. (2007). “Dense 3d reconstruction of specular and transparent objects using stereo cameras and phase-shift method,” in Computer vision - ACCV 2007 lecture notes in computer science (LNCS) (Berlin, Heidelberg: Springer), 570–579. doi:10.1007/978-3-540-76390-1_56
Yang, X., Lin, H., Luo, J., Chen, L., and Lei, Y. (2021). Improved ternary gray-code phase unwrapping algorithm for 3d measurement using a binary defocusing technique. Electronics 10 (15), 1824. doi:10.3390/electronics10151824
Ye, J., Niu, Z., Zhang, X., Wang, W., and Xu, M. (2021). Simultaneous measurement of double surfaces of transparent lenses with phase measuring deflectometry. Opt. Lasers Eng. 137, 106356. doi:10.1016/j.optlaseng.2020.106356
Ye, J., Wang, W., Gao, Z., Liu, Z., Wang, S., Benítez, P., et al. (2015). Modal wavefront estimation from its slopes by numerical orthogonal transformation method over general shaped aperture. Opt. Express 23 (20), 26208–26220. doi:10.1364/oe.23.026208
Yu, L., Li, D., Ruan, Y., Zhang, X., Wang, R., and Xu, K. (2022). Wavefront aberration measurement deflectometry for imaging lens tests. Appl. Sci. 12 (15), 7857. doi:10.3390/app12157857
Yu, S., Zhang, J., Yu, X., Sun, X., Wu, H., and Liu, X. (2018). 3d measurement using combined gray code and dual-frequency phase-shifting approach. Opt. Commun. 413, 283–290. doi:10.1016/j.optcom.2017.12.071
Zhang, K., Fu, L., Wang, Z., Sun, Y., and Liu, C. (2017). Research on surface defect detection of ceramic ball based on fringe reflection. Opt. Eng. 56 (10), 1. doi:10.1117/1.oe.56.10.104104
Zhang, R., and Chun, M. R. (2022). “In-lab calibration and testing of adaptive secondary mirrors using phase measuring deflectometry,” in Adaptive Optics Systems VIII (SPIE) Vol. 12185, 1953–1968. doi:10.1117/12.2627278
Zhang, S. (2014). “Active versus passive projector nonlinear gamma compensation method for high-quality fringe pattern generation,” in Proceedings Dimensional Optical Metrology and Inspection for Practical Applications III, Baltimore, MD, USA, 5-9 MAY 2014 (SPIE). doi:10.1117/12.2050534
Zhang, S. (2012b). Composite phase-shifting algorithm for absolute phase measurement. Opt. Lasers Eng. 50 (11), 1538–1541. doi:10.1016/j.optlaseng.2012.06.005
Zhang, S. (2018). High-speed 3d shape measurement with structured light methods: A review. Opt. Lasers Eng. 106, 119–131. doi:10.1016/j.optlaseng.2018.02.017
Zhang, S., and Yau, S.-T. (2006). High-resolution, real-time 3d absolute coordinate measurement based on a phase-shifting method. Opt. Express 14 (7), 2644–2649. doi:10.1364/oe.14.002644
Zhang, X., Niu, Z., Ye, J., and Xu, M. (2021b). Correction of aberration-induced phase errors in phase measuring deflectometry. Opt. Lett. 46 (9), 2047–2050. doi:10.1364/ol.415953
Zhang, Y., Hu, Y., Hao, Q., and Zhang, S. (2022a). “Measurement of surface shape and deformation of small-aperture mirrors based on coaxial normal incidence speckle deflectometry system,” in 2021 International Conference on Optical Instruments and Technology: Optoelectronic Measurement Technology and Systems, 449–456. doi:10.1117/12.2616566
Zhang, Z. (2000). A flexible new technique for camera calibration. IEEE Trans. Pattern Analysis Mach. Intell. 22 (11), 1330–1334. doi:10.1109/34.888718
Zhang, Z., Chang, C., Liu, X., Li, Z., Shi, Y., Gao, N., et al. (2021a). Phase measuring deflectometry for obtaining 3d shape of specular surface: A review of the state-of-the-art. Opt. Eng. 60 (02), 020903. doi:10.1117/1.oe.60.2.020903
Zhang, Z. (2012a). Review of single-shot 3d shape measurement by phase calculation-based fringe projection techniques. Opt. Lasers Eng. 50 (8), 1097–1106. doi:10.1016/j.optlaseng.2012.01.007
Zhang, Z., Towers, C. E., and Towers, D. P. (2006). Time efficient color fringe projection system for 3d shape and color using optimum 3-frequency selection. Opt. Express 14 (14), 6444–6455. doi:10.1364/oe.14.006444
Zhang, Z., Wang, Y., Gao, F., Xu, Y., and Jiang, X. (2022b). Enhancement of measurement accuracy of discontinuous specular objects with stereo vision deflectometer. Measurement 188, 110570. doi:10.1016/j.measurement.2021.110570
Zhang, Z., Zhang, B., and Akiduki, T. (2019). “Specular reflection surface defects detection by using deep learning,” in Proceedings of the International Conference 3 on Information System and Data Mining, Houston, TX, USA, April 6 - 8, 2019, 6–10. doi:10.1145/3325917.3325930
Zhao, C., and Burge, J. H. (2013). Orthonormal curvature polynomials over a unit circle: Basis set derived from curvatures of zernike polynomials. Opt. Express 21 (25), 31430–31442. doi:10.1364/oe.21.031430
Zhao, W., Graves, L. R., Huang, R., Song, W., and Kim, D. (2016). Iterative surface construction for blind deflectometry. SPIE Proc. 9684, 96843X. doi:10.1117/12.2243264
Zheng, D., Kemao, Q., Da, F., and Seah, H. S. (2017). Ternary gray code-based phase unwrapping for 3d measurement using binary patterns with projector defocusing. Appl. Opt. 56 (13), 3660–3665. doi:10.1364/ao.56.003660
Zheng, Q., and Chellappa, R. (1991). “Estimation of illuminant direction, albedo, and shape from shading,” in Proc. IEEE Conference on Computer Vision and Pattern Recognition (CVPR), Maui, HI, USA, 03-06 June 1991, 540–545. doi:10.1109/cvpr.1991.139750
Zheng, W., Li, D., Wang, R., Zhang, X., Ge, R., and Yu, L. (2022). Front and back surface measurement of the transparent planar element based on multi-frequency fringe deflectometry. Opt. Express 30 (20), 35409–35430. doi:10.1364/oe.470304
Zhong, J., and Zhang, Y. (2001). Absolute phase-measurement technique based on number theory in multifrequency grating projection profilometry. Appl. Opt. 40 (4), 492–500. doi:10.1364/ao.40.000492
Zhou, P., Zhu, J., Su, X., Jing, H., and Zhang, X. (2017). Three-dimensional shape measurement using color random binary encoding pattern projection. Opt. Eng. 56 (10), 1. doi:10.1117/1.oe.56.10.104102
Zhou, Q., Chen, R., Huang, B., Liu, C., Yu, J., and Yu, X. (2019). An automatic surface defect inspection system for automobiles using machine vision methods. Sensors 19 (3), 644. doi:10.3390/s19030644
Zhou, Q., Chen, R., Huang, B., Xu, W., and Yu, J. (2020). Deepinspection: Deep learning based hierarchical network for specular surface inspection. Measurement 160, 107834. doi:10.1016/j.measurement.2020.107834
Zhou, T., Chen, K., Wei, H., and Li, Y. (2016). Improved system calibration for specular surface measurement by using reflections from a plane mirror. Appl. Opt. 55 (25), 7018–7028. doi:10.1364/ao.55.007018
Zhu, R., Zhang, X., Li, S., Chen, Y., Lang, W., and Ye, L. (2022). Areal measurement of vibration modes of a hemispherical shell resonator by deflectometry. Appl. Opt. 61 (16), 4919–4926. doi:10.1364/ao.456744
Ziebarth, M., Vogelbacher, M., Olawsky, S., and Beyerer, J. (2014). “Obtaining 2d surface characteristics from specular surfaces,” in Pattern recognition. GCPR 2014. Lecture notes in computer science (Cham, Switzerland: Springer), 690–700. doi:10.1007/978-3-319-11752-2_57
Ziebarth, M. (2019). Wahrnehmungsgrenzen kleiner Verformungen auf spiegelnden Oberflächen. Phd thesis (Karlsruhe: KIT).
Ziebarth, M., Zeller, N., Heizmann, M., and Quint, F. (2018). Modeling the unified measurement uncertainty of deflectometric and plenoptic 3-d sensors. J. Sensors Sens. Syst. 7 (2), 517–533. doi:10.5194/jsss-7-517-2018
Zou, W., and Rolland, J. P. (2005). Iterative zonal wave-front estimation algorithm for optical testing with general-shaped pupils. J. Opt. Soc. Am. A 22 (5), 938–951. doi:10.1364/josaa.22.000938
Zuo, C., Feng, S., Huang, L., Tao, T., Yin, W., and Chen, Q. (2018). Phase shifting algorithms for fringe projection profilometry: A review. Opt. Lasers Eng. 109, 23–59. doi:10.1016/j.optlaseng.2018.04.019
Zuo, C., Huang, L., Zhang, M., Chen, Q., and Asundi, A. K. (2016). Temporal phase unwrapping algorithms for fringe projection profilometry: A comparative review. Opt. Lasers Eng. 85, 84–103. doi:10.1016/j.optlaseng.2016.04.022
Keywords: deflectometry, optical inspection, surface inspection, optical metrology, 07.60.–j optical instruments and equipment
Citation: Burke J, Pak A, Höfer S, Ziebarth M, Roschani M and Beyerer J (2023) Deflectometry for specular surfaces: an overview. Adv. Opt. Technol. 12:1237687. doi: 10.3389/aot.2023.1237687
Received: 09 June 2023; Accepted: 13 June 2023;
Published: 25 July 2023.
Copyright © 2023 Burke, Pak, Höfer, Ziebarth, Roschani and Beyerer. This is an open-access article distributed under the terms of the Creative Commons Attribution License (CC BY). The use, distribution or reproduction in other forums is permitted, provided the original author(s) and the copyright owner(s) are credited and that the original publication in this journal is cited, in accordance with accepted academic practice. No use, distribution or reproduction is permitted which does not comply with these terms.
*Correspondence: Jan Burke, SmFuLkJ1cmtlQGlvc2IuZnJhdW5ob2Zlci5kZQ==
†ORCID ID: Jan Burke, orcid.org/0000-0002-0608-4765; Alexey Pak, orcid.org/0000-0002-6753-3560