Corrigendum: Understanding variability and repeatability of enteric methane production in feedlot cattle
 Karen A. Beauchemin
 Paul Tamayao
 Christine Rosser
 Stephanie A. Terry
 Robert Gruninger
- Lethbridge Research and Development Centre, Agriculture and Agri-Food Canada, Lethbridge, AB, Canada
Breeding ruminants for low methane (CH4) emissions can be permanent and cumulative, but requires a better understanding of the variability of CH4 production among animals to accurately assess low-CH4 phenotypes. Our objectives were to: 1) investigate the variation in CH4 production among and within growing beef cattle, 2) identify low-CH4 emitters, and 3) examine relationships between CH4 production and intake, feeding behavior, growth, and rumen fermentation. Crossbred beef heifers (n=77; body weight=450 kg) were allocated to 3 pens and offered a finishing diet of 90% concentrate and 10% silage (dry matter (DM) basis). The study was conducted over 3 consecutive 6-week periods (126 days). GrowSafe bunks measured individual animal DM intake (DMI) and rumen fluid was sampled orally each period. A GreenFeed system measured individual animal emissions for 2 weeks/period. Methane production was calculated by animal within period using visits that were ≥3 min with fluxes compiled into six 4-h blocks corresponding to time of day, and averaged over blocks to obtain an average daily emission for the period. Animals with <12 visits and <5 blocks were omitted for the period and animals with ≥2 periods of complete CH4 data were used in the final analysis (n=52). Animals were ranked based on CH4 yield (g/kg DMI) from low to high, and grouped as Very-low (≤10% of animals), Low (11-25%), Intermediate (26-74%), High (75-89%), and Very high (≥90%) emitters (mean ± SD, 12.6 ± 2.16). The CH4 yield was 16% less (P<0.05) for Very-low compared with Intermediate animals due to lower CH4 production (g/d, P<0.05), with no differences in DMI (P>0.05). However, the period × grouping interaction (P<0.001) for CH4 yield indicated that the ranking of animals changed over time, although there were no extreme changes in rankings. Total VFA concentration decreased as CH4 yield decreased, but molar proportions of VFA remained unchanged, suggesting lower extent of ruminal digestion rather than a shift in fermentation. There were no differences in feeding behavior or average daily gain among groupings (P>0.05). The between-animal coefficient of variation in CH4 yield of 17.3% enabled identification of low CH4-emmitting finishing beef cattle. However, accurate selection of low CH4-emitting animals should be based on repeated CH4 measurements over the production cycle.
1 Introduction
More than 120 countries and interested parties recently signed the Global Methane (CH4) Pledge to reduce CH4 by 30% from 2020 levels by 2030 (www.globalmethanepledge.org). Because CH4 is a potent, but short-lived greenhouse gas, its reduction is viewed as a highly effective means of limiting global warming to 1.5°C. While much of the focus has been on the energy sector, there is increasing interest in the potential to mitigate enteric CH4 from ruminant livestock production.
Methane production (MP; g/d) is a function of dry matter (DM) intake (DMI), diet composition, rumen fermentability and the animal’s genetics, physiology and microbiome (Beauchemin et al., 2020). Consequently, it varies during the production cycle of the animal (Rischewski et al., 2017; Coppa et al., 2021). Numerous thorough reviews have discussed possible enteric CH4 mitigation strategies (e.g., Hristov et al., 2013; Beauchemin et al., 2020). The main mitigation solutions proposed are intensification of animal production, dietary manipulation, alteration of rumen fermentation using feed additives, immunization, and genetic selection of low CH4-producing animals.
Many of the nutritional strategies are limited to highly managed production systems that use total mixed rations, and few mitigation solutions are applicable to grazing animals. One notable exception is animal breeding programs that incorporate selection for low-CH4 emitting animals, which have wide applicability as they are not limited to a particular production system (Pickering et al., 2015; Rowe et al., 2019). Methane production in cattle has been shown to have low to moderate heritability (0.11 to 0.40; Pickering et al., 2015; Hayes et al., 2016; Manzanilla-Pech et al., 2021), which allows it to be incorporated within breeding goals. The objective is to exploit the natural animal variation in CH4 emissions among animals to make permanent and cumulative reductions in CH4 emissions (Hayes et al., 2016), without negative effects on feed digestibility and animal performance. A major constraint to incorporating MP in genetic selection programs is the difficulty of characterizing the CH4 phenotype of a large number of animals. Furthermore, genetic selection of low-CH4 animals requires that this trait be repeatable and maintained over time. Thus, understanding the variability and repeatability of MP of animals is important for genetic selection programs. Similarly, it is of interest for development of dietary CH4 mitigation strategies because most nutrition studies assign animals to treatments without baseline measurements of CH4 for the individual animals. It may be advantageous to first characterize the animals as high- and low-emitters to better understand whether these animal phenotypes respond similarly to mitigation.
Traditionally, enteric CH4 has been measured using animals fed controlled diets in respiratory chambers and expressed relative to DMI as CH4 yield (MY; g CH4/kg DMI) to account for changes in feed intake and diet composition. However, measurements in respiratory chambers are limited to a small number of animals, and do not represent the production environment of the animals. In recent years other methods of measuring enteric CH4 have gained popularity, especially the commercial GreenFeed (GF) system (C-Lock, SD), which can be used for grazing animals as well as animals housed indoors or outdoors, in groups or individually. Unlike respiratory chambers that estimate an emission each day, the GF system estimates an average emission over a number of days based on spot samples spread over 24-h daily cycles (Hammond et al., 2016).
There is uncertainty as to the repeatability of CH4 production within animals over time. (Pinares-Patino et al., 2011, 2013) used respiratory chambers and reported that MY for sheep was a repeatable trait across ages and diets. However, Rischewski et al. (2017) concluded that the ranking of dairy cows according to MY was not consistent over a lactation regardless of whether respiratory chambers or GF was used. Similarly, with dairy cows fed a range of diets with CH4 yield measured over 26 weeks, Coppa et al. (2021) reported that the ranking of individual cows as low-emitters using the GF system was not stable over time within a diet. Furthermore, there was a lack of persistence in the rankings even between two subsequent periods of 2 weeks. Few studies have examined the long-term CH4 rankings of beef animals, thus further study of the variability and persistency of the CH4 trait is needed prior to incorporating it into CH4 mitigation research objectives.
The objectives of the study were to 1) investigate the variation in CH4 production measured using the GF system in a uniform group of beef cattle fed a finishing diet, 2) identify high- and low-CH4 emitting animals, 3) determine the repeatability of CH4 yield of the cattle over the finishing period, and 4) examine factors including body weight, DMI, feeding behavior, and rumen fermentation end-products that may contribute to CH4 variability. We hypothesized that the variability in daily MY among feedlot cattle fed a high-concentrate diet and managed similarly, could be used to identify high- and low-CH4 emitting animals, and that these rankings would remain consistent throughout the finishing phase.
2 Methods
2.1 Experimental design, animals, diet
The experiment was conducted at the Beef Cattle Research Feedlot of Agriculture and Agri-Food Canada, Lethbridge Research and Development Centre (Lethbridge, AB) in accordance with guidelines of the Canadian Council on Animal Care (2009) and was preapproved (protocol #ACC1913) by the Institutional Animal Care and Use Committee.
The study was conducted as a randomized complete block design, with body weight (BW) class as the blocking factor and animal as the experimental unit. Measurements were conducted over 3 consecutive 6-week periods for a total of 126 days.
A uniform group of 75 crossbred heifers was purchased from a single cow herd for the study. Several days after arrival at the center’s Research Feedlot, the heifers were weighed (non-fasted) on 2 consecutive days and stratified into 3 weight classes (mean BW ± SD): light (381 ± 23 kg), medium (417 ± 9.0 kg), and heavy (452 ± 14.1 kg) with 25 cattle per group. The groups were then assigned to 3 feedlot pens (86 × 46 m, 158 m2 per animal), exceeding the minimum recommended space requirement (19-28 m2 per animal) of the Canadian Council on Animal Care (2009) for feedlot operations. Each pen was equipped with 5 automated feeding stations (GrowSafe System Ltd, Edmonton, AB, Canada) to measure individual animal feed intake and feeding pattern daily. The heifers were ear-tagged with a radio frequency identification transponder button (Allflex Canada, St-Hyacinthe, QC), allowing them to be identified when using the feeding station. The identification number of each steer was transmitted when the radio frequency identification transponder was within 0.5 m of the antenna and the feed bunk load cells were read at 1-min intervals. Animals were fed once a day for ad libitum intake (5% refusals) and refusals were removed weekly. The cattle had free access to water and the pens were bedded with barley straw away from the feed bunks as needed throughout the study. Animal health was monitored daily.
A 5-week transition period was used to gradually adapt to the cattle to the feedlot finishing diet that was fed to all animals during the study. The transition period also enabled the animals to become familiar with the CH4 emission monitoring system described below. A feeder wagon equipped with a mixing auger and a weigh scale was used to prepare the diets as total mixed rations (TMR). The diet was formulated to supply crude protein, macro- and micro-minerals, and vitamins to meet the nutritional requirements of finishing beef cattle (NASEM, Table 1).
TABLE 1
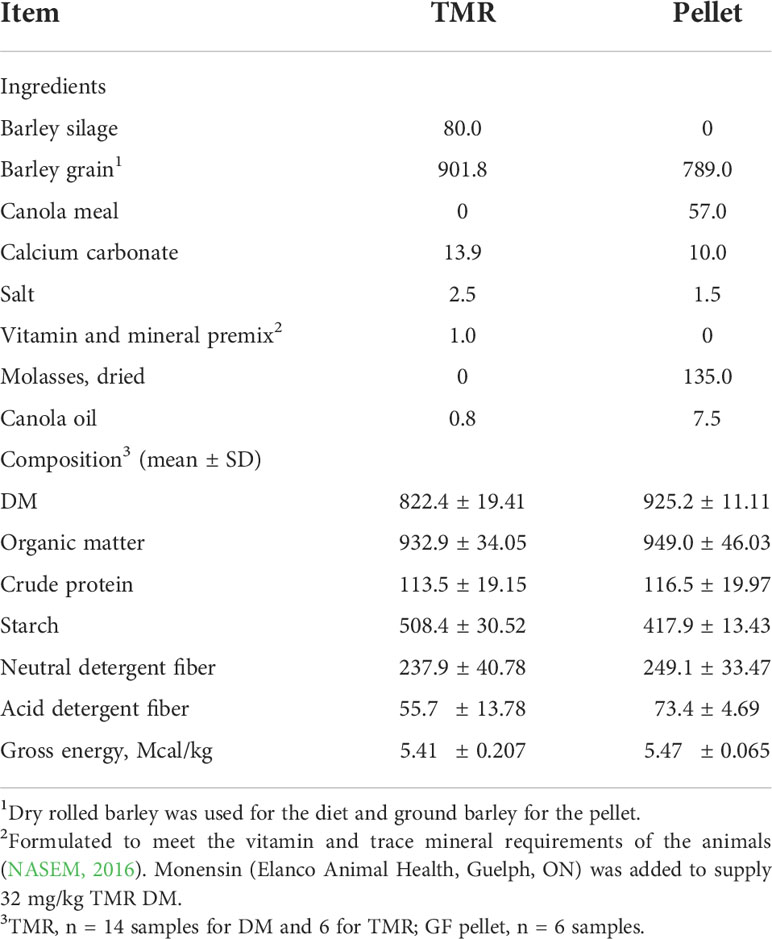
Table 1 Composition of the finishing total mixed ration (TMR) and pellet delivered by the GreenFeed system (g/kg of DM).
2.2 Measurements
2.2.1 Dry matter intake and feeding behavior
The DMI from the GrowSafe feed bunks was calculated by summing the intakes of TMR at each feeding event during the 24-h cycle, corrected for the DM concentration of TMR. The DM consumed as pellet in the GF system was calculated from the number of pellet drops per 24-h multiplied by the average weight of the pellets, corrected for DM concentration of pellets. To determine DM concentration, samples of ingredients and TMR were collected weekly and dried in a forced-air oven at 55°C for 48 h. Weekly silage DM content was used to adjust the ingredient proportions of the diets if DM deviated by >3% from the average. The weekly samples collected were pooled by 3-wk periods and stored at −20°C until analyzed. Samples of pellets offered in the GF system were collected every period for DM and chemical analysis.
Eating behavior of individual steers was based on the information from the GrowSafe feeding system. The behaviors were described as feeding time (total amount of time spent each day at the feed bunks), feeding rate (amount of DM consumed per day divided by feeding time), number, size and length of meals, and intermeal duration, as described by Koenig et al. (2020). A meal was defined as a visit to the bunk followed by an absence from the bunk of 300 s or more and meal size was the amount of feed DM consumed per meal.
2.2.2 Methane
Enteric CH4 was measured using a GF system (C-Lock Inc., Rapid City, SD, USA) that recorded individual animal CH4 emissions for 2-weeks per group (pen) in each of the 3 periods, such that measurements were separated by 4 weeks. A GF system was placed in one of the pens, and fencing was installed to permit only one animal to access the system at a time. Every 2 weeks, the entire group of animals within a pen without GF system were exchanged with the group of animals in the pen containing the GF system. This rotation of animals ensured that each pen of animals had access to the GF system for 2 weeks each period and access to all pens each period. Moving the animals controlled any possible pen effects and allowed for CH4 measurements over the study using a single GF system. Details on the use of the GF system in this manner were reported by Alemu et al. (2021).
The GF system allows free movement of animals (in and out of the system) and gasses are measured when the animal’s head is in the “head chamber” unit as determined by the proximity sensor. The principles of measuring enteric CH4 emissions using the GF system in a pen of animals have been published in detail elsewhere (Alemu et al., 2021). The infrared gas analyzer and the air flux sensor were calibrated and the air filter was cleaned and changed regularly (every 3 to 5 d). To entice animals to enter the GF system, pellets were dispensed as bait from an overhead hopper when their head was in close proximity to the head chamber sensor (Table 1). The animals could visit the system anytime during the day but they received a maximum of six drops per visit (36 pellet drops per 24 h) to restrict the amount of pellets consumed. Additionally, the animals had to wait for 4 h between GF visits to receive pellets.
2.3 Body weights, fecal pH and rumen fermentation
At the start of Period 1 and at the end of each period, the cattle were weighed individually (non-fasted) prior to morning feeding (double weigh days at the start, single day/period thereafter). At the end of each period after the animals were weighed, fecal samples (approximately 100 g) were collected from the rectum of each animal. Rumen fluid samples (approximately 100 mL) were also collected from each animal at the end of each period using a flexible tube inserted through the mouth and into the rumen. A vacuum pump was used to extract rumen fluid. Rumen sampling was conducted for approximately one half of the animals (same animals each time) as it was not possible to sample all 75 animals. Each sample was strained through a polyester screen (355 μm pore size; B & S H Thompson, Ville Mont-Royal, QC, Canada) and 5 mL of filtrate was preserved with either 1 mL of 5% (w/v) metaphosphoric acid for volatile fatty acid (VFA) analysis or 1 mL of 1% (v/v) H2SO4 for ammonia-nitrogen (NH3-N) analysis. Samples were then stored at −20°C until analyzed.
2.4 Chemical analysis
The pH of fresh fecal samples was determined immediately upon collection using a pH meter. Dried feed samples were ground in a Wiley mill (Thomas Scientific, Swedesboro, NJ) through a 1-mm screen. Analytical DM content of the ground samples was determined by drying at 135˚C for 2 h (method 930.15; AOAC, 2016). The neutral (NDF) and acid detergent fiber (ADF) concentrations were determined sequentially using an Ankom A200 fiber analyzer (Ankom Technology, Macedon, NY), with heat-stable amylase and sodium sulfite used for NDF analysis. Samples were ground to a fine powder using a ball grinder (Mixer Mill MM2000; Retsch GmbH, Haan, Germany) before determining nitrogen and starch concentrations. The nitrogen concentration (crude protein = nitrogen × 6.25) was determined by flash combustion, gas chromatographic separation, and thermal conductivity detection (AOAC, 2016, method 990.03; Carlo Erba Instruments, Milan, Italy) and starch concentration was determined by enzymatic hydrolysis and colorimetric detection of glucose as described by Koenig et al. (2013).
2.5 Calculations and statistical analysis
Daily DMI for each animal was calculated as the daily sum of DM consumed as TMR in the GrowSafe feed bunks and DM consumed as pellet in the GF system. Daily DMI were averaged for the period by animal. Average daily gain (ADG) was calculated by period for each animal using the start and end BW divided by the number of days in each period (42 d).
Daily CH4 emission of individual animals was calculated for each period by aggregating the fluxes at each visit to the GF system over the 2-weeks of measurement. Only fluxes from visits ≥3 min were used. The fluxes were compiled into six 4-h time blocks and an average flux was calculated for each block (Manafiazar et al., 2017). The mean daily CH4 production was calculated by averaging over the time blocks to ensure the full 24-h cycle of emission was represented. Animals with infrequent visits to the GF system (<12 visits) or those with missing data for 2 or more of the time blocks were removed from the period. As visitation to the GF system is not evenly distributed throughout the 24 h period, using the time block method provides more accurate results, especially when frequency of visitation is low (Manafiazar et al., 2017). Furthermore, only animals that had complete CH4 data for at least 2 of the 3 periods were retained for the final analysis (n=52 animals).
The normality of distribution and homogeneity of variance of the data were determined using the UNIVARIATE procedure of SAS (SAS Inst. Inc., Cary, NC). The MY (g/kg DMI) data were analyzed using the MIXED procedure of SAS using a model that included the fixed effect of weight class (light, medium, and heavy), period (as a repeated measure), and weight class × period. The best time-series covariance structure was selected on the basis of the lowest Akaike and Bayesian information criteria and compound symmetry was used. The weight class was found to be non-significant (P>0.05), thus the data were combined over weight classes. The 52 animals were ranked in ascending order from low to high MY within period and over the study (averaged over the periods). The animals were then assigned to groups as: very low (VL, 10% of the animals with lowest MY), low (L, 11-25%), intermediate (IM, 26-74%), high (H, 75-89%), and very high (VL, 90-100%) emitters. The data for CH4 production (g/d), DMI, feeding behavior, ADG, and rumen fermentation were then analyzed using the MIXED procedure of SAS (SAS Inst. Inc., Cary, NC) using a model that included the fixed effect of MY grouping (VL, L, IM, H, VH), period (repeated measure) and MY grouping × period interaction. The best time-series covariance structure was selected on the basis of the lowest Akaike and Bayesian information criteria and compound symmetry was used. Least square differences were used to determine significant differences among MY groupings. Least squared means are presented in the tables and statistical significance was declared at P<0.05 with trends discussed at 0.05≤P ≤ 0.10. Pearson correlations among variables averaged by animal for the study were determined in SAS using the CORR procedure. The consistency of the ranking of individuals across periods was examined to determine the stability of CH4 emission over time. The repeatability of MY over time was assessed by calculating Pearson correlation coefficients (r) between measurement periods. Additionally, the repeatability of MY for high- (VH and H) and low- (L and VL) emitting cattle was estimated as the ratio between variances of the 52 animals (VarA) and the sum of variances of animals and residual error (VarR), according to the following formula: Repeatability (R) = VarA/(VarA + VarR) (Cabezas-Garcia et al., 2016). The VH and H groups and L and VL groups were combined to provide sufficient animal numbers for high- and low-emitting groups, respectively.
3 Results
The 52 animals visited the GF system (mean ± SD) 20.6 ± 4.79 times per period in 5.7 ± 0.39 time blocks (data not presented), thus the diurnal pattern of emissions was represented. The MY averaged (mean ± SD) 12.6 ± 2.18 g/kg DM with a median of 12.5 g/kg DM. The between-animal coefficient of variation (CV) for MY was 17.3% and the within-animal CV (across periods) was 10.8%.
As expected, the MY of each of the five MY groups differed (P<0.001). The MY of the VL and L groups were 26% and 12% less than that of the IM group (12.4 g/kg DM, SEM = 0.22), respectively, and the MY of H and VH groups were 17% and 40% greater than the IM group, respectively (Table 2). However, the magnitude of the differences among the groups depended upon the period (group × period interaction, P<0.001; Table 3). The magnitude of differences among groups changed each period mainly due to the H and VH cattle, for which MY increased over time.
TABLE 2
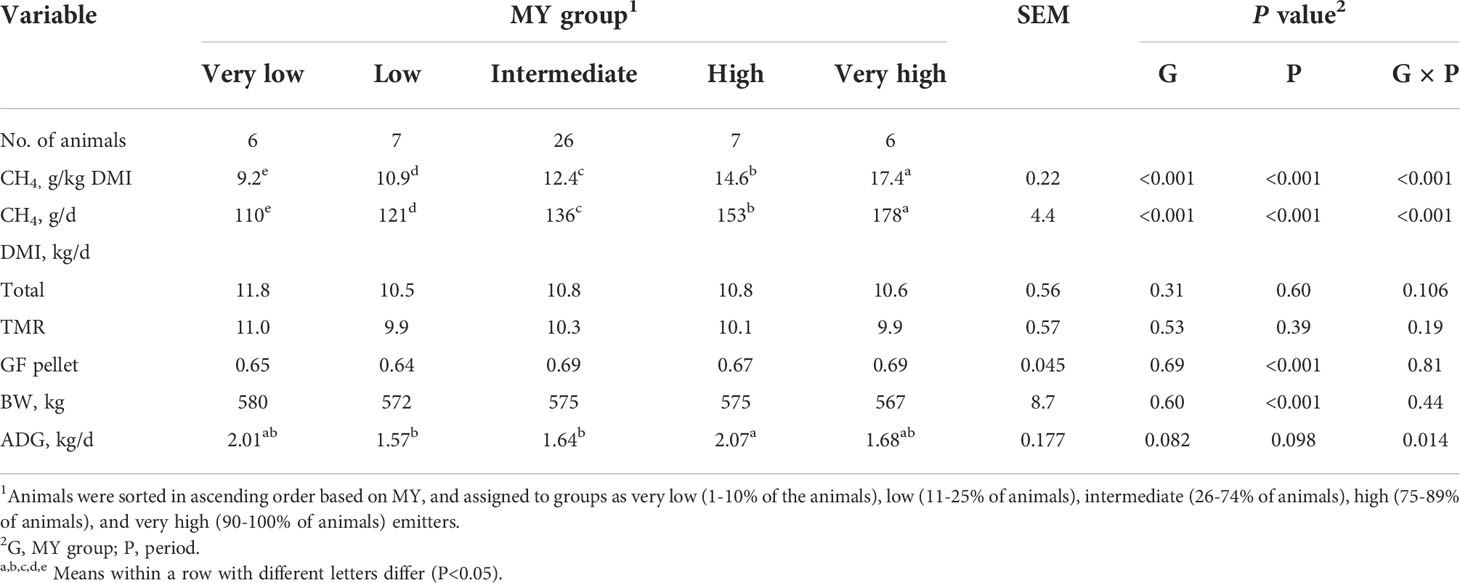
Table 2 Methane (CH4) emissions, dry matter intake (DMI), body weight (BW), and average daily gain (ADG) of heifers by methane yield (MY) group.
TABLE 3
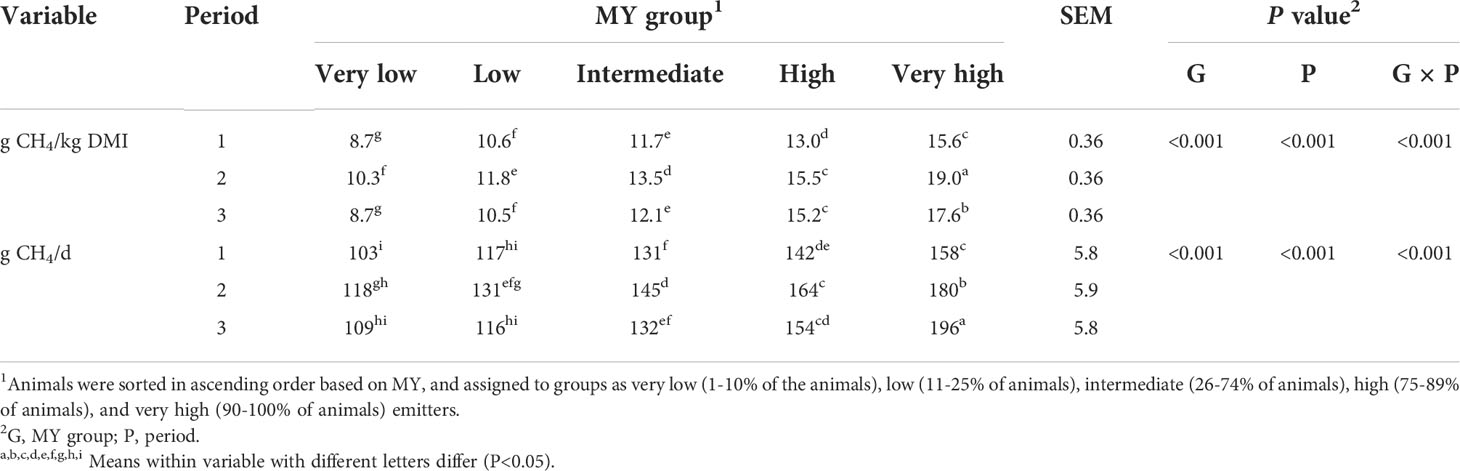
Table 3 Methane (CH4) production of heifers by period and CH4 yield (MY) group.
Overall, MY was highly correlated with MP (r=0.83, P<0.05), but there were no correlations (P >0.05) between MY or MP and the other variables measured, with the exception of fecal pH (MY, r=0.30; MP, r=0.28, P<0.05) and prefeeding rumen pH (MP, r=0.26) (Supplementary Table 1). Similar to MY, MP differed among the five groups (P<0.01, Table 2), with a group × period interaction (P<0.001; Table 3). Overall, the MP of the VL and L groups was 19% and 11% less than that of the IM group, respectively, whereas MP of H and VH cattle was 12% and 30% greater than IM cattle, respectively. Similarly to MY, the interaction for MP was mainly due to the H and VH groups because the differences relative to the IM group increased each period.
Moderately strong relationships were observed between the MY measured in periods 1 and 2 (r= 0.70), 2 and 3 (r=0.60), and 1 and 3 (r=0.82) (Figure 1). The rankings of the individual heifers were examined by period to determine consistency of rankings over time (Figure 2). Roughly half the animals ranked overall as L and VL emitters were ranked IM in at least one period (data not shown). However, none of the L and VL animals ranked H or VH in any period (data not shown), indicating there were no extreme changes in the rankings of the bottom 25% of animals. For the high-emitting animals, the VH animals ranked H or VH in every period, whereas all H animals had at least one period ranked as IM (data not shown). The repeatability of MY across periods was 0.57 and 0.66 for the high- (VH and H) and low- (L and VL) emitting groups, respectively.
FIGURE 1
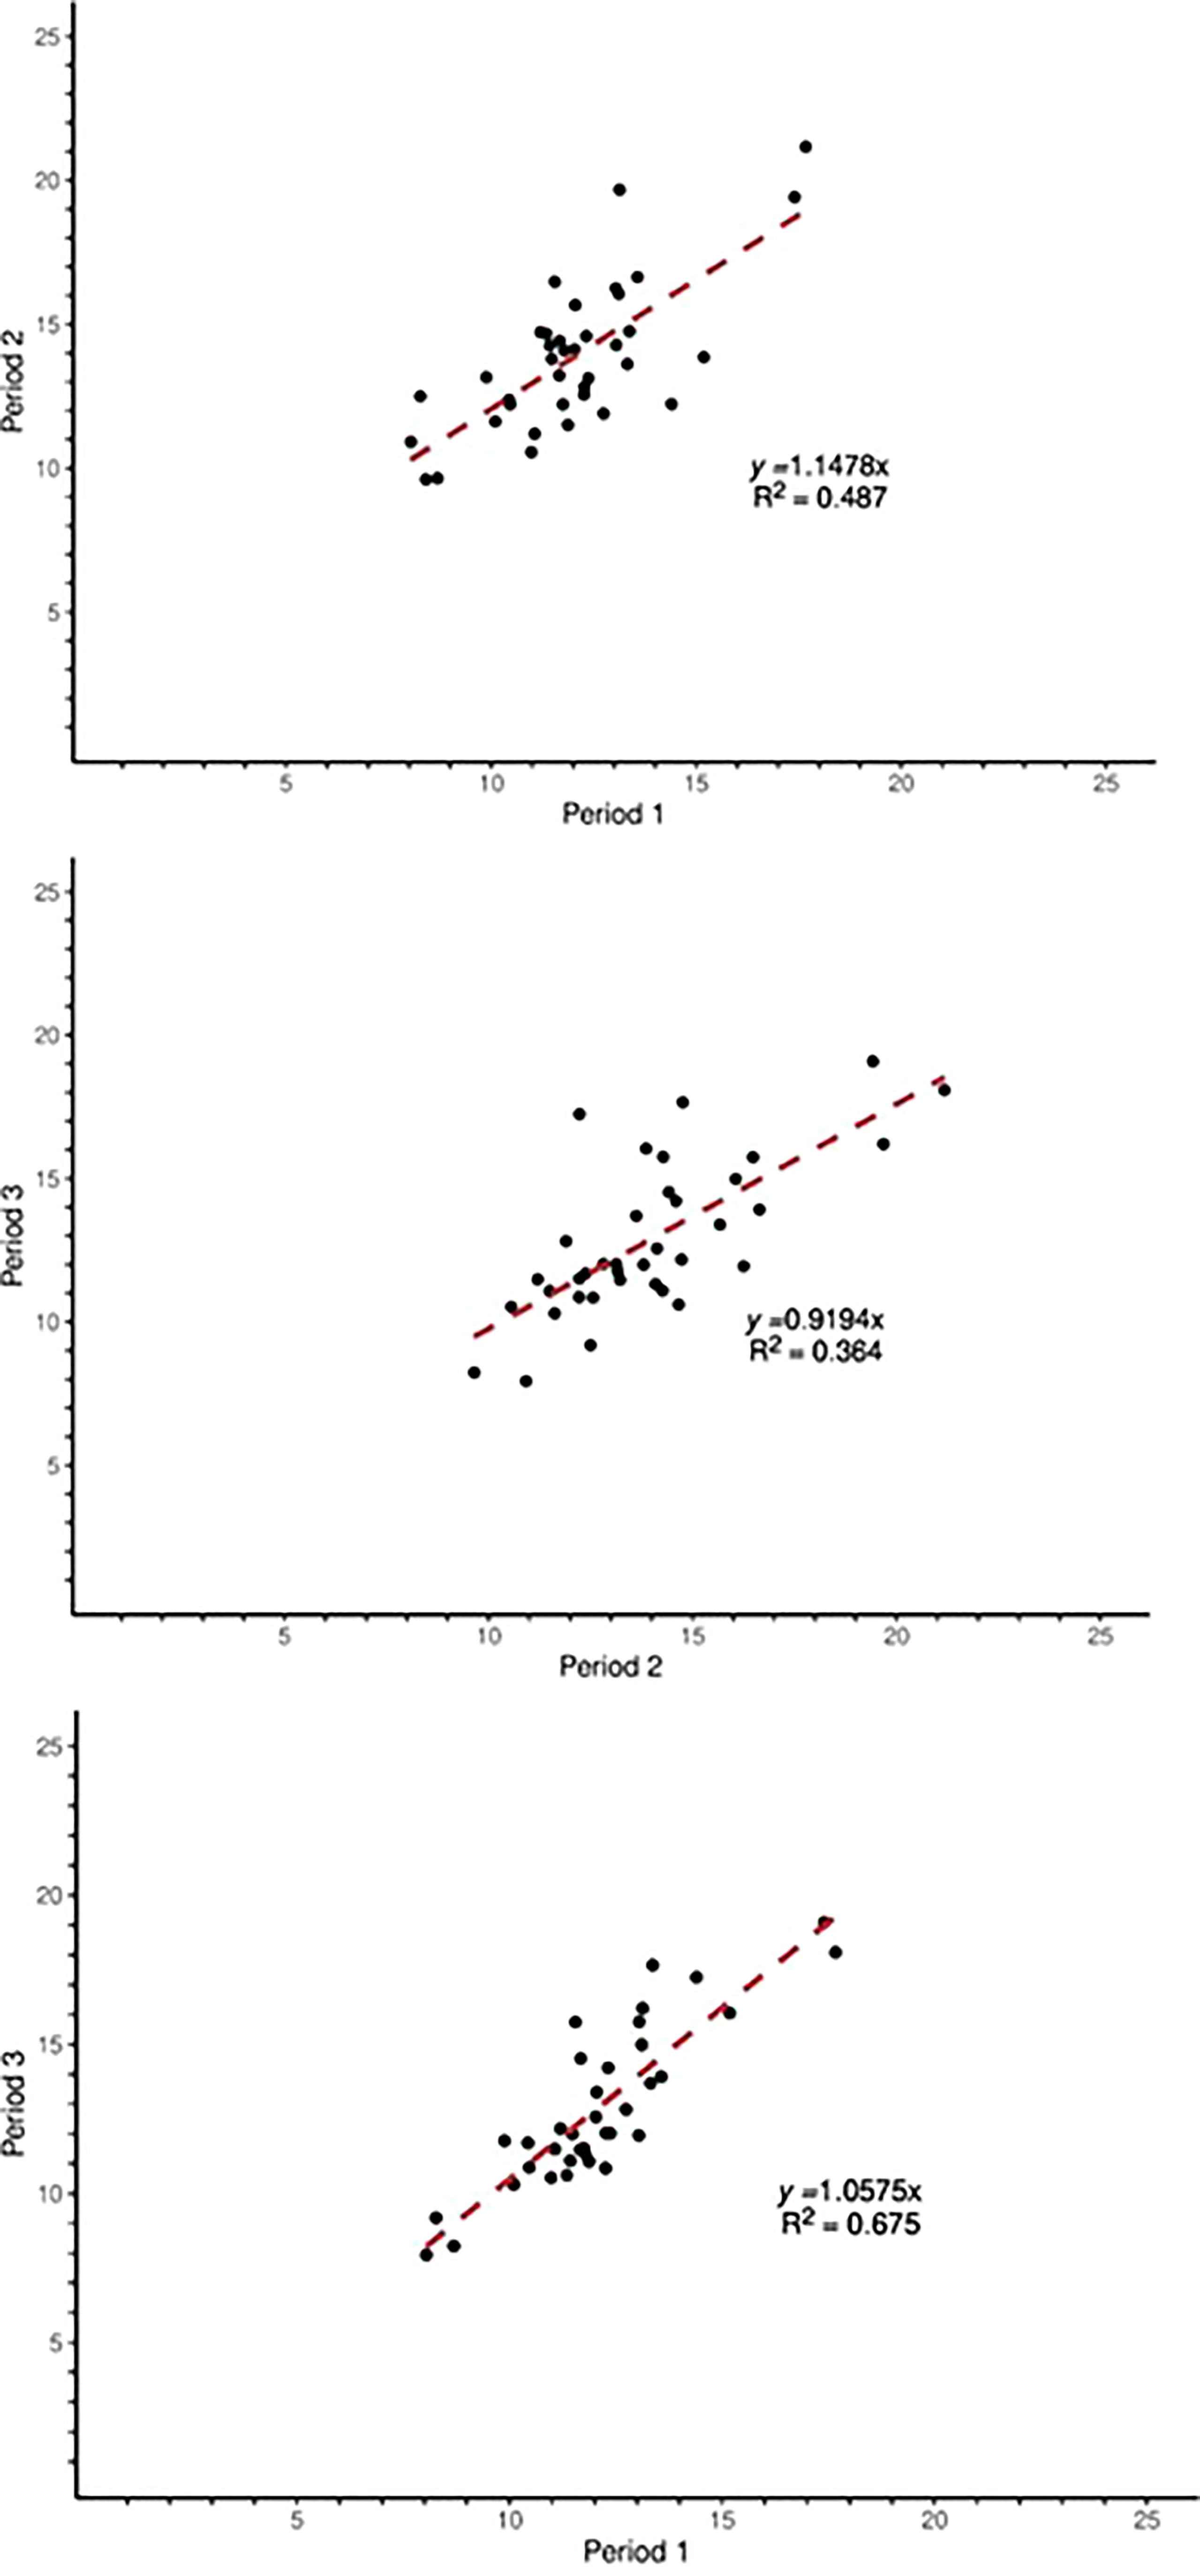
Figure 1 Relationships between methane yield (MY) of individual animals across periods. R2 = coefficient of determination.
FIGURE 2
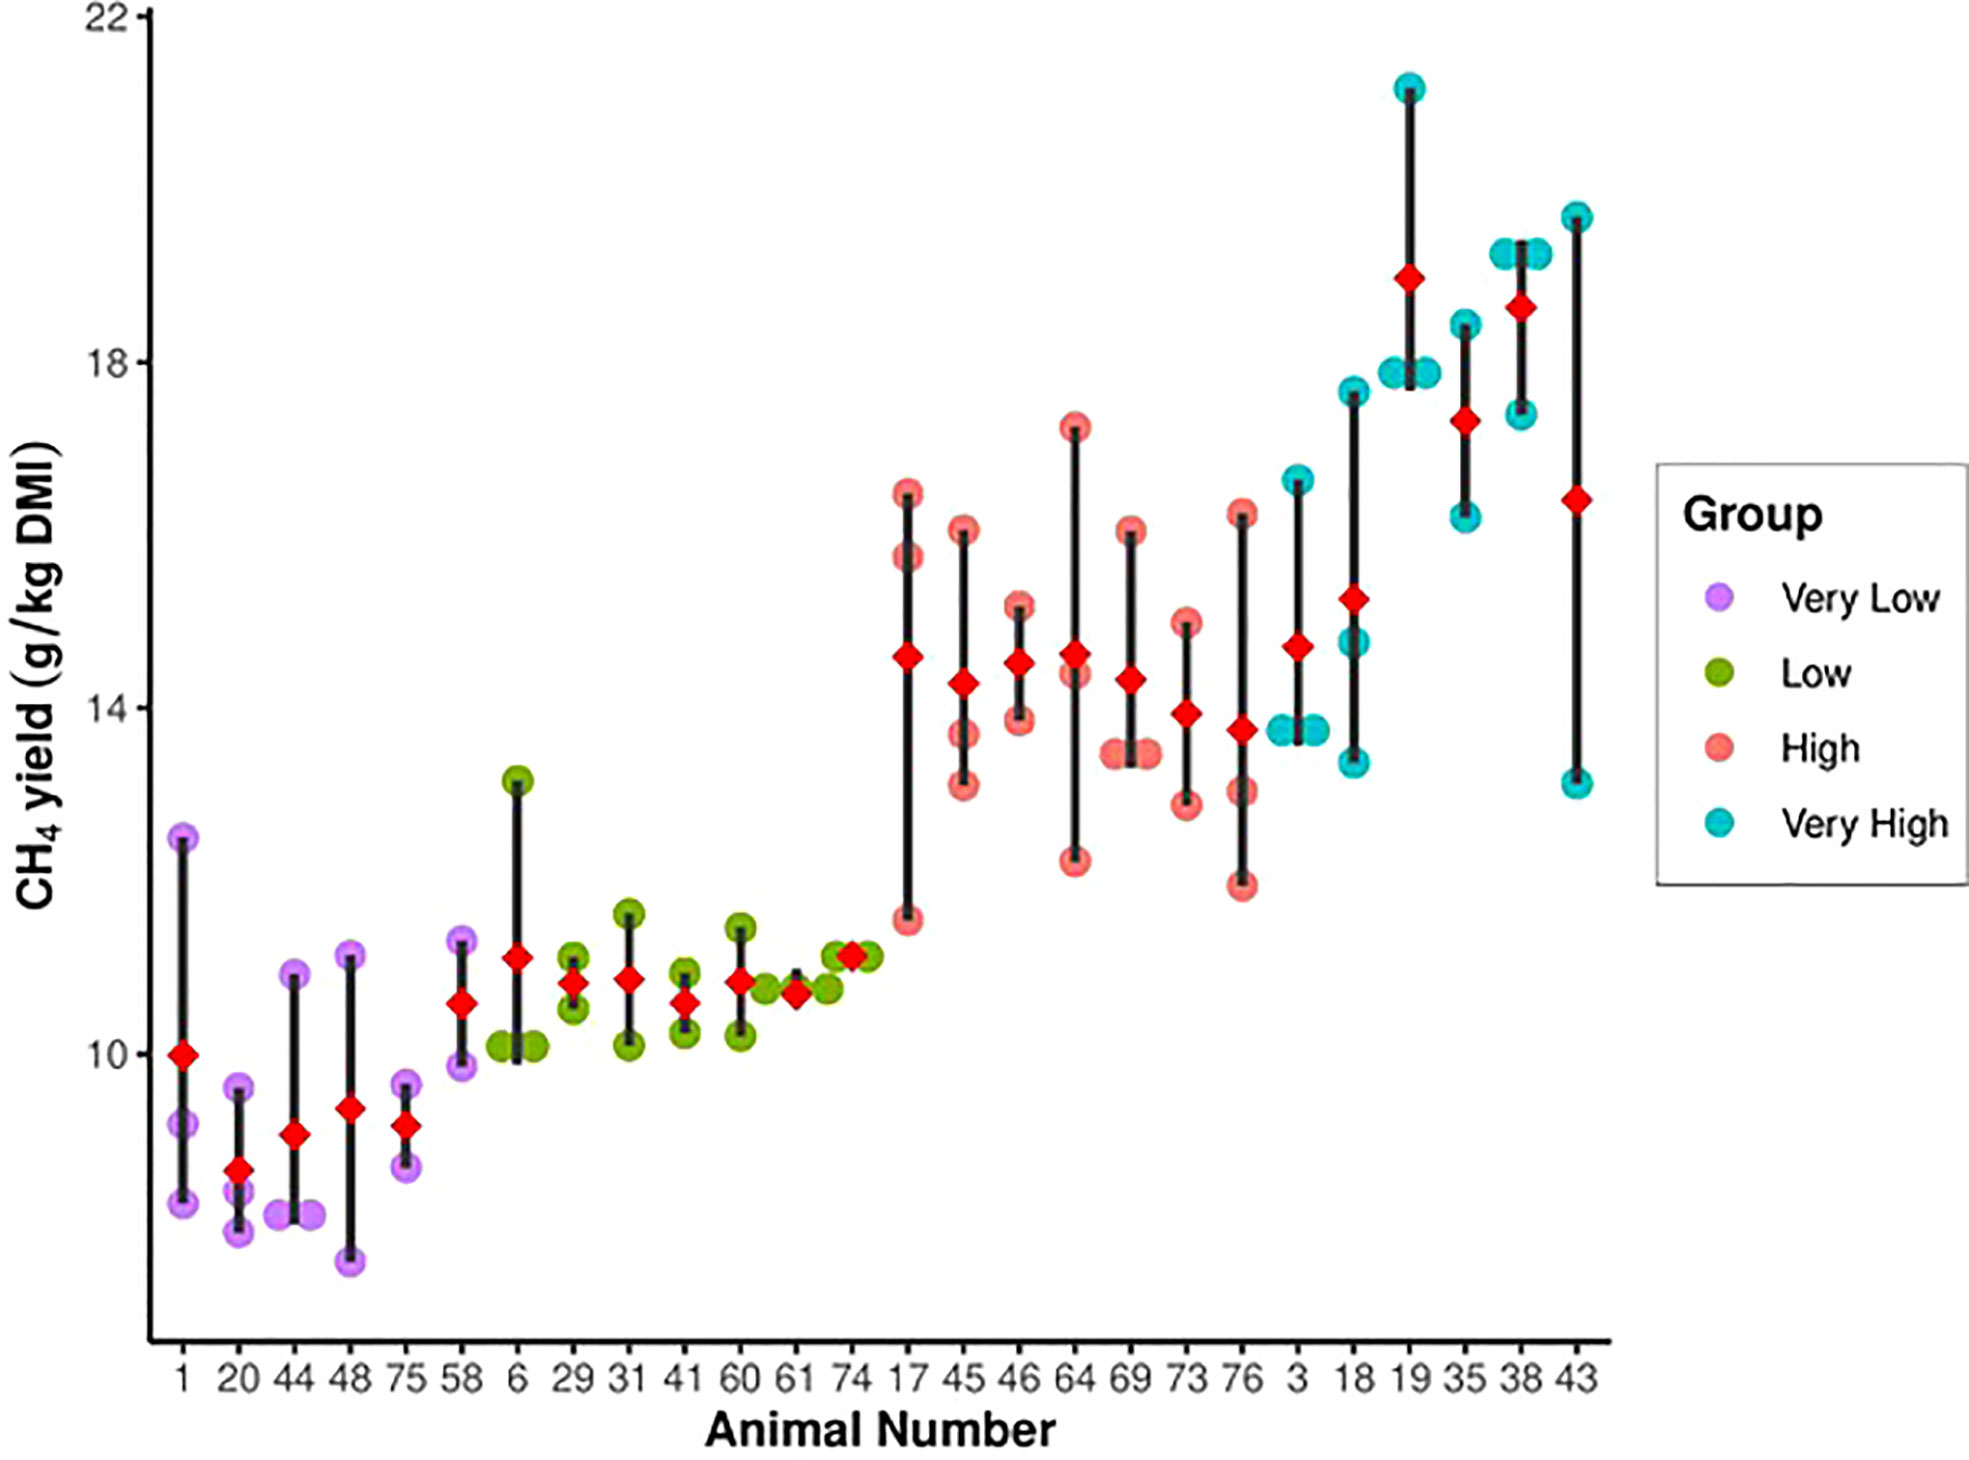
Figure 2 Methane (CH4) yield for animals ranked as very-high, high, low and very-low emitters during the study (intermediate animals not shown). Closed circles indicate period measurements, diamond indicates the mean).
The total DMI of the groups were similar (P=0.31) and consisted of approximately 6% GF pellet and 94% TMR (Table 2). The cattle weighed an average of 574 kg during the study with no differences among the groups (P=0.60). However, the ADG tended (P=0.082) to differ among the groups, with an interaction effect (group × period, P =0.014). The interaction occurred because ADG of the five groups was similar in Periods 1 and 2, but in Period 3, the VL, H, and VH cattle had slightly greater ADG than IM cattle (data not shown).
There were no differences in feeding behavior among the groups (P>0.05; Table 4). The cattle spent on average 50.0 min/d feeding, consumed 224 g DM/min, had 6.8 meals per day of 1.6 kg DM/meal, each meal lasting 8.0 min, and with 218 min between meals.
TABLE 4
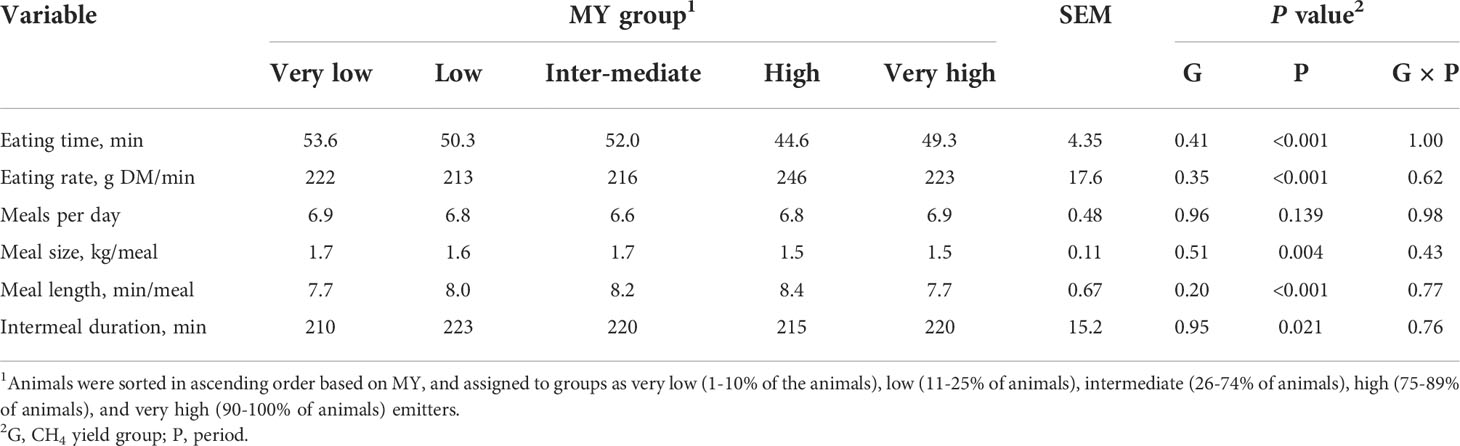
Table 4 Feeding behavior of heifers by methane yield (MY) group.
There was no effect (P=0.85) of MY group on fecal pH (Table 5). However, prefeeding rumen pH was greater (P=0.047) for VL compared with L, H, and VH emitters. Despite similar DMI and feeding behavior among the MY groups, total VFA concentration in rumen fluid increased with MY grouping, such that the total VFA concentration was less for VL compared with H and VH cattle and less for L than H cattle (P=0.043). There were no differences in individual VFA molar percentages among the MY groups (P>0.65), although there was a tendency for a group × period interaction for acetate percentage (P=0.097) because the period effect (P=0.036) was slightly inconsistent among the groups (data not shown). The NH3-N concentration did not differ among the MY groups (P=0.60).
TABLE 5
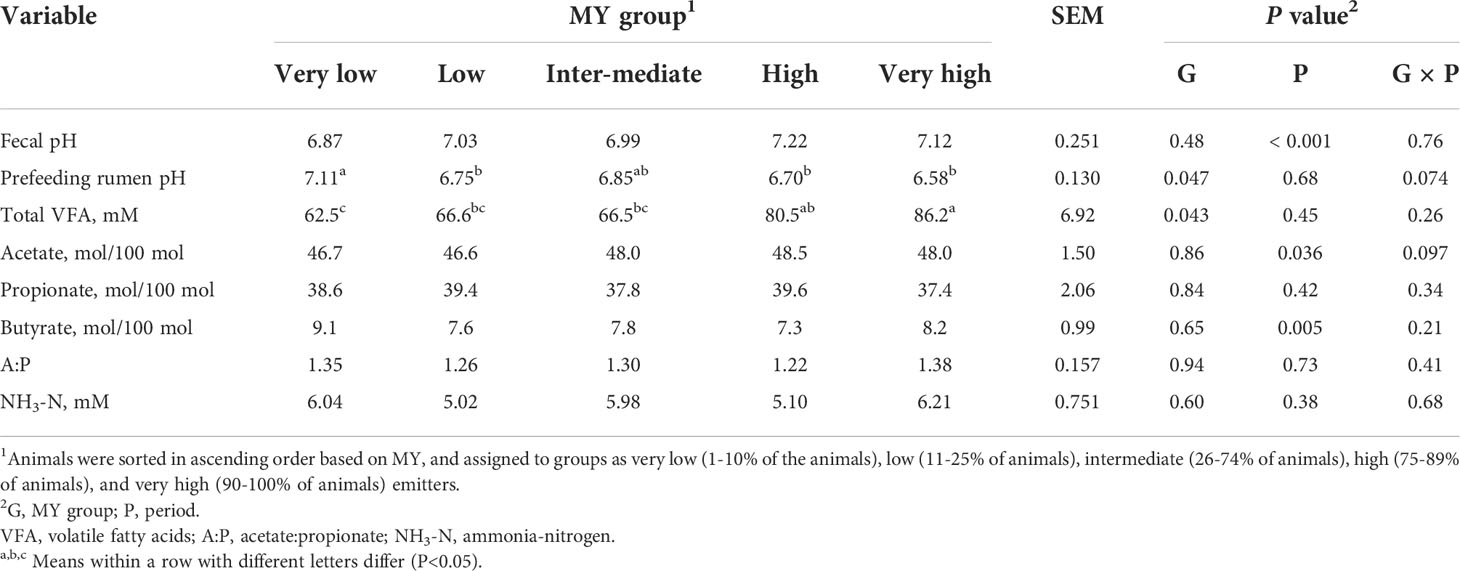
Table 5 Fecal pH and rumen fermentation variables of heifers by methane yield (MY) group.
4 Discussion
The study examined the variability and repeatability of CH4 emissions for feedlot cattle, as well as relationships between CH4 and some related variables that potentially contribute to variation in MY as these relationships are poorly understood (Cabezas-Garcia et al., 2016). The study reports the between-animal and within-animal variability of MY for 52 growing beef heifers over an entire finishing period of 126 days. The analysis was limited to 52 of the 75 animals to ensure sound data were collected from the GF system. In a feedlot setting with animals fed ad libitum, it is typical that not all animals are frequent GF users, as discussed by Hammond et al. (2016). The cattle were selected from a single herd and fed a common diet to minimize variation due to breed (Islam et al., 2021) and diet (van Lingen et al., 2019).
To our knowledge this is the first study to examine the variability and repeatability of MY for feedlot finishing cattle. The findings from the study have implications for national inventories reporting uncertainties of CH4 emissions for feedlot cattle, as well as for genetic selection and other CH4 mitigation programs. While variability among and within animals contributes to the uncertainty of estimating GHG emissions, it can also be used in genetic selection programs as a means of achieving long-term permanent reductions in enteric CH4 emissions (Pickering et al., 2015). Nutrition-based CH4 mitigation programs are also increasingly interested in variability among animals.
4.1 Variability of methane yield between animals
Using an intercontinental database of individual beef cattle (n=139 animals) fed diets containing ≤ 18% forage DM, van Lingen et al. (2019) reported a mean MY of 15.2 ± 4.29 g/kg DM, ranging from 7.5 to 30.9 g/kg DM. Additionally, the refined Tier 2 methodology of the International Panel on Climate Change adopted a CH4 emission factor (Ym, CH4 energy as a percentage of gross energy intake) of 4.0 for feedlot cattle (excluding steam-flaked corn diets) based on a database with mean MY of 12.99 g/kg DM (n=33 treatment means; Gavrilova et al., 2019). The observed mean MY (12.6 ± 2.18 g/kg DM) in the present study is consistent with these previous estimates of MY for feedlot cattle, and equates to a Ym value of 3.8% (assuming 18.45 MJ/kg DMI and 55.65 MJ/kg CH4), confirming the refined Tier 2 Ym value.
Numerous studies have reported that between-animal variability in MP is greater in animals fed ad libitum versus restrictively (Blaxter and Clapperton, 1965), hence the need to scale CH4 relative to DMI. Consequently, MY was the metric for identifying low- and high-emitting cattle in the present study. The observed between-animal CV of 17.3% for MY in the present study is similar to reports for beef and dairy cattle fed diets containing greater proportions of forage, and measured using both respiratory chambers and GF systems. For example, Donoghue et al. (2013) reported a between-animal CV of 14.0% for MY measured in respiration chambers on 530 young beef bulls and heifers fed a roughage diet at 1.2 times maintenance energy requirements. Manafiazar et al. (2017) reported a CV of 16.7% for MP measured with the GF system for beef heifers fed a silage based diet. For lactating dairy cows fed ad libitum and measured in respiration chambers, Yan et al. (2010) reported a between-animal CV of 17.1% for MP and Grainger et al. (2007) reported a CV of 17.8%. Using GF systems, Ramayo-Caldas et al. (2020) reported a between-cow CV for MP of 13%, Arbre et al. (2016) reported a CV of 17% for MY, and Coppa et al. (2021) reported a CV of 17.1% to 20.5% for MY, depending upon measurement period length. When using the GF system, some of the variation in CH4 production for individual animals can be attributed to the measurement technique as MY is averaged over multiple days of measurement. However, the 14-d measurement period and time of day averaging used in our study would have minimized the variation from the GF technique (Manafiazar et al., 2017).
The between-cow variability enabled the cattle to be individually ranked creating 5 groups that differed significantly in MY. Others have ranked dairy cows according to MY using the GF system (Rischewski et al., 2017; Coppa et al., 2021), but we are unaware of other published studies that report MY rankings of beef cattle. The 36.6% difference in MY between the top and bottom groups substantiates the variation reported by Difford et al. (2018) for 750 lactating Holstein dairy cows from commercial herds using infrared gas analyzers installed on automatic milking machines. In that study, the very-low emitting cows (bottom 10% of cows) produced 41% less MP than the very-high emitting cows (top 10% of cows). It appears that the between-animal variability in beef cattle fed a finishing diet is similar to that reported for cattle fed mixed and high-forage diets, and allows for identification of high- and low-emitting animals.
4.2 Variability and repeatability of methane yield of individual animals over time
Selection of low-emitting animals requires consistent characterization of animals for MY, and thus if MY substantially changes over time, the ability to identify divergent individuals weakens. The within-animal CV for MY of 10.8% supports previous studies that showed variability of CH4 within animal was less than between-animals (Grainger et al., 2006). However, most studies report day-to-day variability, such as variability over consecutive days in respiratory chambers (Grainger et al., 2006). In the present study, within animal variability was examined over the long-term with MY of individual animals determined over 2-weeks in 3 measurement periods that were separated by 4 weeks. Pinares-Patiño et al. (2015) reported in sheep that the repeatability of MY measurements in respiratory chambers over adjacent days was 3-times greater than the repeatability of measurements separated by 2 weeks. Using the GF system, Coppa et al. (2021) reported that longer measurement periods further improved repeatability of MY estimates, with repeatability increased from 0.39 to 0.62 for dairy cows when using two 8-wk periods rather than sixteen 1-wk periods.
The correlation coefficients between Periods 1 and 2 (r=0.70), Periods 2 and 3 (r=0.60), and Periods 1 and 3 (r=0.82) indicates that overall, the MY of the individual animals across the three periods was relatively consistent (Figure 1). The relatively high correlation coefficients were supported by relatively high repeatabilities (0.57 and 0.56) of MY for high and low groups. In contrast, Oddy et al. (2019) reported relatively low repeatability of MY in sheep (correlation coefficients of 0.02 to 0.24), but the measurements were taken over different ages and physiological stages.
Despite relatively high repeatabilities and correlations between periods in the present study, the rankings of individual animals for MY by period were not always consistent. However, the changes in rankings from period to period were relatively moderate to minor, and there were no extreme changes in rankings. These results contrast with findings for dairy cows measured using the GF system where the MY ranking of individual cows was not stable in 2 consecutive 8-week periods or even between 2 consecutive periods of 2 weeks (Coppa et al., 2021). These authors reported that the extreme cows changed ranking in the periods, which was not observed in our study. Similarly, Goopy and Hegarty (2004) reported that the ranking of beef steers as high- and low-emitters when fed a high concentrate diet was not maintained when a forage diet was fed. They concluded that an assessment of an animal’s CH4 phenotype is diet specific. Further assessments are needed as it is evident that there is inconsistency in the conclusions about CH4 repeatability within animals, which may be due to the protocols used in the various studies.
Had the CH4 measurements been made in only one period, with the objective of identifying the bottom 25% of animals (L and VL), 15% to 23% of the animals (2 to 3 of the 13 animals) in each period would have been misidentified because they ranked as IM. Alternatively, 15% to 23% of the animals would have been identified as L and VL, when in fact they were IM animals when ranked over all 3 periods. To select low CH4-emitting animals on a larger scale (e.g., as part of a genetic selection program), the potential error rate would have to be weighed against the added labor and expense of making repeated CH4 measurements over longer durations.
4.3 Relationships between methane yield and other variables
The differences in MY for the groups were due to differences in MP rather than differences in DMI. The implication of this finding is that animals fed a common diet and standardized for growth stage and BW can be identified as low-and high-emitters based solely on MP. This approach simplifies the process of identifying low CH4 emitters as measuring DMI of individual animals is not practical in most commercial beef operations.
There is interest in identifying simple biomarkers to eliminate the need to measure MP of individual animals on farm due to the difficulty and cost of CH4 measurement (Negussie et al., 2017). It has been suggested that animals with a faster eating rate, would have shorter retention time of feed in the rumen, resulting in lower CH4 production (Pickering et al., 2015). However, the lack of relationship between eating rate and DMI (r=0.06, P>0.05) and between eating rate and MY (r=0.08, P>0.05) indicates that DMI and feeding behavior cannot be used accurately to identify low- and high-emitting cattle. This finding is consistent with Jonker et al. (2014) who offered cattle a silage diet at different feeding frequencies and reported that MY yield was not affected.
Cabezas-Garcia et al. (2017) concluded based on a meta-analysis of dairy cow studies that variation in diet digestibility and rumen fermentation pattern did not markedly contribute to between cow-variation in MY. In the present study, the lower total VFA concentration observed for VL compared with H and VH emitters, despite similar DMI, suggests less organic matter was fermented in the rumen of VL cattle possibly indicating shorter retention time of digesta in the rumen or decreased ruminal digestibility. Reduced organic matter fermentation in the rumen of VL emitting cattle is also supported by the observed higher prefeeding rumen pH for that group. Shorter retention time of digesta can occur due to faster rate of passage as a result of greater DMI, animals having smaller rumen volumes, or both. However, the lack of differences in DMI among the MY groups would suggest that faster passage rate may have been due to animals having smaller rumens, although rumen volume was not measured in our study. The lack of differences in DMI among the MY groups was not surprising given that metabolic rather than physical factors control feed intake of cattle fed high-concentrate diets (Allen, 2014). For sheep, Oddy et al. (2019) reported a positive association between rumen volume and MY and Pinares-Patiño et al. (2003) reported an inverse relationship between rumen particulate fractional passage rate and MY, explaining 57% of the total variation. In the study by Pinares-Patiño et al. (2003), shorter retention times of feed in the rumen were also associated with decreased total tract digestibility of cellulose. We did not measure digestibility in the present study, but the lack of difference in ADG between the MY groups, coupled with no differences in DMI, suggests no difference in diet digestibility. Lower VFA concentration in the rumens of the low emitting cattle could also be due to differences in their rumen microbiome, thereby altering the fermentation of organic matter (Ramayo-Caldas et al., 2020). As total VFA concentration in the rumen is a result of both VFA production and absorption, it is also possible that the lower VFA concentration of the low emitting cattle was due to more rapid VFA absorption from the rumen.
The lack of differences in molar percentages of VFA among MY groups was unexpected as it is well known that inhibiting methanogenesis (e.g., using feed additives) shifts rumen fermentation from acetate to propionate (Beauchemin et al., 2020). An inverse relationship between MY and the ratio of propionate: (acetate + butyrate) has been reported by others (Pinares-Patiño et al., 2003; Oddy et al., 2014). Thus, the lack of differences in the individual VFA proportions among the CH4 groups, and the lack of significant correlations between MY and individual VFA, was not anticipated. This lack of association between MY and individual VFA molar proportions may be related to the high concentrate diets fed in the study and the resulting high overall proportions of propionate (≥ 37.4 mol/100 mol) observed. Alternatively, it is possible that the low emitters had a different ability to absorb propionate from the rumen compared with the high emitters.
5 Conclusions
The 17% CV for MY among beef cattle fed a high-grain diet was similar to variability reported for other ruminant livestock fed a range of diets. The variation allowed animals to be ranked into five groups that differed in MY with a 36.6% difference between the top and bottom 10% of animals. The MY rankings of the individual animals fluctuated moderately throughout the study with no extreme changes in rankings. Therefore, selecting low-emitting cattle (bottom 25% of cattle) based on a single 2-week measurement period using the GF system resulted in 15% to 23% of the animals being misidentified. Accurate selection of low CH4-emitting animals should be based on repeated CH4 measurements over the production cycle. However, the added labor and expense of making repeated CH4 measurements over longer durations needs to be weighed against the impact of misidentification of low-emitting cattle when using a single measurement period. The variability of MY was associated with differences in total VFA concentration in rumen fluid, without differences in DMI, supporting the notion that low-CH4 emitting cattle may have less organic matter fermented in the rumen due to faster rate of passage of digesta from the rumen. Further research is warranted to ensure that selection of cattle for low CH4 production does not negatively affect digestibility and animal performance.
Data availability statement
The raw data supporting the conclusions of this article will be made available by the authors, without undue reservation.
Ethics statement
The animal study was reviewed and approved by Canadian Council on Animal Care (2009), study was approved (protocol #ACC1913) by the Institutional Animal Care and Use Committee.
Author contributions
KB procured the funding, conceptualized the study, provided advice on the statistical analysis, and prepared the manuscript draft; PT conducted the statistical analyses; CR oversaw data collection from the animal study; ST provided advice on data interpretation and revised the manuscript; RG oversaw the collection of rumen fluid samples. All authors contributed to the article and approved the submitted version.
Funding
The study was funded by Agriculture and Agri-Food Canada.
Acknowledgments
This authors thank C. Sapsford and J-F Coulombe for their technical expertise, and the staff of the Research Feedlot for caring for the cattle.
Conflict of interest
The authors declare that the research was conducted in the absence of any commercial or financial relationships that could be construed as a potential conflict of interest.
Publisher’s note
All claims expressed in this article are solely those of the authors and do not necessarily represent those of their affiliated organizations, or those of the publisher, the editors and the reviewers. Any product that may be evaluated in this article, or claim that may be made by its manufacturer, is not guaranteed or endorsed by the publisher.
Supplementary material
The Supplementary Material for this article can be found online at: https://www.frontiersin.org/articles/10.3389/fanim.2022.1029094/full#supplementary-material
References
Alemu A. W., Pekrul L., Shreck A. L., Booker C. W., McGinn S. M., Kindermann M., et al. (2021). Feeding 3-nitrooxypropanol to backgrounding cattle in a commercial feedlot decreased enteric methane production: Implications for sustainability of beef cattle production. Front. Anim. Sci. 2. doi: 10.3389/fanim.2021.641590
Allen M. S. (2014). Drives and limits to feed intake in ruminants. Anim. Prod. Sci. 54, 1513–1524. doi: 10.1071/AN14478
AOAC (2016). Official methods of analysis of AOAC international. 20th ed (Gaithersburg, MD: AOAC International).
Arbre M., Rochette Y., Guyader J., Lascoux C., Gómez L. M., Eugène M. (2016). Repeatability of enteric methane determinations from cattle using either the SF6 tracer technique or the GreenFeed system. Anim. Prod. Sci. 56, 238–243. doi: 10.1071/AN15512
Beauchemin K. A., Ungerfeld E. M., Eckard R., Wang M. (2020). REVIEW: Fifty years of research on rumen methanogenesis - lessons learned and future challenges for mitigation. Animal 14 (S1), s2–s16. doi: 10.1017/S1751731119003100
Blaxter K. L., Clapperton J. L. (1965). Prediction of the amount of methane produced by ruminants. Br. J. Nutr. 19, 511–522. doi: 0.1079/bjn19650046
Cabezas-Garcia E. H., Krizsan S. J., Shingfield K. J., Huhtanen P. (2016). Between-cow variation in digestion and rumen fermentation variables associated with methane production. J. Dairy Sci. 100 (6), 4409–4424. doi: 10.3168/jds.2016-12206
Cabezas-Garcia E. H., Krizsan S. J., Shingfield K. J., Huhtanen P. (2017). Between-cow variation in digestion and rumen fermentation variables associated with methane production. J. Dairy Sci. 100 (6), 4409–4424. doi: 10.3168/jds.2016-12206
Canadian Council on Animal Care (2009). CCAC guidelines on: the care and use of farm animals in research, teaching and testing (Ottawa, ON: Canadian Council on Animal Care).
Coppa M., Jurquet J., Eugène M., Dechaux T., Rochette Y., Lamy J., et al. (2021). Repeatability and ranking of long-term enteric methane emissions measurement on dairy cows across diets and time using GreenFeed system in farm-conditions. Methods 186, 59–67. doi: 10.1016/j.ymeth.2020.11.004
Difford G. F., Plichta D. R., Løvendahl P., Lassen J., Noel S. J., Højberg O., et al. (2018). Host genetics and the rumen microbiome jointly associate with methane emissions in dairy cows. PloS Genet. 14 (10), e1007580. doi: 10.1371/journal.pgen.1007580
Donoghue K. A., Herd R. M., Bird S. H., Arthur P. F., Hegarty R. F. (2013). Preliminary genetic parameters for methane production in Australian beef cattle. Proc. Assoc. Advmt. Anim. Breed. Genet. 20, 290–293.
Gavrilova O., Leip A., Dong H., MacDonald J. D., Gomez Bravo C. A., Amon B., et al. (2019)Chapter 10: Emissions from livestock and manure management 2019. In: Refinement to the 2006 IPCC guidelines for national greenhouse gas inventories (International Panel on Climate Change). Available at: https://www.ipcc-nggip.iges.or.jp/public/2019rf/pdf/4_Volume4/19R_V4_Ch10_Livestock.pdf (Accessed November 26 2021).
Goopy J. P., Hegarty R. S. (2004). Repeatability of methane production in cattle fed concentrate and forage diets. J. Anim. Feed Sci. 13 (Suppl. 1), 75–78. doi: 10.22358/jafs/73742/2004
Grainger C., Clarke T., McGinn S. M., Auldist M. J., Beauchemin K. A., Hannah M. C., et al. (2006). Methane emissions from dairy cows measured using the sulfur hexafluoride (SF6) tracer and chamber techniques. J. Dairy Sci. 90 (6), 2755–2766. doi: 10.3168/jds.2006-697
Grainger C., Clarke T., McGinn S. M., Auldist M. J., Beauchemin K. A., Hannah M. C., et al. (2007). Methane emissions from dairy cows measured using the sulfur hexafluoride (SF6) tracer and chamber techniques. J. Dairy Sci. 90 (6), 2755–2766. doi: 10.3168/jds.2006-697
Hammond K. J., Waghorn G. C., Hegarty R. S. (2016). The GreenFeed system for measurement of enteric methane emission from cattle. Anim. Prod. Sci. 56, 181–189. doi: 10.1071/AN15631
Hayes B. J., Donoghue K. A., Reich C. M., Mason B. A., Bird-Gardiner T., Herd R. M., et al. (2016). Genomic heritabilities and genomic estimated breeding values for methane traits in Angus cattle. J. Anim. Sci. 94, 902–908. doi: 10.2527/jas2015-0078
Hristov A. N., Oh J., Firkins J. L., Dijkstra J., Kebreab E., Waghorn G., et al. (2013). Mitigation of methane and nitrous oxide emissions from animal operations: I. a review of enteric methane mitigation options. J. Anim. Sci. 91, 5045–5069. doi: 10.2527/jas.2013-6583
Islam M., Kim S., Ramos S. C., Mamuad L. L., Son A.-R., Yu Z., et al. (2021). Holstein And Jersey steers differ in rumen microbiota and enteric methane emissions even fed the same total mixed ration. Front. Microbiol. 12. doi: 10.3389/fmicb.2021.601061
Jonker A. D., Molano G., Antwi C., Waghorn G. (2014). Feeding lucerne silage to beef cattle at three allowances and four feeding frequencies affects circadian patterns of methane emissions, but not emissions per unit of intake. Anim. Prod. Sci. 54, 1350–1353. doi: 10.1071/AN14235
Koenig K. M., Chibisa G. E., Penner G. B., Beauchemin K. A. (2020). Optimum roughage proportion in barley-based feedlot cattle diets: Feeding behavior, growth performance, and carcass traits. J. Anim. Sci. 98, 1–12. doi: 10.1093/jas/skaa299
Koenig K. M., McGinn S. M., Beauchemin K. A. (2013). Ammonia emissions and performance of backgrounding and finishing beef feedlot cattle fed barley-based diets varying in dietary crude protein concentration and rumen degradability. J. Anim. Sci. 91, 2278–2294. doi: 10.2527/jas.2012–5651
Manafiazar G., Zimmerman S., Basarab J. A. (2017). Repeatability and variability of short-term spot measurement of methane and carbon dioxide emissions from beef cattle using GreenFeed emissions monitoring system. Can. J. Anim. Sci. 97, 118–126. doi: 10.1139/cjas-2015-0190
Manzanilla-Pech C. I. V., Løvendahl P., Mansan Gordo D., Difford G. F., Pryce J. E., Schenkel F., et al. (2021). Breeding for reduced methane emission and feed-efficient Holstein cows: An international response. J. Dairy Sci. 104, 8983–9001. doi: 10.3168/jds.2020-19889
National Academies of Sciences, Engineering, and Medicine (NASEM) (2016). Nutrient requirements of beef cattle. 8th rev. ed (Washington, DC: The National Academies Press).
Negussie E., de Haas Y., Dehareng F., Dewhurst R. J., Dijkstra J., Gengler N., et al. (2017). Invited review: Large scale indirect measurements for enteric methane emissions in dairy cattle: a review of proxies and their potential for use in management and breeding decisions. J. Dairy Sci. 100, 2433–2453. doi: 10.3168/jds.2016-12030
Oddy V. H., Donaldson A. J., Cameron M., Bond J., Dominik S., Robinson D. L. (2019). Variation in methane production over time and physiological state in sheep. Anim. Production Sci. 59, 441–448. doi: 10.1071/AN17447
Oddy V. H., Donaldson A. J., Cameron M., Bond J., Dominik S., Robinson D. L. (2019). Variation in methane production over time and physiological state in sheep. Anim. Prod. Sci. 59, 441–448. doi: 10.1071/AN17447
Pickering N. K., Oddy V. H., Basarab J., Cammack K., Hayes B., Hegarty R. S., et al. (2015). Animal board invited review: genetic possibilities to reduce enteric methane emissions from ruminants. Anim 9 (9), 1431–1440. doi: 10.1017/S1751731115000968
Pinares-Patiño C. S., Lively F., Lassey K. R. (2015). Chapter 10: The sulphur hexafluoride tracer technique for estimating enteric methane emissions from ruminants. In Indirect calorimetry Wageningen Acad. Publishers p, 185–212. doi: 10.3920/978-90-8686-261-0_10
Pinares-Patiño C. S., McEwan J. C., Dodds K. G., Cárdenas E. A., Hegarty R. S., Koolaard J. P., et al. (2011). Repeatability of methane emissions from sheep. Anim. Feed Sci. Technol. 166, 210–218. doi: 10.1016/j.anifeedsci.2011.04.068
Pinares-Patiño C. S., Hickey S. M., Young E. A., Dodds K. G., MacLean S., Molano G., et al. (2013). Heritability estimates of methane emissions from sheep. Animal 7, 316–321. doi: 10.1017/S1751731113000864
Pinares-Patiño C. S., Ulyatt M. J., Lassey K. R., Barry T. N., Holmes C. W. (2003). Rumen function and digestion parameters associated with differences between sheep in methane emissions when fed chaffed lucerne hay. J. Agric. Sci. 140, 205–214. doi: 10.1017/S0021859603003046
Ramayo-Caldas Y., Zingaretti L., Popova M., Estellé J., Bernard A., Pons N., et al. (2020). Identification of rumen microbial biomarkers linked to methane emission in Holstein dairy cows. J. Anim. Breed. Genet. 137, 49–59. doi: 10.1111/jbg.12427
Rischewski J., Bielak A., Nürnberg G., Derno M., Kuhla B. (2017). Rapid communication: Ranking dairy cows for methane emissions measured using respiration chamber or GreenFeed techniques during early, peak and late lactation. J. Anim. Sci. 95, 3154–3159. doi: 10.2527/jas.2017.1530
Rowe S. J., Hickey S. M., Jonker A., Hess M. K., Janssen P., Johnson T., et al. (2019). Selection for divergent methane yield in new Zealand sheepo – a ten-year perspective. in. Proc. Assoc. Advmt. Anim. Breed. Genet. 23, 306–309.
van Lingen H. J., Niu M., Kebreab E., Valadares Filho S. C., Rooke J. A., Duthie C., et al. (2019). Prediction of enteric methane production, yield and intensity of beef cattle using an intercontinental database. Agric. Ecosyst. Envir. 283, 106575. doi: 10.1016/j.agee.2019.106575
Keywords: phenotype, methane, variability, greenhouse gas, feeding behavior
Citation: Beauchemin KA, Tamayao P, Rosser C, Terry SA and Gruninger R (2022) Understanding variability and repeatability of enteric methane production in feedlot cattle. Front. Anim. Sci. 3:1029094. doi: 10.3389/fanim.2022.1029094
Received: 26 August 2022; Accepted: 12 October 2022;
Published: 03 November 2022.
Edited by:
Kristen A. Johnson, Washington State University, United StatesReviewed by:
Metha Wanapat, Khon Kaen University, ThailandAlexander Nikolov Hristov, The Pennsylvania State University (PSU), United States
Jon Schoonmaker, Purdue University, United States
Copyright © 2022 and His Majesty the King in Right of Canada, as represented by the Minister of Agriculture and Agri-Food Canada for the contribution of Karen Beauchemin, Paul Tamayao, Christine Rosser, Stephanie Terry, and Robert Gruninger. This is an open-access article distributed under the terms of the Creative Commons Attribution License (CC BY). The use, distribution or reproduction in other forums is permitted, provided the original author(s) and the copyright owner(s) are credited and that the original publication in this journal is cited, in accordance with accepted academic practice. No use, distribution or reproduction is permitted which does not comply with these terms.
*Correspondence: Karen A. Beauchemin, karen.beauchemin@agr.gc.ca
†Present address: Christine Rosser, Nutrition Services, Coaldale Veterinary Clinic, Lethbridge, AB, Canada