 Andrew Burnie
 Emine Yilmaz1,2
 Tomaso Aste
- 1Department of Computer Science, University College London, London, United Kingdom
- 2The Alan Turing Institute, British Library, London, United Kingdom
The recent extreme volatility in cryptocurrency prices occurred in the setting of popular social media forums devoted to the discussion of cryptocurrencies. We develop a framework that discovers potential causes of phasic shifts in the price movement captured by social media discussions. This draws on principles developed in healthcare epidemiology where, similarly, only observational data are available. Such causes may have a major, one-off effect, or recurring effects on the trend in the price series. We find a one-off effect of regulatory bans on bitcoin, the repeated effects of rival innovations on ether and the influence of technical traders, captured through discussion of market price, on both cryptocurrencies. The results for Bitcoin differ from Ethereum, which is consistent with the observed differences in the timing of the highest price and the price phases. This framework could be applied to a wide range of cryptocurrency price series where there exists a relevant social media text source. Identified causes with a recurring effect may have value in predictive modelling, whilst one-off causes may provide insight into unpredictable black swan events that can have a major impact on a system.
1. Introduction
Social media discussion forums involve hundreds of thousands of subscribers (Comben and Rivet, 2019; Knittel and Wash, 2019) and, as in the case of Reddit subreddits, may use moderators to ensure focus on a specified theme (r/Bitcoin, 2019; r/ethereum, 2019). In this paper, we introduce a framework for analysing the association between changes in social media discussions and shifts in the movement of a related cryptocurrency price series. We evaluate this framework through the insights it provides when applied to bitcoin and ether prices across 2017–18. For cryptocurrencies, social media discussions are particularly relevant (ConsenSys Media, 2019; Revealing Reality, 2019) and, during 2017–18, changes in their price movement were particularly extreme (see Figure 1). Potential causes of shifts in the price series are discovered in social media discussions that either have a one-off, major effect, including unpredictable “black swan” (Taleb, 2010) events, or have a consistently recurring effect on price.
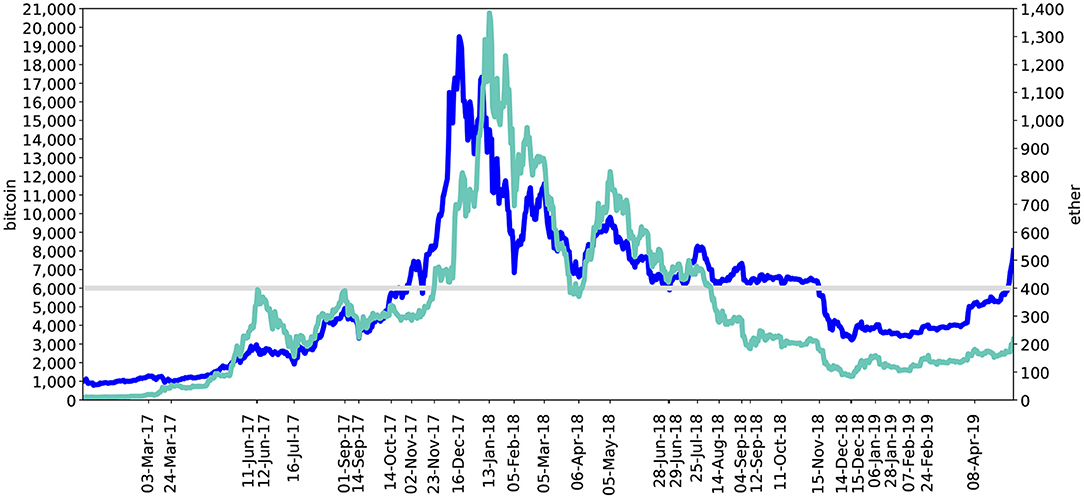
Figure 1. Comparison of ether and bitcoin US Dollar price series (1 January 2017 to 14 May 2019). Bitcoin series is in blue and the price is given by the left axis. Ether series is in light green and the price is given by the right axis. The horizontal line represents the identified support or resistance price level which was 400 US Dollars for ether and 6,000 US Dollars for bitcoin. The labelled dates on the x-axis are dates where there was a bitcoin or ether local maxima or minima, or where the horizontal line was breached.
If an event occurs as price changes, that event could be driving the change in price, but a reasonable alternative explanation is that the event is in response to the change in price. To exclude the latter possibility, cause must come before effect as the future cannot affect the past (Bradford Hill, 1965; Granger, 1980; Ioannidis, 2016). Hence, the event must precede the price change, and such events, therefore, may be predictive. Previous literature has focussed on models to predict the cryptocurrency price. For instance, seven studies have found a higher Google search volume to precede price increases (Georgoula et al., 2015; Matta et al., 2015; Polasik et al., 2015; Li and Wang, 2017; Abraham et al., 2018; Kjærland et al., 2018; Liu and Tsyvinski, 2018), and ElBahrawy et al. (2019) found that the volume of Wikipedia views on cryptocurrency pages could be used in a trading strategy to generate higher investment returns up until January 2017.
However, establishing a predictive relationship does not prove a causal link because of “confounding bias” (Pearl et al., 2016). That is to say if one event occurs before another, both may be the symptoms of a third factor changing (Pearl et al., 2016) or there may have been a catalyst unique to that dataset without which the causal link ceases (Rothman, 2017). For example, higher Google search volumes may occur before higher prices because positive news events drove people to both search on the internet to find out more and to buy the cryptocurrency (Kristoufek, 2013; Liu and Tsyvinski, 2018). Hence, Kristoufek (2013) established that a positive correlation relied on including days in the dataset when the price was high and positive news events common. However, negative news items could also lead people to Google search but instead result in lower prices, resulting in a negative correlation. Consistent with this, Garcia et al. (2014) found a negative correlation and Urquhart (2018) no predictive association between Google searches and price. Confounding bias remains an issue even when applying non-parametric approaches to learning causal networks (Maathuis et al., 2009; Runge et al., 2019); to construct these networks, assumptions are also required regarding the conditional independence between variables (Dablander and Hinne, 2019).
Ideally, experiments would be carried out to reduce the risk of confounding bias (Pearl et al., 2016; Rosenbaum, 2017), but for cryptocurrencies we have only observational data. Although observational data cannot prove that a candidate caused a change it can provide evidence that favours this explanation over confounding bias (Pearl et al., 2016; Rosenbaum, 2017). It is in this context that healthcare epidemiologists often operate to find the underlying causes of disease, as, for instance, with the link between smoking and lung cancer (Cornfield et al., 1959; Rosenbaum, 2017).
Our approach (see Figure 2) is to filter words from social media text, group words of similar meaning to identify the underlying concepts, and then to apply quantitative causality criteria. We then examine the context of the delineated concepts and evaluate the coherence of suggested causal links with known facts (Bradford Hill, 1965). Healthcare epidemiology literature suggests two distinct approaches to constructing the quantitative causality criteria.
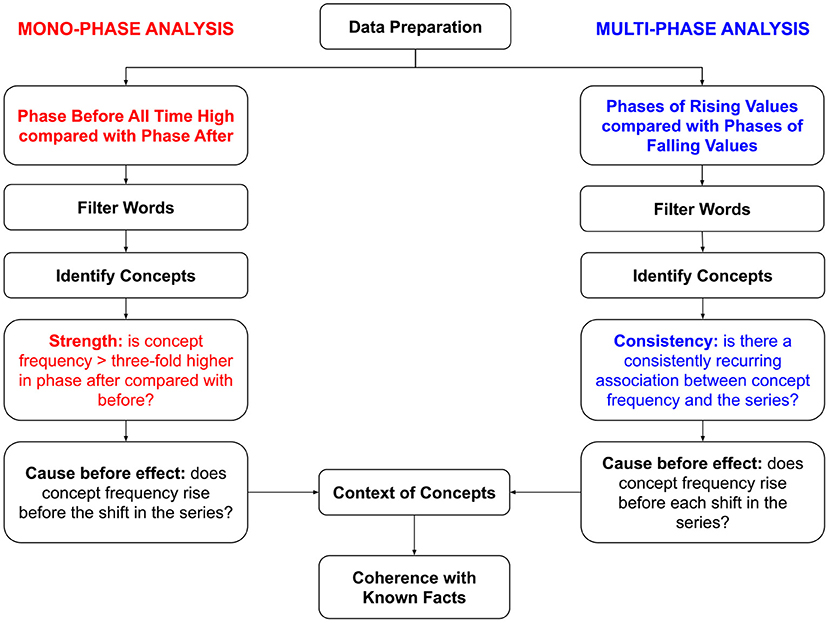
Figure 2. The causality framework. This evaluates evidence for or against an event and/or concern on social media having an impact on price. The framework begins in the box labelled “Data Preparation.” The mono-phase analysis follows the route on the left and the multi-phase analysis follows the route on the right; differences in approach are indicated by coloured text. The process terminates in the box labelled “Coherence with Known Facts”.
The first approach uses the strength of the association to support a causal link (Bradford Hill, 1965; Rosenbaum, 2017). The larger the increase in the candidate cause and the greater the effect, the more any third, unconsidered, “confounding” variable would have to affect both for the association to be spurious and not indicative of a causal relationship (Cornfield et al., 1959; Grimes and Schulz, 2002; Rosenbaum, 2017). This is applicable to identifying rare, unpredictable black swan events that have a one-off influence on a single, major phasic shift in the price series. In the “mono-phase” analysis (see Figure 2) we focus on the major change in the price series which is the shift in movement from the phase of rising prices before to the phase of falling prices after the all time high price. We filter for words that were statistically significantly higher in frequency in the latter phase of falling values. The causality criteria used are: frequency is more than three-fold higher (Grimes and Schulz, 2002) in the phase of falling prices than the phase of rising prices, and frequency is higher within the 24 h before the maximum price. We use a cut-off that the concept must be more than three-fold higher in frequency to reduce the risk that the detected association is spurious. This is consistent with recommendations in the epidemiology literature regarding the definition of what constitutes “strong support for causation” (Grimes and Schulz, 2002).
The alternative approach places value in relationships that consistently recur despite a changing context (Bradford Hill, 1965; Ioannidis, 2016). The more an observed association recurs across different contexts, the more likely any unobserved variables would have changed in value and impact, and so the less likely that the observed association is due to some unobserved variable driving both candidate cause and effect. This approach can detect potential causes with a recurring effect on the price series. In the “multi-phase” analysis (see Figure 2), we filter for words where daily frequency was statistically significantly different comparing all phases of rising values with all phases of falling values. A concept captured a potential recurring cause of rising values if its frequency was higher in every phase of rising values compared with the previous phase and higher within the 24 h before each phase of rising values. Concepts reflecting potential causes of falling values have a higher frequency in every phase of falling values compared with the previous phase and a higher frequency within the 24 h before each phase of falling values.
Our results support the existence of both causes with a one-off effect, which could be attributable to black swan events, and causes with a consistently recurring effect on price. Most of the causes differed between bitcoin and ether which is consistent with the difference in timing of the phases and all time high price (see Figure 1), and their different functions (Burnie et al., 2018).
2. Materials and Methods
An overview of the methodology is provided in Figure 2.
2.1. Data Preparation
2.1.1. Dataset
The dataset extended from 1 January 2017 to 14 May 2019 and included: Reddit submissions text sourced using the Pushshift API (Baumgartner, 2019), the US Dollar bitcoin price from the Charts API of Blockchain Luxembourg S. A. (2019) and the US Dollar ether price from Etherscan (2019).
For Ethereum, the largest (Comben and Rivet, 2019) subreddit “r/ethereum” had 436,000 subscribers on 14 May 2019 (r/ethereum, 2019) and was moderated by Vitalik Buterin, the “Creator of Ethereum” (Alvarez, 2018). Following this forum's guidelines (r/ethereum, 2019), its text was combined with that from “r/ethtrader” and “r/EtherMining.” Together, these had the most submissions containing the term “ether” or “eth” among Ethereum-specific subreddits (Baumgartner, 2019) and have collectively been described as the most important subreddits (Comben and Rivet, 2019). For Bitcoin, we used subreddit “r/Bitcoin,” which has been recommended because of the number and activity of its users compared with alternative online communities (Knittel and Wash, 2019); this community had over 1.1 million subscribers as of 18:54 (UTC) on 23 August 2019 (r/Bitcoin, 2019).
2.1.2. Dividing the Price Series Into Phases
The price data was divided into phases using local maxima and minima to define the boundaries. A date represented a local maximum if the price was higher than on any other date 28 days (4 weeks) before and after. That date was a local minimum if the price was instead lower than on any other date 28 days before and after. Phases terminating just before a local maximum were rising price phases, those ending just before a local minimum were falling price phases. Sometimes there were several consecutive minima with the last value being the lowest; we ignored all such minima except the last, lowest value.
The length of the window was specified at 28 days before and after because a longer window risked merging rising and falling price phases. For example, examining bitcoin, the 28-day window delineated a phase where bitcoin prices fell 65% from the all time high price on 16 December 2017 to 5 February 2018 (see Figure 1 and Figure S1). Doubling the length of this window to 56 days would have enlarged this phase of price movement to include the subsequent 70% increase in prices from 5 February 2018 to 5 March 2018. Using shorter time windows would have reduced the size of the price phases, limiting the amount of data available when applying Wilcoxon Rank-Sum Tests to filter words in the mono-phase analysis (described in section 2.2.1). This would have reduced the power of such tests (Bridge and Sawilowsky, 1999).
As bitcoin prices rose across 2017, there were brief phases where bitcoin prices reversed upon reaching round values. This occurred at 1,000 US Dollars (1285.14 to 941.92 from 3 to 24 March 2017); 3,000 US Dollars (2961.83 to 1931.21 from 11 June to 16 July 2017); and 5,000 US Dollars (4911.74 to 3319.63 from 1-14 September 2017). Traders sell at round values that represent a large return on their investment to prevent losing this return to subsequent volatility, even if their view of the cryptocurrency is unchanged (Chen, 2018). Therefore, we incorporated these phases into the overall rising price phase.
When technical traders believe that a certain price level is a support or resistance level, they will buy (pushing prices up) as prices fall to that support level and sell (pushing prices down) as prices rise to that resistance level (Murphy, 2019). When prices approach a round-valued price this can drive reversals in trend even if opinion of the cryptocurrency is otherwise unchanged (Shiller, 2000; Westerhoff, 2003; Aggarwal and Lucey, 2007; Dowling et al., 2016). Phases where the connect between price and non-price events and concerns is weak were excluded.
In 2017, the ether price rose to 394.66 US Dollars (12 June), fell to near 150 US Dollars (155.42 US Dollars, 16 July 2017), then rose again to 391.42 US Dollars (1 September 2017) (Figure 1). This supports a 400 US Dollar price resistance level identified by the media at the time (Bamburic, 2017; Wilmoth, 2017). Hence, we remove from analysis the phase from 12 June (where the barrier was first neared) to before 23 November 2017 (when the barrier was exceeded).
In 2018, the bitcoin price fell to 5908.70 US Dollars (29 June 2018), recovered and tested the barrier again at 6050.94 (14 August 2018). Hence the 6000 US Dollar support level has been described as a “crucial test” (Cuthbertson, 2019). We remove from analysis the phase from 29 June 2018 to before 15 November 2018 (when prices finally fell below the barrier).
After attaining a local minimum in mid-December 2018, neither the bitcoin nor ether price fell further. This point thus marks the end of the 2017–18 price cycle which is the focus of this paper's analyses, and so the last phase of data analysed ends mid-December 2018 for both cryptocurrencies (14 December for Ethereum and 15 December for Bitcoin).
2.1.3. Text Preparation
Reddit submissions were processed as detailed in the Supplementary Methods (see section 1.1), in the Supplementary Data Sheet 1. Table 1 uses examples to illustrate the different datasets generated during the processing of the text. Blank, duplicate and automated submissions were removed, text of synonymous meaning was standardised and text not relating to words deleted. Each submission was converted from a string of text into a list of words; see columns (A) and (B) in Table 1 for examples.
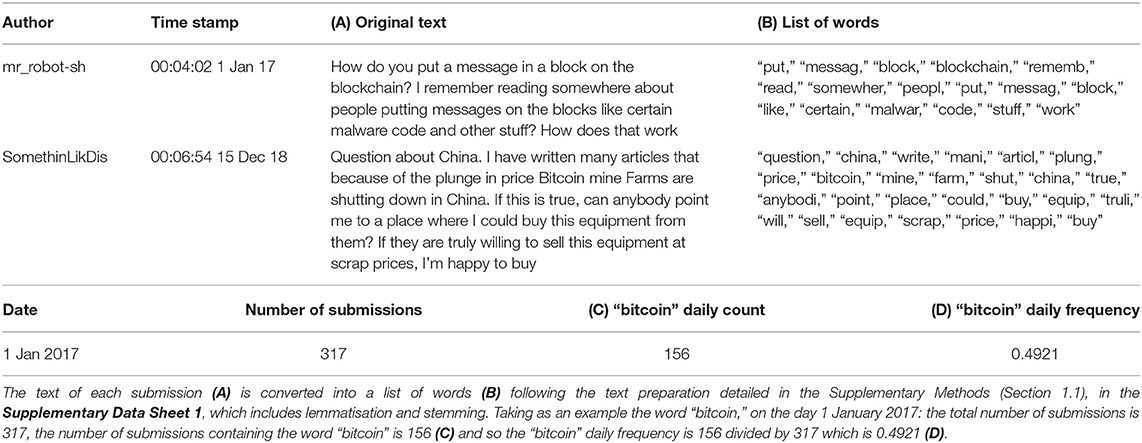
Table 1. Examples illustrating the different datasets resulting from extracting daily word frequencies from the original Reddit submissions.
2.1.4. Measuring Frequency
With each submission represented as a list of words, the number of submissions across a defined time period that contained each word could be counted. This was then divided by the total number of submissions such that the “frequency” or “popularity” of a word was the proportion of submissions across a defined time period that contained that word at least once. Extending to groups containing multiple words, frequency was the proportion of submissions containing at least one word from that group. Daily frequency referred to the proportion of submissions containing a word or a word from a group on each day. Following the sources on price data (Blockchain Luxembourg S. A., 2019; Etherscan, 2019), a “day” was specified to be from 00:00 on a given day to before 00:00 the next date (UTC). Table 1 provides example daily frequency data for the word “bitcoin.”
2.2. Mono-phase Analysis
2.2.1. Filter Words
One-tailed Wilcoxon Rank-Sum Tests (SciPy package version 1.1.0) and a Bonferroni-corrected p-value threshold of 1% were applied to filter for those words where the daily word frequency tended to be higher in the phase after the all time high price compared with before. The Wilcoxon Rank-Sum Test was used as a non-parametric equivalent to the t-test that is less sensitive to extreme outliers (Bridge and Sawilowsky, 1999; Wild and Seber, 2000). The Bonferroni correction (dividing the p-value threshold by the number of tests) was applied to account for a multitude of tests being run for each word (McDonald, 2014). Prior to this, extremely rare words in 100 or less submissions were removed.
2.2.2. Identify Concepts
From the delineated words, concepts were derived that consisted of one or more words that shared a similar meaning. This followed Burnie and Yilmaz (2019a) and used Python packages “gensim” (Řehůřek, 2019) version 3.5.0 and “NetworkX” (NetworkX, 2019) version 2.2. Firstly, word2vec models (Mikolov et al., 2013a,b) were trained using the processed text from all submissions (see section 2.1.3). The trained word2vec model was used to convert each delineated word (found in section 2.2.1) into a numeric vector. A network was constructed where two words were connected only if the cosine similarity between their vectors exceeded a threshold. The cosine similarity between a pair of vectors provided a measure of how similar the pair of words were in meaning (Mikolov et al., 2013a,b). Groups of connected words were merged into single concepts (such as “cardano”/“eo”/“iota”/“rippl”/“stellar”/“tron”) whilst words unconnected with any other word (“korea”) were treated as concepts consisting of only one word. The optimisation of this methodology followed Burnie and Yilmaz (2019a).
2.2.3. Apply Causality Criteria: Strength and Cause Before Effect
Mono-phase concepts were more than three-fold higher in popularity (Grimes and Schulz, 2002) across the phase after the all time high price compared with the phase before, and increased in frequency before the shift in phase. To determine if frequency rose before the shift, we examined 1, 2, 3 h, and so on, up to 24 h before the shift and evaluated whether the proportion of submissions containing the concept within any of these windows was higher compared with all the submissions in the same phase but before that window.
2.3. Multi-Phase Analysis
2.3.1. Filter Words
Two-tailed Wilcoxon Rank-Sum Tests (SciPy package version 1.1.0) and a Bonferroni-corrected p-value threshold of 1% were applied to extract those words where the daily word frequency tended to be higher or lower comparing all phases where prices rose with all phases where prices fell. Prior to this, extremely rare words in 100 or less submissions were removed.
2.3.2. Identify Concepts
Words more frequent as prices rose were split from those more popular as prices fell. As in section 2.2.2, each set of words was converted into a set of concepts: “rising-price concepts” consisted of words higher in frequency as prices rose and “falling-price concepts” consisted of words more frequent as prices fell.
2.3.3. Apply Causality Criteria: Consistency and Cause Before Effect
Rising-price, multi-phase concepts were rising-price concepts that rose in frequency with every shift to rising prices and within the 24 h before every shift to rising prices. Falling-price, multi-phase concepts were falling-price concepts that rose in frequency with every shift to falling prices and within the 24 h before every shift to falling prices. We removed from the analysis any concept that consistently rose in popularity across every shift in price, independent of whether prices were rising or falling, as any rise in popularity could have been an artefact of the long-term trend.
2.4. Context of Concepts
For each mono-phase and multi-phase concept, we found the top five most common words occurring in submissions containing at least one word from that concept. This excluded words that did not aid in the interpretation of the concept. Further details and a list of words excluded are available in section 1.2 of the Supplementary Methods, in the Supplementary Data Sheet 1.
3. Results
3.1. Comparison of Bitcoin and Ethereum Price Phases
Both the bitcoin and the ether price rose to an all time high as 2017 became 2018, to then oscillate with an overall decline in value until mid-December 2018 (see Figure 1). There was a disparity in the timing of the all time high price for bitcoin (16 December 2017) and ether (13 January 2018).
It appears that different price levels acted as barriers at different times. Whilst bitcoin prices rose across 2017, ether prices reverted upon nearing 400 US Dollars (Bamburic, 2017; Wilmoth, 2017) (12 June and 1 September 2017), only increasing above this level after five months. Whilst ether prices fell from 5 May to mid-December 2018, bitcoin prices recovered upon falling to 6,000 US Dollars (Cuthbertson, 2019) (29 June and 14 August 2018) and only fell below this level after four months.
Based on local extrema (see Figure S1) and price barriers, we demarcated six phases of price movement with ether and eight with bitcoin (see Table 2). Table 2 further shows which of these phases were used in order to compare daily word frequencies so as to filter words (see sections 2.2.1 and 2.3.1). Descriptive statistics for the different phases are provided in Table S7.
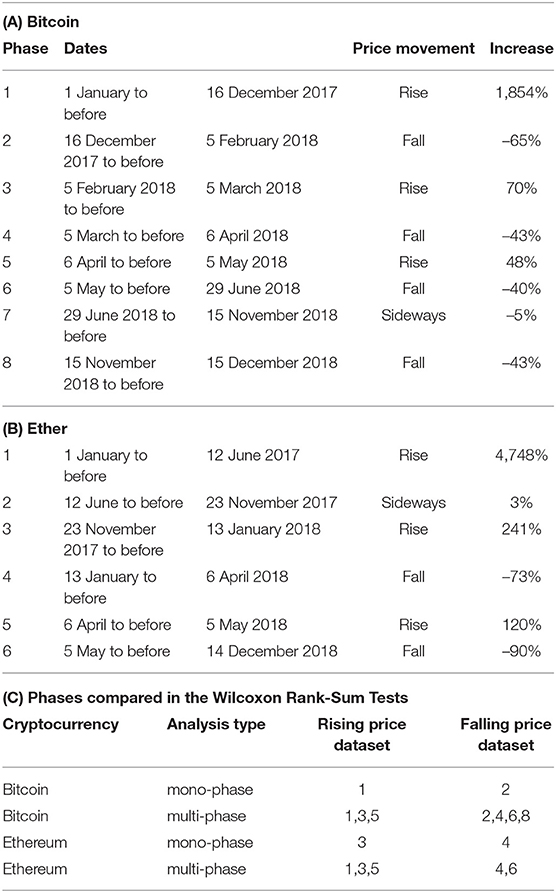
Table 2. For each phase in the cryptocurrency price series: the date range, price movement, overall percentage increase and in which Wilcoxon Rank-Sum Test that phase was used.
3.2. Mono-phase Concepts and Their Context
Ether prices rose 241% (phase 3) to an all time high price on 13 January 2018 before falling 73% (phase 4). Only “feb” met the criteria for a mono-phase concept and was excluded as it reflected the timing of phase 4.
Bitcoin prices rose 1,854% to an all time high price on 16 December 2017 during phase 1 and then fell 65% (phase 2). Ten mono-phase concepts rose more than three-fold with this shift to falling prices and increased within the 24 h period before entering the falling price phase (see Figure 3). The words occurring with these concepts (see Table 3) suggested three themes: regulatory bans (“korea” and “minist”/“ministri”); concerns over whether to sell bitcoin or switch to an altcoin (“cardano”/“eo”/“iota”/“rippl”/“stellar”/“tron”; “airdrop”; “binanc”/“hitbtc”; “hashflar”; and “discord”); and discussion of the practicalities of transacting bitcoin (“batch,” “bech32” and “changelli”). Two further concepts (“merri” and “christma”/“holiday”/“xmas”) also met the mono-phase criteria but were excluded because these were most likely due to the timing of phase 2, which began on 16 December 2017.
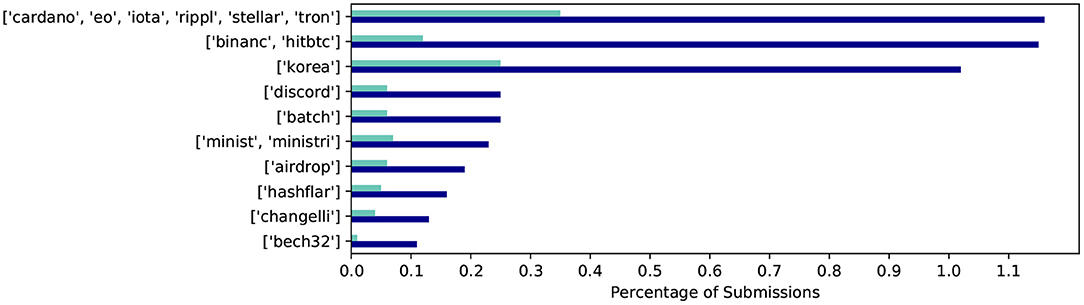
Figure 3. Frequency data for mono-phase concepts in the case of Bitcoin. This shows the percentage of all submissions containing the concept in phase 1 (light green) and phase 2 (blue).
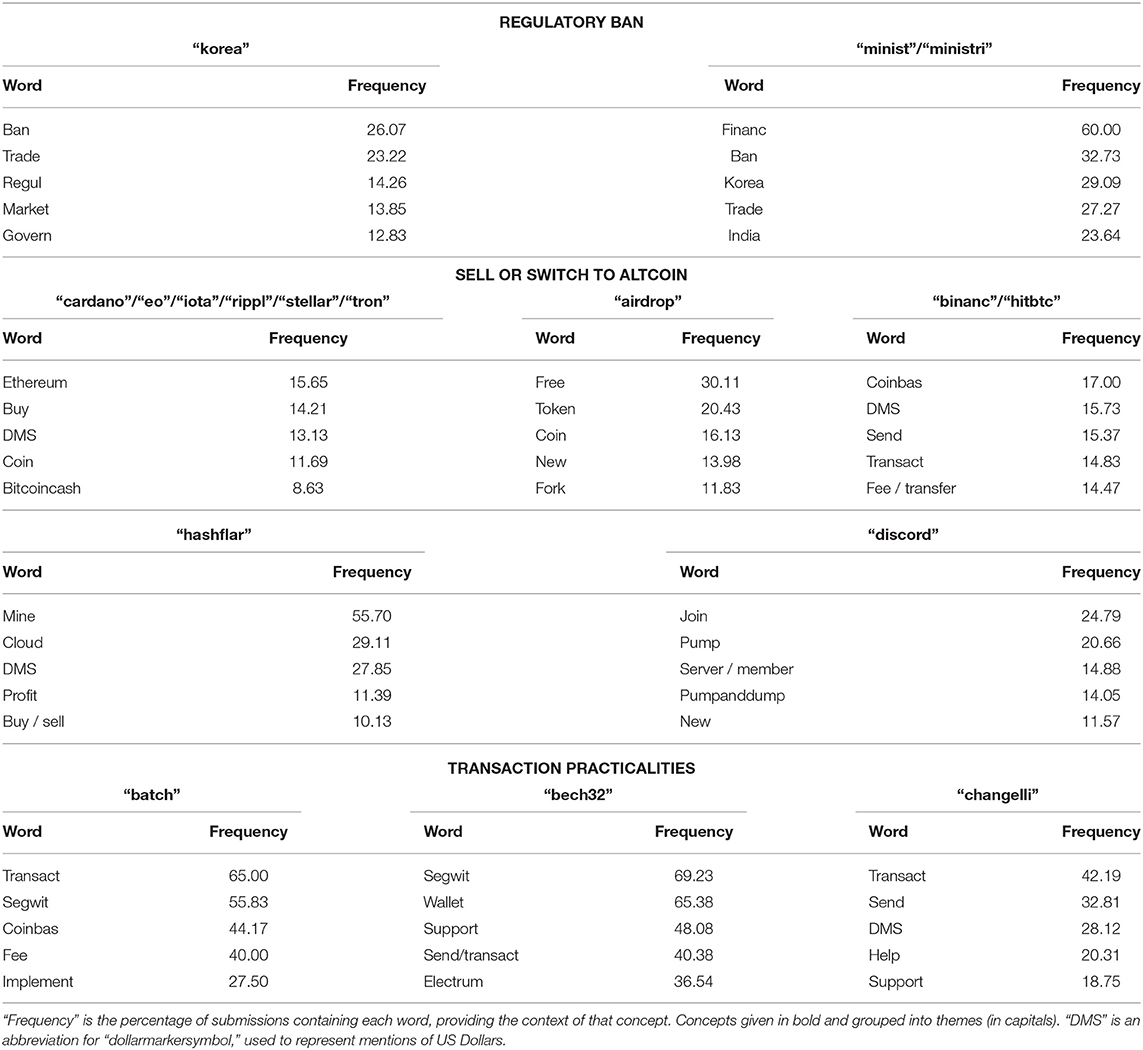
Table 3. Top five words occurring with each Bitcoin mono-phase concept in phase 2.
The context of the altcoin group (“cardano”/“eo”/“iota”/“rippl”/“stellar”/“tron”) reflected the contexts of each cryptocurrency named. Three of these six cryptocurrencies increased more than three-fold in the proportion of submissions from phase 1 to 2: Cardano rose 721.44%; Tron 562.63%; and Ripple (represented by “rippl”) 309.36%. We examined the top five words occurring with each of Cardano, Tron and Ripple and the altcoin group (“cardano”/“eo”/“iota”/“rippl”/“stellar”/“tron”) and found in each case they were discussed with: “ethereum,” “buy,” price (“price” or US Dollars) and another cryptocurrency (“bitcoincash” or “rippl” and “verg” in the case of Tron). Further details in Table 4.
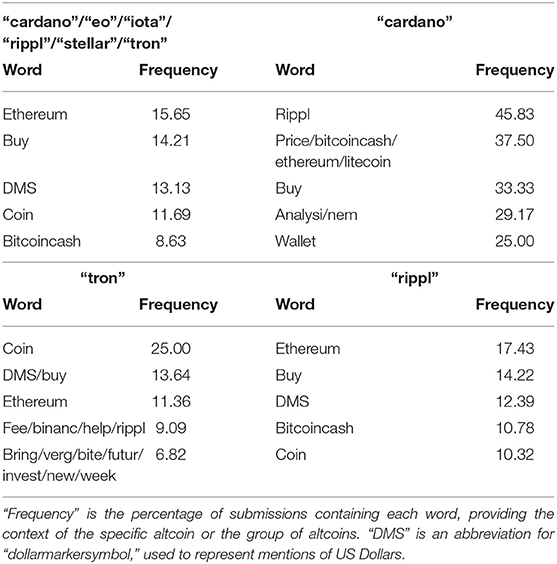
Table 4. Top five words occurring with each of Cardano, Tron and Ripple (“rippl”) compared with the Bitcoin mono-phase concept “cardano”/“eo”/“iota”/“rippl”/“stellar”/“tron” in phase 2 of the bitcoin price series.
We also split up the concept “binanc”/“hitbtc” which combines two different cryptocurrency exchanges: Binance and HitBTC. Interest in Binance rose 1327.89% in frequency compared with only 163.55% for HitBTC. The context in which “binanc” was used was similar to the concept “binanc”/“hitbtc,” with the top ten words being shared and the top three words having the same ranking (“coinbas,” US Dollar mentions and send). Further details in Table 5.
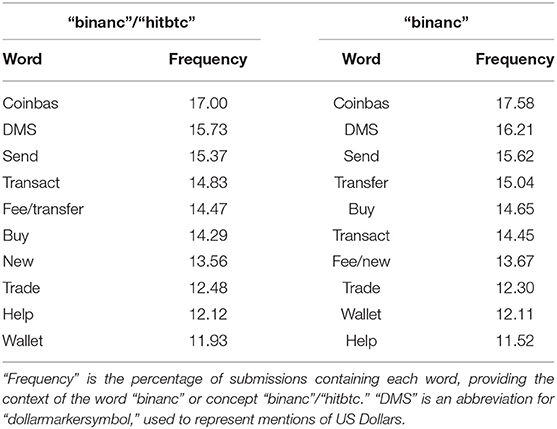
Table 5. Top ten words occurring with Binance (“binanc”) compared with the Bitcoin mono-phase concept “binanc”/“hitbtc” in phase 2 of the bitcoin price series.
3.3. Multi-Phase Concepts and Their Context
With Bitcoin, two multi-phase concepts were linked to falling prices: “market” and “sale.” The top two words occurring with “market” were “price” and US Dollars across each phase of falling prices. The concept “sale” was discussed in a varying context in different phases of falling prices: with “buy[ing]” and “sell[ing]” in phases 2 and 6, “token” sales in phases 4 and 6 and “black” “friday” sales in phase 8 (see Table 6).
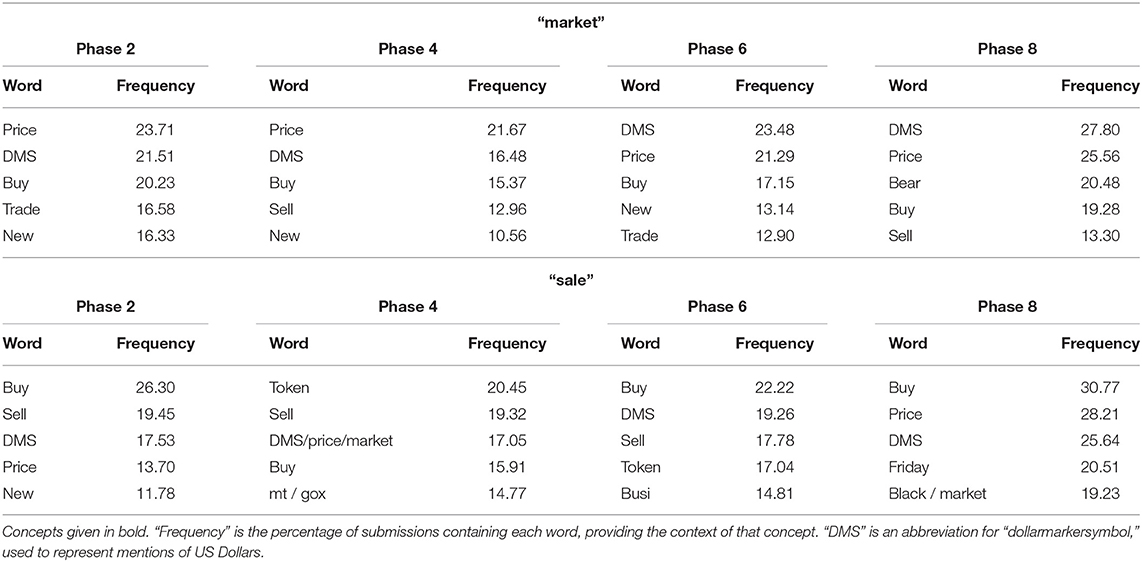
Table 6. Top five words occurring with each Bitcoin falling-price, multi-phase concept in phases 2, 4, 6, and 8.
With Ethereum, ten multi-phase concepts were identified. Three of these were associated with rising prices: “tax,” US Dollars and “hit.” “Hit” was discussed with US Dollars (over 40% submissions in each phase of rising prices) and US Dollars were frequently discussed with “bitcoin”(over 15%). The concept “tax” was considered with “gain” (over 30% submissions in each phase of rising prices); “pay” (over 25%); US Dollars (over 24%) and “trade” (over 23%). Further details in Table 7.
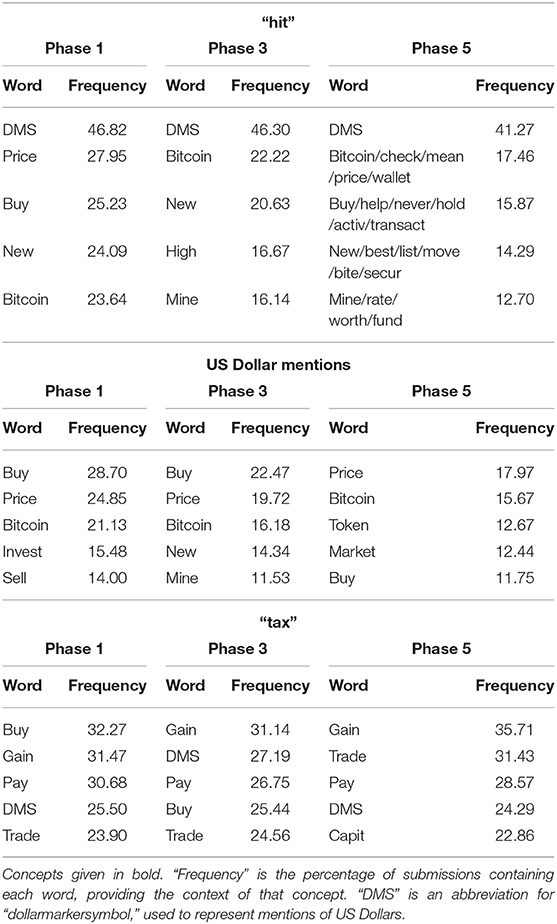
Table 7. Top five words occurring with each Ethereum rising-price, multi-phase concept in phases 1, 3, and 5.
The remaining seven multi-phase concepts related to falling ether prices. With the exception of “game,” all these could be split into two themes: price (“market” and “bear”/“bearish”/“bull”) and innovation (“featur”; “ceo”/“cofound”; “project”/“team”; and “makerdao”/“stablecoin”). In each phase of falling prices, “bear”/“bearish”/“bull” was discussed with “market” (over 45% submissions) and “market” was discussed with US Dollars (over 20%) and “price” (over 18%). Price was discussed in the context of “bitcoin,” which was in over 16% “market” submissions. The context of discussions around innovation varied but referred to new “token[s]” in over 10% submissions across all concepts and across all phases of falling prices. The concept “game” was discussed in the context of using gaming machines to mine ether in phase 4 (24.39% submissions) and “play[ing]” games in phase 6 (14.62% submissions). Further details in Table 8.
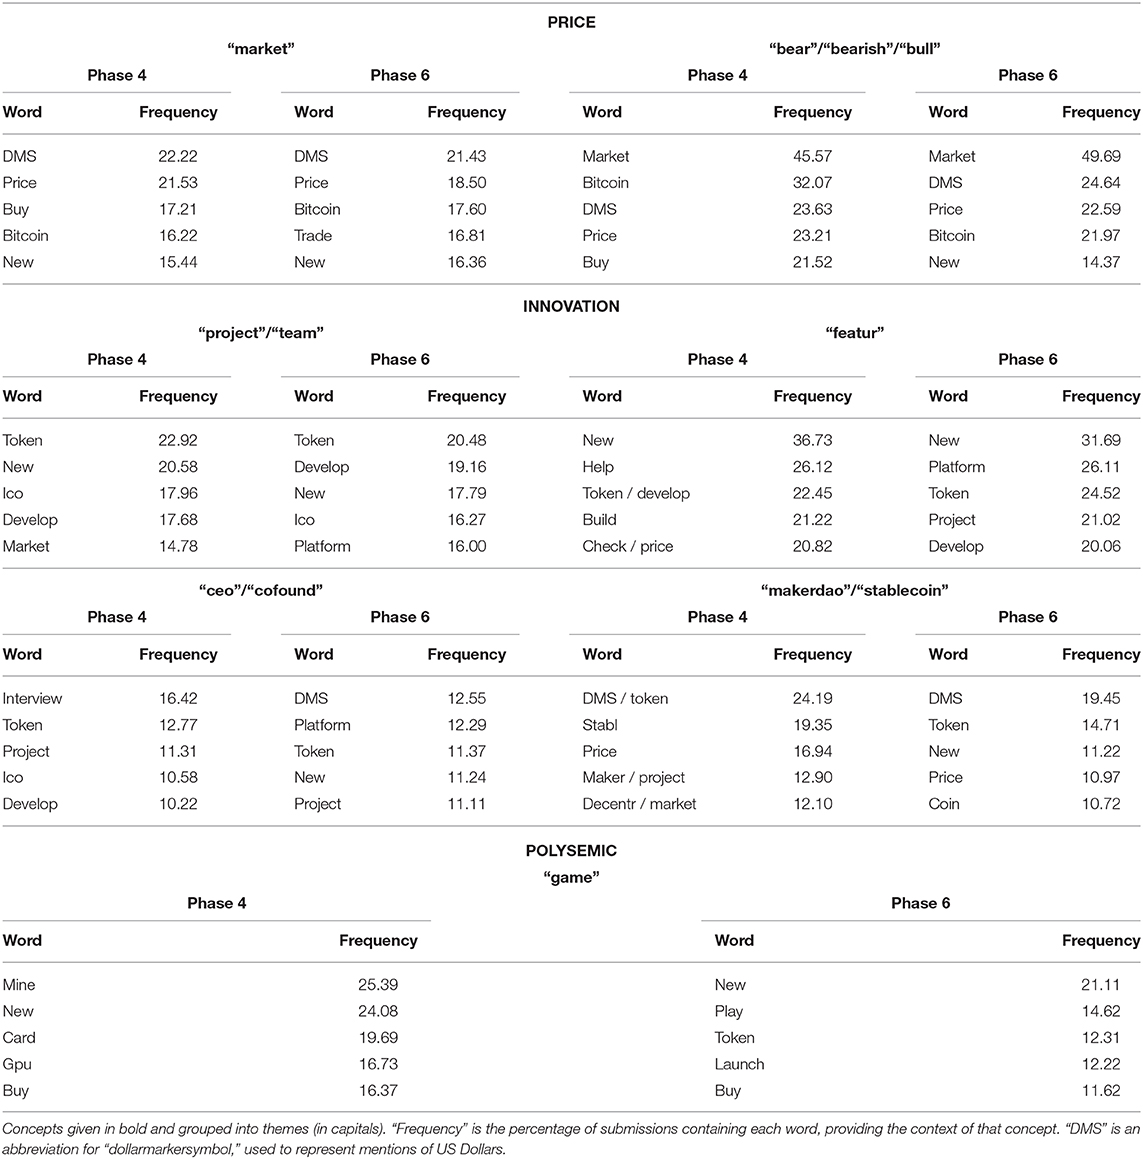
Table 8. Top five words occurring with each Ethereum falling-price, multi-phase concept in phases 4 and 6.
The Supplementary Results, in the Supplementary Data Sheet 1 provide further detail on the percentage change in popularity for Bitcoin multi-phase concepts (see Table S8) and Ethereum multi-phase concepts (Table S9).
3.4. Coherence With Known Facts
Of the Bitcoin mono-phase themes (see Table 3), regulatory bans are the closest to capturing a specific external event. Discussion of “korea” and “minist”/“ministri” occurred with the debate between the Ministry of Finance and Justice in South Korea as to whether a ban on cryptocurrency trading activity should be implemented, with one proposal being that cryptocurrencies are a scam that should be subject to criminal charges (Jaewon, 2017). On 16 December 2017, when prices changed to falling, South Korean news media reported how North Korea was using hacks of South Korean exchanges to fund its regime, encouraging South Korean support for a ban (Harper, 2017). This could have triggered South Koreans to sell bitcoin holdings before this became illegal and possibly even criminal (Jaewon, 2017). Since approximately a fifth of bitcoin transactions were in South Korean Won at the time (Jaewon, 2017), it is coherent with known events that this caused the shift from rising to falling prices. The presence of “india” in 23.64% “minist”/“ministri” submissions may reflect concerns over bitcoin regulation, including rumours of a possible ban in India during phase 2 (Lomas, 2018).
The remaining Bitcoin mono-phase concepts could be reflections of a change in mind-set among bitcoin-holders prior to selling. Before selling, holders of bitcoin are likely to become concerned as to the future of bitcoin (theme “Sell or Switch to Altcoin” in Table 3) and to consider how to transact the bitcoin held (theme “Transaction Practicalities”). Concerned holders of bitcoin may consider: rival cryptocurrencies (“cardano”/“eo”/“iota”/“rippl”/“stellar”/“tron” and “airdrop”); Binance, an exchange selling more than 150 cryptocurrencies (Binance, 2019); and whether to stop reinvesting mining “profit[s]” from Hashflare (“hashflar”) to generate more bitcoin (Ramarao, 2017). Other bitcoin-holders may dismiss concerns raised on social media platforms (“discord”) as price manipulation (“pumpanddump”). Before selling bitcoin, holders may consider the practicalities of: reducing “fee[s]” through batching transactions (“batch”) (Harding, 2017); seeking “support” on exchanges (“changelli”); and determining whether transferring bitcoin from a “bech32” address is “support[ed]” (Sedgwick, 2019).
All the concepts delineated for Ethereum were multi-phase, having a recurring impact on price over time. Innovation (“project”/“team,” “featur,” “ceo”/“cofound” and “makerdao”/“stablecoin”) was associated with falling prices (Table 8). This suggests that ether holders disposing of their ether to capitalise on new “token[s]” from new cryptocurrencies was a cause of price falls. This included “project[s]” or “team[s]” “develop[ing]” (≥ 17.68% submissions) “new” (≥ 17.79%) “token[s]” (≥ 20.48%) through Initial Coin Offerings (“ico”; ≥ 16.27%). Mentioned in relation to this was “ceo”/“cofound” (“project” ≥ 11.11% submissions) and “featur” (“project” ≥ 15.51% submissions). A separate innovation theme related to interest in MakerDAO, which was launched in December 2017 enabling holders to exchange their ether for Dai, a decentralised “stablecoin” designed to maintain its value in US Dollars (MakerDAO, 2018).
For Ethereum, price discussed in the context of “hit” was supported as causing prices to rise whilst “market” price and sentiment (“bear”/“bearish”/“bull”) discourse were associated with price falls (see Tables 7, 8). These discussions happened in the context of “bitcoin” which was a top five co-occurring word throughout. This suggests a source of ether price volatility was traders analysing the ether price and comparing it with bitcoin before buying or selling ether.
The multi-phase concept “market” was identified as a consistent driver for both falling bitcoin prices and falling ether prices. This was discussed in the context of price as well as buying, trading, and selling (see Tables 6, 8). This supports the widespread influence of technical traders who use just price information to make trading decisions on cryptocurrency price series and is consistent with evidence for price barriers at 400 US Dollars for ether and 6,000 US Dollars for bitcoin (see Figure 1).
Including contextual analysis in the framework has shown that some multi-phase concepts were polysemic—being used in a different context in different price phases. In some cases, this could be because the concept is an artefact of distinct themes of discussion each happening to include the polysemic concept. For instance, in the case of Ethereum, “game” was used in the context of using “gam[ing]” machines to mine ether in phase 4 (“mine,” “card,” “gpu”) and “play[ing]” “game[s]” in phase 6 (see Table 8). Both include the word “game” but are otherwise distinct issues and so examining the context reveals that “game” is probably a spurious result.
In contrast, with Bitcoin, the polysemic concept “sale” became popular in all four phases of falling prices making coincidence less plausible (see Table 6). The concept “sale” was mentioned in terms of “buy[ing]” and “sell[ing]” in phases 2 and 6, a “token” sale in phases 4 and 6 and “black” “friday” sales in phase 8. For “sale” to be irrelevant to price, distinct, irrelevant themes including “sale” would have to arise at the correct time across four different phases (falling price phases 2, 4, 6, and 8) and within 24 h before each phase to meet the multi-phase concept criteria. A tenable explanation is that “sale” is a general term that captures concern regarding bitcoin before decisions to sell. If holders are concerned about bitcoin, they could be more sensitive to any “sale” of bitcoin (phases 2 and 6); more interested in “token” “sale[s]” to exchange bitcoin for other tokens (phases 4 and 6); and more tempted by “black” “friday” “sale[s]” where bitcoins are exchanged for discounted products or sold to generate cash to buy such products (phase 8). This suggests the concept “sale” may have value as a negative sentiment indicator that warns of future falls in price.
The association of “tax” with rising ether prices could be explained by the timing of phases 3 and 5, which coincided with the end of tax years when “pay[ment]” of “capit[al]” “gain[s]” “tax” becomes due (see Table 7). The end of the tax year in some countries, such as the USA (Kagan, 2019), is on 31 December (phase 3 is from 23 November 2017 to 13 January 2018) but in the UK on 5 April (phase 5 was from 6 April to 5 May 2018) (Frecknall-Hughes, 2016).
4. Discussion
Our framework identifies plausible causes of the shifts in ether and bitcoin price trends. Approaches from healthcare epidemiology are deployed that facilitate this move from simply observing how word (Burnie and Yilmaz, 2019b) or topic (Burnie and Yilmaz, 2019a) interest changed across phases in price to identifying the potential causes of these phasic shifts. We find that the framework has to accommodate two distinct types of cause: the “multi-phase” that repeatedly cause shifts and the “mono-phase” with a one-off, strong impact. The results for Bitcoin differ from Ethereum, which is consistent with the observed differences in the timing of the highest price and the price phases. We identify a one-off effect of regulatory bans on bitcoin, a repeated effect of rival innovations on ether and the influence of technical traders, captured through market price discourse, on both cryptocurrencies. Traders seem to be comparing the prices of different cryptocurrencies: the Ethereum multi-phase concepts discussed with price commonly referred to “bitcoin,” and the Bitcoin mono-phase concept covering altcoins (“cardano”/“eo”/“iota”/“rippl”/“stellar”/“tron”) was discussed with US Dollars.
Previous social media analyses typically required judgement on which metric was most suitable in extracting insights from the social media text. For instance, this pre-selected metric could be a measure of sentiment or be based on a topic modelling algorithm. It was only after the values of the metric had been found that the price data were considered, in testing the association between changes in the metric and price (Kaminski, 2014; Garcia and Schweitzer, 2015; Georgoula et al., 2015; Matta et al., 2015; Kim et al., 2016, 2017; Abraham et al., 2018; Steinert and Herff, 2018).
We move from causal inference, where judgement is required to pre-select which potential causes and what causal mechanism should be tested (Runge et al., 2019), to causal location, where the best supported causes are located from among social media text. This enables the discovery of new potential causes of price variation which may not have otherwise been considered for testing. None of the potential causes identified (innovation, regulatory bans and technical traders) were suggested by Kim et al. (2017) in a previous analysis of the link between social media topics and bitcoin price. The approach of Kim et al. (2017) required judgement in expanding the list of words within each concept, tested for linear, predictive associations, and did not build a causal argument.
The risk that a concept was spurious was reduced by examining the words within the concept and the words used with that concept, and considering their coherence with known facts (see section 3.4). Concepts containing the word “feb” or the words “christma”/“holiday”/“xmas” were probably spurious, and could be attributed to the time of year as a confounding factor. The words within the delineated concepts relating to exchanges (“binanc”/“hitbtc” and “changelli”) did not, in themselves, suggest the influence of a confounding factor. However, these concepts were discussed with “send,” “transact” and US Dollar references (see Table 3). Hence, contextual analysis suggests that discussions of exchanges were more plausibly a response to fears over bitcoin price leading to discussion of how best to dispose of bitcoin, rather than a primary cause of falling prices. This contrasts with the concept “korea,” that was used with “ban” (Table 3), supporting rumours of a South Korean ban as precipitating the fall from the all time high price.
Multi-phase concepts may have implications for predictive analysis, since these concepts have a predictive association with price that persists across time. Multi-phase concepts may provide an improvement on sentiment metrics such as VADER that have found social media posts to be positive even during falling prices (Abraham et al., 2018). This extends to polysemic concepts, if their context supports such concepts as acting as proxies for positive or, in the case of “sale,” negative sentiment. The concept “market” was supported as a consistent driver of falling prices for both bitcoin and ether. However, the other multi-phase concepts differed, suggesting that different predictors may be suitable for different cryptocurrencies. Predictive modelling faces the limitation of one-off, impactful “mono-phase” events shaping the price trend. These may be considered analogous to “black swan” (Taleb, 2010) events, being unexpected and having a major impact, but they can be rationalised with the benefit of hindsight.
Future work could examine whether black swan events can be found in cryptocurrencies other than Bitcoin and whether such events are shared or unique to a specific cryptocurrency. Better understanding of the causes of shifts between price phases will help investors in diversifying their cryptocurrency investments to reduce risk.
Data Availability Statement
The sources of data are listed in section 2.1.1. The code used to prepare and analyse this data is publicly accessible in a Dryad data repository (Burnie et al., 2019) at: https://datadryad.org/stash/share/__NFDfahKD5bNOQEszg2pYv6OBg_bIOv3bbmntMJObs.
Author Contributions
AB processed and analysed the data, and drafted the article. EY and TA provided critical feedback on the article, inputting on the data processing and analysis approaches taken. All authors gave final approval for publication and agree to be held accountable for the work performed therein.
Funding
This work was supported by The Alan Turing Institute under the EPSRC grant EP/N510129/1 and Turing award number TU/C/000028. This project was partially funded by the EPSRC Fellowship titled Task Based Information Retrieval (grant reference number EP/P024289/1); BARAC project (EP/P031730/1); and FinTech project (H2020-ICT-2018-2 825215).
Conflict of Interest
The authors declare that the research was conducted in the absence of any commercial or financial relationships that could be construed as a potential conflict of interest.
Supplementary Material
The Supplementary Material for this article can be found online at: https://www.frontiersin.org/articles/10.3389/fbloc.2020.00001/full#supplementary-material
References
Abraham, J., Higdon, D., Nelson, J., and Ibarra, J. (2018). Cryptocurrency price prediction using tweet volumes and sentiment analysis. SMU Data Sci. Rev. 1. Available online at: https://scholar.smu.edu/datasciencereview/vol1/iss3/1
Aggarwal, R., and Lucey, B. M. (2007). Psychological barriers in gold prices? Rev. Financ. Econom. 16, 217–230. doi: 10.1016/j.rfe.2006.04.001
Alvarez, J. (2018). Crypto profiles: vitalik buterin, creator of ethereum. Blockonomi. Available online at: https://blockonomi.com/vitalik-buterin-profile/
Bamburic, M. (2017). Ethereum passes $400. BetaNews. Available online at: https://betanews.com/2017/11/23/ethereum-price-november-23/
Baumgartner, J. M. (2019). Pushshift API. Available online at: https://github.com/pushshift/api
Binance (2019). Buy and sell cryptocurrency. Binance. Available online at: https://www.binance.com/en/buy-sell-crypto
Blockchain Luxembourg, S. A. (2019). Blockchain Charts & Statistics Api. Available online at: https://www.blockchain.com/api/charts_api
Bradford Hill, A. (1965). The environment and disease: association or causation? Proc. R. Soc. Med. 58, 295–300.
Bridge, P. D., and Sawilowsky, S. S. (1999). Increasing physicians awareness of the impact of statistics on research outcomes: comparative power of the t-test and wilcoxon rank-sum test in small samples applied research. J. Clin Epidemiol. 3, 229–235.
Burnie, A., Burnie, J., and Henderson, A. (2018). Developing a cryptocurrency assessment framework: function over form. Ledger 3, 2379–5980. doi: 10.5195/LEDGER.2018.121
Burnie, A., and Yilmaz, E. (2019a). “An analysis of the change in discussions on social media with bitcoin price,” in 42nd International ACM SIGIR Conference on Research and Development in Information Retrieval (SIGIR 2019) (Paris: ACM SIGIR).
Burnie, A., and Yilmaz, E. (2019b). Social media and bitcoin metrics: which words matter. R. Soc. Open Sci. 6:191068. doi: 10.1098/rsos.191068
Burnie, A., Yilmaz, E., and Aste, T. (2019). Data From: Analysing Social Media Forums to Discover Potential Causes of Phasic Shifts in Cryptocurrency Price Series. Available online at: https://datadryad.org/stash/share/__NFDfahKD5bNOQEszg2pYv6OBg_bIOv3bbmntMJObs.
Chen, J. (2018). Profit taking. Investopedia. Available online at: https://www.investopedia.com/terms/p/profittaking.asp
Comben, C., and Rivet, C. (2019). Three ethereum subreddits you should start following. Yahoo Finance. Available online at: https://finance.yahoo.com/news/three-ethereum-subreddits-start-following-080019921.html
ConsenSys Media (2019). The 11 Best Sources for Ethereum News and Learning. Medium. Available online at: https://media.consensys.net/the-11-best-sources-for-ethereum-news-and-learning-783ef4803ab0
Cornfield, J., Haenszel, W., Hammond, E. C., Lilienfeld, A. M., Shimkin, M. B., and Wynder, E. L. (1959). Smoking and lung cancer: recent evidence and a discussion of some questions. J. Natl. Cancer Inst. 22, 173–203.
Cuthbertson, A. (2019). Bitcoin price surges past $7,000 as remarkable recovery continues. The Independent. Available online at: https://www.independent.co.uk/life-style/gadgets-and-tech/news/bitcoin-price-latest-btc-cryptocurrencyusd-exchange-rate-a8911186.html.
Dablander, F., and Hinne, M. (2019). Node centrality measures are a poor substitute for causal inference. Sci. Rep. 9:6846. doi: 10.1038/s41598-019-43033-9
Dowling, M., Cummins, M., and Lucey, B. M. (2016). Psychological barriers in oil futures markets. Energy Econ. 53, 293–304. doi: 10.1016/j.eneco.2014.03.022
ElBahrawy, A., Alessandretti, L., and Baronchelli, A. (2019). Wikipedia and cryptocurrencies: interplay between collective attention and market performance. Front. Blockchain 2:12. doi: 10.3389/fbloc.2019.00012
Etherscan (2019). Ethereum (Ether) Historical Prices. Available online at: https://etherscan.io/chart/etherprice
Frecknall-Hughes, J. (2016). Why the UK tax year begins on April 6 (it's a very strange tale). The Independent. Available online at: http://www.independent.co.uk/money/why-the-uk-tax-year-begins-on-april-6-it-s-a-very-strange-tale-a6970801.html
Garcia, D., and Schweitzer, F. (2015). Social signals and algorithmic trading of Bitcoin. R. Soc. Open Sci. 2:150288. doi: 10.1098/rsos.150288
Garcia, D., Tessone, C. J., Mavrodiev, P., and Perony, N. (2014). The digital traces of bubbles: feedback cycles between socio-economic signals in the Bitcoin economy. J. R. Soc. Int. 11:201406423. doi: 10.1098/rsif.2014.0623
Georgoula, I., Pournarakis, D., Bilanakos, C., Sotiropoulos, D. N., and Giaglis, G. M. (2015). Using time-series and sentiment analysis to detect the determinants of bitcoin prices. SSRN Electronic Journal. Available online at: http://www.ssrn.com/abstract=2607167.
Grimes, D. A., and Schulz, K. F. (2002). Bias and causal associations in observational research. Lancet 359, 248–252. doi: 10.1016/S0140-6736(02)07451-2
Harding, D. A. (2017). Saving up to 80% on Bitcoin transaction fees by batching payments. Medium. Available online at: https://bitcointechtalk.com/saving-up-to-80-on-bitcoin-transaction-fees-by-batching-payments-4147ab7009fb
Harper, C. (2017). North Korean hackers attacked South Korean exchanges, NIS claims. The Merkle Hash. Available online at: https://themerkle.com/north-korean-hackers-attacked-south-korean-exchanges-nis-claims/
Ioannidis, J. P. A. (2016). Exposure-wide epidemiology: revisiting Bradford Hill. Stat. Med. 35, 1749–1762. doi: 10.1002/sim.6825
Jaewon, K. (2017). South Korea joins in Asia-wide bitcoin crackdown. Nikkei Asian Review. Available online at: https://asia.nikkei.com/Economy/South-Korea-joins-in-Asia-wide-bitcoin-crackdown
Kagan, J. (2019). Tax year definition. Investopedia. Available online at: https://www.investopedia.com/terms/t/taxyear.asp.
Kim, Y. B., Kim, J. G., Kim, W., Im, J. H., Kim, T. H., Kang, S. J., et al. (2016). Predicting fluctuations in cryptocurrency transactions based on user comments and replies. PLoS ONE 11:e161197. doi: 10.1371/journal.pone.0161197
Kim, Y. B., Lee, J., Park, N., Choo, J., Kim, J.-H., and Kim, C. H. (2017). When Bitcoin encounters information in an online forum: using text mining to analyse user opinions and predict value fluctuation. PLoS ONE 12:e0177630. doi: 10.1371/journal.pone.0177630
Kjærland, F., Meland, M., Oust, A., and Øyen, V. (2018). How can bitcoin price fluctuations be explained? Int. J. Econom. Finan. Issues 8, 323–332. Available online at: https://www.econjournals.com/index.php/ijefi/article/view/6446/pdf
Knittel, M. L., and Wash, R. (2019). “How “True Bitcoiners” work on reddit to maintain bitcoin,” in Extended Abstracts of the 2019 CHI Conference on Human Factors in Computing Systems–CHI EA '19 (Glasgow: ACM Press).
Kristoufek, L. (2013). BitCoin meets Google Trends and Wikipedia: Quantifying the relationship between phenomena of the Internet era. Sci. Rep. 3:3415. doi: 10.1038/srep03415
Li, X., and Wang, C. A. (2017). The technology and economic determinants of cryptocurrency exchange rates: the case of Bitcoin. Decis. Supp. Syst. 95, 49–60.
Liu, Y., and Tsyvinski, A. (2018). Risks and returns of cryptocurrency. NBER Working Paper Series. Available online at: http://www.nber.org/papers/w24877
Lomas, N. (2018). PSA: No India hasn't banned Bitcoin – but it's still talking tough on crypto. TechCrunch. Available online at: http://social.techcrunch.com/2018/02/03/psa-no-india-hasnt-banned-bitcoin-but-its-still-talking-tough-on-crypto/
Maathuis, M. H., Kalisch, M., and Bühlmann, P. (2009). Estimating high-dimensional intervention effects from observational data. Ann. Stat. 37, 3133–3164. doi: 10.1214/09-AOS685
MakerDAO (2018). Dai is now live! Medium. Available online at: https://blog.makerdao.com/dai-is-now-live/
Matta, M., Lunesu, I., and Marchesi, M. (2015). “Bitcoin spread prediction using social and web search media,” in DeCAT 2015: Workshop on Deep Content Analytics Techniques for Personalized and Intelligent Services.
Mikolov, T., Chen, K., Corrado, G., and Dean, J. (2013a). Efficient estimation of word representations in vector space. arXiv:1301.3781.
Mikolov, T., Sutskever, I., Chen, K., Corrado, G. S., and Dean, J. (2013b). “Distributed representations of words and phrases and their Compositionality,” in Advances in Neural Information Processing Systems 26, eds C. J. C. Burges, L. Bottou, M. Welling, Z. Ghahramani, and K. Q. Weinberger (Lake Tahoe, NV: Curran Associates, Inc), 3111–3119.
Murphy, C. (2019). Support and resistance basics. Investopedia. Available online at: https://www.investopedia.com/trading/support-and-resistance-basics/
NetworkX (2019). Software for complex networks. Available online at: https://networkx.github.io/
Pearl, J., Glymour, M., and Jewell, N. P. (2016). Causal Inference In Statistics: A Primer. Chichester: Wiley.
Polasik, M., Piotrowska, A. I., Wisniewski, T. P., Kotkowski, R., and Lightfoot, G. (2015). Price fluctuations and the use of bitcoin: an empirical inquiry. Int. J. Electr. Commerce 20, 9–49. doi: 10.1080/10864415.2016.1061413
r/Bitcoin (2019). r/Bitcoin. Reddit. Available online at: https://www.reddit.com/r/Bitcoin/
r/ethereum (2019). r/ethereum. Reddit. Available online at: https://www.reddit.com/r/ethereum/
Ramarao, P. (2017). Hashflare math: should you reinvest? Medium. Available online at: https://medium.com/@pranav.rr93/hashflare-making-60x-returns-in-1-year-9dda301a4943
Řehůřek, R. (2019). models.word2vec - Word2vec embeddings. Gensim: Topic Modelling for Humans. Available online at: https://radimrehurek.com/gensim/models/word2vec.html
Revealing Reality (2019). How and Why Consumers Buy Cryptoassets: A Report for the FCA. Available online at: https://www.fca.org.uk/publication/research/how-and-why-consumers-buy-cryptoassets.pdf
Rosenbaum, P. R. (2017). Observation and Experiment: An Introduction To Causal Inference. Cambridge: Harvard University Press.
Runge, J., Bathiany, S., Bollt, E., Camps-Valls, G., Coumou, D., Deyle, E., et al. (2019). Inferring causation from time series in Earth system sciences. Nat. Commun. 10:2553. doi: 10.1038/s41467-019-10105-3
Sedgwick, K. (2019). Everything You Should Know About Bitcoin Address Formats. Bitcoin News. Available online at: https://news.bitcoin.com/everything-you-should-know-about-bitcoin-address-formats/.
Steinert, L., and Herff, C. (2018). Predicting altcoin returns using social media. PLoS ONE 13:e0208119. doi: 10.1371/journal.pone.0208119
Taleb, N. N. (2010). The Black Swan: The Impact Of The Highly Improbable. London: Incerto, Penguin Books.
Urquhart, A. (2018). What causes the attention of Bitcoin? Econom. Lett. 166, 40–44. doi: 10.1016/j.econlet.2018.02.017
Westerhoff, F. (2003). Anchoring and psychological barriers in foreign exchange markets. J. Behav. Finance 4, 65–70. doi: 10.1207/S15427579JPFM0402-03
Wild, C. J., and Seber, G. A. F. (2000). Chance Encounters: A First Course in Data Analysis and Inference. New York, NY: Wiley.
Wilmoth, J. (2017). Bitcoin Price Sets New All-Time High as Crypto Market Cap Nears $250 Billion. CCN Markets. Available online at: https://www.ccn.com/bitcoin-price-sets-new-all-time-high-as-crypto-market-cap-nears-250-billion/
Keywords: cryptocurrency, social media, causality, price, Reddit, bitcoin, Ethereum
Citation: Burnie A, Yilmaz E and Aste T (2020) Analysing Social Media Forums to Discover Potential Causes of Phasic Shifts in Cryptocurrency Price Series. Front. Blockchain 3:1. doi: 10.3389/fbloc.2020.00001
Received: 14 October 2019; Accepted: 10 January 2020;
Published: 28 January 2020.
Edited by:
Stefano Bistarelli, University of Perugia, ItalyReviewed by:
Nicola Dimitri, University of Siena, ItalyGianna Figa-Talamanca, University of Perugia, Italy
Copyright © 2020 Burnie, Yilmaz and Aste. This is an open-access article distributed under the terms of the Creative Commons Attribution License (CC BY). The use, distribution or reproduction in other forums is permitted, provided the original author(s) and the copyright owner(s) are credited and that the original publication in this journal is cited, in accordance with accepted academic practice. No use, distribution or reproduction is permitted which does not comply with these terms.
*Correspondence: Andrew Burnie, YWJ1cm5pZUB0dXJpbmcuYWMudWs=