Abstract
Decentralized applications (dApp) have proliferated in recent years, but their long-term viability is a topic of debate. However, for dApps to be sustainable, and suitable for integration into a larger service networks, they need to attract users and promise reliable availability. Therefore, assessing their longevity is crucial. Analyzing the utilization trajectory of a service is, however, challenging due to several factors, such as demand spikes, noise, autocorrelation, and non-stationarity. In this study, we employ robust statistical techniques to identify trends in currently popular dApps. Our findings demonstrate that a significant proportion of dApps, across a range of categories, exhibit statistically significant positive overall trends, indicating that success in decentralized computing can be sustainable and transcends specific fields. However, there is also a substantial number of dApps showing negative trends, with a disproportionately high number from the decentralized finance (DeFi) category. Furthermore, a more detailed inspection of time series segments shows a clearly diminishing proportion of positive trends from mid-2021 to the present. In summary, we conclude that the dApp economy might have lost some momentum, and that there is a strong element of uncertainty regarding its future significance.
1 Introduction
Blockchain is a decentralized, digital ledger that records transactions in a secure, transparent and immutable way. Its invention is attributed to a 2008 white paper, authored under the name Satoshi Nakamoto (Nakamoto, 2008). The concept relies on distributed databases that maintain a continuously growing list of records, called blocks. Transactions are verified by the network of databases and added to a new block, which is linked to its predecessor. Each block contains transaction data, a timestamp, and a cryptographic hash of the previous block, forming a chain of digital, encrypted signatures. This, and the decentralized nature of the blockchain, renders manipulation attempts nearly impossible, as meddling in one block would, in principle, be detected and rejected by the network. The blockchain architecture can also be used to store executable programs, a concept first introduced by Ethereum (Buterin, 2014; Wood, 2014). These programs are known as smart contracts. Once deployed, their logic cannot be altered, and they can be used, for example, to manage the transfer of virtual assets. Smart contracts, however, are often not user-friendly and require professional skills to interact with. Decentralized applications (dApps) address this usability concern by combining one or several smart contracts with a front-end user interface (Duan et al., 2022). While their smart contract components cannot be revised, other components, such as the front-end user interface and backend infrastructure, might be updated or modified as needed. However, the ultimate dApp would be completely hosted on a blockchain, would not be owned or controlled by any single entity, such as a company or government, and could not be shut down by a single point of failure (Cai et al., 2018). At present, dApps are used for a wide range of applications, such as financial services, gaming, social interaction or identity verification. One example of a popular dApp is CryptoKitties, a blockchain-based game that allows users to buy, breed and sell unique digital cats (Serada et al., 2021).
While some have hyped dApps as transformative for digital services, others have met them with skepticism (
Cai et al., 2018). Empirically, a limited number of dApps enjoys great popularity, but the majority is underutilized (
Wu et al., 2021). More relevant than the current demand is, however, the prospect of a continuously growing user base:
• Increasing demand suggests that the dApp offers a useful service and may be attractively designed in terms of interface, compatibility, pricing and more. In itself, this is feedback and gives guidance to developers for existing and future projects.
• For investors, it signals an investment opportunity and potential for revenue and profit, justifying the allocation of resources.
• More resources allow for improvements and enhancements to be made to a dApp’s features and functionality. It increases the likelihood of the service’s long-term availability, which is an important criterion for customers and other services when considering whether to interact with it.
• Many dApps promise income opportunities for users, e.g. through the creation and trading of non-fungible tokens (NFT) (Cai et al., 2018), through the exchange of securities or collectibles, by running a shop, venue, casino, advertising medium etc. in a metaverse, or similar. The chances of such promise to materialize is very much reliant on sufficiently large networks of users. Therefore, growth is a prerequisite to satisfactory supply and demand, and consequently a positive user experience.
Detecting growth patterns in time series requires careful consideration of autocorrelation, non-stationarity, noise and outliers (Durlauf et al., 2005). However, trends are of wide interest in a range of disciplines, e.g. hydrology, climate change, or economics (Noguchi et al., 2011). As a result, the methodologies for analyzing trends are relatively well-established. This paper aims to statistically evaluate the long-term trends of currently popular dApps, with a specific focus on determining the relative potential for different categories and applications to thrive.
2 Related work
The research on blockchain and related applications has gained significant attention from the academic community. On dApps, many studies have focused on technical aspects, such as the suitability of specific blockchain solutions for different use cases (Belotti et al., 2019), the characterization and the prospects of distributed ledger technology (Wang et al., 2018), and privacy and security of blockchains (Zhang et al., 2020). Also, blockchain applications with regard to communications, more specifically 5G and beyond networks, have been described with a focus on the interrelation between blockchain properties, blockchain modules and the desired benefits of decentralization (Liu et al., 2020; Yue et al., 2021). Cai et al. discuss the nature and potential of different categories of dApps and the adequacy of various blockchain implementations (Cai et al., 2018). However, also the popularity of dApps has been investigated. Based on a dataset on 995 Ethereum dApps, Wu et al. provide extensive descriptive statistics on their utilization and the interaction patterns of smart contracts. They explore data from the website State of the DApps and find that almost all user interest is concentrated on less than 20% of all dApps, that only 15.7% of dApps can be considered fully open source and that 75% of dApps consist of only one smart contract (Wu et al., 2021). Several studies explored user-induced phenomena in blockchain-ecosystems and develop models to describe and predict prices of tokens: Nadini et al. analysed 6.1 million trades of 4.7 million NFTs to obtain statistical properties of the market. By reconstructing the network of interactions, they show that traders typically specialize on certain types of NFT and form clusters with traders similar to themselves. They also explore the visual homogeneity of traded NFTs and find that sales history, and, to some lesser extent, visual features are good predictors for future price (Nadini et al., 2021). Kong and Lin identify that the price of an NFT is largely determined by its scarcity and the buyer’s aesthetic preferences, and that NFT prices surge in the absence of sufficiently attractive investment alternatives (Kong and Lin, 2021). Ante models the interrelationships between NFTs, NFT owners and the pricing of Bitcoin and Ether by employing an econometric approach. He finds that both, Bitcoin and Ether price shocks, effect the NFT market with no reverse effect, i.e. NFT pricing does not impact the two cryptocurrencies (Ante, 2022). This is partially in line with Dowling, who remains more vague in concluding that there is some co-movement between cryptocurrencies and NFTs, but identifies the correlation to be weak (Dowling, 2022). Maouchi et al. investigate speculative behaviour by detecting digital financial bubbles in decentralized finance (DeFi), NFTs and, more frequent but with a smaller magnitude, cryptocurrencies (Maouchi et al., 2022).
The study conducted by Wu et al. (2021) is the most closely related research to our work, as it provides a thorough empirical analysis of dApp usage. However, to the best of our knowledge, no prior study has statistically examined trends in dApp utilization data.
3 Methods
In this paper, we use a sieve-bootstrap version of the Mann-Kendall (MK) test to identify statistically significant trends in the interaction data of a subset of dApps. Additionally, we compute the Theil-Sen (TS) estimator of slope to assess the direction and magnitude of potential trends. Furthermore, we conduct a detailed examination of the overall time series, focusing on localizing structural breaks that may indicate changes in trends. The methods are explained in more detail in the following. All measures were computed in R, using the libraries “trend” and “funtimes” (Lyubchich et al., 2023), and “strucchange” (Zeileis et al., 2002). For data and results management, and for supporting analyses, the statistical package KNIME (KNIME, 2023.000Z) was used.
3.1 MK test
The MK test is a non-parametric statistical test to detect monotonic associations between two vectors and (Mann, 1945; Kendall and Gibbons, 1990). Its test statistic is Kendall’s coefficient, which is calculated as the difference between the number of concordant pairs and discordant pairs of observations, divided by the number of all pairs:
Note that and are considered concordant if and , or and , and discordant if and , or and . In case of ties, i.e. while , or while , the denominator requires adjustment for the number of ties in both, the - and the -quantity (Kendall and Gibbons, 1990). Under MK, the null hypothesis is that and are random samples from two independent populations with between them, i.e. no monotonic association or trend. For large , tends to normality with and for independent observations (Hamed and Ramachandra Rao, 1998).
The MK test has been widely used to test for trends in time series (Hamed, 2009), which is also the case in this study. Here, represents the observed quantity over time, while represents the dates or simply a chronological numbering of the time series (Mann, 1945).
3.2 Sieve-bootstrapping
Time series data often exhibit serial correlation, which can inflate the -value of statistical tests (Noguchi et al., 2011). For instance, the violation of the assumption of independent observations can increase the type I error of the MK test, leading to an incorrect rejection of the null hypothesis of no trend (Cox and Stuart, 1955). This is because correlation between consecutive observations can increase the sampling variance and complicate the derivation of the underlying test distribution. To overcome this issue without relying on distributional assumptions, bootstrapping is a popular approach. In classic bootstrapping, a large number of new samples are generated by randomly drawing from the obtained dataset with replacement, such that each sample may contain some observations multiple times and others not at all. However, this procedure does not preserve any underlying temporal dependence structure which is important to adequately assess time series (Noguchi et al., 2011). To address this, sieve-bootstrapping is proposed, which first fits an autoregressive (AR) model of order (more precisely: ) under the null hypothesis of no trend (Bühlmann, 1997):
Then, B bootstrap samples of are generated by resampling the residuals to the fitted AR model. The resulting bootstrap samples are used to compute a sequence of test statistics , from which the -value of the original data is derived as the fraction of exceeding (Noguchi et al., 2011).
3.3 TS estimator of slope
The TS estimator of slope , first proposed in 1950 and also known as Sen’s slope, is a non-parametric approach for approximating a linear trend (Sen, 1963; Theil, 1992). It is the median of the slopes of all pairs of observation points:
The TS estimator is robust with a high breakdown point (Dang et al., 2008), which is particularly useful for analyzing data with outliers. Its robustness is the key reason for preferring it here over the more commonly used ordinary least squares method, which is sensitive to outliers (Durlauf et al., 2005).
3.4 Structural breaks
Structural breaks refer to significant changes in the underlying structure or behavior of a time series, such as sudden shifts in slope, mean, variance, or other properties of the data. A linear regression model with break points, separating segments with individual parameters, can be written as:
Here, represents the observed dependent quantity over time, is the vector of regressors (in our case, points in time; and ), is the index of the time series segment, and are the corresponding coefficients, and is the vector of disturbances at time (Bai and Perron, 1998; 2003; Zeileis et al., 2003). The break points , and the coefficients are both unknown and need to be estimated simultaneously (Bai and Perron, 2003).
To investigate the trend behavior of individual time series segments, we employ a two-step strategy:
• Firstly, we use the R-package “strucchange” (Zeileis et al., 2002) to identify potential break dates. This method utilizes a dynamic programming algorithm proposed by Bai and Perron, to calculate the matrix of sums of squared residuals for all possible segments (Bai and Perron, 1998). Bai and Perron demonstrate in their seminal work that this number is at most , that the global sum of squared residuals is a particular linear combination thereof, and that the optimal -partition of segments corresponds to a linear combination of these residuals (Bai and Perron, 2003).
• Secondly, we apply the trend detection procedures described above (sieve-bootstrapped MK test, TS estimator of slope) to each individual segment identified in the first step.
Our aim with this strategy is to maintain consistency in the methods used to analyze both the time series as a whole and their individual segments. For a comprehensive overview and detailed descriptions of alternative approaches to identifying and testing for structural breaks, refer to Casini and Perron, 2018 or Muthuramu and Uma Maheswari, 2019.
4 Data
4.1 Source
The study utilized publicly accessible data from DappRadar, a website that provides statistics and news on dApps and NFTs across more than 50 blockchain networks (DappRadar - The World’s Dapp Store | Blockchain Dapps Ranked, 2023.000Z). DappRadar offers a comprehensive history of daily unique active wallets (UAW), daily transactions, and daily volume for each dApp. The website ranks dApps based on their balance, which refers to the total value of assets in a dApp’s smart contracts, the number of UAW interacting with a dApp’s smart contracts, and the volume, which represents the incoming value to a dApp’s smart contracts. These rankings are available for the most recent 24-h, 7-day, or 30-day window. For the study, we queried all historical data for all dApps in the 30-day top 100 of at least one of the three ranking criteria (balance, UAW, volume). As a result, we obtained data for 197 dApps, noting that several dApps are listed in more than one top 100 ranking. The earliest record in the dataset is from 23 June 2017, and we set the cut-off date for all time series to 31 March 2023. Name details of queried dApps, sorted by category as provided by DappRadar, are given at Table 1. A characterization of these categories is proposed by Min and Cai (Min and Cai, 2022).
TABLE 1
| Category | dApp name |
|---|---|
| Collectibles | CryptoPunks, NBA TopShot |
| DeFi | 1inch Network, ACryptoS, ALEX, Aave V2, Aave V3, Abracadabra.Money, Alethea AI, Alpaca Finance, Ampleforth, ApeStake, ApeSwap, ApolloX, Aura Finance, Aurigami, AutoShark Finance, Axelar Network, Baby Doge Swap, Beethoven X, BinaryX, Biswap, BitKeep Swap, Bungee, CREAM, CelerNetwork, CoW Swap, Compound, Convex Finance, Curve, DipoleSwap, ETH2 Deposit Contract, Elephant Money, EmpireDEX, Empyrean, Euler Finance, Everscale DePools and Staking, Fei Protocol, Ferro Protocol, GMX, Gamma Strategies, Geist, Idle Finance, Integral SIZE, JustLend, KLEVA Protocol, Katana, LIDO, Liquity, Marinade Finance, MeanFi, Mercor Finance, Mercurial, Meshswap, MetaMask Swap, Metavault.Trade, Mimas Finance, Minswap, Moonwell Artemis, Multichain, Oasis.app, Odos, Onyx Protocol, OpenOcean, Orbit Bridge, PancakeSwap, PinkSale, Planet, Polygon POS Bridge, PoolTogether, QiDao, Raydium, Reflexer Labs, Rocket Pool, Saber, Sablier, Sharky, ShibaSwap, Sonne Finance, Sphere Finance, Stargate Finance, Strike Finance, Superfluid, Sushi, Synapse, Team Finance, Tectonic, Thales, Trader Joe, Tranchess Protocol, Transit Swap, Venus Protocol, Via Protocol, WOOFi, Wombat Exchange, Wormhole, dForce, dYdX, ioTube, yearn.finance (YFI) |
| Exchanges | 0x Protocol, Balancer, Bridgers, Bullish, Camelot, DODO, Dfyn Network, Equalizer, HOP Protocol, KLAYswap, KyberSwap Elastic, LEVEL, LI.FI, Mummy Finance, OKX DEX, ParaSwap, QuickSwap, SpookySwap, SunSwap, Thena, Tokenlon, Uniswap V2, Uniswap V3, VVS Finance, Vela Exchange |
| Gambling | Doge Casino, OwlDAO, Serious Dice, TT Prize, Waxcasino |
| Games | Alien Worlds, Arc8 by GAMEE, Axie Infinity, Benji Bananas, Crazy Defense Heroes, DeFi Kingdoms, Era7: Game of Truth, Farmers World, Galactic Arena, Hunters On-Chain by BoomLand, Iskra, MOBOX: NFT Farmer, Meta Apes, Nine Chronicles, Oath of Peak, P12, PLAYZAP GAMES, Planet IX, PlayEmber, PlayMining, Playbite, REVV Racing, Raini: The Lords Of Light, SecondLive, Splinterlands, Sunflower Land, The Sandbox, Trickshot Blitz, Ultimate Champions, Ultiverse, Upland, Wombat Dungeon Master, Yuliverse |
| High Risk | Cairo Finance, Tron Holding |
| Marketplaces | AtomicHub, Blur, Element Market, JPG Store, Magic Eden, Manifold, OpenSea, Rarible, ThetaDrop, Uniswap NFT Aggregator, X2Y2, tofuNFT |
| Other | Across, Arbitrum, AtomicAssets, IoTeX Voting Portal, Lifeform, QuestN, SPACE ID, Sol Incinerator, Sweat Economy, Tetra, TinyTap, Tornado Cash |
| Social | CyberConnect, Decentraland, Galxe, Hooked, KlimaDao, Lens Protocol, Phi, TaskOn |
List of dApps analyzed in this study.
4.2 Description
The overwhelming majority of dApps in the dataset belong to the DeFi category (98 of 197, 49.7%). In contrast, Collectibles and High Risk categories account for only two dApps each. The time series analysis revealed considerable variability, both within and between dApp history, with the data exhibiting a pronounced right-skewness, characterized by the presence of extreme outliers towards the higher end, most notable in trading volumes. Also, the dataset contains a significant number of records with values of zero. Specifically, out of 133,971 records, 7,401 (5.5%) indicate zero UAW, 11,174 (8.3%) represent zero transactions, and 25,429 (19.0%) correspond to zero trading volume. The dataset’s highest recorded values are 794,559 UAW, 16,304,194 transactions, and an extraordinary trading volume of approximately 1.8E17 USD. This exceptionally high trading volume raises concerns of potential recording errors for a single day. However, it is plausible that dApps can generate such volumes, as indicated by the dataset’s top 100 values, starting from 16.5 billion USD. For illustration, Figure 1 presents the complementary cumulative distribution functions (CCDF) for all three metrics encompassing the complete dataset, using log-log scales.
FIGURE 1
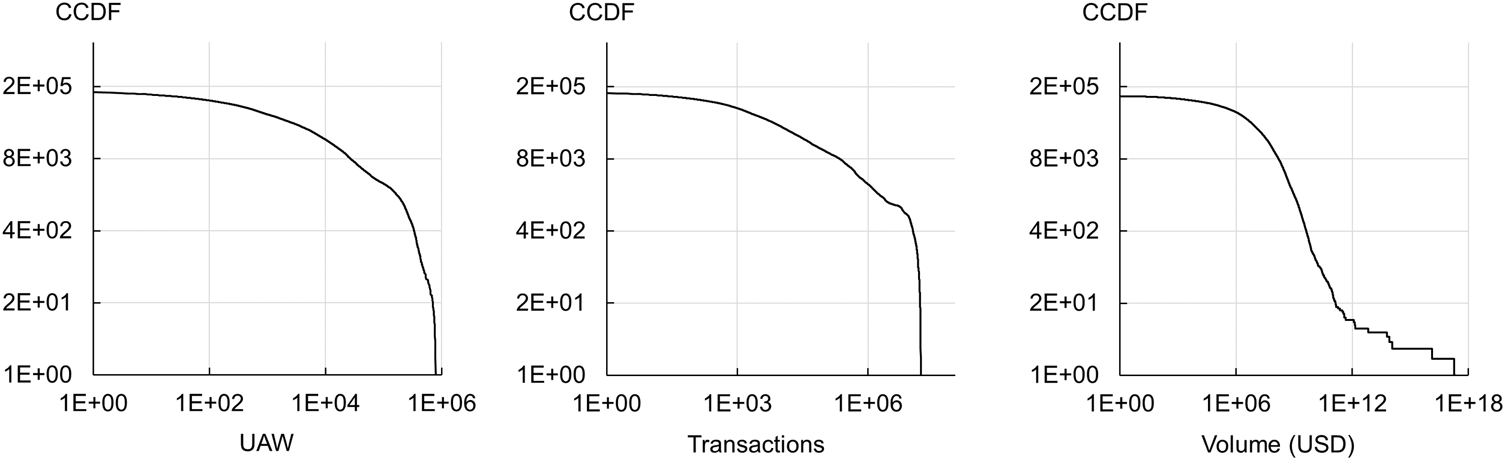
CCDF of daily UAW, transactions and volume (both axes: logarithmic scale).
For further characterization, we computed selected quantiles for each measure of utilization by category; see Table 2. Our results suggest that Marketplaces and Games tend to attract a higher number of connected wallets and also exhibit the most transactions. However, Exchanges and DeFi dApps appear to generate the highest volumes.
TABLE 2
| Quantile | |||||||
|---|---|---|---|---|---|---|---|
| Measure | Category | n | 0.2 | 0.4 | 0.6 | 0.8 | 0.95 |
| UAW | Collectibles | 2 | 4 | 22 | 81 | 3655 | 23,395 |
| DeFi | 98 | 17 | 126 | 504 | 1960 | 9497 | |
| Exchanges | 25 | 185 | 686 | 2324 | 7902 | 22,928 | |
| Gambling | 5 | 95 | 174 | 561 | 14,550 | 33,736 | |
| Games | 33 | 36 | 754 | 6112 | 23,438 | 189,932 | |
| High Risk | 2 | 42 | 117 | 2464 | 11,161 | 16,346 | |
| Marketplaces | 12 | 132 | 910 | 4241 | 21,257 | 56,439 | |
| Other | 12 | 1 | 8 | 32 | 1395 | 51,965 | |
| Social | 8 | 71 | 229 | 616 | 1935 | 51,634 | |
| Total | 197 | 22 | 188 | 838 | 5015 | 32,985 | |
| Transactions | Collectibles | 2 | 12 | 64 | 214 | 78,755 | 343,363 |
| DeFi | 98 | 24 | 223 | 1038 | 4569 | 30,065 | |
| Exchanges | 25 | 330 | 1727 | 5236 | 16,114 | 56,565 | |
| Gambling | 5 | 307 | 1092 | 2762 | 72,345 | 176,741 | |
| Games | 33 | 70 | 1922 | 2.30E+04 | 1.98E+05 | 5.91E+06 | |
| High Risk | 2 | 60 | 158 | 5382 | 17,036 | 26,816 | |
| Marketplaces | 12 | 295 | 1835 | 2.82E+04 | 3.13E+05 | 1.12E+06 | |
| Other | 12 | 0 | 4 | 44 | 4798 | 4.74E+05 | |
| Social | 8 | 91 | 618 | 2284 | 1.01E+04 | 1.32E+05 | |
| Total | 197 | 29 | 396 | 1989 | 13,853 | 297,848 | |
| Volume (USD) | Collectibles | 2 | 206 | 1.13E+04 | 5.50E+05 | 2.39E+06 | 1.09E+07 |
| DeFi | 98 | 1881 | 4.20E+05 | 3.31E+06 | 2.25E+07 | 2.33E+08 | |
| Exchanges | 25 | 8.06E+05 | 6.27E+06 | 3.49E+07 | 1.47E+08 | 1.53E+09 | |
| Gambling | 5 | 91 | 895 | 7568 | 1.17E+05 | 2.92E+05 | |
| Games | 33 | 0 | 0 | 1143 | 6.18E+04 | 3.10E+06 | |
| High Risk | 2 | 105 | 1471 | 6535 | 4.11E+04 | 1.03E+06 | |
| Marketplaces | 12 | 1.15E+04 | 6.10E+04 | 2.52E+05 | 2.52E+06 | 3.33E+07 | |
| Other | 12 | 0 | 534 | 24,650 | 3.24E+05 | 3.55E+06 | |
| Social | 8 | 0 | 0 | 226 | 3122 | 2.84E+04 | |
| Total | 197 | 12 | 4.44E+04 | 1.24E+06 | 1.43E+07 | 2.04E+08 | |
Selected quantiles of daily dApp UAW, transactions and volume by category (n: number of dApps in category).
It is important to note that the numbers presented in Table 2 provide only a rough indication of the overall performance of the different dApp categories, as they can be influenced by various factors, such as their prevalence and sporadic spikes in activity. As a consequence, the relative importance of each category has undergone substantial changes over time. For instance, during the first 4 months covered by our dataset (June to September 2017), Collectibles dominated the volume, accounting for 93.3% of all dApp volume, while Exchanges accounted for the majority of UAW (86.2%) and transactions (81%). However, from mid-2018 to the present (March 2023), the Games category has dominated transactions (79.1%), while DeFi has been the dominant category in terms of trading volume from October 2018 to June 2021 (near 100%), and Exchanges have held this position from July 2021 to March 2023 (99.1%). Figure 2 presents the underlying time series of total UAW, total transactions, and total volumes (on a logarithmic scale) across all dApps over time, with the shading indicating the share of each category (secondary axis).
FIGURE 2
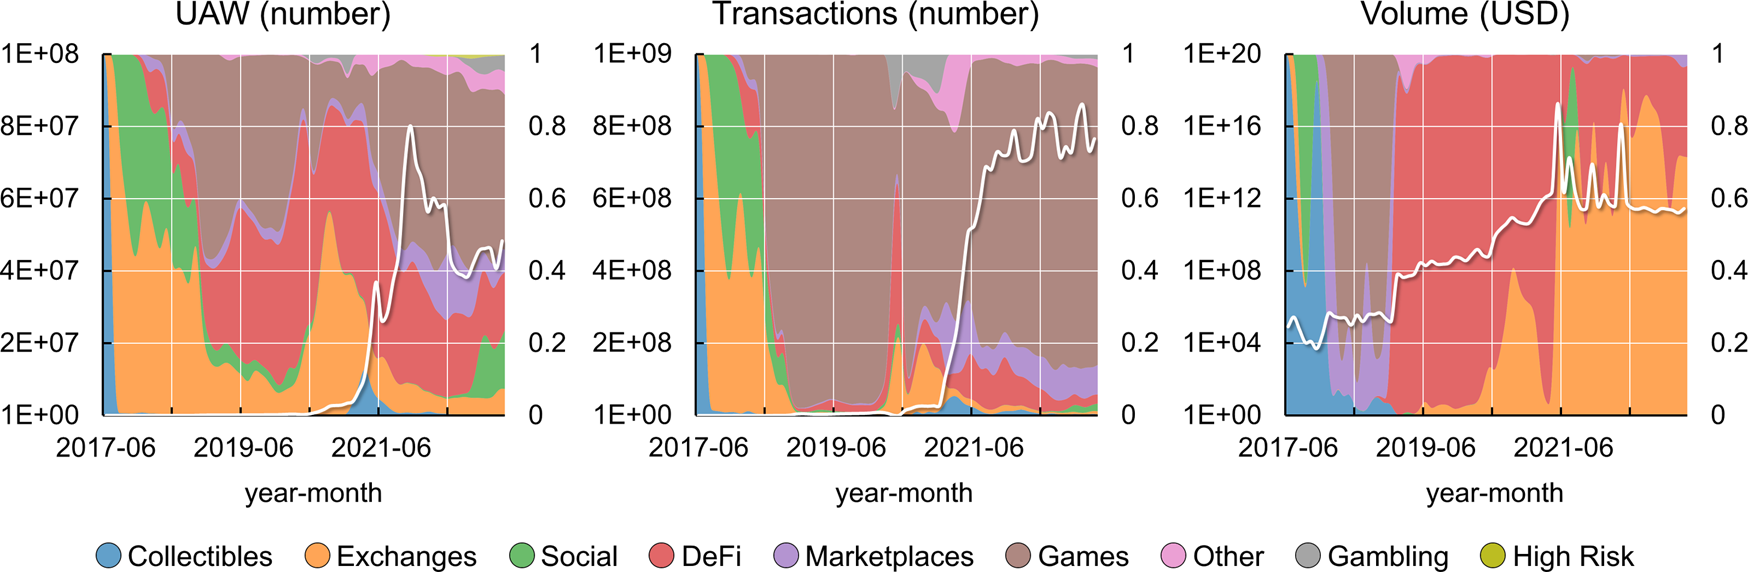
Total UAW, transactions and volume over time (shading indicates share of category).
During the first 39 months encompassed by the dataset (June 2017 to August 2020), approximately 21% of the dApps recorded their first activity, while the remaining 79% emerged during the remaining 31 months (September 2020 and March 2023). This notable increase in dApp presence coincided with a super-exponential growth in UAW and transactions throughout 2021. However, UAW experienced a significant decline from their peak value in November 2021, dropping to less than half the number of connected wallets by September 2022, with only marginal recovery thereafter. In contrast, transaction numbers displayed a more stabilized pattern since January 2022, albeit with notable fluctuations. The most remarkable surge, however, occurred in trading volumes, which expanded by several orders of exponential magnitude from June 2017 to April 2021, followed by four subsequent extraordinary spikes. It is worth noting that these spikes were predominantly influenced by singular events related to one Exchanges and one Social dApp.
4.3 Limitations
The dataset encompasses 197 dApps selected from a larger population of 14,472 dApps tracked by DappRadar (DappRadar - The World’s Dapp Store | Blockchain Dapps Ranked, 2023.000Z). As a result, certain analyses, such as providing a comprehensive market overview or examining the growth of dApp supply over time, are not feasible within the scope of this dataset. However, within our dataset, we observed that the top 10% of dApps with the highest number of transactions accounted for 96% of all transactions, while the bottom 30% contributed less than 0.1%. Similarly, the top 10% of dApps with the highest trading volume represented nearly 100% of the total volume. Considering that the 14,275 excluded dApps would contribute on average similar to the bottom 10% of the included 197 dApps, their potential impact on overall transactions and volume would be minimal, resulting in changes of less than 1%. Notably, one dApp in the dataset did not report any volume since June 2020 but still ranked among the top 100 based on balance. This indicates that a period of up to 2.75 years of inactivity did not prevent dApps from being considered, provided they had previously generated sufficient user interaction. Based on these results, we believe that our findings hold significance in relation to the economically most relevant segment of the dApp market as it existed in spring 2023, and potentially even before.
We encountered some potential data issues that could not be resolved during our analysis. Firstly, we identified seven dApps in which the trading volume time series remained constantly at zero, despite the presence of UAW and transactional activity. Additionally, we found that 20 dApps had at least 1 day in which the trading volume exceeded zero, but no transaction was recorded on that same day or within 5 days before or after it. Furthermore, one dApp reported at least one transaction without a connected wallet on that day or within 5 days before or after. Despite our attempts to clarify these inconsistencies by contacting DappRadar, we did not receive a response. Therefore, these data issues remain unresolved and could potentially impact the accuracy of our findings.
5 Results
5.1 Overall trends
The trend analysis as outlined in the Methods-section of this paper is performed on individual records, i.e. daily UAW, transactions and volumes for each dApp. The results are deemed to indicate a positive trend if the sieve-bootstrap MK -value is less than 0.05 and the TS slope is positive. Conversely, a negative trend is indicated if the MK -value is less than 0.05 and the TS slope is negative. When the -value is greater than or equal to 0.05, the null hypothesis of “no trend” is maintained. For illustration, details regarding the TS slopes and -values for some selected dApps are provided at Table 3.
TABLE 3
| Total volume (USD) | UAW | Transactions | Volume | |||||
|---|---|---|---|---|---|---|---|---|
| No. | Category | Slope | p | Slope | p | Slope | p | |
| 1 | Exchanges | 2.00E+11 | 5.8 | 0.0027 | 6.3 | 0.0000 | 7.77E+04 | 0.0000 |
| 2 | DeFi | 1.88E+11 | 16.6 | 0.0000 | 32.1 | 0.0005 | 1.94E+05 | 0.0000 |
| 3 | Exchanges | 1.52E+11 | 3.4 | 0.0000 | 5.0 | 0.0008 | 3.26E+04 | 0.0000 |
| 4 | DeFi | 1.93E+11 | −2.4 | 0.0449 | −6.5 | 0.0025 | −3.28E+05 | 0.0030 |
| 5 | DeFi | 9.98E+10 | −2.5 | 0.0022 | −7.0 | 0.0000 | −4.03E+05 | 0.0000 |
| 6 | DeFi | 7.01E+10 | −0.1 | 0.0000 | −0.05 | 0.0000 | −7.61E+00 | 0.0000 |
TS slopes and sieve-bootstrap MK p-values for UAW, transactions and volume for dApps with the highest total trading volume and three positive (lines 1–3) or three negative (lines 4–6) trends.
Overall, more positive (195) than negative (129) trends were identified. Volume exhibited the highest number of statistically significant trends in both directions, positive and negative. The DeFi category had the most negative trends (91) compared to positive trends (73). Social (17 positive vs Two negative), Exchanges (34 positive vs 10 negative), Marketplaces (16 positive vs Five negative) and Games (36 positive vs 15 negative) had noticeably more positive trends than negative trends. Although based on a limited number of observations, no negative trends were detected in Collectibles and Gambling, and no positive trends in High Risk. The findings are summarized in Table 4, organized by category and utilization measure.
TABLE 4
| Number of positive trends | Number of negative trends | ||||||
|---|---|---|---|---|---|---|---|
| Category | n | UAW | Transactions | Volume | UAW | Transactions | Volume |
| Collectibles | 2 | 1 (50%) | 1 (50%) | 1 (50%) | 0 (0%) | 0 (0%) | 0 (0%) |
| DeFi | 98 | 19 (19.4%) | 19 (19.4%) | 35 (35.7%) | 27 (27.6%) | 30 (30.6%) | 34 (34.7%) |
| Exchanges | 25 | 10 (40%) | 10 (40%) | 14 (56%) | 3 (12%) | 3 (12%) | 4 (16%) |
| Gambling | 5 | 2 (40%) | 4 (80%) | 2 (40%) | 0 (0%) | 0 (0%) | 0 (0%) |
| Games | 33 | 15 (45.5%) | 14 (42.4%) | 7 (21.2%) | 4 (12.1%) | 4 (12.1%) | 7 (21.2%) |
| High Risk | 2 | 0 (0%) | 0 (0%) | 0 (0%) | 0 (0%) | 0 (0%) | 2 (100%) |
| Marketplaces | 12 | 5 (41.7%) | 6 (50%) | 5 (41.7%) | 2 (16.7%) | 2 (16.7%) | 1 (8.3%) |
| Other | 12 | 4 (33.3%) | 3 (25%) | 1 (8.3%) | 1 (8.3%) | 2 (16.7%) | 1 (8.3%) |
| Social | 8 | 6 (75%) | 6 (75%) | 5 (62.5%) | 1 (12.5%) | 1 (12.5%) | 0 (0%) |
| Total | 197 | 62 (31.5%) | 63 (32%) | 70 (35.5%) | 38 (19.3%) | 42 (21.3%) | 49 (24.9%) |
Number of dApps with positive and negative trends by utilization measure and category (n: number of dApps in category; in parenthesis: % of row n).
When examining individual dApps, 38 exhibited positive trends in all three utilization measures, while 26 dApps had all three trends as negative. 45 dApps showed no significant trend at all, while 51 had one or two positive and no negative trends, and 32 had one or two negative and no positive trends. Interestingly, five dApps displayed both positive and negative trends. Among them, four (belonging to the DeFi, Social, and Exchanges categories) demonstrated a positive trend for volume but negative trends for UAW and transactions. The remaining dApp (from the Games category) exhibited a positive trend for UAW and transactions but a negative trend for volume. The findings for all dApps are summarized in Table 5, organized by category, direction and number of trends.
TABLE 5
| Positive trends | Negative trends | Positive and negative | |||||
|---|---|---|---|---|---|---|---|
| Category | n | 3 | 1 or 2 | 3 | 1 or 2 | None | |
| Collectibles | 2 | 1 (50%) | 0 (0%) | 0 (0%) | 0 (0%) | 0 (0%) | 1 (50%) |
| DeFi | 98 | 15 (15.3%) | 21 (21.4%) | 21 (21.4%) | 18 (18.4%) | 2 (2%) | 21 (21.4%) |
| Exchanges | 25 | 8 (32%) | 6 (24%) | 2 (8%) | 2 (8%) | 1 (4%) | 6 (24%) |
| Gambling | 5 | 1 (20%) | 3 (60%) | 0 (0%) | 0 (0%) | 0 (0%) | 1 (20%) |
| Games | 33 | 4 (12.1%) | 13 (39.4%) | 2 (6.1%) | 6 (18.2%) | 1 (3%) | 7 (21.2%) |
| High Risk | 2 | 0 (0%) | 0 (0%) | 0 (0%) | 2 (100%) | 0 (0%) | 0 (0%) |
| Marketplaces | 12 | 4 (33.3%) | 3 (25%) | 1 (8.3%) | 1 (8.3%) | 0 (0%) | 3 (25%) |
| Other | 12 | 1 (8.3%) | 3 (25%) | 0 (0%) | 3 (25%) | 0 (0%) | 5 (41.7%) |
| Social | 8 | 4 (50%) | 2 (25%) | 0 (0%) | 0 (0%) | 1 (12.5%) | 1 (12.5%) |
| Total | 197 | 38 (19.3%) | 51 (25.9%) | 26 (13.2%) | 32 (16.2%) | 5 (2.5%) | 45 (22.8%) |
| 89 (45.2%) | 58 (29.4%) | ||||||
Number of dApps with exclusively positive (three, or one or two), exclusively negative (three, or one or two), positive and negative, and no statistically significant trends by category (n: number of dApps in category, in parenthesis: % of row n).
In the three categories with at least 25 dApps (DeFi, Exchanges, Games), Exchanges and Games stood out somewhat positively. The proportion of dApps with negative trends was most pronounced in DeFi (39 of 98, 39,8%), which is markedly higher than the negative trend proportion observed in the other two categories (16.0% for Exchanges and 24.2% for Games). Moreover, DeFi accounted for 21 of the 26 dApps with three negative trends (80.8%), which is substantially higher than their share in the data (49.7%). Exchanges, Marketplaces and Social, on the other hand, are clearly overrepresented in the segment of dApps with three positive trends.
The group of dApps with at least one positive and no negative trends had higher median UAW and transactions than the group with at least one negative and no positive trends, although the difference is not statistically significant (median test, and ). However, the dApps with at least one positive trend had significantly lower median volumes than those with at least one negative trend (; see Table 6 for median values).
TABLE 6
| Number of trends | |||
|---|---|---|---|
| ≥1 positive | ≥1 negative | p | |
| Median UAW | 1331.0 | 626.1 | 0.1993 |
| Median Transactions | 4175.7 | 1877.1 | 0.0502 |
| Median Volume (USD) | 1,591,706.3 | 14,002,918.9 | 0.0057 |
Comparison of medians for UAW, transactions and volume between dApps with at least one positive and dApps with at least one negative utilization trend; p-values: median test.
Additionally, dApps with at least one significant negative and no positive trends were more frequently found in the top 100 balance ranking (Fisher’s exact test, ) and were significantly more often established in 2020 or later (Fisher’s exact test, ). A repetition of the trend analysis limited to the 2020 to 2023 timeframe suggested that this may be due to generally less favorable growth conditions after 2020, visible after 2021 in the descriptive time series charts (Figure 2). However, there was still both, significantly positive and significantly negative growth, after that year.
5.2 Structural breaks and time series segment trends
The break point analysis, described in the Methods-section of this paper, was individually applied to all dApps for each of the three utilization measures: UAW, transactions, and volume. On average, 3.78 break points were identified for UAW, 3.67 break points for transactions, and 2.45 break points for volume time series. A pairwise comparison revealed no statistically significant differences between UAW and transactions (median test, ), but significant differences were found between UAW and volume (), as well as between transactions and volume ().
Regarding each utilization measure, the mean number of break points varied slightly across different dApp categories. However, these differences were not statistically significant based on the Kruskal–Wallis test for both UAW () and transactions (). In the case of volume, the hypothesis of an equal mean number of break points needs to be rejected (). Please refer to Table 7 for detailed information on all categories and utilization measures.
TABLE 7
| UAW | Transactions | Volume | |||||
|---|---|---|---|---|---|---|---|
| Category | n | Mean | STD | Mean | STD | Mean | STD |
| Collectibles | 2 | 3.00 | 0 (0%) | 3.00 | 0 (0%) | 2.50 | 0.71 (28.3%) |
| DeFi | 98 | 3.82 | 1.49 (39.2%) | 3.65 | 1.42 (39%) | 2.38 | 1.15 (48.3%) |
| Exchanges | 25 | 4.12 | 1.42 (34.6%) | 4.26 | 1.39 (32.6%) | 2.75 | 0.85 (30.8%) |
| Gambling | 5 | 2.80 | 1.79 (63.9%) | 2.60 | 1.34 (51.6%) | 3.20 | 1.79 (55.9%) |
| Games | 33 | 3.55 | 1.66 (46.8%) | 3.64 | 1.71 (47%) | 1.96 | 0.96 (48.9%) |
| High Risk | 2 | 4.00 | 1.41 (35.4%) | 4.50 | 2.12 (47.1%) | 1.50 | 0.71 (47.1%) |
| Marketplaces | 12 | 4.42 | 1.31 (29.7%) | 4.18 | 1.6 (38.3%) | 3.42 | 1.73 (50.6%) |
| Other | 12 | 3.73 | 0.9 (24.3%) | 3.18 | 1.4 (44%) | 2.67 | 1.51 (56.5%) |
| Social | 8 | 3.13 | 0.64 (20.5%) | 3.00 | 1.07 (35.6%) | 1.80 | 0.84 (46.5%) |
| Total | 197 | 3.78 | 1.46 (38.7%) | 3.67 | 1.48 (40.4%) | 2.45 | 1.2 (48.9%) |
Average number of break points and STD by category (in parenthesis: STD in % of mean; n: number of dApps in category).
Each dApp in the dataset has a unique history length, which means that an increased number of break points does not necessarily correspond to shorter time series segments. However, a general inverse relationship between the two can be observed. In line with the number of break points, UAW and transactions show relatively similar mean segment lengths (142.1 and 147.8 days), whereas volume exhibits a noticeably longer mean segment length (215.7 days).
Within each of the three utilization measures, the segment lengths are generally similar, except for the Collectibles category, which displays significantly longer segment lengths. This finding may seem counterintuitive considering the average number of break points in this category, but it can be explained by the age of the two Collectibles dApps. The observed differences in segment lengths across the different categories are statistically significant for all three utilization measures based on the Kruskal–Wallis test ( for UAW, for transactions, for volume). Further details can be found in Table 8.
TABLE 8
| UAW | Transactions | Volume | ||||
|---|---|---|---|---|---|---|
| Category | Mean | STD | Mean | STD | Mean | STD |
| Collectibles | 382.8 | 318.1 (83.1%) | 382.8 | 323.7 (84.6%) | 437.4 | 420.7 (96.2%) |
| DeFi | 148.6 | 134 (90.2%) | 155.2 | 139.2 (89.7%) | 224.8 | 231.5 (103%) |
| Exchanges | 128.5 | 138.2 (107.5%) | 133.8 | 154.6 (115.6%) | 180.8 | 206.1 (114%) |
| Gambling | 116.6 | 143.1 (122.7%) | 123.1 | 149.4 (121.4%) | 105.5 | 152.3 (144.3%) |
| Games | 135.3 | 165.8 (122.5%) | 132.6 | 149.7 (112.8%) | 241.5 | 290.3 (120.2%) |
| High Risk | 115.1 | 76.1 (66.1%) | 104.6 | 93.7 (89.5%) | 230.2 | 251.7 (109.4%) |
| Marketplaces | 123.5 | 147.3 (119.2%) | 138.4 | 169.1 (122.1%) | 151.5 | 193.7 (127.9%) |
| Other | 135.5 | 162.4 (119.9%) | 152.8 | 209.4 (137%) | 256.5 | 303.6 (118.4%) |
| Social | 144.3 | 180 (124.7%) | 148.8 | 184.4 (123.9%) | 280.1 | 399.2 (142.5%) |
| Total | 142.1 | 147.8 (104%) | 147.8 | 154.6 (104.6%) | 215.7 | 246.1 (114.1%) |
Average segment length (in days) and STD by category (in parenthesis: STD in % of mean).
More crucial than the number of break points and segment lengths are the trends observed within individual segments, as summarized in Table 9. When scrutinizing segment trends, a more nuanced perspective emerges when comparing these segment trends to the overall trends, although differentiating between high and low performers becomes more challenging: In the case of UAW, noteworthy categories include Social and Marketplaces, which demonstrate above-average shares of positive trends (36.4% and 32.3% respectively, compared to the overall share of 25.4% of segments with statistically significant positive trends). Conversely, High Risk and Collectibles stand out with notably high shares of statistically significant negative trends (40.0% and 37.5% respectively, compared to the overall share of 28.9%). Regarding transactions, Collectibles, Marketplaces, Social, and Gambling exhibit positive trends at higher rates (37.5%, 36.2%, 34.4%, and 33.3% respectively, compared to the overall share of 25.0%). On the negative side, also Collectibles and DeFi stand out (37.5% and 33.1% respectively, compared to the overall share of 29.0%). Social and Exchanges both demonstrate the top two shares of above-average statistically significant positive segments in the volume time series (41.2% and 37.4%, compared to the overall share of 31.6%). Collectibles stands out as the category with the highest share of negative trends in volume (57.1%, compared to the overall share of 30%).
TABLE 9
| Segments with positive trends | Segments with negative trends | |||||
|---|---|---|---|---|---|---|
| Cat | UAW | Trans | Volume | UAW | Trans | Volume |
| Collectibles | 2 (25%) | 3 (37.5%) | 2 (28.6%) | 3 (37.5%) | 3 (37.5%) | 4 (57.1%) |
| DeFi | 120 (25.2%) | 113 (24.9%) | 107 (34%) | 154 (32.4%) | 150 (33.1%) | 101 (32.1%) |
| Exchanges | 32 (25%) | 29 (23.6%) | 34 (37.4%) | 36 (28.1%) | 31 (25.2%) | 24 (26.4%) |
| Gambling | 4 (21.1%) | 6 (33.3%) | 7 (33.3%) | 3 (15.8%) | 3 (16.7%) | 4 (19%) |
| Games | 37 (24.7%) | 32 (20.9%) | 15 (17.9%) | 32 (21.3%) | 34 (22.2%) | 23 (27.4%) |
| High Risk | 2 (20%) | 1 (9.1%) | 1 (0%) | 4 (40%) | 3 (27.3%) | 4 (0%) |
| Marketplaces | 21 (32.3%) | 21 (36.2%) | 14 (26.4%) | 15 (23.1%) | 15 (25.9%) | 15 (28.3%) |
| Other | 9 (17%) | 10 (21.3%) | 9 (32.1%) | 18 (34%) | 14 (29.8%) | 7 (25%) |
| Social | 12 (36.4%) | 11 (34.4%) | 7 (41.2%) | 7 (21.2%) | 9 (28.1%) | 4 (23.5%) |
| Total | 239 (25.4%) | 226 (25%) | 196 (31.6%) | 272 (28.9%) | 262 (29%) | 186 (30%) |
Number of statistically significant positive and negative segments per category (in parenthesis: % of all segments of utilization measure in category; note that the number of segments can differ per utilization measure and category).
In summary, when considering the segment trends, Social appears to be the only category that, consistent with the overall trends, can reflect on a largely favorable history. While the overall outlook for DeFi tends to lean toward the negative, a closer examination on the segments level reveals a slightly higher representation in the sections with negative trends, but performs around the average (and even slightly above average for volume) in terms of positive trends.
Analyzing trends involves observing developments over time. Therefore, it is important to consider not only the numbers of past positive and negative trends but also their chronological sequence. Figure 3 provides an illustration of the share of statistically significant positive and negative trends, as well as no trends, over time. It also includes a graph representing the number of dApps in the dataset for each of the three utilization measures.
FIGURE 3
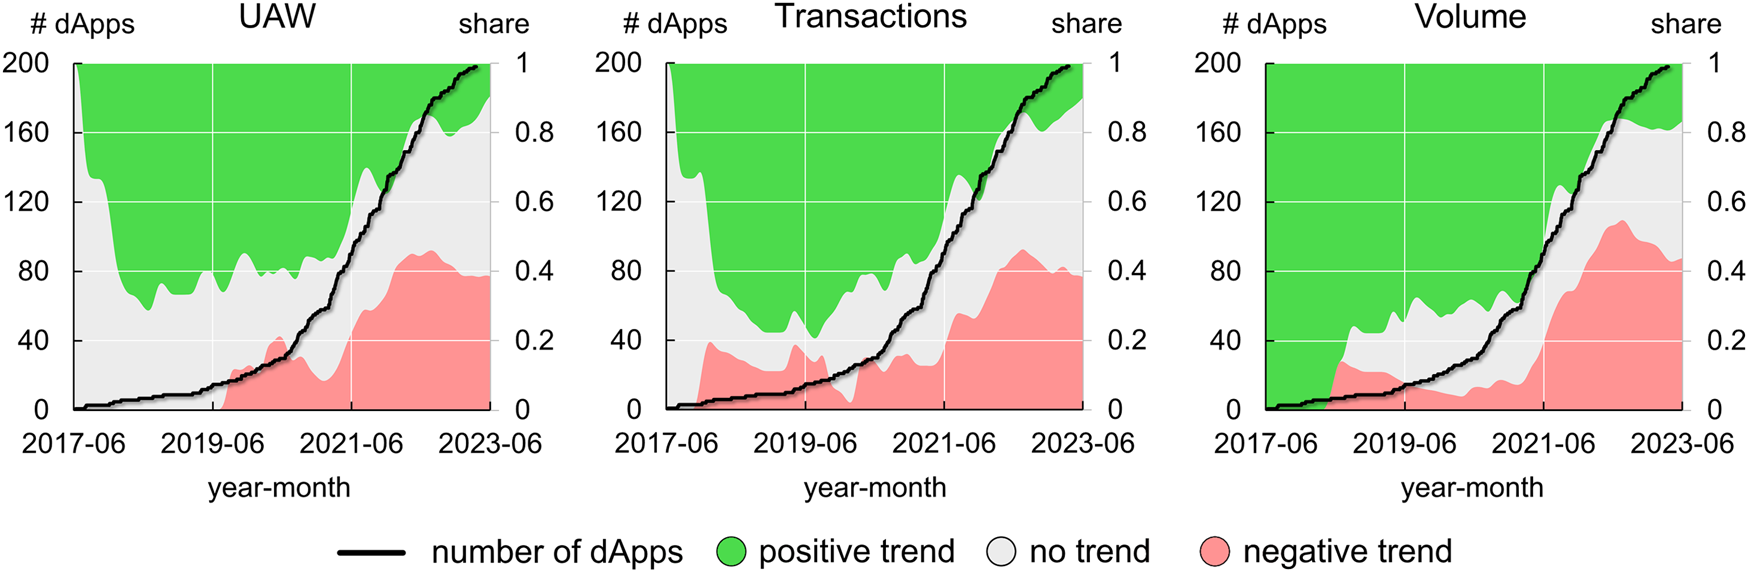
Number of dApps in dataset (black line) and share of time series segments with positive, negative and no trend (shading) over time.
Initially, the majority of segments exhibited no clear trend, except for volume, which showed immediate and exclusive positive trends for the first 6 months. UAW and transactions, closely correlated with each other, gradually developed positive trends ranging from just below 60%–80% from the beginning of 2018 to early 2021. During approximately the same period, positive volume trends experienced a slight decline in their absolute dominance but still remained around 70%.
After June 2020, a significant surge in the number of dApps was recorded in the dataset, followed by a noticeable decline in the share of positive segments about a year later. By the end of the observation period in March 2023, positive trends had dropped to below 10% for both UAW and transactions, and around 17% for volume. At that point, the share of negative trends for all three measures stood at approximately 40%.
6 Summary and discussion
Making broad assertions about the dApp market is challenging due to extreme outliers, sudden fluctuations, and diverse themes, which complicate the formation of a consistent view. To gain a clearer understanding, an analysis of general trends was conducted. A more detailed examination of segment trends provided a nuanced perspective, albeit at the cost of complicating general conclusions. However, the following key observations emerged:
A considerable number of dApps exhibit predominantly positive trends across various categories, suggesting that the market potential for dApps is not limited to any particular field. While not definitive, it appears that overall Social, Marketplaces, and Exchanges may enjoy a slight advantage. Interestingly, the DeFi category, which comprises the largest number of dApps in the dataset, demonstrates a disproportionately high number of negative overall trajectories. This could be attributed to a rush towards the significant revenue promised by DeFi, resulting in the premature deployment of applications and intensified competition, making it more challenging to sustain success. Nonetheless, there are DeFi dApps showing upward trajectories, indicating that finance is not inherently unsuccessful in the decentralized computing domain.
When examining time series segments, UAW and transactions appear to exhibit similarities in terms of breakpoints and segment lengths, while volumes demonstrate a different dynamic. This disparity is understandable since volume is more prone to pronounced spikes, and large volumes can overshadow UAW and transactions. Consequently, dApps can exhibit positive trends in UAW and transactions while experiencing negative trends in volume simultaneously, and vice versa. This observation aligns with descriptive statistics, which suggest that certain categories, such as Games, attract larger numbers of UAW and transactions but generate comparatively low revenue volumes. Conversely, DeFi and Exchanges, generate substantial trading volumes with fewer UAW and transactions. Unlike overall trends, segment trends provide less clarity regarding failing and prospering categories, but Social emerges as somewhat positive.
Over time, positive segment trends have noticeably diminished, giving way to an increasing proportion of negative trends, leading to the question: What is more significant–the overall trend, its segments, or the sequencing of segments? The purpose of examining overall trends is to specifically avoid fixating on individual ups and downs. On the other hand, an overall positive trajectory may merely represent the terminal velocity of a locomotive that has run out of steam.
In summary, the evidence regarding the long-term viability of the dApp economy is inconclusive. Descriptive data and segment trend analyses generally indicate stagnation if not a downward trajectory more recently, making it uncertain whether momentum can be regained. This likely depends on whether a system can be established that makes relevant use of the blockchain’s key features–decentralized, secure, and transparent ledgers with strong user control and ownership, and minimized need for intermediaries–while being attractive to both, users and developers, at the same time.
Statements
Data availability statement
Publicly available datasets were analyzed in this study. This data can be found here: https://dappradar.com/.
Author contributions
All authors listed have made a substantial, direct, and intellectual contribution to the work and approved it for publication.
Funding
This research received no external funding. The article processing charge was funded by the Baden-Württemberg Ministry of Science, Research and Culture, and the University of Applied Sciences Offenburg, in the funding programme Open Access Publishing.
Conflict of interest
The authors declare that the research was conducted in the absence of any commercial or financial relationships that could be construed as a potential conflict of interest.
Publisher’s note
All claims expressed in this article are solely those of the authors and do not necessarily represent those of their affiliated organizations, or those of the publisher, the editors and the reviewers. Any product that may be evaluated in this article, or claim that may be made by its manufacturer, is not guaranteed or endorsed by the publisher.
References
1
Ante L. (2022). The non-fungible token (NFT) market and its relationship with Bitcoin and Ethereum. FinTech1, 216–224. 10.3390/fintech1030017
2
Bai J. Perron P. (2003). Computation and analysis of multiple structural change models. J. Appl. Econ.18, 1–22. 10.1002/jae.659
3
Bai J. Perron P. (1998). Estimating and testing linear models with multiple structural changes. Econometrica66, 47. 10.2307/2998540
4
Belotti M. Bozic N. Pujolle G. Secci S. (2019). A vademecum on blockchain technologies: when, which, and how. IEEE Commun. Surv. Tutorials21, 3796–3838. 10.1109/COMST.2019.2928178
5
Bühlmann P. Buhlmann P. (1997). Sieve bootstrap for time series. Bernoulli3, 123. 10.2307/3318584
6
Buterin V. (2014). A next-generation smart contract and decentralized application platform.
7
Cai W. Wang Z. Ernst J. B. Hong Z. Feng C. Leung V. C. M. (2018). Decentralized applications: the blockchain-empowered software system. IEEE Access6, 53019–53033. 10.1109/ACCESS.2018.2870644
8
Casini A. Perron P. (2018). Structural breaks in time series.
9
Cox D. R. Stuart A. (1955). Some quick sign tests for trend in location and dispersion. Biometrika42, 80. 10.2307/2333424
10
Dang X. Peng H. Wang X. Zhang H. (2008). Theil-sen estimators in a multiple linear regression model.
11
DappRadar (2023). DappRadar - the World’s Dapp store blockchain Dapps ranked (2023.000Z). Availab;e at: https://dappradar.com/ (Accessed March 25, 2023).
12
Dowling M. (2022). Is non-fungible token pricing driven by cryptocurrencies?Finance Res. Lett.44, 102097. 10.1016/j.frl.2021.102097
13
Duan Y. Zhao X. Pan Y. Li S. Li M. Xu F. et al (2022). “Towards automated safety vetting of smart contracts in decentralized applications,” in Proceedings of the 2022 ACM SIGSAC Conference on Computer and Communications Security, New York, NY, USA, November-2022 (ACM).
14
Durlauf S. N. Johnson P. A. Temple J. R. W. (2005). Chapter 8 growth econometrics. Amsterdam, Netherlands: Elsevier, 555–677.
15
Hamed K. H. (2009). Exact distribution of the Mann–Kendall trend test statistic for persistent data. J. Hydrology365, 86–94. 10.1016/j.jhydrol.2008.11.024
16
Hamed K. H. Ramachandra Rao A. (1998). A modified Mann-Kendall trend test for autocorrelated data. J. Hydrology204, 182–196. 10.1016/s0022-1694(97)00125-x
17
Kendall M. G. Gibbons J. D. (1990). Rank correlation methods. London: Griffin.
18
KNIME (2023). Open for innovation | KNIME. Available at: https://www.knime.com/(Accessed April 11).
19
Kong D.-R. Lin T.-C. (2021). Alternative investments in the fintech era: the Risk and return of non-fungible token (NFT).
20
Liu Y. Yu F. R. Li X. Ji H. Leung V. C. M. (2020). Blockchain and machine learning for communications and networking systems. IEEE Commun. Surv. Tutorials22, 1392–1431. 10.1109/COMST.2020.2975911
21
Lyubchich V. Gel Y. R. Vishwakarma S. (2023). funtimes: functions for time series analysis.
22
Mann H. B. (1945). Nonparametric tests against trend. Econometrica13, 245. 10.2307/1907187
23
Maouchi Y. Charfeddine L. El Montasser G. (2022). Understanding digital bubbles amidst the COVID-19 pandemic: evidence from DeFi and NFTs. Finance Res. Lett.47, 102584. 10.1016/j.frl.2021.102584
24
Min T. Cai W. (2022). Portrait of decentralized application users: an overview based on large-scale Ethereum data. CCF Trans. Pervasive Comp. Interact.4, 124–141. 10.1007/s42486-022-00094-6
25
Muthuramu P. Uma Maheswari T. (2019). Tests for structural breaks in time series analysis: a review of recent development.
26
Nadini M. Alessandretti L. Di Giacinto F. Martino M. Aiello L. M. Baronchelli A. (2021). Mapping the NFT revolution: market trends, trade networks, and visual features. Sci. Rep.11, 20902. 10.1038/s41598-021-00053-8
27
Nakamoto S. (2008). Bitcoin: a peer-to-peer electronic cash system.
28
Noguchi K. Gel Y. R. Duguay C. R. (2011). Bootstrap-based tests for trends in hydrological time series, with application to ice phenology data. J. Hydrology410, 150–161. 10.1016/j.jhydrol.2011.09.008
29
Sen P. K. (1963). Estimates of the regression coefficient based on kendall's tau. Journal of the American Statistical Association63 (324), 1379–1389. 10.2307/2285891
30
Serada A. Sihvonen T. Harviainen J. T. (2021). CryptoKitties and the new ludic economy: how blockchain introduces value, ownership, and scarcity in digital gaming. Games Cult.16, 457–480. 10.1177/1555412019898305
31
Theil H. (1992). “A rank-invariant method of linear and polynomial regression analysis,” in Henri theil’s contributions to economics and econometrics: Econometric theory and methodology. Editors RajB.KoertsJ. (Dordrecht: Springer-Science+Business Media), 345–381.
32
Wang H. Zheng Z. Xie S. Dai H. N. Chen X. (2018). Blockchain challenges and opportunities: a survey. IJWGS14, 352. 10.1504/ijwgs.2018.10016848
33
Wood G. (2014). Ethereum: A secure decentralised generalised transaction ledger.
34
Wu K. Ma Y. Huang G. Liu X. (2021). A first look at blockchain‐based decentralized applications. Softw. Pract. Exper51, 2033–2050. 10.1002/spe.2751
35
Yue K. Zhang Y. Chen Y. Li Y. Zhao L. Rong C. et al (2021). A survey of decentralizing applications via blockchain: the 5G and beyond perspective. IEEE Commun. Surv. Tutorials23, 2191–2217. 10.1109/COMST.2021.3115797
36
Zeileis A. Kleiber C. Krämer W. Hornik K. (2003). Testing and dating of structural changes in practice. Comput. Statistics Data Analysis44, 109–123. 10.1016/S0167-9473(03)00030-6
37
Zeileis A. Leisch F. Hornik K. Kleiber C. (2002). Strucchange: an R package for testing for structural change in linear regression models. J. Stat. Soft.7. 10.18637/jss.v007.i02
38
Zhang R. Xue R. Liu L. (2020). Security and privacy on blockchain. ACM Comput. Surv.52, 1–34. 10.1145/3316481
Summary
Keywords
decentralized applications, dApp, statistical analysis, trends, trend analysis, blockchain, dApp popularity
Citation
Bärtl M (2023) A statistical examination of utilization trends in decentralized applications. Front. Blockchain 6:1206330. doi: 10.3389/fbloc.2023.1206330
Received
15 April 2023
Accepted
02 August 2023
Published
16 August 2023
Volume
6 - 2023
Edited by
Nicola Dimitri, University of Siena, Italy
Reviewed by
Tai Young-Taft, Bard College, United States
Carlo Campajola, University College London, United Kingdom
Nicolo Vallarano, IMT School for Advanced Studies Lucca, Italy
Updates
Copyright
© 2023 Bärtl.
This is an open-access article distributed under the terms of the Creative Commons Attribution License (CC BY). The use, distribution or reproduction in other forums is permitted, provided the original author(s) and the copyright owner(s) are credited and that the original publication in this journal is cited, in accordance with accepted academic practice. No use, distribution or reproduction is permitted which does not comply with these terms.
*Correspondence: Mathias Bärtl, mathias.baertl@hs-offenburg.de
Disclaimer
All claims expressed in this article are solely those of the authors and do not necessarily represent those of their affiliated organizations, or those of the publisher, the editors and the reviewers. Any product that may be evaluated in this article or claim that may be made by its manufacturer is not guaranteed or endorsed by the publisher.