 Jason Zhu
 Arijit Khan
 Cuneyt Gurcan Akcora
- 1Department of Computer Science, University of Manitoba, Winnipeg, Canada
- 2Department of Computer Science, Aalborg University, Aalborg, Denmark
- 3Department of Computer Science, University of Central Florida, Orlando, FL, United States
Blockchains are significantly easing trade finance, with billions of dollars worth of assets being transacted daily. However, analyzing these networks remains challenging due to the sheer volume and complexity of the data. We introduce a method named InnerCore that detects market manipulators within blockchain-based networks and offers a sentiment indicator for these networks. This is achieved through data depth-based core decomposition and centered motif discovery, ensuring scalability. InnerCore is a computationally efficient, unsupervised approach suitable for analyzing large temporal graphs. We demonstrate its effectiveness by analyzing and detecting three recent real-world incidents from our datasets: the catastrophic collapse of LunaTerra, the Proof-of-Stake switch of Ethereum, and the temporary peg loss of USDC–while also verifying our results against external ground truth. Our experiments show that InnerCore can match the qualified analysis accurately without human involvement, automating blockchain analysis in a scalable manner, while being more effective and efficient than baselines and state-of-the-art attributed change detection approach in dynamic graphs.
1 Introduction
Blockchain technology (Nakamoto, 2008; Wood, 2014) is revolutionizing the way we store and transfer digital assets in multiple domains including internet-of-things (Liu et al., 2023c), healthcare (Liu et al., 2023b), and digital evidence (Tian et al., 2019). Public blockchain networks are completely open, allowing anonymous addresses to utilize transactions for cryptocurrency movement and asset trading/investment. While the technology offers numerous benefits, it poses significant challenges, particularly in the area of cybersecurity. Blockchains enable electronic crimes in a variety of ways (Wu et al., 2022), ranging from demands for ransomware (Huang et al., 2018) to transactions in darknet markets (Jiang et al., 2021).
One of the biggest challenges in securing blockchain networks is detecting and preventing e-crime. E-crime detection requires scalable analysis of large-scale blockchain graphs in real-time, where results are both qualified and manageable by human analysts. To address this challenge, researchers have developed tools and algorithms for analyzing blockchain networks (Akcora et al., 2018; Victor et al., 2021; Khan and Akcora, 2022; Su et al., 2022).
Unfortunately, analyzing blockchain networks is an arduous task, given their large size and the involvement of anonymous actors. It is crucial to devise scalable and effective methods that can analyze blockchain networks in real-time, to preempt future losses. The failure to conduct a timely analysis of blockchain networks has already resulted in a staggering loss of billions of dollars to blockchain users, as exemplified by the recent downfall of LunaTerra (Faux and Shen, 2022).
In this article, we introduce a new approach to detecting e-crimes and trends detection. Our approach, InnerCore, involves identifying influential addresses with data depth-based core decomposition and further filtering out the role of addresses by using centered motifs. InnerCore analysis reduces large graphs having more than 400K nodes and 1M edges to an induced subgraph of less than 300 nodes and 90K edges, while still being able to detect the influential nodes. InnerCore is unsupervised and highly scalable, yielding only ∼4-s running times on daily Ethereum graphs with ∼500K nodes and
Our key novelties and contributions are summarized below.
• InnerCore: We propose InnerCore, a data depth-based core discovery method that can identify the influential traders in blockchain-based asset networks (§5.1).
• Explainable behavior: We develop two metrics, InnerCore expansion and decay (§5.2), that provide a sentiment indicator for the networks and explain trader mood (§5.3).
• Unsupervised address discovery: Through conducting node ranking with a centered-motif approach in temporal asset networks, we demonstrate that InnerCore tracking detects market manipulators and e-crime behavior and warns the network about possible long-term instability, without the need for supervised address discovery (§5.4).
• Scalability: Due to their computational efficiency and ability to utilize only a small portion of graph nodes and edges to analyze overall behavior, the InnerCore discovery and expansion/decay calculations are suitable on large temporal graphs including Ethereum transaction and stablecoin networks. InnerCore is more effective and efficient than baselines (Batagelj and Zaversnik, 2011; Victor et al., 2021) and the state-of-the-art attributed change detection method in dynamic graphs (Huang et al., 2023) (§6).
2 Related work
In recent years, several studies focused on analyzing different aspects of the blockchain networks (Kalodner et al., 2017; Chen et al., 2019; Akcora et al., 2020; Guidi and Michienzi, 2020), particularly in the Ethereum network. Researchers working on natural language processing and sentiment analysis using tweets, news articles, cryptocurrency prices, and charts, Google Trends about blockchains (Vo et al., 2019; Kraaijeveld and Smedt, 2020) could find supporting evidence based on blockchain data analysis. Oliveira et al. (2022) performed an analysis of the effects of external events on the Ethereum platform, highlighting short-term changes in the behavior of accounts and transactions on the network. Aspembitova et al. (2021) used temporal complex network analysis to determine the properties of users in the Bitcoin and Ethereum markets and developed a methodology to derive behavioral types of users.
Other studies focused on specific aspects of the Ethereum network. For instance, Casale-Brunet et al. (2021) analyzed the networks of Ethereum Non-Fungible Tokens using a graph-based approach, while Silva (2020) characterized relationships between primary miners in Ethereum using on-chain transactions. Meanwhile, Victor and Lüders (2019) measured Ethereum-based ERC20 token networks, and Kiffer et al. (2018) examined how contracts in Ethereum are created and how users interact with them.
Numerous researchers found success in anomaly detection through the strategic exploration of the Ethereum transaction network using graph representation. In particular, Patel et al. (2020) proposed an one-class graph neural network-based anomaly detection framework for Ethereum transaction networks that harnesses graph representation. Wu et al. (2023) proposed a scalable transaction tracing tool which incorporates a biased search method to guide the search of fund transfer traces on transaction graphs.
Zhao et al. (2021) investigated the evolutionary nature of Ethereum interaction networks from a temporal graph perspective, detecting anomalies based on temporal changes in global network properties and forecasting the survival of network communities using relevant graph features and machine learning models. Li et al. (2021) analyzed the magnitude of illicit activities in the Ethereum ecosystem using proprietary labeling data and machine learning techniques to identify additional malicious addresses. Kılıç et al. (2022) predicted whether given addresses are blacklisted or not in the Ethereum network using a transaction graph and local and global features.
Our temporal approach for analyzing the effects of external events on a blockchain platform is similar to the one used by Anoaica and Levard (2018). The authors examined the temporal variation of transaction features in the Ethereum network and observed an increase in activity following the announcement of the Ethereum Alliance creation. Gaviao Mascarenhas et al. (2020) also studied the evolution of users and transactions over time, showing the centralization tendency of the transaction network. Kapengut and Mizrach (2022) studied the Ethereum blockchain around the BeaconChain phase of the PoS transition (15 September 2022), but the authors focused on the power efficiency and miners’ rewards around the transition.
Finally, Khan (2022) conducted a survey of datasets, methods, and future work related to graph analysis of the Ethereum blockchain data, while Poursafaei’s PhD thesis (Poursafaei, 2022) presented results on temporal anomaly detection in blockchain networks.
3 Background and problem
We discuss preliminaries on blockchain and stablecoins (§3.1, §3.2), followed by one key technique AlphaCore decomposition based on data depth (§3.3). We introduce our problem in §3.4.
3.1 Blockchain and smart contracts
A blockchain is an immutable public ledger that records transactions in discrete data structures called blocks. The earliest blockchains are cryptocurrencies such as Bitcoin and Litecoin where a transaction is a transfer of coins. The Ethereum project (Wood, 2014) was created in July 2015 to provide smart contract functionality on a blockchain. Smart contracts are Turing complete software codes, replicated across a blockchain network, ensuring deterministic code execution and can be verified publicly. Smart contracts have implemented mechanisms to trade digital assets, known as tokens (Victor and Lüders, 2019). Similar to cryptocurrencies, a token is transferred publicly between accounts (addresses), and may have an associated value in fiat currency which is arbitrated by token demand and supply in the real world.
Blockchain Transaction Network vs Mining Network. In blockchain transaction networks, the nodes represent individual participating addresses within the network, while the edges signify the actual transactions involving transfer of assets between these addresses. On the other hand, in blockchain mining networks, nodes are computational entities that play a crucial role in maintaining blockchain integrity by validating and appending transactions to the ledger through a consensus mechanism. We focus on blockchain transaction networks, where edges are directed and weighted. An edge weight corresponds to the numerical value associated with the edge incident to a node. For instance, in a blockchain token transcation network, the numerical value denotes the amount of token sent from one address to another.
3.2 Stablecoins
A stablecoin is a smart contract-based asset whose price is protected against volatility by i) collateralizing the stablecoin with one or more offline real-life assets (e.g., USD, gold), ii) using a dual coin, or by iii) employing algorithmic trading mechanisms (Moin et al., 2020; Li et al., 2024).
In the pegged asset mechanism, an increase in the price is countered by creating more stablecoins (i.e., coin minting) and selling them to traders at the pegged price. The dual coin mechanism operates by having a management coin, referred to as the dual coin, to oversee a stablecoin. The traders of the dual coin participate in decision making through voting and receive benefits from the stablecoin’s transactions. In the event that the stablecoin’s price rises, some of the dual coin will be sold to purchase and decrease the supply of the stablecoin. Conflicting demand and supply dynamics of the two coins are assumed to stabilize the stablecoin’s price. However, traders may lose faith in the stablecoin to such a degree that they might also not buy the dual coin, however cheap it becomes. Stablecoins that are based on algorithmic trading do not require collateral for stability. They achieve stability through the utilization of a blockchain-based algorithm that adjusts the supply of tokens automatically in response to changes in demand.
It is worth noting that for an Ethereum token such as the UST (TerraUSD) stablecoin, there can be at most k tokens issued within this network, with the value of k being set by the project owner, subject to the condition that it must be
3.3 Data depth-based core decomposition
Core decomposition (Malliaros et al., 2020) is a central technique used in network science to determine the significance of nodes and to find community structures in a wide range of applications such as biology (Luo et al., 2009), social networks (Al-garadi et al., 2017), and visualization (Zhang and Parthasarathy, 2012). One of the best-known representatives of core decomposition algorithms, graph-k-core (Seidman, 1983; Batagelj and Zaversnik, 2011), finds the maximal subgraph where each node has at least k neighbors in that subgraph. Although the graph-k-core algorithm demonstrates high utility for the analysis of graph structural properties, it does not account for important graph information such as the direction of edges, edge weights, and node features.
To address these limitations, modifications to graph-k-core have been proposed, e.g., graph-k-core in weighted and directed graphs, generalized k-core (Batagelj and Zaveršnik, 2002; Giatsidis et al., 2011; Garas et al., 2012; Al-garadi et al., 2017; Zhou et al., 2021; Liao et al., 2022). Different from them, AlphaCore (Victor et al., 2021) is a recent core decomposition algorithm that combines multiple node properties using the statistical methodology of data depth (Mosler, 2012). The key idea of data depth is to offer a center-outward ordering of all observations by assigning a numeric score in (0,1] to each data point with respect to its position within a cloud of a multivariate probability distribution. Using such a data depth function designed for directed and weighted graphs, AlphaCore maps a node with multiple features to a single numeric score, while preserving its relative importance with respect to other nodes.
Consider a directed and weighted multigraph,
Definition 1:. (Mahalanobis depth to the origin (MhDO)). Let
ΣF is the covariance matrix of F. The Mahalanobis data depth to origin (MhDO) measures the degree of “outlyingness” of point x (in this context, the node property column vector) in relation to origin 0.
As the AlphaCore decomposition unfolds, the core value α of a node is established using a data depth threshold ϵ ∈ [0, 1] that is applied to remove neighboring high-depth nodes iteratively. Nodes with high property values, such as large edge weights, generally have a low depth, while nodes with low property values often have a high depth, such as most blockchain nodes that trade small amounts of tokens. However, node property values are not the only factor that determines depth; the community structure around the node also plays a role. Nodes are considered to be in the α = (1 − ϵ)-core if their depth, relative to themselves, is no more than ϵ.
Why Data Depth? Data depth provides a more precise identification of crucial nodes compared to state-of-the-art core decomposition algorithms and acts as a combination of centrality measure and core decomposition (Victor et al., 2021). Unlike traditional decomposition algorithms, a depth-based decomposition does not require the specification of multiple feature weighting parameters to perform effectively on a particular task.
An Example of AlphaCore. To better illustrate the differences between the traditional graph-k-core and AlphaCore decomposition methods, we showcase an example in Figure 1. In the case of graph-k-core, the innermost core is the 3-core, whereas the InnerCore of AlphaCore would be the core of α > 0.75. Note that the 3-core consists of nodes that trade frequently with themselves, but their trade volumes with themselves are not that significant compared to other transactions which exist in the network. In certain analyses of financial networks such as anomalous address detection, being able to filter out these negligible transactions and their participating nodes, while still capturing more meaningful ones, significantly improves the accuracy and scalability of subsequent computations on the decomposed network core. On the other hand, the AlphaCore of α > 0.75 is able to capture both the nodes that participate in the largest transactions which occur in the example network, while filtering the negligible transactions and their participating nodes. We point out that the main limitation with graph-k-core is that it only considers node degrees, whereas AlphaCore is flexible and can consider any combination of node features as outlined in Table 1, without requiring to specify any feature weighting parameters to perform effectively on a particular task. Therefore, in networks where edge weights fall under a broad range and they are meaningful distinguishing factors, we recommend AlphaCore over the traditional graph-k-core decomposition.
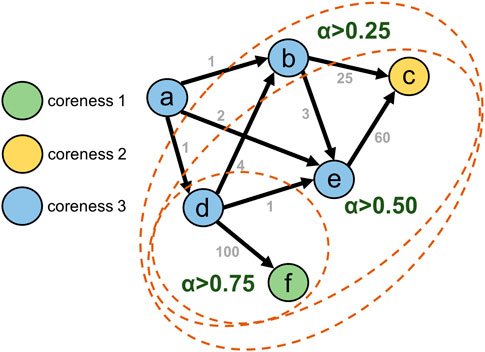
FIGURE 1. A running example to compare between the graph-k-core and AlphaCore decomposition methods. The Coreness of nodes according to graph-k-core decomposition is shown with different node colors, whereas AlphaCore is run with in-strength and out-strength as node features with a step size of 0.25. Different AlphaCores are shown using dotted boundaries.
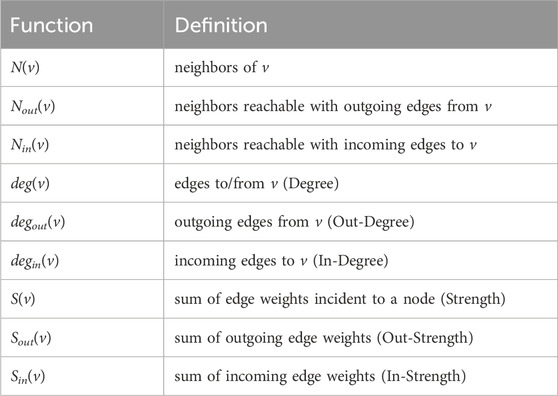
TABLE 1. Example node property functions.
3.4 Problem definition
Given a weighted, directed, multi-graph representation of a blockchain transaction network over successive timestamps, where
E-crime Detection vs Prediction. In blockchain space, predictions can only go so far, as we are unable to anticipate malicious transactions that originate from the external world. At most, what we can do is to detect e-crime transactions among the vast number of transactions taking place. This detection process is highly valuable because when a significant crime occurs, we have access to public graphs of the affected assets. However, the sheer volume of addresses and transactions makes qualitative analysis impractical. This is where blockchain data analytics tools come into play, aiming to narrow down the search space by providing a ranking of maliciousness to addresses and transactions.
4 Data depth
Depth functions have been initially introduced in the setting of non-parametric multivariate analysis to define affine invariant versions of median, quantiles, and ranks in higher dimensional spaces where there is no natural order (see historical overviews by Mosler (2012); Nieto-Reyes and Battey (2016)). The key idea of the depth approach is to offer a center-outward ordering of all observations by assigning a numeric score in (0,1] range to each data point with respect to its position within a cloud of multivariate or functional observations or a probability distribution. Nowadays, data depth is a rapidly developing field that gains increasing momentum due to the wide applicability of depth concepts to classification, visualization, high dimensional and functional data analysis (Hyndman and Shang, 2010; Narisetty and Nair, 2016; Mozharovskyi et al., 2020; Sguera and López-Pintado, 2020; Zhang et al., 2021). Most recently, depth approaches have found novel applications in density-based clustering and space-time data mining (Jeong et al., 2016; Huang and Gel, 2017; Vinue and Epifanio, 2020), shape recognition and uncertainty quantification in computer graphics (Whitaker et al., 2013; Sheharyar et al., 2019), ordinal data analysis (Kleindessner and von Luxburg, 2017) and computational geometry for privacy-preserving data analysis (Mahdikhani et al., 2020). Nevertheless, data depth is yet a largely unexplored concept in network sciences (Fraiman et al., 2015; Raj et al., 2017; Tian and Gel, 2017; 2019).
Definition 2:. (Data Depth). Formally, let E be a Banach space (e.g.,
Among many depth functions formulated to date, the Mahalanobis depth is one of the most prominent in the current practice.
Definition 3:. (Mahalanobis (MhD) depth). Let
Here ⊤ denotes matrix transpose. The MhD depth measures the outlyingness of the point with respect to the deepest point of the distribution (here μF), and allows to easily handle the elliptical family of distributions, including a Gaussian case.
MhD offers flexibility in changing the reference point with respect to which we compute data rankings. For instance, instead of μF we can select an arbitrary point
Furthermore, ΣF can be substituted by any empirical estimator of covariance matrix
5 Methodology
Our methodology is illustrated in Figure 2. In keeping with the routine of daily life, blockchain transaction networks are frequently examined on a 24-h basis (Chen et al., 2020; Casale-Brunet et al., 2021). We divide a blockchain transaction network into daily intervals, using a reference time zone to create a set of snapshot graphs. In a snapshot graph of a blockchain transaction network, a node represents a participant (traders, exchanges, liquidity pools, etc.), whereas a directed edge denotes a financial transaction involving the transfer of assets from one participant to the other. Next, we define InnerCore, InnerCore expansion, and InnerCore decay on the snapshot graphs. InnerCore helps us eliminate unimportant edges and nodes (e.g., addresses trading small amounts). We then compute daily temporal InnerCore expansion and decay measures to identify significant days and trends for further investigation (§5.2, §5.3). Subsequently, centered-motif analysis and NF-IAF score percentile ranking is employed to capture anomalous addresses of market manipulator traders (§5.4).
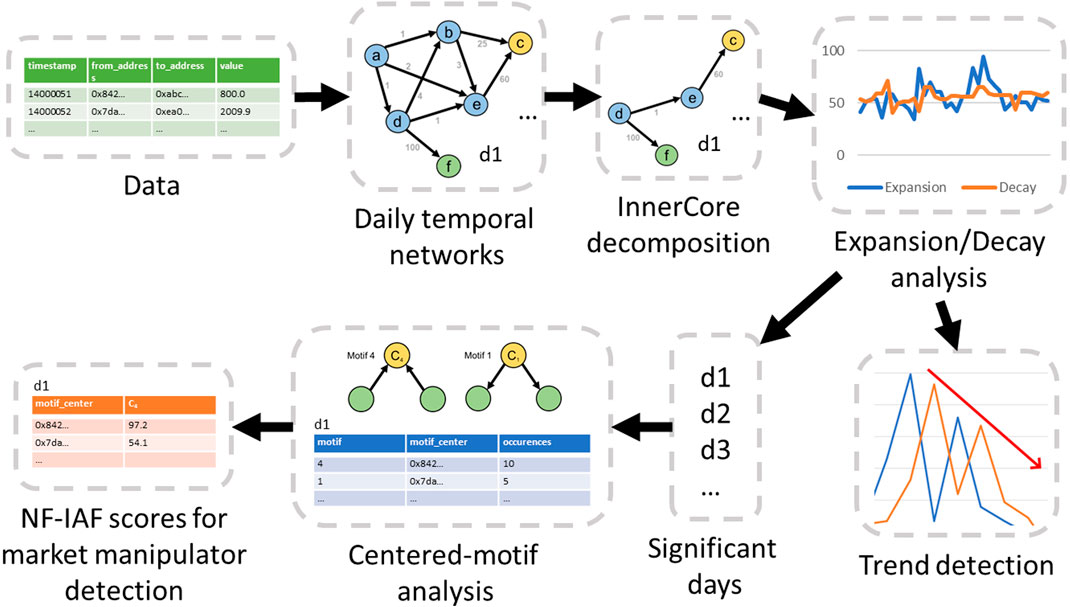
FIGURE 2. Flowchart of our methodology for identification of significant days and subsequent anomalous addresses.
5.1 InnerCore of a graph
Consider the weighted, directed multi-graph defined in Section 3.4. We define data depth of a node
We define the InnerCore of G as the set of nodes
Algorithm 1.InnerCore iscovery.
Input: Directed, weighted, multigraph G(V, E, w),
Set of node property functions p1, …, pn ∈ P,
Data depth threshold ϵ
Output: InnerCore Vinner
// Compute feature matrix
1 F = [f1, …, fn] = ∀pi ∈ P: fi = pi(v, G), ∀v ∈ V;
2
// Compute initial depth values
3
4 do
5 foreach zi ≥ϵ do
6
// recompute node properties
7 F = ∀pi ∈ P: pi(v, G), ∀v ∈ V;
// recompute depth
8
9 while ∃zi : (zi ≥ϵ) ∧ (vi ∈ V);
10 return
Algorithm 1 computes a feature matrix F based on each node property function in line 1. In particular, edge weight is used for computing Strength, In-Strength, and Out-Strength node property functions, where the numerical values of all incident edges to a node irrespective of direction, inbound to a node, and outbound from a node, respectively, are aggregated. For example, if we have a network
InnerCore vs Alphacore. InnerCore discovery of a graph G does not require a complete decomposition of all graph cores by varying ϵ, as it is done in AlphaCore (Victor et al., 2021). Instead, we set an ϵ value (e.g., ϵ = 0.1) just once, and then use the value to iteratively prune nodes until all remaining nodes, relative to themselves, satisfy a data depth less than ϵ. The InnerCore approach is also different from graph-k-core decomposition (Batagelj and Zaversnik, 2011), where the outer cores are computed first before the higher k-core can be determined. As a result, InnerCore discovery is quite scalable and can be applied to very large graphs. Our experiments in §6 reveal that InnerCore discovery has a running time that is only one-tenth of that required for AlphaCore decomposition.
Scalability. Computing the InnerCore requires performing Cholesky decomposition on the covariance matrix at line 2 once, which has time complexity O(d3) for d features. Node features need to be recomputed at each iteration of the while loop with a cost of
5.2 InnerCore expansion and decay
By analyzing how a temporal graph expands and shrinks in relation to entry and exit of nodes on a daily basis, we gain valuable insights into market sentiment. We define the influential nodes of a graph as its InnerCore nodes (i.e.,
To this end, we first discover
Definition 4:. (Expansion).
The expansion values have a range
Definition 5:. (Decay).
The decay values have a range
Example 1:. (Expansion and Decay). Suppose we have a temporal graph that produces two daily snapshot graphs at days t and t + 1. On day t, the InnerCore is composed of five nodes:
If we set i = 1, we can calculate the expansion and decay measures for the day t + 1 based on the previous day. In this case, the union of the InnerCores is
The expansion measure
A substantial expansion measure observed on a particular day often indicates the presence of excessive buy or sell behavior from new traders entering the daily InnerCore. Such behavior may arise either from a large group of traders acting in unison or from a selected group of traders whose significant transactions prompt other traders to follow a similar pattern. Consequently, heavy-buy or heavy-sell behaviors coincide on days characterized by considerable influxes of new traders entering the daily InnerCore. On the other hand, a substantial decay measure observed on a particular day often is reactionary in response to a significant change in the state of a currency caused by the transactions of key traders in the preceding days. Therefore, we suggest that days with significant expansion measures, followed by days with significant decay measures, as anomalies and prime candidates for detecting market manipulator addresses.
Parameters in Experimental Setup. In the context of InnerCore expansion and decay, a greater i (i.e., the history parameter from §3.2) produces an averaging effect, coupled with the tendency to lower expansion and inflate decay. Setting a specific i value depends on the application. We use i = 1 to improve the accentuation of expansion and decay in the InnerCore to better depict the shift in market sentiment during the days of significant events.
In InnerCore decomposition, depth values range between
5.3 Behavioral patterns in temporal networks
Temporal networks, including blockchain networks, exhibit continuous evolution and can experience notable shifts in user sentiment and node activity triggered by technological advancements and significant events, sometimes occurring within fewer days.
By utilizing expansion and decay, we have identified four behavioral patterns that provide sentiment indication and capture node activity. These patterns serve as the foundation for network analysis in our experiments detailed in §6. Figure 3 illustrates the expansion and decay values for each pattern. To gain a better understanding of these patterns, particularly when examining the temporal graph of a financial network such as the Ethereum transaction network, it is helpful to consider the network’s underlying transaction semantics.
• The Despair pattern is characterized by a reduction in expansion and an increase in decay, implying that previously influential nodes are leaving the network, while the InnerCore is shrinking due to a decrease in the number of new influential nodes.
• The Uncertainty pattern is distinguished by an increase in both expansion and decay. This is primarily due to the influx of many new traders into the network who do not remain active for a significant period of time.
• The Hope pattern is characterized by a reduction in decay and an increase in expansion, indicating the presence of many newcomers to the network who remain active within the network.
• The Faith pattern is identified by a decrease in both decay and expansion, which initially suggests a state of confusion. On the positive side, nodes, such as traders, may have faith in the network’s ability to withstand a catastrophic event, as demonstrated in the LunaTerra case in our experimental results. On the negative side, it may indicate a sense of hopelessness as traders may hold onto their assets without engaging in transactions or exiting the system altogether.
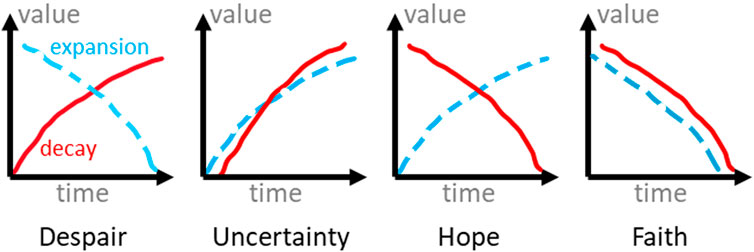
FIGURE 3. In a temporal graph (e.g., transaction network), changes in decay and expansion reflect varying levels of hope, despair, uncertainty, and faith in the asset being represented.
5.4 Motif analysis in InnerCore
Our rationale behind using motif analysis in conjunction with InnerCore is to accurately discover larger and potentially influential players in the daily network, referred to as market manipulators. The structure of a motif defines a behavior of interest and its existence in a network indicates the presence of such behavior.
Motif analysis has been a popular tool to identify subgraph patterns and the addresses involved in them (Milo et al., 2002; Bailey et al., 2009; Zhang and Parthasarathy, 2012; Paranjape et al., 2017; Lee et al., 2020). We have decided to use three-node motifs since they can be identified more quickly than higher-order motifs, while still capturing the direct buying or selling behavior between addresses. Our decision is consistent with previous research on temporal motifs (Paranjape et al., 2017).
Scalability. The fastest triangular motif discovery algorithm has time complexity
We define the center of each 3-node motif as a node that either receives incoming edges from the two other nodes (buy behavior) or delivers outgoing edges to two other nodes (sell behavior). This definition ensures that motif centers exhibit only buy or sell behavior, and they do not act as intermediary nodes between the other two nodes in a motif.
Out of the 16 connected three-node motifs (see Figure 1B in Milo et al. (2002)), only five of them contain a center node (Figure 4). We identify all instances of these five motifs and their centers from our daily networks’ InnerCores. Finally, we utilize the well-known TF-IDF measure from information retrieval (Salton and Buckley, 1988) to rank the discovered center nodes. TF-IDF is a statistical measure to reflect the relevance of a word in a collection of documents. In our setting, we treat each discovered center address as a word and daily instances of each motif as a collection of documents to propose a novel node relevance score for temporal graphs: NF-IAF.
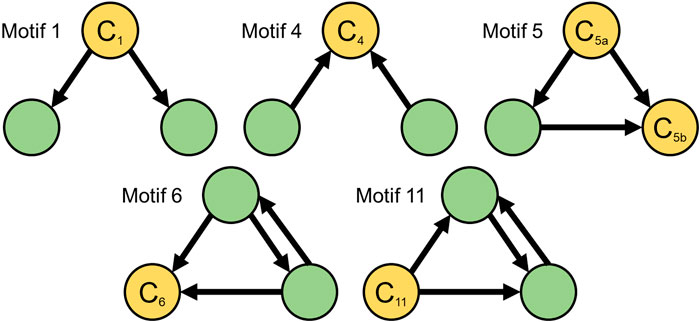
FIGURE 4. Five 3-node motifs exhibiting buy and sell behaviors. Nodes labeled C denote the center where a center with an in-degree = 2 indicates buy behavior and an out-degree = 2 indicates sell behavior. Out of the 16 connected 3-node motifs (see Figure 1B in Milo et al. (2002)), only the five given above (motifs 1, 4, 5, 6, and 11) contain a center node.
Formally, let M = m1, m4, m5, m6, m11 be the set of five motifs of interest, and let T = t1, t2, …, tn be the set of n days under consideration. For each mi ∈ M and tj ∈ T, let c(v, mi, tj) denote the number of occurrences of node
Definition 6:. (Node Frequency). We define the node frequency of node v for motif mi on day tj as
The NF measures how frequently a particular node occurs in a specific motif on a specific day relative to the total number of occurrences of all nodes in that motif on that day.
Definition 7:. (Inverse Appearance Frequency). We define the inverse appearance frequency of node v for motif mi as
where |T| is the total number of days in the dataset, and df(v, mi) is defined as the number of days tj ∈ T where c(v, mi, tj) > 0.
The IAF measures the importance of a node by how frequently it appears across all days for a motif. If a node appears in many days for a motif, its IAF will be low, indicating that it is not very informative. On the other hand, if a node appears in only a few days for a motif, its IAF will be high, indicating that it is a rare and potentially important node.
Definition 8:. (NF-IAF Score). The NF-IAF score of node v for motif mi on day tj is given as
A greater NF-IAF score of a center node on a particular day indicates greater relevance between that node and the behavior associated with the motif type. Therefore, a node corresponding to a motif center on a particular day with a high NF-IAF score has an increased likelihood that it has more influence on the network on that day, while a lower NF-IAF score indicates the opposite.
Example 2:. . Table 2 shows the number of occurrences of three nodes over 3 days for motifs m4 and m5. For example, to compute
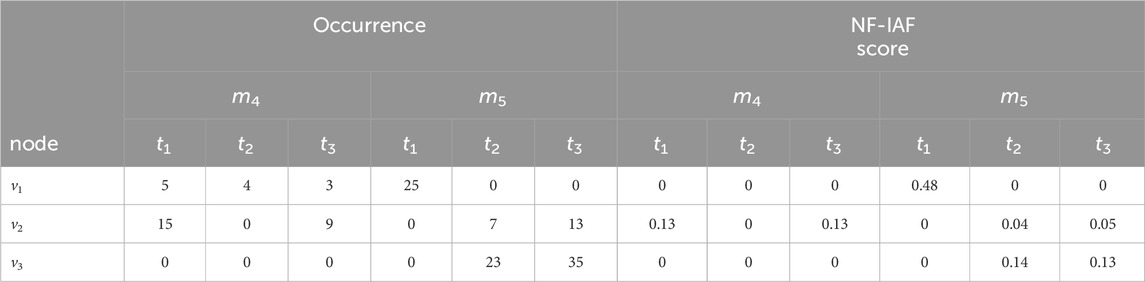
TABLE 2. Occurrences and NF-IAF scores of nodes v1, v2, and v3 across 3 days t1, t2, and t3 in instances of motifs m4 and m5. v3 does not appear for motif m4 on any day, whereas v1 does not appear on days t1 and t2 for motif m5.
6 Experimental results
In this section, we first describe three large temporal blockchain graphs that we use to answer our research questions (§3.4). Next, we analyze the scalability of InnerCore discovery and centered-motif analysis on these graphs. Upon demonstrating our scalability results, we illustrate how our methods provide predictive insights into anomalies stemming from external events and identify the addresses that played a significant role in such events. Our code and datasets are available at https://github.com/JZ-FSDev/InnerCore.
6.1 Environment setup
6.1.1 Datasets
Our experiments investigate the Ethereum transaction network and Ethereum stablecoin networks across three recent real-world events: the LunaTerra collapse, Ethereum’s transition to Proof-of-Stake, and USDC’s temporary peg loss. For each of our experiments, we construct a transaction network from the following datasets.
Ethereum Stablecoin Transaction Networks. We retrieve transaction data for the top five stablecoins based on market capitalization (UST, USDC, DAI, UST, PAX) and WLUNA from the Chartalist repository (Shamsi et al., 2022). The data pertains only to transactions conducted on the Ethereum blockchain; each transaction in the data set corresponds to a transfer of the asset indicated by the contract address. However, the UST collapse event that we are studying involved another blockchain called Terra with its own network, and the cryptocurrency called Luna, acting as a parallel to ether on Ethereum. Terra issued a stablecoin named UST (also known as TerraUSD), which offered high-interest rates to lenders and was pegged to the value of $USD1. Additionally, Terra’s owners created an ERC-20 version UST on the Ethereum blockchain and a Wrapped LUNA (WLUNA) token was established to trade Luna tokens on Ethereum. In May 2022, the Terra blockchain and its cryptocurrency Luna collapsed, owing to TerraUSD loans that could not be repaid. A Luna coin that was valued at $USD116 in April plummeted to a fraction of a penny during the collapse1. This resulted in a loss of confidence in both WLUNA and UST on Ethereum. On 9 May 2022, UST lost its $USD1 peg and fell as low as 35 cents2. The Ethereum Stablecoin dataset covers the period from 1 April 2022, to 1 November 2022, spanning about 1 month before the crash to 6 months after the crash. We construct a transaction network consisting of UST, USDC, DAI, UST, PAX, and WLUNA transactions for §6.3.1 between this period. We also use the address labels dataset from Shamsi et al. (2022) where labels of 296 addresses from 149 centralized and decentralized Ethereum exchange addresses are listed publicly to distinguish unique exchange addresses.
In March 2023, Silicon Valley Bank, holding over 3 billion of Circle’s collateralized reserves collapsed abruptly, causing a mass liquidation of USDC from traders. Consequently, on 11 March 2023, Circle’s USDC temporarily lost its $USD1 peg, dropping to an all-time low of 87 cents. The USDC dataset covers the period from 25 February 2023, to 23 March 2023, spanning approximately 2 weeks before and after the peg loss. We use a transaction network consisting of only USDC transactions for §6.3.3.
Ethereum Transaction Network. We collected ether transactions from the Ethereum blockchain for the period between August 21st and 1 October 2022. On an average day during this period, there were 480,000 addresses, with approximately 1 million edges connecting them. Ether is a type of cryptocurrency, similar to bitcoin, and its value can be converted to various fiat currencies such as USD and JPY. Ethereum changed its block creation process during this time, moving from the costly Proof-of-Work method to the more efficient Proof-of-Stake algorithm in two phases on September 9th and 15th, 2022.
6.1.2 Competitors
We compare InnerCore with two baselines: AlphaCore Victor et al. (2021) and graph-k-core (Batagelj and Zaversnik, 2011). We refer to §5.1, InnerCore vs Alphacore for their differences. Additionally, we compare against Scalable Change Point Detection (SCPD) (Huang et al., 2023), state-of-the-art attributed change detection method in dynamic graphs.
6.2 Scalability analysis
System Specifications. The machine used for experiments is an Intel Core i7-8700K CPU @ 3.70 GHz processor, 32.0GB RAM, Windows10 OS, and GeForce GTX1070 GPU. A combination of Python and R was used for coding.
InnerCore Discovery. Since we are interested in directly finding the InnerCore, compared to AlphaCore decomposition (Victor et al., 2021), InnerCore discovery method (§3.1) does not associate different ϵ values to intermediate cores generated in an iterative stepwise fashion. Instead, a fixed threshold ϵ, or upper bound for depth, is set and all nodes with a depth greater than ϵ are pruned repetitively until all remaining nodes relative to each other in the resulting network have a depth
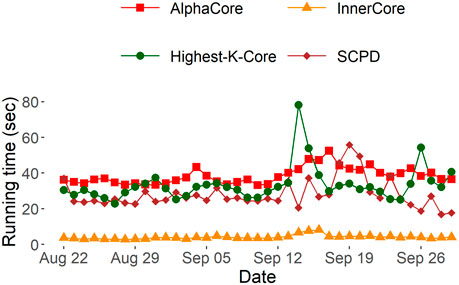
FIGURE 5. Comparison between running times of AlphaCore with the starting ϵ =1.0 and stepsize s =0.1, InnerCore with ϵ =0.1 on daily Ethereum transaction networks to return the InnerCore of depth
Due to the need for graph-k-core to repetitively iterate over all remaining nodes with each peeling until the highest k-core remains, we find InnerCore to be nearly 8x faster on each daily graph snapshot.
SCPD is state-of-the-art method to identify anomalies from attributed graph snapshots (Huang et al., 2023). Due to its spectral approach, we find it slower: InnerCore discovery runs nearly 7x faster on each daily graph snapshot, which demonstrates the scalability of our solution.
Three-Node Motifs Counting. Instead of conducting motif analysis on all nodes, our approach utilizes the InnerCore. By focusing on this core subset of nodes, we are able to reduce the number of nodes in a daily network consisting of approximately 480,000 nodes and 1 million edges to an induced subgraph of roughly 300 nodes and 90,000 edges (counting multi-edges), resulting in a more manageable and efficient approach. Although centered motif counting on each snapshot graph takes
6.3 Effectiveness analysis
6.3.1 Experiment 1: The collapse of LunaTerra
Stablecoins are meant to be a safe house as they are generally pegged to and maintain a 1:1 ratio with a fiat currency, resisting the volatility associated with other popular cryptocurrencies. Commonly, traders keep blockchain assets not needed for immediate use in a transaction as a stablecoin, analogous to people keeping extra money in a bank. For this reason, The LunaTerra collapse was a historic event in the decentralized financial space as it questioned traders’ trust in cryptocurrencies; if even stablecoins are susceptible to collapse, then is any cryptocurrency truly safe?
Behavioral Patterns via Expansion and Decay. First, we analyze this event from the perspective of traders’ market sentiment via expansion and decay measures of the temporal stablecoin network for the days surrounding the collapse. In Figure 6, 4 days after the collapse unfolded, on 13 May 2022, there was a substantial increase in decay and a decrease in expansion: a prime indicator of the despair behavioral pattern (§3.3). We can infer from this signal that a large majority of regular traders stopped trading by this time, either from the conversion or sale of any assets stored as UST out of the stablecoin ecosystem or simply due to uncertainty and inaction in response to the collapse. Following this cue, for approximately 2 weeks afterward, we see a consistent behavioral pattern of faith characterized by low expansion and low decay. During this period, few new traders entered or left the stablecoin network. There was still faith in the remaining traders that perhaps a large stablecoin such as UST could rebound and restore its peg with USD and thus, they refrained from engaging in any transactions. On the other hand, decay and expansion values also indicate a sign of hopelessness as the bulk of traders already exited the network since the first signal of despair. We understand from this behavioral analysis that there is a delayed reaction from traders when a significant unannounced event occurs due to indecision, and there is a general trend of inactivity in the following period.
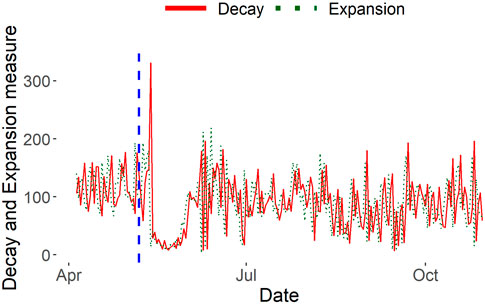
FIGURE 6. Stablecoin decay and expansion measures. On May 8 (shown with the vertical blue line), UST loses its $1 peg and falls to as low as 35 cents.
Why is this e-crime? We outline two reasons. Dumping of UST: On May 7th, large sums of UST were dumped, with 85 million UST swapped for 84.5 million USDC (Liu J. et al., 2023). This massive dumping of UST contributed to its de-pegging and caused its value to drop significantly. Concealing past failures: The CEO of Terra, Do Kwon, was revealed to be a co-creator of the failed algorithmic stablecoin, Basis Cash (Impekoven and Werne, 2023). The concealment of such information about the project’s founder could mislead traders and hide potential risks.
SCPD vs InnerCore. From Figure 7, we observe that SCPD less accentuates the critical event of UST’s peg loss and InnerCore more accurately depicts the impact of the collapse on the market relative to other days in the data time span. SCPD assigns an anomaly score to September 26 when USDC announced their plan to expand to five new blockchains3, nearly two times as anomalous as the score assigned to May 4, the closest day to the LunaTerra collapse. However, our Stablecoin decay and expansion measures in Figure 6 notably accentuate and emphasize the impact of UST’s peg loss on the stablecoin ecosystem from the less impactful events occurring on other days. This accentuation is evident by the presence of a pronounced decay peak on May 13 followed by a period of approximately 2 weeks of consistently low decay and expansion measures before returning to more standard values seen in other days, clearly indicating a significant event had transpired. This demonstrates that decay and expansion measures serve as a better indicator of the significance of an event on its corresponding network.
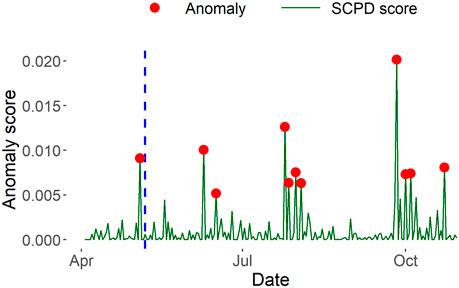
FIGURE 7. Stablecoin anomalous days identified by SCPD. Unlike decay and expansion measures by InnerCore, SCPD less accentuates the critical event of UST’s peg loss in Ethereum stablecoin networks, compared to other anomalies that occurred between April 3 to 30 Oct 2022.
Identify Key Addresses. Before the LunaTerra collapse, it is reasonable to assume that traders responsible for the collapse would prepare for the anticipated negative consequences by exiting the UST network and entering another reliable stablecoin. In order to capture these transactions of traders converting between different stablecoins, we have included four stablecoins in our network along with UST. We focus on the unknown addresses that occurred most frequently as motif centers in InnerCores (defined in §3.4) on days immediately before the LunaTerra collapse since they could have influenced the initial phase of the crash.
Generally, a large amount of tokens transferred from one address to another is easily detectable due to the sheer volume. However, if a trader tries to confiscate detection, the trader could produce multiple transactions with smaller volumes. Additionally, often in a transaction where one token is exchanged for another, a series of multiple transfers can arise for a single conversion transaction due to interactions with exchanges4. Therefore, a trader is more likely to exhibit both selling and buying behaviors, making the trader a prime candidate as a 3-node motif center.
Ground Truth. Nansen (https://www.nansen.ai/) is a prominent blockchain analytics platform that frequently publishes comprehensive analyses of blockchain events, which are followed with great interest by the industry. Nansen.ai conducted a thorough analysis of the LunaTerra collapse in May 2022 and identified 11 important addresses that played central roles in the collapse (Barthere et al., 2022). We compare the addresses of interest detected by our InnerCore analysis using the centered-motif approach with those identified by Nansen.ai (Table 4) as the primary candidates for triggering the collapse.
Exchanges are an intermediary hub to facilitate transfers between traders. The addresses of exchanges are well-known for this reason, making them not very interesting in our context. In contrast, addresses that are not exchanges are mostly owned by traders and thus, the existence of such addresses and their edges in a network is a direct consequence of a trader’s activity in the network. From Table 3, we observe that motif centers identified from InnerCores have a high ratio of non-exchange addresses to exchange addresses (≈99%). This shows the effectiveness of our method to identify potentially meaningful addresses in a network different from high-traffic exchange addresses.
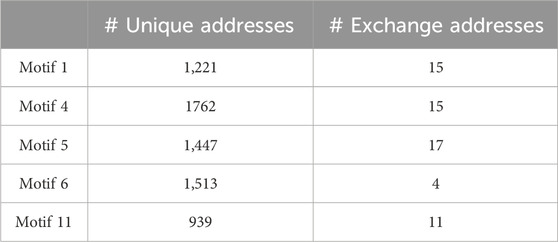
TABLE 3. Numbers of center addresses in motifs identified by our method (§3.4) that are known exchanges. The numbers represent the total counts per motif across all days.
In particular, we capture 9 of 11 externally owned addresses (EoAs) in Table 4 identified by Nansen.ai that occurred as center addresses for our motif types (Figure 4) on days immediately leading up to the LunaTerra collapse. We notice that the NF-IAF score percentile ranks of these addresses are higher compared to that of other center addresses for the same motif type on the same day, indicating that these addresses were important traders contributing to the buy or sell behavior associated with the motif on the day. We surmise the possibility that certain EoAs found by our InnerCore method, coupled with centered-motif analysis, could have been responsible for the initial phase of the collapse.
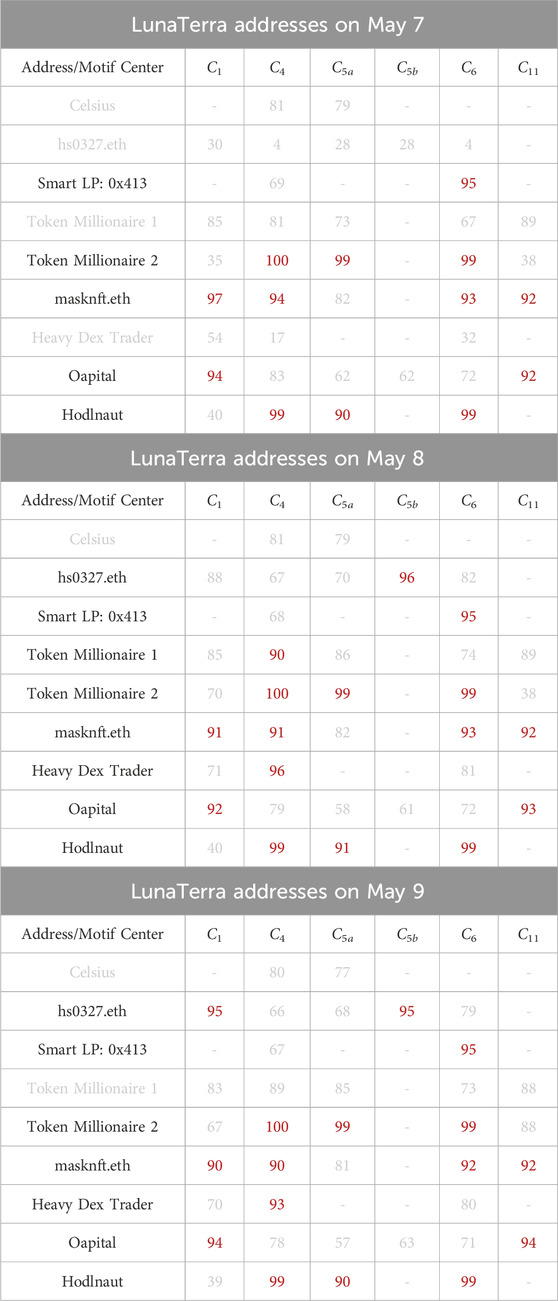
TABLE 4. NF-IAF score percentile ranks of InnerCore motif centers matching highlighted addresses by Nansen.ai to have played key roles before (May 7), during (May 8), and after (9 May 2022) the LunaTerra collapse. The percentile scores for individual addresses on a specific day of a particular motif center are determined relative to all addresses associated with the same motif center throughout all days in the data window. Motif centers C1, C5a, C11 exhibit sell behavior, while motif centers C4, C5b, C6 exhibit buy behaviour. Addresses with percentiles ≥90 across at least one motif center type (given in red color) are considered impactful on a given day. Dashes indicate absence of the address as the motif center.
Recall that in Figure 4, we defined motif centers C1, C5a, and C11 as exhibiting sell behavior; while motif centers C4, C5b, and C6 as exhibiting buy behavior. It is evident from Table 4 that every motif center on 8 May 2022, has at least one corresponding trader with an NF-IAF score percentile rank above 90. This suggests that addresses with greater NF-IAF percentiles exhibit a higher buy or sell behavior associated with the particular motif type on the day of the collapse. Specifically, we identify two traders, hs0327.eth and Heavy Dex Trader, as the most likely candidates for influencing the initial phase of the crash, since they had the greatest NF-IAF score percentile increases from May 7 to 8 May 2022 consistently across all their participating motif center types in comparison to other addresses. In addition, we identify the two traders, masknft.eth and Oapital, as key participants throughout the crash, since they are the two addresses with greater NF-IAF percentiles (above 90) occurring consistently across at least two motif types exhibiting sell behavior on days before, during, and after the crash. We identify Celsius as being the least likely trader to have directly impacted the collapse as it is the only address which had score percentiles
K-Core vs InnerCore. We notice that graph-k-core cannot find any of the 11 addresses indicated by Nansen.ai as prime candidates for triggering the initial phase of LunaTerra collapse. In comparison, InnerCore + centered-motif analysis captures potentially anomalous buy and sell behaviors by identifying 9 of the 11 addresses.
6.3.2 Experiment 2: Ethereum’s switch to PoS
Ethereum’s transition from Proof-of-Work (PoW) to Proof-of-Stake (PoS) came with many benefits including enhanced security for users and lower energy consumption. Together, these positives incentivized new traders to participate in the Ethereum network due to increased trust in the blockchain and lower barriers to entry. The transition occurred in two phases; the first phase was a preparatory hard forking of the blockchain into a PoS structure and the second phase was a finalization of the upgrade.
A pattern of hope was expected as the upgrade was highly anticipated due to the positives, transparency, and consistent updates regarding the official dates of the upgrade. From Figure 8, we indeed verify this behavioral pattern of hope characterized by inflated expansion values, coupled with relatively stable decay values, on three separate occasions. The first occurrence of hope is observed approximately a week before the first phase of the upgrade took place. It was around this time, the end of August 2022, that official news regarding the concrete dates of when the upgrade would be expected to take place was released to the public. We observe a surge of new hopeful traders participating in the Ethereum network and a significant dip in existing traders leaving the network in anticipation of the upgrade. The other two instances of hope are seen during the immediate days surrounding and between each of the phases of the upgrade. These occurrences provide insight into the market sentiment during the upgrade as positive and the overall transition of Ethereum to PoS as being well-received by traders.
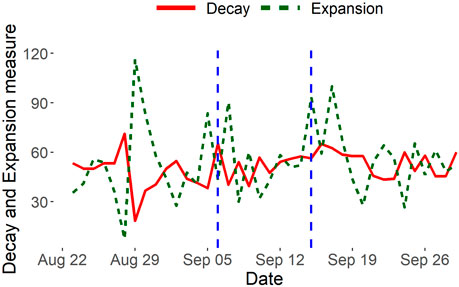
FIGURE 8. Ethereum decay and expansion measures. The move of Ethereum to Proof-of-Stake mining took place in two stages, indicated by 2 vertical blue lines (September 6 and 15, 2022). An expansion peak on 5 Sep 2022 detects the anomaly 1 day before the first stage commenced.
SCPD vs InnerCore. We next apply SCPD on the Ethereum transaction network to compare against our expansion and decay results. From Figure 9, we notice that SCPD less accurately captures the two phases of Ethereum’s transition to POS occurring on September 6 and 15, 2022. SCPD identifies September 9 and 16 as anomalous, which are 2 days before the first phase and 1 day after the second phase, respectively, of Ethereum’s transition to POS. In contrast, our expansion measures in Figure 8 more accurately capture the phases of Ethereum transition to POS by producing a peak on September 4, 1 day before the first phase, and on September 15, the same day of the second phase. It is evident InnerCore detects the second phase of the switch on the day of the event, whereas SCPD can only detect the event after it has occurred. Therefore, InnerCore expansion measures more accurately detect an anomaly on days when a significant event actually unfolded.
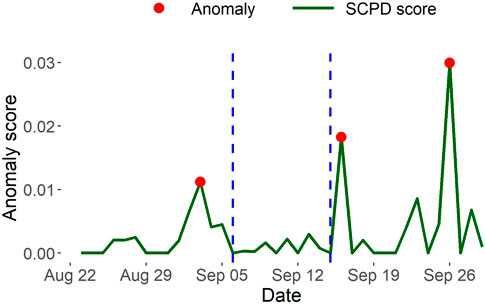
FIGURE 9. Ethereum anomalous days identified by SCPD. Compared to decay and expansion measures by InnerCore, SCPD less accurately captures the two phases of Ethereum’s transition to POS occurring on September 6 and 15, 2022.
6.3.3 Experiment 3: USDC’s temporary peg loss
On 11 May 2023, a significant event unfolded in the stablecoin market as Circle’s stablecoin, USDC, experienced a temporary loss of its peg, plummeting to a concerning value of 87 cents5. The abrupt collapse of Silicon Valley Bank, which held over 3 billion of Circle’s reserves, triggered panic among traders. Fearing a collapse, many traders liquidated their USDC holdings and sought refuge in alternative stablecoins like MakerDAO’s DAI.
By analyzing the expansion and decay measures surrounding the incident, we realize how traders responded differently to this event. Figure 10 shows a sudden surge in expansion on 11 May 2023, attributing to a wave of traders liquidating their USDC holdings in response to the stablecoin’s all-time low value of 87 cents. In the subsequent 3 days following the temporary loss of USDC’s peg, a distinct series of behavioral patterns emerged, characterized by alternating signals of despair, hope, and despair again, before eventually stabilizing. During this 3-day period, Circle’s reassurances regarding the recovery of lost reserves gradually restored trust among its traders. This is evident through the decreasing extent of despair patterns observed on the 12th and 14th.
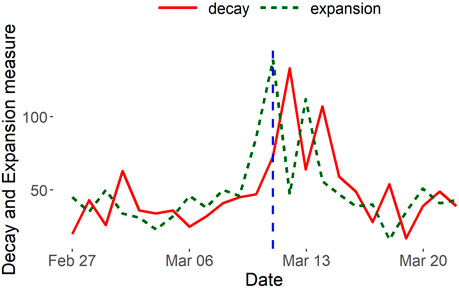
FIGURE 10. USDC decay and expansion measures. On 11 Mar 2023 (shown with the vertical blue line), USDC loses its $1 peg and falls to as low as 87 cents. An expansion peak detects the anomaly on the day the event transpires.
In summary, traders’ reactions were initially marked by panic and a rush to sell USDC, causing a surge in expansion. However, as Circle provided updates on their efforts to recover the lost reserves, a sense of hope permeated the market, leading to a decline in the extent of despair patterns. Ultimately, the stablecoin regained stability, with expansion and decay returning to typical levels.
SCPD vs InnerCore. We also apply SCPD to the USDC network in order to compare with our decay and expansion results. From Figure 11, we observe that SCPD less accurately captures USDC’s temporary peg loss occurring on March 11. SCPD identifies March 12 and 15 as anomalous which are 1 day and 4 days, respectively, after USDC’s peg loss. Conversely, our expansion measures in Figure 10 accurately capture USDC’s peg loss by producing a prominent peak on March 11. It is evident that InnerCore detects the temporary peg loss on the day of the event, whereas SCPD can only detect the event after it has occurred. Clearly, our InnerCore expansion measures more accurately indicate an anomaly on days when a significant event occurred.
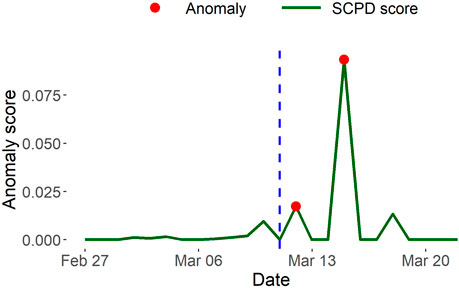
FIGURE 11. USDC anomalous days identified by SCPD. Compared to decay and expansion measures by InnerCore, SCPD less accurately captures USDC’s temporary peg loss occurring on 11 Mar 2023.
7 Conclusion
We have introduced InnerCore, which utilizes data depth-based core discovery to identify the influential nodes in temporal blockchain token networks. Furthermore, we have proposed two metrics, InnerCore expansion and decay, that provide a sentiment indicator for the networks and explain trader mood.
Finally, with a centered-motif analysis in the InnerCore, we detected market manipulators and e-crime behavior. The scalability and computational efficiency of InnerCore discovery make it well-suited for analyzing large temporal graphs, including those found in Ethereum transaction and stablecoin networks. Our experiments, which compare our findings against external ground truth, baselines, and state-of-the-art attributed change detection approach in dynamic graphs, show that InnerCore efficiently extracts useful information from large networks compared to existing methods. In future, we shall use InnerCore to explore network robustness against Decentralized Finance (DeFi) attacks.
Data availability statement
The original contributions presented in the study are included in the article/Supplementary material, further inquiries can be directed to the corresponding author.
Author contributions
JZ: Data curation, Formal Analysis, Investigation, Methodology, Software, Validation, Visualization, Writing–original draft, Writing–review and editing. AK: Formal Analysis, Investigation, Methodology, Project administration, Supervision, Validation, Writing–original draft, Writing–review and editing. CA: Conceptualization, Data curation, Formal Analysis, Funding acquisition, Investigation, Methodology, Project administration, Resources, Software, Supervision, Validation, Visualization, Writing–original draft, Writing–review and editing.
Funding
The author(s) declare financial support was received for the research, authorship, and/or publication of this article. AK acknowledges support from the Novo Nordisk Foundation grant NNF22OC0072415. CA is supported by the Canadian NSERC Discovery Grant RGPIN-2020-05665: Data Science on Blockchains.
Conflict of interest
The authors declare that the research was conducted in the absence of any commercial or financial relationships that could be construed as a potential conflict of interest.
Publisher’s note
All claims expressed in this article are solely those of the authors and do not necessarily represent those of their affiliated organizations, or those of the publisher, the editors and the reviewers. Any product that may be evaluated in this article, or claim that may be made by its manufacturer, is not guaranteed or endorsed by the publisher.
Footnotes
1https://coinmarketcap.com/currencies/wrapped-luna-token/.
2https://coinmarketcap.com/currencies/terrausd/.
3https://www.chartalist.org/eth/StablecoinAnalysis.html.
4https://etherscan.io/tx/0xa3663b813b2c13a88daeeb5b48b32b7024fc07cbf250f2c2a9318ec1950c9da9.
5https://coinmarketcap.com/currencies/usd-coin/.
References
Akcora, C. G., Dey, A. K., Gel, Y. R., and Kantarcioglu, M. (2018). “Forecasting Bitcoin price with graph chainlets,” in PAKDD 2018: advances in knowledge discovery and data mining (Melbourne, Australia: Springer), 1–12.
Akcora, C. G., Li, Y., Gel, Y. R., and Kantarcioglu, M. (2020). “Bitcoinheist: topological data analysis for ransomware prediction on the Bitcoin blockchain,” in Proceedings of the Twenty-Ninth International Joint Conference on Artificial Intelligence, IJCAI, 4439–4445.
Al-garadi, M. A., Varathan, K. D., and Ravana, S. D. (2017). Identification of influential spreaders in online social networks using interaction weighted k-core decomposition method. Phys. A Stat. Mech. its Appl. 468, 278–288. doi:10.1016/j.physa.2016.11.002
Anoaica, A., and Levard, H. (2018). “Quantitative description of internal activity on the Ethereum public blockchain,” in 2018 9th IFIP International Conference on New Technologies, Mobility and Security (NTMS), Paris, France, 26-28 February 2018, 1–5.
Aspembitova, A. T., Feng, L., and Chew, L. Y. (2021). Behavioral structure of users in cryptocurrency market. PLOS One 16, e0242600. doi:10.1371/journal.pone.0242600
Bailey, T. L., Boden, M., Buske, F. A., Frith, M., Grant, C. E., Clementi, L., et al. (2009). Meme suite: tools for motif discovery and searching. Nucleic acids Res. 37, W202–W208. doi:10.1093/nar/gkp335
Barthere, A., Baraki, B., Li Khoo, Y., Grushyn, P., Yi Lim, X., and Ho, J. (2022). On-chain forensics: demystifying TerraUSD de-peg. Available at: https://www.nansen.ai/research/on-chain-forensics-demystifying-terrausd-de-peg.
Batagelj, V., and Zaversnik, M. (2011). Fast algorithms for determining (generalized) core groups in social networks. Adv. Data Anal. Classif. 5, 129–145. doi:10.1007/s11634-010-0079-y
Casale-Brunet, S., Ribeca, P., Doyle, P., and Mattavelli, M. (2021). “Networks of Ethereum non-fungible tokens: a graph-based analysis of the erc-721 ecosystem,” in 2021 IEEE International Conference on Blockchain (Blockchain) (IEEE), Melbourne, Australia, 06-08 December 2021, 188–195.
Chen, T., Li, Z., Zhu, Y., Chen, J., Luo, X., Lui, J. C.-S., et al. (2020). Understanding Ethereum via graph analysis. ACM Trans. Internet Technol. (TOIT) 20, 1–32. doi:10.1145/3381036
Chen, W., Wu, J., Zheng, Z., Chen, C., and Zhou, Y. (2019). “Market manipulation of Bitcoin: evidence from mining the mt. gox transaction network,” in IEEE Conference on Computer Communications, INFOCOM, Paris, France, 29 April 2019 - 02 May 2019, 964–972.
Coppersmith, D., and Winograd, S. (1987). “Matrix multiplication via arithmetic progressions,” in Proceedings of the nineteenth annual ACM symposium on Theory of computing, 1–6.
Faux, Z., and Shen, M. (2022). A $60 billion crypto collapse reveals a new kind of bank run. Finance: Businessweek.
Fraiman, D., Fraiman, F., and Fraiman, R. (2015). Statistics of dynamic random networks: a depth function approach. arXiv:1408.3584v3.
Garas, A., Schweitzer, F., and Havlin, S. (2012). A k-shell decomposition method for weighted networks. New J. Phys. 14, 083030. doi:10.1088/1367-2630/14/8/083030
Gaviao Mascarenhas, J. Z., Ziviani, A., Wehmuth, K., and Vieira, A. B. (2020). On the transaction dynamics of the Ethereum-based cryptocurrency. J. Complex Netw. 8. doi:10.1093/comnet/cnaa042
Giatsidis, C., Thilikos, D. M., and Vazirgiannis, M. (2011). “Evaluating cooperation in communities with the k-core structure,” in International Conference on Advances in Social Networks Analysis and Mining, Kaohsiung, Taiwan, 25-27 July 2011, 87–93.
Guidi, B., and Michienzi, A. (2020). “Users and bots behaviour analysis in blockchain social media,” in Seventh International Conference on Social Networks Analysis, Management and Security, SNAMS (IEEE), Paris, France, 14-16 December 2020, 1–8.
Huang, D. Y., Aliapoulios, M. M., Li, V. G., Invernizzi, L., Bursztein, E., McRoberts, K., et al. (2018). “Tracking ransomware end-to-end,” in IEEE Symposium on Security and Privacy, SP, San Francisco, CA, USA, 20-24 May 2018, 618–631.
Huang, S., Danovitch, J., Rabusseau, G., and Rabbany, R. (2023). “Fast and attributed change detection on dynamic graphs with density of states,” in Pacific-Asia Conference on Knowledge Discovery and Data Mining (PAKDD), 15–26.
Huang, X., and Gel, Y. R. (2017). “Crad: clustering with robust autocuts and depth,” in 2017 IEEE International Conference on Data Mining (ICDM) (IEEE), New Orleans, LA, USA, 18-21 November 2017, 925–930.
Hyndman, R. J., and Shang, H. L. (2010). Rainbow plots, bagplots, and boxplots for functional data. J. Comput. Graph. Statistics 19, 29–45. doi:10.1198/jcgs.2009.08158
Impekoven, C., and Werne, J. (2023). Central banks, cryptocurrencies and monetary stability: same game, same rules? J. Digital Bank. 7, 357–364.
Jeong, M.-H., Cai, Y., Sullivan, C. J., and Wang, S. (2016). “Data depth based clustering analysis,” in Proceedings of the 24th ACM SIGSPATIAL International Conference on Advances in Geographic Information Systems.
Jiang, C., Foye, J., Broadhurst, R., and Ball, M. (2021). “Illicit firearms and other weapons on darknet markets,” in Trends and issues in crime and criminal justice [electronic resource] (Canberra: Australian Institute of Criminology), 1–20.
Kalodner, H., Goldfeder, S., Chator, A., Möser, M., and Narayanan, A. (2017). Blocksci: design and applications of a blockchain analysis platform. arXiv preprint arXiv:1709.02489. Available at: https://doi.org/10.48550/arXiv.1709.02489.
Kapengut, E., and Mizrach, B. (2022). An event study of the Ethereum transition to proof-of-stake. arXiv preprint arXiv:2210.13655. Available at: https://doi.org/10.48550/arXiv.2210.13655.
Khan, A. (2022). “Graph analysis of the Ethereum blockchain data: a survey of datasets, methods, and future work,” in 2022 IEEE International Conference on Blockchain (Blockchain) (IEEE), Espoo, Finland, 22-25 August 2022, 250–257.
Khan, A., and Akcora, C. G. (2022). “Graph-based management and mining of blockchain data,” in Proceedings of the 31st ACM International Conference on Information and Knowledge Management (CIKM), 5140–5143.
Kiffer, L., Levin, D., and Mislove, A. (2018). “Analyzing Ethereum’s contract topology,” in Proceedings of the Internet Measurement Conference 2018, Boston, MA, USA. ACM, New York, 31-November 2, 2018, 494–499.
Kılıç, B., Sen, A., and Özturan, C. (2022). “Fraud detection in blockchains using machine learning,” in 2022 Fourth International Conference on Blockchain Computing and Applications (BCCA) (IEEE), San Antonio, TX, USA, 05-07 September 2022, 214–218.
Kleindessner, M., and von Luxburg, U. (2017). Lens depth function and k-relative neighborhood graph: versatile tools for ordinal data analysis. J. Mach. Learn. Res. 18, 1–52.
Kraaijeveld, O., and Smedt, D. J. (2020). The Predictive power of public twitter sentiment for forecasting cryptocurrency prices. J. Int. Financial Mark. Institutions Money 65, 101188. doi:10.1016/j.intfin.2020.101188
Latapy, M. (2008). Main-memory triangle computations for very large (sparse (power-law)) graphs. Theor. Comput. Sci. 407, 458–473. doi:10.1016/j.tcs.2008.07.017
Lee, X. T., Khan, A., Gupta, S. S., Ong, Y. H., and Liu, X. (2020). “Measurements, analyses, and insights on the entire Ethereum blockchain network,” in Proceedings of The Web Conference 2020, 155–166.
Li, D., Han, D., Weng, T.-H., Zheng, Z., Li, H., and Li, K.-C. (2024). On stablecoin: ecosystem, architecture, mechanism and applicability as payment method. Comput. Stand. Interfaces 87, 103747. doi:10.1016/j.csi.2023.103747
Li, J., Baldimtsi, F., Brandao, J. P., Kugler, M., Hulays, R., Showers, E., et al. (2021). “Measuring illicit activity in defi: the case of Ethereum,” in Financial cryptography and data security. FC 2021 international workshops: CoDecFin, DeFi, VOTING, and WTSC, virtual event, March 5, 2021, revised selected papers 25 (Berlin, Heidelberg: Springer), 197–203.
Liao, X., Liu, Q., Jiang, J., Huang, X., Xu, J., and Choi, B. (2022). Distributed d-core decomposition over large directed graphs. Proc. VLDB Endow. 15, 1546–1558. doi:10.14778/3529337.3529340
Liu, J., Makarov, I., and Schoar, A. (2023a). Anatomy of a run: the terra luna crash. Cambridge, MA, United States: National Bureau of Economic Research.
Liu, Y., Yu, W., Ai, Z., Xu, G., Zhao, L., and Tian, Z. (2023b). A blockchain-empowered federated learning in healthcare-based cyber physical systems. IEEE Trans. Netw. Sci. Eng. 10, 2685–2696. doi:10.1109/tnse.2022.3168025
Liu, Y., Zhang, C., Yan, Y., Zhou, X., Tian, Z., and Zhang, J. (2023c). A semi-centralized trust management model based on blockchain for data exchange in iot system. IEEE Trans. Serv. Comput. 16, 858–871. doi:10.1109/tsc.2022.3181668
Luo, F., Li, B., Wan, X.-F., and Scheuermann, R. H. (2009). Core and periphery structures in protein interaction networks. BMC Bioinforma. 10, S8. doi:10.1186/1471-2105-10-s4-s8
Mahdikhani, H., Shahsavarifar, R., Lu, R., and Bremner, D. (2020). Achieve privacy-preserving simplicial depth query over collaborative cloud servers. Peer-to-Peer Netw. Appl. 13, 412–423. doi:10.1007/s12083-019-00810-7
Malliaros, F. D., Giatsidis, C., Papadopoulos, A. N., and Vazirgiannis, M. (2020). The core decomposition of networks: theory, algorithms and applications. VLDB J. 29, 61–92. doi:10.1007/s00778-019-00587-4
Milo, R., Shen-Orr, S., Itzkovitz, S., Kashtan, N., Chklovskii, D., and Alon, U. (2002). Network motifs: simple building blocks of complex networks. Science 298, 824–827. doi:10.1126/science.298.5594.824
Moin, A., Sekniqi, K., and Sirer, E. G. (2020). “Sok: a classification framework for stablecoin designs,” in Financial cryptography and data security: 24th international conference, FC 2020, kota kinabalu, Malaysia, february 10–14, 2020 revised selected papers 24 (Cham: Springer), 174–197.
Mosler, K. (2012). “Multivariate dispersion, central regions, and depth,” in The lift zonoid approach, vol. 165 (New York, NY: Springer Science and Business Media).
Mozharovskyi, P., Josse, J., and Husson, F. (2020). Nonparametric imputation by data depth. J. Am. Stat. Assoc. 115, 241–253. doi:10.1080/01621459.2018.1543123
Nakamoto, S. (2008). Bitcoin: a peer-to-peer electronic cash system. Available at: https://bitcoin.org/bitcoin.pdf (Accessed January 26, 2024).
Narisetty, N., and Nair, V. (2016). Extremal depth for functional data and applications. J. Am. Stat. Assoc. 111, 1705–1714. doi:10.1080/01621459.2015.1110033
Nieto-Reyes, A., and Battey, H. (2016). A topologically valid definition of depth for functional data. Stat. Sci. 31, 61–79. doi:10.1214/15-sts532
Oliveira, P. H. F., Rezende, D. M., Bernardino, H. S., Villela, S. M., and Vieira, A. B. (2022). Analysis of account behaviors in Ethereum during an economic impact event. arXiv preprint arXiv:2206.11846. Available at: https://doi.org/10.48550/arXiv.2206.11846.
Paranjape, A., Benson, A. R., and Leskovec, J. (2017). “Motifs in temporal networks,” in Proceedings of the Tenth ACM International Conference on Web Search and Data Mining (ACM), 601–610.
Patel, V., Pan, L., and Rajasegarar, S. (2020). “Graph deep learning based anomaly detection in Ethereum blockchain network,” in Network and System Security: 14th International Conference, NSS 2020, Melbourne, VIC, Australia, November 25–27, 2020, 132–148.
Poursafaei, F. R. (2022). Anomaly detection in cryptocurrency networks and beyond. Canada: McGill University.
Raj, M., Mirzargar, M., Ricci, R., Kirby, R. M., and Whitaker, R. T. (2017). Path boxplots: a method for characterizing uncertainty in path ensembles on a graph. J. Comput. Graph. Statistics 26, 243–252. doi:10.1080/10618600.2016.1209115
Salton, G., and Buckley, C. (1988). Term-weighting approaches in automatic text retrieval. Inf. Process. Manag. 24, 513–523. doi:10.1016/0306-4573(88)90021-0
Seidman, S. B. (1983). Network structure and minimum degree. Soc. Netw. 5, 269–287. doi:10.1016/0378-8733(83)90028-x
Sguera, C., and López-Pintado, S. (2020). A notion of depth for sparse functional data. arXiv:2007.15413. Available at: https://doi.org/10.48550/arXiv.2007.15413.
Shamsi, K., Victor, F., Kantarcioglu, M., Gel, Y. R., and Akcora, C. G. (2022). Chartalist: labeled graph datasets for utxo and account-based blockchains. 36th Conf. Neural Inf. Process. Syst. (NeurIPS 2022) 36, 1–10.
Sheharyar, A., Ruh, A., Aristova, M., Scott, M., Jarvis, K., Elbaz, M., et al. (2019). Visual analysis of regional myocardial motion anomalies in longitudinal studies. Comput. Graph. 83, 62–76. doi:10.1016/j.cag.2019.07.004
Silva, D. R. (2020). “Characterizing relationships between primary miners in Ethereum by analyzing on-chain transactions,” in 2020 2nd Conference on Blockchain Research and Applications for Innovative Networks and Services (BRAINS) (IEEE), Paris, France, 28-30 September 2020, 240–247.
Su, V. H., Gupta, S. S., and Khan, A. (2022). “Automating ETL and mining of Ethereum blockchain network,” in WSDM: The Fifteenth ACM International Conference on Web Search and Data Mining, Tempe, AZ, USA. ACM, February 21–25, 2022, 1581–1584.
Tian, Y., and Gel, Y. R. (2017). “Fast community detection in complex networks with a k-depths classifier,” in Big and complex data analysis (Cham: Springer), 139–157.
Tian, Y., and Gel, Y. R. (2019). Fusing data depth with complex networks: community detection with prior information. Comput. Statistics Data Analysis 139, 99–116. doi:10.1016/j.csda.2019.01.007
Tian, Z., Li, M., Qiu, M., Sun, Y., and Su, S. (2019). Block-def: a secure digital evidence framework using blockchain. Inf. Sci. 491, 151–165. doi:10.1016/j.ins.2019.04.011
Victor, F., Akcora, C. G., Gel, Y. R., and Kantarcioglu, M. (2021). “Alphacore: data depth based core decomposition,” in Proceedings of the 27th ACM SIGKDD Conference on Knowledge Discovery and Data Mining, Virtual Event, Singapore, August 14 - 18, 2021, 1625–1633.
Victor, F., and Lüders, B. K. (2019). “Measuring Ethereum-based erc20 token networks,” in International conference on financial cryptography and data security (Cham: Springer), 113–129.
Vinue, G., and Epifanio, I. (2020). Robust archetypoids for anomaly detection in big functional data. Adv. Data Analysis Classif. 15, 437–462. doi:10.1007/s11634-020-00412-9
Vo, A.-D., Nguyen, Q.-P., and Ock, C.-Y. (2019). Sentiment analysis of news for effective cryptocurrency price prediction. Int. J. Knowl. Eng. 5, 47–52. doi:10.18178/ijke.2019.5.2.116
Whitaker, R., Mirzargar, M., and Kirby, R. (2013). Contour boxplots: a method for characterizing uncertainty in feature sets from simulation ensembles. IEEE Trans. Vis. Comput. Graph. 19, 2713–2722. doi:10.1109/tvcg.2013.143
Wood, G. (2014). Ethereum: a secure decentralised generalised transaction ledger. Ethereum Proj. yellow Pap. 151, 1–32.
Wu, J., Lin, K., Lin, D., Zheng, Z., Huang, H., and Zheng, Z. (2022). Financial crimes in web3-empowered metaverse: taxonomy, countermeasures, and opportunities. IEEE Open J. Comput. Soc. 4, 37–49. doi:10.1109/OJCS.2023.3245801
Wu, Z., Liu, J., Wu, J., Zheng, Z., and Chen, T. (2023). Tracer: scalable graph-based transaction tracing for account-based blockchain trading systems. Trans. Info. For. Sec. 18, 2609–2621. doi:10.1109/tifs.2023.3266162
Zhang, X., Tian, Y., Guan, G., and Gel, Y. R. (2021). Depth-based classification for relational data with multiple attributes. J. Multivar. Analysis 184, 104732. doi:10.1016/j.jmva.2021.104732
Zhang, Y., and Parthasarathy, S. (2012). “Extracting analyzing and visualizing triangle k-core motifs within networks,” in 2012 IEEE 28th International Conference on Data Engineering (IEEE), Arlington, VA, USA, 01-05 April 2012, 1049–1060.
Zhao, L., Sen Gupta, S., Khan, A., and Luo, R. (2021). “Temporal analysis of the entire Ethereum blockchain network,” in Proceedings of the Web Conference 2021, Ljubljana, Slovenia, April 19 - 23, 2021, 2258–2269.
Keywords: blockchain networks, decentralized finance, stablecoin, data depth, core decomposition, network motifs
Citation: Zhu J, Khan A and Akcora CG (2024) Data depth and core-based trend detection on blockchain transaction networks. Front. Blockchain 7:1342956. doi: 10.3389/fbloc.2024.1342956
Received: 22 November 2023; Accepted: 15 January 2024;
Published: 16 February 2024.
Edited by:
Zhihong Tian, Guangzhou University, ChinaReviewed by:
Natkamon Tovanich, École Polytechnique, FranceYan Wu, Jiangsu University, China
Yanbin Sun, Guangzhou University, China
Copyright © 2024 Zhu, Khan and Akcora. This is an open-access article distributed under the terms of the Creative Commons Attribution License (CC BY). The use, distribution or reproduction in other forums is permitted, provided the original author(s) and the copyright owner(s) are credited and that the original publication in this journal is cited, in accordance with accepted academic practice. No use, distribution or reproduction is permitted which does not comply with these terms.
*Correspondence: Cuneyt Gurcan Akcora, Y3VuZXl0LmFrY29yYUB1Y2YuZWR1