 Rishi Ram Parajuli
 Junji Kiyono
- 1Department of Urban Management, Graduate School of Engineering, Kyoto University, Kyoto, Japan
- 2Graduate School of Global Environmental Studies, Kyoto University, Kyoto, Japan
On April 25, 2015, a M7.8 earthquake rattled central Nepal; ground motion recorded in Kantipath, Kathmandu, 76.86 km east of the epicenter suggested that the low-frequency component was dominant. We consider data from eight aftershocks following the Gorkha earthquake and analyze ground motion characteristics; we found that most of the ground motion records are dominated by low frequencies for events with a moment magnitude >6. The Gorkha earthquake devastated hundreds of thousands of structures. In the countryside, and especially in rural mountainous areas, most of the buildings that collapsed were stone masonry constructions. Detailed damage assessments of stone masonry buildings in Harmi Gorkha was done, with an epicentral distance of about 17 km. Structures were categorized as large, medium, and small depending on their plinth area size and number of stories. Most of the structures in the area were damaged; interestingly, all ridge-line structures were heavily damaged. Moreover, Schmidt hammer tests were undertaken to determine the compressive strength of stone masonry and brick masonry with mud mortar for normal buildings and historical monuments. The compressive strengths of stone masonry and brick masonry were found to be 12.38 and 18.75 MPa, respectively. Historical structures constructed with special bricks had a compressive strength of 29.50 MPa. Pullout tests were also conducted to determine the stone masonry-mud mortar bond strength. The cohesive strength of mud mortar and the coefficient of friction were determined.
Introduction
Nepal lies in an active seismic zone in the Himalayan belt within the boundary between the Eurasian and Indian plates. Records of large earthquakes that have devastated Nepal, claiming a significant number of lives, have been kept for more than seven centuries. On June 7, AD 1255, a mega earthquake was the first ever documented earthquake in the region; it was likely to have had an intensity of MMI X and killed about one-third of the people in the current capital Kathmandu, including King Abhaya Malla of the Malla era [BECA World International (New Zealand) et al., 1993]. Other major historical earthquakes occurred in 1408, destroying the Machhendra Nath temple in Patan, 1681 and 1810. Bilham (1995) stated that the major earthquake event of August 26, 1833 had a moment magnitude of 7.5–7.9 with a possible rupture length of 70 km and an epicenter located 50 km North or North-East of Kathmandu, and was preceded by two large foreshocks that took place 5 h and 15 min prior to the main shock. This alarmed people and caused them to stay outside their houses, thereby probably saving many lives. Another well-known devastating earthquake prior to the Gorkha earthquake was the Nepal–Bihar earthquake of 1934 with a Richter magnitude of 8.4. Bramha Smasher JBR stated in his book (Rana, 1935) that the 1934 mega-earthquake claimed 8,591 lives in total with 4,296 in Kathmandu valley, and destroyed 56,231 structures, including 492 temples and schools. A Richter magnitude 6.6 earthquake in August 1988 was another earthquake that devastated the eastern part of Nepal, having its epicenter in Udayapur. This earthquake claimed 721 lives in eastern Nepal, along with injuries to 6,213 people. A total of 14,965 dwellings were completely destroyed, most of which were constructed with mud-stone or clay brick masonry (Sato et al., 1989).
The Gorkha earthquake that struck on April 25 at 11:56 a.m. (NST) had an epicenter in Barpak, Gorkha. It ruptured to the east of the epicenter for a length of about 100 km at a strike angle of 295° (USGS, 2015). The size of this earthquake is 7.8 in moment magnitude and is 7.6 in local magnitude, as measured by Nepal’s seismological center (NSC). The recent Gorkha earthquake claimed a total of 8,857 lives (as of August 8) (Government of Nepal, 2015). The greatest death toll was in the Sindhupalchok district, in the eastern part of Nepal, near to the estimated end point of the rupture. In this region, a total of 3,532 people lost their lives, whereas just 1,573 were seriously injured due to the quake. Most of the structures in this district are stone masonry buildings with mud mortar, reinforced with concrete frame structures exist only in few small towns (Central Bureau of Statistics, 2012). The district with the next highest death toll was the capital, Kathmandu, where 1,226 deaths were recorded, along with injuries to 7,952 people. Considering the three districts in the Kathmandu valley, the total death toll rises to 1,739, significantly more than that in Gorkha, the district where the epicenter was located, where the death toll was 449.
The death toll was affected by the timing of event, as it happened at noon when most of people in the hardest hit areas were out of their houses at work in the fields. Another factor that lowered the death toll and damage was the low-frequency dominant component of ground motion. The main shock of the earthquake had dominant frequencies of roughly 0.23, 0.23, and 0.27 Hz corresponding to the East-West (EW), North-South (NS), and Up-Down (UD) components recorded in Kathmandu. Recorded ground acceleration of the Gorkha earthquake in Kathmandu shows the peak value of <200 cm/s2, where probabilistic seismic hazard analysis of Nepal suggested that PGA is around 100 cm/s2 considering return period of 98 years and 450 cm/s2 for return period of 475 years in soft soil areas (Parajuli et al., 2008). In this study, we analyze the characteristics of ground motions for nine earthquake events, including the “main shock.” Ground motion data recorded by the USGS in Kathmandu (station code KATNP) have been downloaded from the strong motion archive (CESMD, 2015). Nepal has a total population of nearly 26.5 million, with about 17% of the people in urban areas and the rest in rural areas. Almost half of the population of Nepal lives in the relatively flat Terai region, with hilly areas retaining 43% of the population, and only 7% in the mountainous region. Building structure types used throughout Nepal are shown in Figure 1; most of the structures are of stone/brick masonry with mud mortar (SBMM); in the Terai region, stone/brick masonry with cement mortar (SBCM) is also common. Reinforced cement concrete (RCC) structures have only a small share, whereas wooden frame structures (WFS) are widely used in the Terai region. Structural types that cannot be characterized as above are specified as other (OTH), along with structures not specified (NS) during data collection.
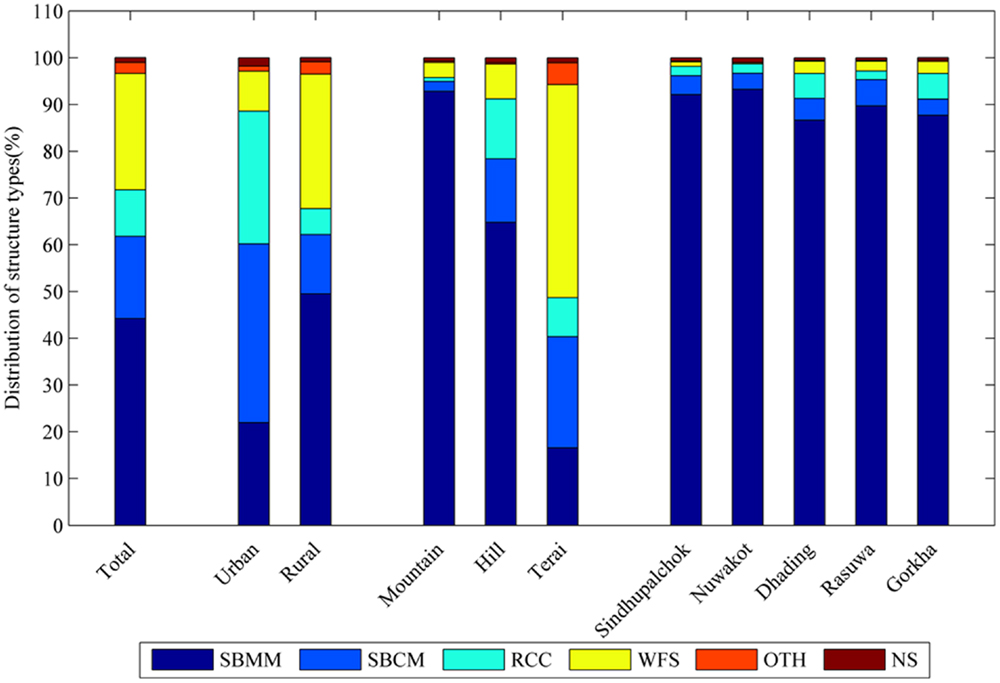
Figure 1. Structure type distribution in Nepal and major affected districts (data source: CBS, Nepal).
The structures built to provide shelter for half the populations of the country in the hilly and mountainous region are mostly of stone masonry with mud mortar. Specifically, SBMM constructions account for 50% of buildings in hilly regions and 47% of buildings in mountainous regions. The use of SBMM for outer wall construction in rural areas is nearly 83%. In mountainous and hilly areas, 93 and 65% use SBMM for foundation, and 89 and 62% use SBMM for the outer walls, respectively. Outside the Kathmandu valley, with 19.63% of the fatalities, the death toll is much higher in mountainous and hilly areas, such as Sindhupalchok, Nuwakot, Dhading, Rasuwa, and Gorkha with 3,532, 1,109, 679, 660, and 449 deaths, respectively, and accounting for 73% of the total (Government of Nepal, 2015). A map of these five districts and the Kathmandu valley with locations of epicenter of the main shock and aftershocks are shown in Figure 2. The Gorkha earthquake most greatly affected areas with a greater share of SBMM constructions. Sindhupalchok district (92% of buildings), Nuwakot (93%), Dhading (87%), Rasuwa (90%), and Gorkha (88%) are all dominated by structures with such foundation. In those five districts, 90% of structures were built with mud mortar (Central Bureau of Statistics, 2012). In hilly areas, stone is commonly locally available, so more of the structures are built with it. Studying the damage patterns for such structures, and developing corresponding countermeasures for those, has to be in focus to increase the resiliency of such structures in rural areas.
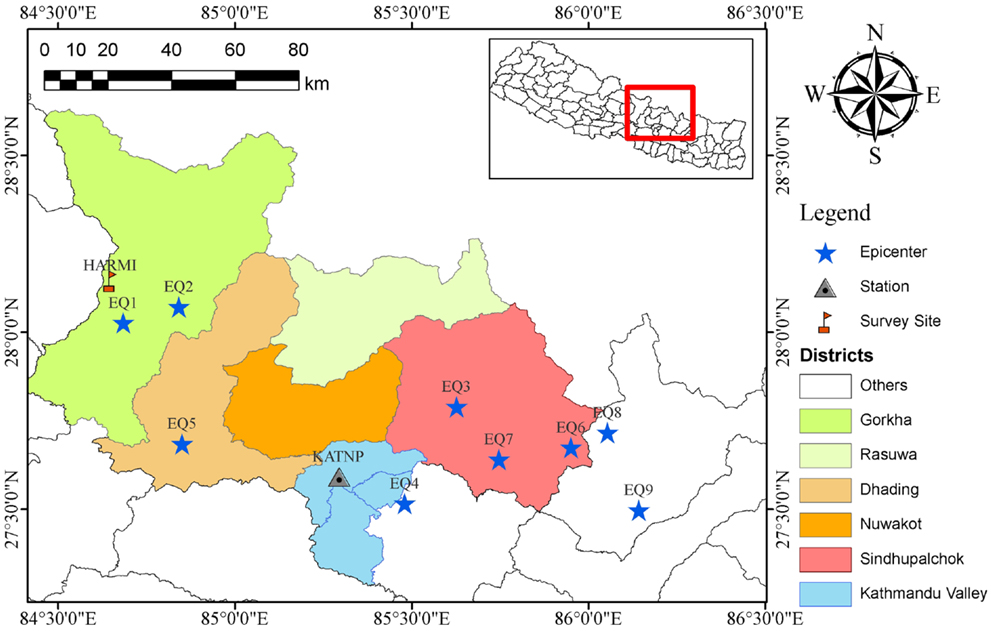
Figure 2. Location of earthquake epicenters, damage survey location and major affected districts.
Some damage surveys have been already conducted since the Gorkha earthquake. Goda et al. (2015) revealed that the damage scenario is not widespread, but localized in the Kathmandu valley. The damage assessments in the small towns of Melamchi, Trishuli, and Baluwa found that majority of stone and brick masonry buildings were severely damaged. We conducted a detailed damage survey in Harmi, a rural village in the Gorkha district, where all of the structures are made of stone masonry with mud mortar.
Local building materials in rural Nepal are spatially variable, even within a few kilometers. However, the general construction methods in rural Nepal consist of a foundation of stone masonry with mud mortar that rises up to a ridge supporting the outer walls. Timber columns and beams are commonly used to support extended roofs and slabs as intermediate support. The material properties of such structures are not commonly studied, so we have undertaken field pullout tests to assess the strength of mortar. Similarly, Schmidt hammer tests have also been used for stone masonry structures and brick masonry structures, even though they are not well defined for use with stone masonry. In comparison to typical buildings in the region, historical monuments usually have special types of materials used in construction; mostly they consist of special brick masonry in three layers (inner, outer, and infill layers) with mud (Ranjitkar, 2000), and occasionally with lime-surkhi mortar. We have also tested the strength of such walls in the Gorkha palace using the Schmidt hammer.
Ground Motion Characteristics
Nepal does not have a dense network of accelerometers; however, the USGS has established a station (KATNP) that records earthquakes in the capital, Kathmandu, and data from that station are analyzed in this paper. In total, nine independent datasets available from strongmotioncenter.org are analyzed and discussed here.
Table 1 presents detailed information regarding trigger dates and times, moment magnitudes, the locations of epicenters, and the epicentral distances from the recording station KATNP (27.7120°N, 85.3155°E). Earthquakes are numbered 1–9, with EQ1 representing the main shock, and EQ8 the major aftershock to the east of the fault plane. Earthquake events range from moment magnitude 5.2–7.8, with epicentral distances as far as 83.90 km and as near as 18.5 km.
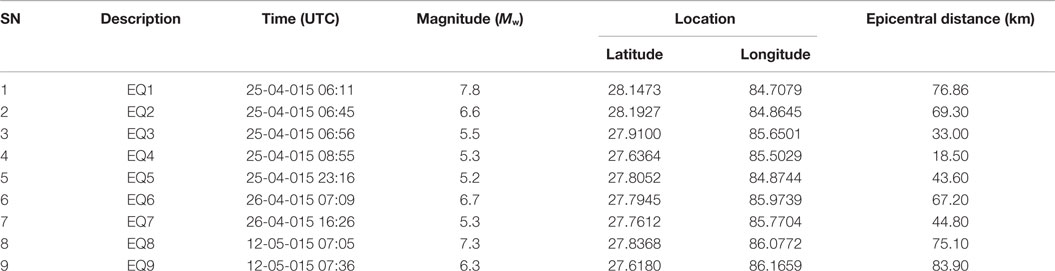
Table 1. Earthquake data.
The spatial distribution of the earthquakes extends to the east and west of the recording station, which help evaluate the effect of directivity of the seismic waves. Figure 2 shows the location of the earthquakes relative to the recording station (KATNP) in Kathmandu and the damage survey site Harmi. Data are sampled at an interval of 0.005 s, and the length of recorded data varies for each event. For analysis, we have chosen a record length of 81.92 s (16,384 samples). This data selection of 214 samples facilitates using fast Fourier transforms, which require a power of 2 for calculation. Records that are shorter than the required length were extended with null values for the remaining duration.
Ground motion, Fourier spectra and response spectra of the EW components of all earthquake events are shown in Figure 3, respectively, from left to right. All of the events are stacked into a single figure where base line accelerations for EQ1, EQ2, EQ3, EQ4, EQ5, E6, EQ7, EQ8, and EQ9 are 0, 300, 400, 500, 600, 700, 800, 900, and 1000 cm/s2, respectively, as shown by dotted lines in the figure. The main shock of the Gorkha earthquake had an epicentral distance of 76.86 km NW from KATNP; maximum recorded accelerations were 155, 162, and 184 cm/s2 for the EW, NS, and UD components, respectively. Fourier transforms to the frequency domain showed that all three components were dominated by low frequencies. Figure 3 clearly shows that the dominant frequencies of large aftershocks (EQ2, EQ6, and EQ8) are low: even the small ones are in a higher range. In contrast to the Fourier spectra, spectral accelerations (Figure 3) show aftershock ground motions that are greater and in a higher frequency range, even though the main shock has a higher value over a lower range of frequencies (0.22 Hz).
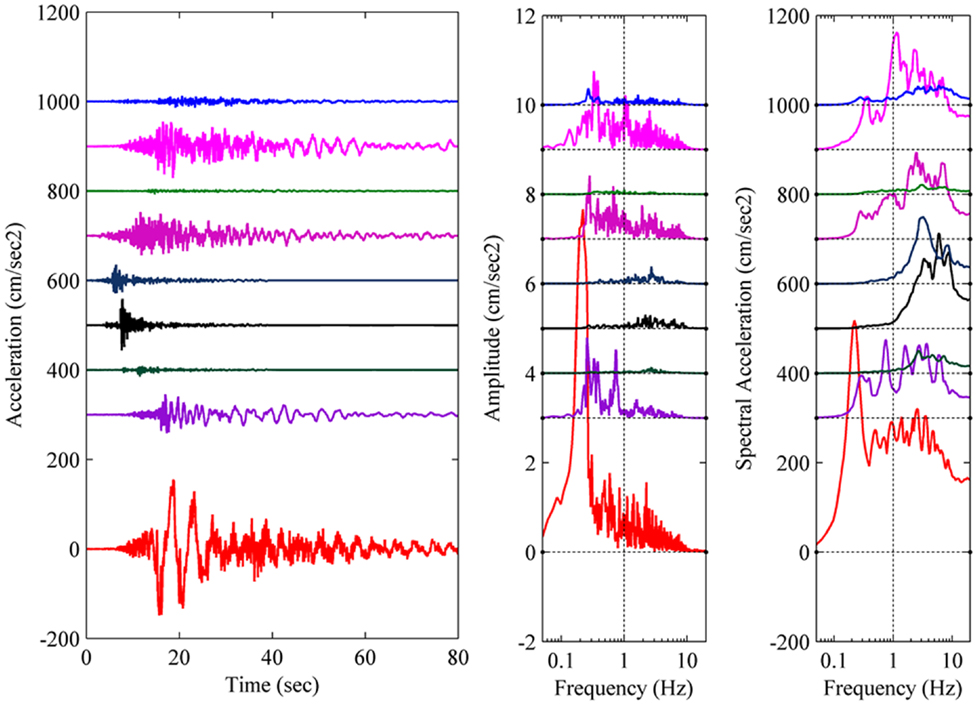
Figure 3. Ground motions recorded in KATNP and corresponding Fourier and response spectra.
Figure 4 shows the dominant frequencies of all earthquakes in all three directions. In four of the events [EQ1 (M7.8), EQ2 (M6.6) EQ6 (M6.7), and EQ8 (M7.3)], all of the components are dominated by low frequencies ≤1 Hz. Three of the events [EQ3 (M5.5), EQ4 (M5.3), and EQ5 (M5.2)] have dominant frequencies in all three components ≥1 Hz. EQ7 (M5.3) is low-frequency dominant in the EW and NS components, while the UD component had a slightly higher value of 1.26 Hz. The final event, EQ9 (M6.3), has variable frequency content, with peak Fourier amplitudes for the EW component at 0.28 Hz, the NS component at 2.43 Hz, and the UD component at 1.17 Hz.
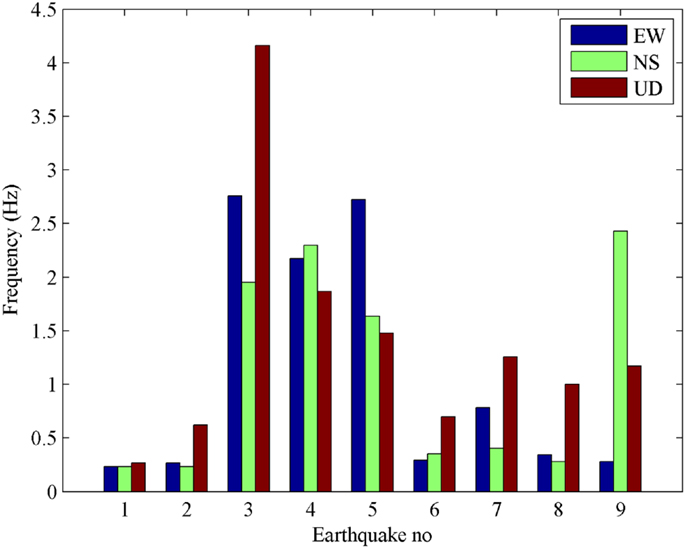
Figure 4. Dominant frequencies in three components for all earthquakes.
The response of a structure to earthquake ground motion with a single degree of freedom is represented by response spectra for various natural frequency ranges for the structure. A damping ratio of 5% is assumed in the calculation of response spectra. Figure 5 shows the tripartite plot of pseudo velocity spectra (centimeter per second) with axes for displacement (centimeter) and pseudo acceleration (square centimeter). Four earthquake events (EQ1, EQ2, EQ6, and EQ8) exceeded a velocity of 10 cm/s with peak values in range of 0.2–0.5 Hz. Despite EQ1, the main shock, other earthquake events had a small peak in the higher frequency range of 0.8–3 Hz but the main shock surges only at a lower frequency range with crossing value of 100 cm/s in range of 0.08–0.2 Hz. EQ9 also has the same trend as the other three stated above, but the value peaks at slightly <10 cm/s. Apart from EQ3, EQ7, and EQ8, the other events crossed the spectral acceleration value of 100 cm/s2 in the range of 2.5–10 Hz; EQ4 and EQ5 have a peak value only in this range.
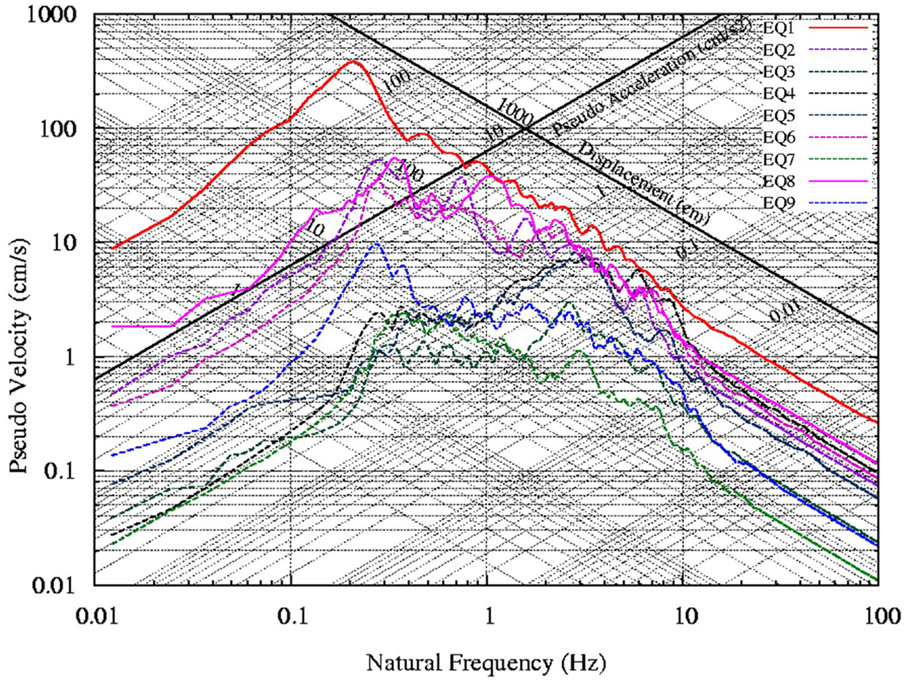
Figure 5. Combined velocity, displacement, and acceleration response spectra of the earthquakes.
The response acceleration of the Gorkha earthquake (EQ1) has an almost flat shape in the range of 0.3–10 Hz. Maximum displacement during the main shock was nearly 300 cm for the structure with a frequency of nearly 0.25 Hz at a velocity of 380 cm/s and 500 cm/s2 as acceleration. The phenomenon of such spectral parameters will be discussed briefly later in the discussion.
The characteristics of ground motion have an impact on damage scenarios all over the affected area. Low-rise masonry and reinforced concrete buildings in the Kathmandu valley have high natural frequency. Super high-rise, base isolated buildings could have suffered severe damage if they had been built in the affected area. The natural frequencies of various structures are shown in Figure 6. Damage of any structure during earthquake directly relates to the strength itself and the amount of earthquake force that pushed it. Strength of the structures relies on materials used and the technique of construction. We found that in most affected areas, people live in stone masonry buildings with mud mortar, which is vulnerable for lateral loads. Even though earthquake ground motion records outside the Kathmandu valley are unavailable, we attempt to evaluate damage scenarios in rural areas. Most of the structures are two stories and some are three stories. The natural frequency of such structures is not so low to resonate with earthquake ground motion frequency.
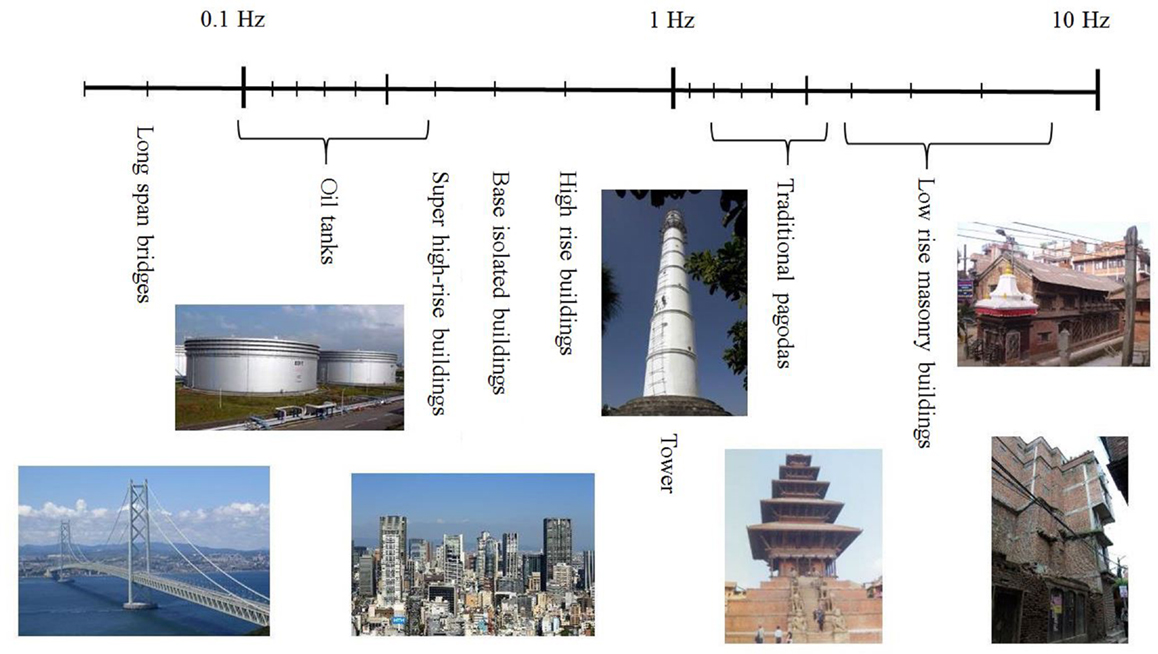
Figure 6. Natural frequency of various structures.
Damage Survey
Most settlements in the mountainous region of Nepal are in rural areas that are dominated by shelters constructed with stone masonry. Brick masonry structures and reinforced concrete structures are found in a few areas, mainly newly developed towns and areas accessible by road. The epicenter of the earthquake was in Barpak, Gorkha, which is a rural mountainous area where all of the structures are stone masonry with mud mortar with an exception of a few reinforced concrete buildings.
We chose a cluster of 149 structures in Harmi, Gorkha. The location is 165 km from Kathmandu by road. It is reached by following the Prithvi highway to the west up to Dumre, then along the Dumre–Beshisahar–Chame highway to Turture, and from there along the Turture–Palungtar road to Harmi. This area is about 17 km SW of the epicenter of the main shock. The topography of the area was selected as it starts from the ridge of a mountain, at an altitude of 1162 m extending down to 600 m at the bottom of a hill (Figure 7). We found that the damage scenario in these rural areas was localized with topography, so we plotted the locations of surveyed structures on a contour map of the area. To construct the contours, we used a free-source digital elevation model (Aster Gdem, 2009), with an accuracy of 30 m. Image tile “N28E084” was used as a base and the data were extracted for the study area. Contour lines were drawn at interval of 20 m. The north facing slope of the study area has a small local ridge at a level between 880 and 960 m. Another main ridge of that hill is found above 1160 m.
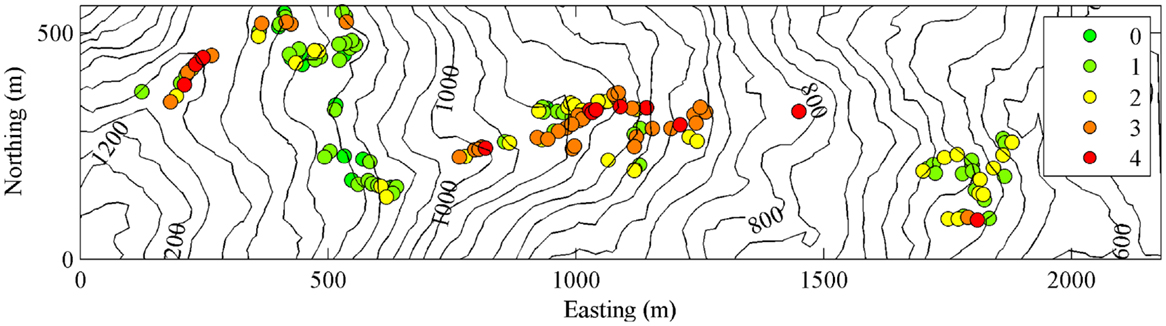
Figure 7. Topographic map of the study area showing structural damage grade.
The structures were categorized into three groups by size, where all of the structures are of stone masonry with mud mortar; a few of them have cement pointing on their outer faces. Large-sized structures (L) are of two to four stories and are larger in plinth area (around 75 m2). Medium-sized structures (M) are single or double storied, having plinth area in the range of 45–75 m2. The rest of the structures fall under the small (S) category. The damage grades used in the study lie in the range from 0 and 5, where 0 denotes no damage and 5 represents totally collapsed in all sides. A damage grade of 4 represents severely damaged structures where only cracked ground floor walls still stand, and the roof and upper floors have been brought down to the ground. Structures with severe damage but with building shape preserved, albeit with major cracks in the walls or partial collapses, are categorized as grade 3. These structures are accessible with special precautions taken. Structures having a few major cracks in walls, but accessible even though they are not habitable without intensive maintenance work, fall under grade 2. The structural category for grade 1 corresponds to excessive minor cracks throughout the walls; these structures are habitable with little maintenance work. Intact structures with no damage or only a few minor cracks, which are habitable with little or no maintenance work required, are categorized in grade 0.
In the study cluster, there are 149 structures consisting of 58 large, 68 medium, and 23 small-sized buildings with 39, 46, and 15% of weightage, respectively. Damage grade and location were recorded using GPS at the site. Figure 7 shows the damaged structures on a topographic map. Green colored dots represent grade 0 structures, whereas red dots represent the location of grade 4 structures (as we do not have any grade 5 structures). Figure 8 shows the damage grade of structures with percentages of structures that include categories of structure sizes. We found that 8% of the structures had a damage grade of 0; 38% were in grade 1; and grade 2 and grade 3 structures were 24% each. The remaining 6% of the structures were damaged severely, at grade 4.
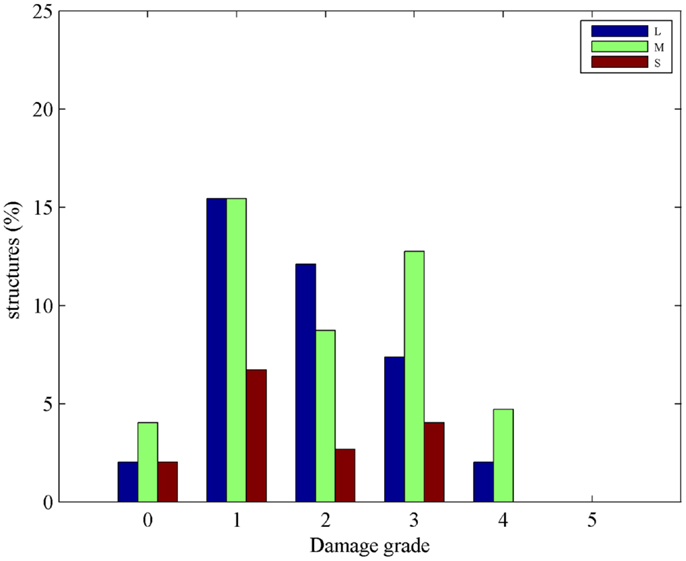
Figure 8. Damage distribution for all structures.
Here, we can see most of the structures fall under damage grades 1, 2, and 3, with less coming from grades 0 and 4. From the survey, we found that most of the buildings on ridge lines suffered heavy damage but those on side-slopes were not damaged as much. The study area comprises an area that includes a mountain ridge along with a local ridge line formed on the middle of the slope. Hence, we categorized the structures as ridge-line structures, those that are located on the ridge line. There are a total of 52 structures located on the ridge line, including the main and local ridge lines. Damage grade details of the structures on the ridge line are shown in Figure 9. There are no structures that fall under grade 0; in fact only 15% of the structures graded as 1 with 19% in grade 2. More than half of the structures, i.e., 52%, were grade 3 and the remaining 14% fell under grade 4. A small structure that was graded as 3 on the ridge line is shown in Image S1 in Supplementary Material.
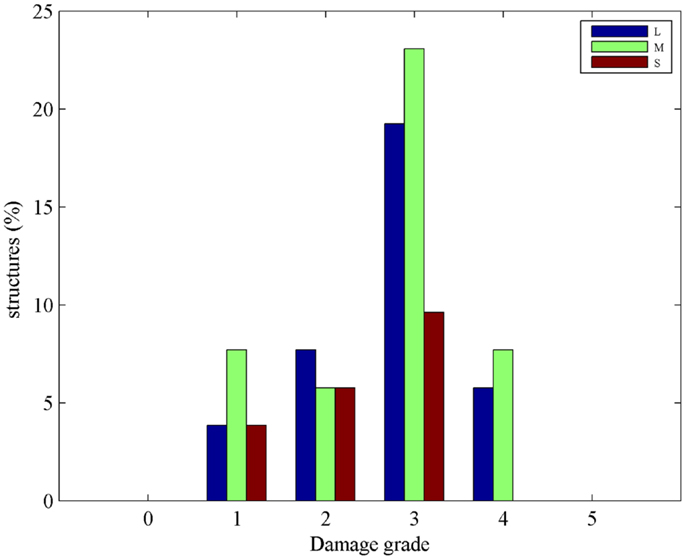
Figure 9. Damage distribution for structures on ridge lines.
The failure mechanisms of structures constructed with stone masonry with mud mortar are mainly seen in two categories. Delamination of the wall is the major failure mechanism and shear failure is secondary. The methods for constructing stone masonry with mud mortar are based around building two wall layers: an inner and an outer; however, this layered single wall can be a main cause for delamination. Bonding of the inner and outer walls does not exist, which causes the wall to act as two independent walls during an earthquake, thereby causing severe damage. There are many structures with vertical cracks appearing in association with the shear failure of the wall. Structures with horizontal bands of chiseled stone have a few cracks compared to those without the horizontal bans.
Field Test
Pullout Test to Assess Bonding Strength of Mud Mortar
Materials used in local constructions are not of any specific standard. Most of the stone masonry structures in rural Nepal are constructed using local stone and mud. The properties of such materials are not well known. After the Bam earthquake in Iran, adobe and masonry structures were investigated to further characterize the bonding strength of mortar (Kiyono and Kalantari, 2004). We have done similar simple field tests here to determine material properties.
We conducted pullout tests in the field to determine the bonding strength of stone and mud mortar joints. Damaged buildings were chosen for sampling, selecting the most undisturbed sample from the remaining parts of a structure. Sample stone was carefully freed on three sides so that only the bottom remained bonded with mud mortar. A simple weighting gage and a rope to connect with sample and weighing gage were used in test. Weighing gage consisted of the spring type gage that shows the pulling force in kilogram, which can be adjusted in some range to make it 0. Weighing gage was tightened with a rope that bound the stone from the sides. We set the force applied during the stretching of rope to 0 from adjustable screw. Force was applied gradually to pull the stone out and the reading in the weighing gage (S) was recorded. After pulling out the stone, we measured the mortar joint area (A) that exactly bonded with the stone, ignoring voids at the joint surface. The weight of the sample stone (W) was also measured to facilitate the calculation of the normal stress acting on this surface.
Three samples were taken to calculate normal stress (σ = W/A) and shear stress (τ = S/A) (shown in Table 2). Equation 1 shows the theoretical relationship of shear and normal stress with bonding stress (c) and coefficient of friction (μ), considering the equilibrium of forces in the horizontal direction.
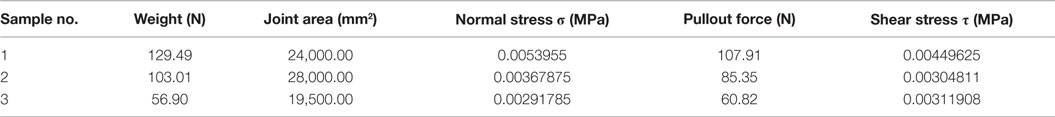
Table 2. Pullout test for bonding strength.
In fitting the data from the test result, we found the value of cohesive strength (c) and coefficient of friction (μ) of stone masonry with mud mortar joints to be 0.001137 MPa, and 0.6, respectively.
Samples of the test are not enough to conclude the material strength; hence, we compare these values with the test results from the 2003 Iran Bam earthquake damage survey (Kiyono and Kalantari, 2004). Results of the test conducted in Iran and Nepal are shown in Figure 10. In Iran, tests were conducted for sun-dried and baked brick masonry structures, where the shear strengths of mortar bonding were estimated to be 0.0029 and 0.0097 MPa, respectively. The frictional coefficient for the joint was found to be 0.62 and 0.54, respectively, for sun dried and baked brick masonry. Test results from Nepal show that the frictional coefficient lies between the values of sun-dried and baked masonry structures in Iran, but shear bonding strength is much lower than that of both brick masonry structures.
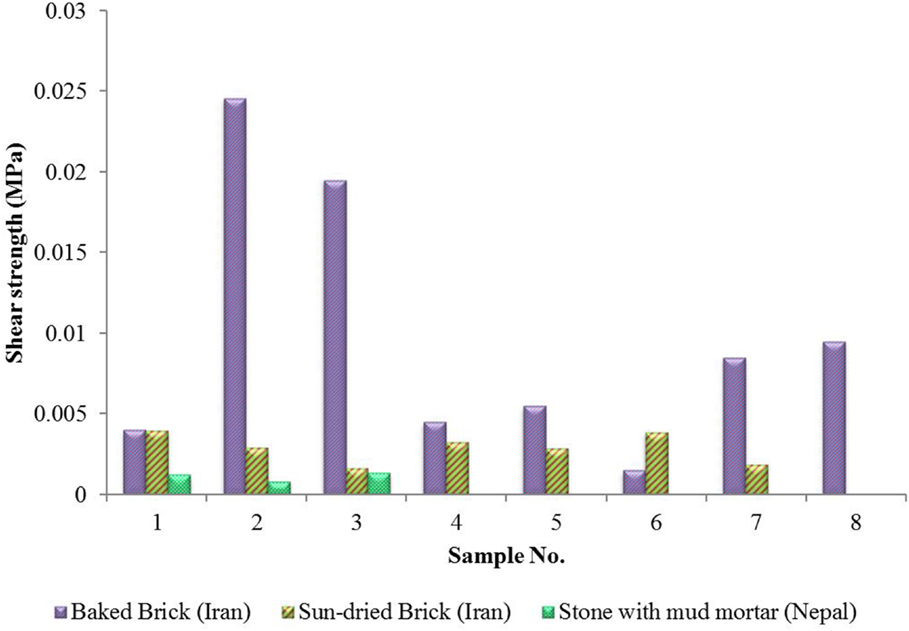
Figure 10. Comparison of the shear strength of stone masonry with mud mortar joint in Nepal with shear strength of brick masonry wall joints in Bam, Iran.
Schmidt Hammer Test
A non-destructive test device, the Schmidt hammer, is often used to determine the surface hardness and penetration resistance of concrete or rock. Even though the device is designed for concrete structures, we have successfully used it for stone and brick masonry structures. To use a Schmidt hammer for stone and brick masonry structures, we must assume that the masonry components themselves stand as uniform blocks with mortar forming the matrix between hard elements. Rebounds of a hammer depend on the strength of the mortar too and, therefore, represent the overall strength of the masonry structure. There are some drawbacks in this assumption, but we anticipate that these measurements might be used as a reference for future studies. We conducted the test at several points on the surface of the structure, with a minimum distance between test points set to 30 mm. Conversion of rebound numbers to the probable strength of the structure is done using a chart based on the pressure resistance on a 15 cm cube of concrete, as provided by the manufacturer (Proceq, 2006). Categorically, we discuss three types of structures, i.e., stone masonry, brick masonry with mud mortar, and historical monument structure.
Stone Masonry with Mud Mortar
Stone masonry structures were tested at two sites in Harmi, Gorkha. One was a large structure constructed 38 years ago that had collapsed up to the first floor, but with intact ground floor walls (Image S3 in Supplementary Material). The other one was a small structure. In the large structure, we conducted the test at 26 points where we found large variations in rebound numbers. Some locations in joint areas could not show the data (i.e., they were below the lowest range value for hammer 10) and in some locations there were relatively large stone blocks that caused high rebound values and led to an overestimation of strength. Hence, we disregard data below the lower range and above rebound number 30; which corresponds to 26 MPa. A total of four data points from each of the lower and higher ranges were omitted and the remaining 18 data were taken into consideration to calculate the strength. Average rebound numbers range between 15 and 30 with an average of 21.47 and a standard deviation of 4.4. From the conversion chart, we found that the compressive strength of stone masonry is 12.0 MPa.
Similarly, we conducted the test on a small structure where a total of eight points were sampled. This structure was built only two and half years ago. In this structure, we did not find lower values, as there was a band of relatively large stone blocks. Ignoring two points having rebound number values >30, the remaining six data points had an average of 21.5 and a standard deviation of 5.12. Using the conversion chart, the probable strength of the stone masonry with mud mortar was found to be 12.75 MPa. From these two tests of stone masonry with mud mortar structures, the probable compressive strength was determined to be 12.38 MPa, roughly the average of the sampled structures.
Brick Masonry with Mud Mortar
Brick masonry with mud mortar structures are common in newly developed towns and cities in Nepal. For testing, we chose a small two-story building that had some cracks in the walls due to the earthquake. This structure is located in Palungtar municipality, Gorkha. The load-bearing main wall of the structure had dimensions of 3750 mm × 5700 mm with a thickness of 350 mm and a height of 3900 mm. Four sampling points were selected in the short wall side of the structure, maintaining 35 mm for the edge distance. As the walls of the structure were cracked, we can make measurements in just four locations. Rebound numbers recorded in those points are 22, 27, 25, and 28. Hence, the average rebound value is 25.5 with a SD of 2.65, corresponding to a probable compressive strength of 18.75 MPa.
Historical Brick Masonry Structure with Mud Mortar
We chose the historical monument of the Gorkha durbar for structural testing (Image S4 in Supplementary Material). This structure was originally built in AD 1640 and was made of brick masonry and timber. This monument stands on a ridge of the same hill that hosts the Gorkha bazar on its southern slope. The structure experienced severe damage during the main earthquake at an epicentral distance of 27 km. The Gorkha durbar is a three-story building with a tile roof. We selected sampling points on the ground floor wall along two basal lines: one 380 mm from plinth level and another 350 mm above the first. Horizontal pitches of the sampling points were taken at 500 mm. A total of 42 blows were made on the wall, with the highest and lowest rebound numbers being 50 and 11, respectively. During the test we found, in some places, a brick element that was not intact and caused lower rebound values. Hence, we neglect such sampling points during the calculations. By not using two sampling points, we end up with 40 samples to evaluate the strength of the masonry wall in the historical structure. Rebound numbers ranged from 20 to 50, with an average of 32.4 and a SD of 6.92. From the conversion chart, the corresponding probable compressive strength of the wall is 29.5 MPa.
Discussion
The earthquake ground motion observed during the Gorkha earthquake was dissimilar from previous earthquakes in the region. Many researchers expect that the triggering of such an earthquake would damage lots of structures in Kathmandu and claim tens of thousands of lives (Dixit et al., 2000; Wyss, 2005), which overestimates the actual toll by at least an order of magnitude. One of the main reasons behind less damage is that the low-frequency ground motion reduced vulnerability in high-frequency structures. Most residential housing in the affected area does not have a natural frequency low enough to be in resonance with the ground motion recorded in Kathmandu.
The characteristics of ground motion alone, as recorded in KATNP, cannot adequately define the phenomena of such acceleration time history. The likelihood of amplification of the low-frequency component by soil strata is high, but is this the only reason for slow ground motions in Kathmandu? People who were surveyed in Gorkha concerning the shaking pattern and described the scene as buildings moving to and fro and trees behaving like swings. Considering these observations, we can argue that the source of the earthquake had an effective rupture mechanism that radiated low-frequency dominant ground motions. This was not only so for the main shock but also for the aftershocks, which had similar low-frequency component characteristics recorded at KATNP. This supports the evidence for low-frequency amplifying behavior in the soils of the Kathmandu basin. We should also consider the non-linearity of soil behavior; excitations with higher acceleration cause soil layers to act as filters for the high-frequency components while amplifying low frequencies with the resonance effect. Epicentral distance also has a key role in components of frequency range; events with spectra with higher frequencies correspond to nearer events, and those having low frequencies are generally distant events. Smaller events of less than moment magnitude 6 have higher frequency dominant acceleration, including the M6.3 event EQ9 aftershock on 12 May, which had high-frequency dominance. The dominant frequencies of all components for all earthquake events are shown in Figure 11, as related to epicentral distance and moment magnitude. These data recorded with high-frequency dominance focus the issues back on the characteristics of the source of earthquake mechanism not only in the local site condition that are responsible for the generation of ground motion events with different dominant frequencies.
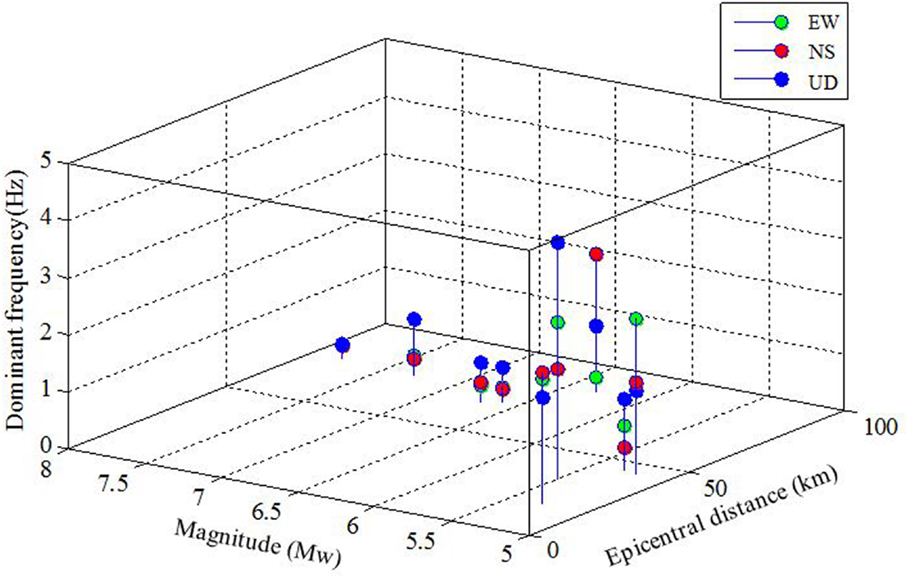
Figure 11. Distribution of dominant frequencies for all earthquakes, all components over a given magnitude and epicentral distance.
In hilly areas, where most of the structures are built of stone masonry with mud mortar, damage along ridge lines is particularly notable. Structures located on slopes, with foundations lying over some layers of soil, generally had very low levels of damage even at short epicentral distances. The conventional thought of building safe houses on ridge lines, over hard rock foundations now becomes suspect. Local site effects of ground motion tended to amplify high-frequency components along ridge lines where bedrock is shallower. Previously, we showed a figure of a damage scenario in Figure 9. Now, considering the ratio of total structures to ridge structures, damage scenarios of higher grades are mostly concentrated along ridges. Table 3 shows the percentage of structures damaged on a ridge line in the study area.
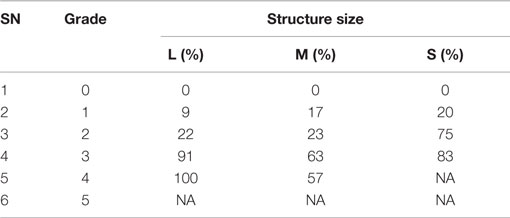
Table 3. Percentage of ridge-line structures damaged.
Large structures on ridge lines constituted 100% of the grade 4 damage. Damage at a grade 3 level also has a higher contribution from ridge-line structures. There are few structures having damage at grade 2 or even grade 1 level that exist due to special attention during construction. Horizontal bands of chiseled stone were used for a more esthetic appearance and also had external cement pointing on the walls.
During the 2011 Mw6.9 Nepal–Sikkim earthquake damage in stone masonry structures was reported widely, where delamination of walls is the major failure pattern (Shakya et al., 2013). They mentioned about the severe damages in Taplejung, Ilam, and Panchthar districts of Nepal, up to about 90 km (distance to Ilam bazar) as epicentral distance. We have similar topography in mountainous area so we can compare the scenario in eastern part (affected by the Nepal–Sikkim earthquake) and mid and western part (affected by the Gorkha earthquake). Spreading of damage due to Gorkha earthquake is not that high as compared to that of the smaller Nepal–Sikkim earthquake.
The pullout test conducted in damaged structures to find out the joint properties. Here, we compare the data with the test conducted in Iran after the Bam earthquake where the test was done similarly on the damaged structures. Shear strength of the joint from the test is very low that can be neglected for the modeling but frictional coefficient of mortar joint found significant.
The Schmidt hammer test for stone masonry with mud mortar was performed on walls of two, large and small structures having damage grade of 4 and 3, respectively. The wall itself in the area of hammer blow was intact (only with some minor cracks), which reflected on low bouncing values. We had neglected such values during the analysis; hence, we can generalize the result for all cases. The structure built up of brick masonry with mud mortar had some cracks in other sides but tested wall was intact during the time of test. The historical Gorkha durbar had also suffered from some damages on other sides but the front wall, where test was conducted had minor cracks with loosening of cladding bricks, which also appeared in result that we excluded for analysis. Hence, all the test results are not affected significantly by damage state of the structure.
Material properties for old masonry structures in Kathmandu studied previously (Parajuli et al., 2011) proposed the compressive strength of brick to be 11 MPa, where the same for mortar and wall are 1.6 and 1.8 MPa, respectively. Results from our tests in comparison with the previous study are almost ten times higher for wall strength. If we consider only the brick element, the resulting value from this test is almost 50% more than those experiments conducted previously. Brick quality for the experiment used in tested structures is different; hence, the results we obtained are able to take into account the compressive strength of stone and brick element itself rather than the integrated wall with mortar.
Conclusion
The ground motion characteristics of the Gorkha earthquake seem unique. The reasons for such characteristics require high priority research in the field of seismology. Source mechanisms, directivity, wave paths, and local site conditions should be investigated intensively. The western part of Nepal has a large seismic gap. Earthquakes with the same or even stronger shaking may occur in near future. The Gorkha earthquake had low-frequency ground motion with accelerations of <200 cm/s2, but the velocity was relatively high which caused damage. One of the reasons behind the collapse of many historical structures, including Dharahara, a tower structure monument, in comparison with general buildings, is likely to be lower frequency dominant ground motion. We should consider the epicentral distance and rupture line during the interpretation of ground motion frequency components.
Rural areas in Nepal have a large stock of stone masonry structures used for shelter and other purposes. These need to be reinforced using locally available materials to make them more resilient. Ridge structures are at a higher risk of earthquake damage relative to structures on slopes. Local construction methods should be improved technically, by providing longitudinal and transverse bonding during construction.
The study of material properties used locally should be advanced in order to analyze the structural behaviors of various materials during an earthquake. Even though accuracy could not be assured for the Schmidt hammer tests (designed for reinforced concrete), we have shown test results that provide a probable strength for the stone/brick masonry structures. Stone used in masonry with mud mortar has a probable compressive strength of 12.38 MPa, where local bricks used in masonry with mud mortar have at strength of 18.75 MPa and bricks used in masonry with mud mortar for historical structures are at 29.5 MPa. Note that these results are based only on the surface hardness; masonry structures are not as homogeneous as concrete structures. Also the strength of the mortar is not well represented in such tests, even though loosening and degradation of mortar result in a drop in rebound number. Hence, these values should be used with caution. The bonding strength of stone masonry with mud mortar was investigated using a pullout test on site, which results in a cohesive strength of mud mortar of 0.001137 MPa, with a coefficient of friction of 0.6. Therefore, to study stone masonry with mud mortar, we can use mortar strength combined with the compressive strength of the stone.
Conflict of Interest Statement
The authors declare that the research was conducted in the absence of any commercial or financial relationships that could be construed as a potential conflict of interest.
Acknowledgments
The authors thank Prof. Masakatsu Miyazima, Prof. Prem Nath Maskey, and Dr. Hari Ram Parajuli for providing insight and expertise. We are grateful to the inhabitants of Harmi, Gorkha for their kind support and cooperation during the damage survey in Nepal. We also show our gratitude to the USGS, http://www.strongmotioncenter.org/, for sharing data with us, and we thank the reviewers for their insight.
Funding
A part of the research was conducted under the support by JST J-RAPID program and JSPS KAKENHI Grant Number 26249067.
Supplementary Material
The Supplementary Material for this article can be found online at http://journal.frontiersin.org/article/10.3389/fbuil.2015.00023
Image S1. Small size structure failure with damage grade 3.
Image S2. Pullout test for bonding strength.
Image S3. Schmidt hammer test points (stone masonry).
Image S4. Schmidt hammer test on the Gorkha durbar.
References
Aster Gdem. (2009). Database – Aster Gdem. Available at: http://gdem.ersdac.jspacesystems.or.jp/
BECA World International (New Zealand), SILT Consultants Pvt. Ltd. (Nepal), TAEC Consult Pvt. Ltd. (Nepal), Golder Associates (Canada), Urban Regional Research (USA). (1993). Seismic Hazard Mapping and Risk Assessment for Nepal. UNDP/HMGN/UNCHS (Habitat) Subproject NEP/88/054/21.03.
Bilham, R. (1995). Location and magnitude of the 1833 Nepal earthquake and its relation to the rupture zones of contiguous great Himalayan earthquakes. Curr. Sci. 69, 155–187.
Central Bureau of Statistics. (2012). National Population and Housing Census 2011 (National Report) Government of Nepal. Vol. 01. Kathmandu: Government of Nepal.
CESMD. (2015). Internet Data Reports for Earthquakes of 2015. Available at: http://strongmotioncenter.org/
Dixit, A. M., Dwelley-Samant, L. R., Nakami, M., and Pradhanang, S. B. (2000). “The Kathmandu valley earthquake risk management project,” in 12th World Conference on Earthquake Engineering. (New Zealand: 12th WCEE held in Auckland), 1–8.
Goda, K., Kiyota, T., Pokhrel, R. M., Chiaro, G., Katagiri, T., Sharma, K., et al. (2015). The 2015 Gorkha Nepal earthquake: Insights from earthquake damage survey. Front. Built Environ. 1:8. doi:10.3389/fbuil.2015.00008
Government of Nepal. (2015). Nepal Disaster Risk Reduction Portal. Available at: http://drrportal.gov.np/
Kiyono, J., and Kalantari, A. (2004). Collapse mechanism of adobe and masonry structures during the 2003 Iran Bam earthquake. Bull. Earthquake Res. Inst. 79, 157–161.
Parajuli, H., Kiyono, J., Ono, Y., and Tsutsumiuchi, T. (2008). Design earthquake ground motions from probabilistic response spectra : case study of Nepal. J. Jpn. Assoc. Earthquake Eng. 8, 16–28. doi:10.5610/jaee.8.4_16
Parajuli, H. R., Kiyono, J., and Taniguchi, H. (2011). “Structural assessment of the Kathmandu world heritage buildings,” in Proceedings of the 31 St Conference on Earthquake Engineering (Tokyo: JSCE), 1–5.
Proceq. (2006). Proceq Concrete Test Hammer Manual. Available at: http://www.proceq.com/fileadmin/documents/proceq/products/Concrete/Original_Schmidt/English/Proceq_Operating_Instructions_Original_Schmidt_E.pdf
Ranjitkar, R. (2000). Seismic Strengthening of the Nepalese Pagoda. Kathmandu: Kathmandu Valley Preservation Trust.
Sato, T., Fujiwara, T., Murakami, H. O., and Kubo, T. (1989). Reconnaissance Report on the 21 August 1988 Earthquake in the Nepal-India Border Region. Research Report on natural disasters. Japanese Group for the study of Natural Disaster science.
Shakya, K., Pant, D. R., Maharjan, M., Bhagat, S., Wijeyewickrema, A. C., and Maskey, P. N. (2013). Lessons learned from performance of buildings during the September 18, 2011 earthquake in Nepal. Asian J. Civ. Eng. 14, 719–733.
USGS. (2015). M7.8 Nepal Earthquake of 25 April 2015. Available at: http://earthquake.usgs.gov/earthquakes/eqarchives/poster/2015/NepalSummary.pdf
Keywords: Gorkha earthquake, ground motion characteristics, damage survey, stone masonry, field test, Schmidt hammer test
Citation: Parajuli RR and Kiyono J (2015) Ground Motion Characteristics of the 2015 Gorkha Earthquake, Survey of Damage to Stone Masonry Structures and Structural Field Tests. Front. Built Environ. 1:23. doi: 10.3389/fbuil.2015.00023
Received: 21 August 2015; Accepted: 04 November 2015;
Published: 18 November 2015
Edited by:
Katsuichiro Goda, University of Bristol, UKReviewed by:
Siau Chen Chian, National University of Singapore, SingaporeRama Mohan Pokhrel, University of Tokyo, Japan
Copyright: © 2015 Parajuli and Kiyono. This is an open-access article distributed under the terms of the Creative Commons Attribution License (CC BY). The use, distribution or reproduction in other forums is permitted, provided the original author(s) or licensor are credited and that the original publication in this journal is cited, in accordance with accepted academic practice. No use, distribution or reproduction is permitted which does not comply with these terms.
*Correspondence: Rishi Ram Parajuli, cGFyYWp1bGkucmFtLjI3ekBzdC5reW90by11LmFjLmpw