 Kotaro Kojima
 Izuru Takewaki
- Department of Architecture and Architectural Engineering, Graduate School of Engineering, Kyoto University, Kyoto, Japan
A dynamic stability criterion for elastic–plastic structures under near-fault ground motions is derived in closed form. A negative post-yield stiffness is treated in order to consider the P-delta effect. The double impulse is used as a substitute of the fling-step near-fault ground motion. Since only the free vibration appears under such double impulse, the energy approach plays a critical role in the derivation of the closed-form solution of a complicated elastic–plastic response of structures with the P-delta effect. It is remarkable that no iteration is needed in the derivation of the closed-form dynamic stability criterion on the critical elastic–plastic response. It is shown via the closed-form expression that several patterns of unstable behaviors exist depending on the ratio of the input level of the double impulse to the structural strength and on the ratio of the negative post-yield stiffness to the initial elastic stiffness. The validity of the proposed dynamic stability criterion is investigated by the numerical response analysis for structures under double impulses with stable or unstable parameters. Furthermore, the reliability of the proposed theory is tested through the comparison with the response analysis to the corresponding one-cycle sinusoidal input as a representative of the fling-step near-fault ground motion. The applicability of the proposed theory to actual recorded pulse-type ground motions is also discussed.
Introduction
The phenomenon of dynamic instability or dynamic collapse is of principal concern in the field of earthquake and structural engineering (Jennings and Husid, 1968; Sun et al., 1973; Tanabashi et al., 1973; Bertero et al., 1978; Takizawa and Jennings, 1980; Bernal, 1987, 1998; Nakajima et al., 1990; Ger et al., 1993; Challa and Hall, 1994; Hall, 1998; Hjelmstad and Williamson, 1998; Uetani and Tagawa, 1998; Araki and Hjelmstad, 2000; Sasani and Bertero, 2000; Ibarra and Krawinkler, 2005; Adam and Jager, 2012). The theoretical investigations from the viewpoint of applied mechanics have also been conducted (Herrmann, 1965; Ishida and Morisako, 1985; Maier and Perego, 1992; Araki and Hjelmstad, 2000; Williamson and Hjelmstad, 2001).
The research on dynamic collapse of structures under earthquake ground motions seems to be initiated theoretically by Jennings and Husid (1968). They focused on a single-degree-of-freedom (SDOF) system with an elastic–plastic spring and suggested that the P-delta effect lengthens the natural period of the structure and the model exhibits an exponentially large displacement approximately at the critical rotation where the coincidence of the resistance and the moment due to gravity force occurs. They also discussed the post-yield slope effect on collapse behaviors. Sun et al. (1973) derived a similar condition by studying the free vibration of the system under an initial impact and demonstrated the stability boundary in terms of initial velocity and displacement. Extension of the SDOF criterion to multi-degree-of-freedom (MDOF) systems has been tried (Takizawa and Jennings, 1980; Nakajima et al., 1990).
Many investigations have also been conducted on dynamic response of elastic–plastic structures using the tangent stiffness as the key for characterizing instability. For SDOF systems, it is well known that, if the tangent stiffness becomes negative in a dynamic process, residual displacements increase. For MDOF systems, it has been shown that a negative eigenvalue of the tangent stiffness matrix leads to either the accumulation of deformation in a particular mode (Uetani and Tagawa, 1998) or the localization of deformation (Maier and Perego, 1992). Bernal (1998) indicated that a negative eigenvalue is a necessary condition of dynamic collapse. However, the existence of only a negative eigenvalue is not sufficient to infer dynamic collapse because the sign of the minimum eigenvalue can recover to be positive due to unloading. Hence, additional conditions that consider unloading are necessary to predict dynamic collapse (Araki and Hjelmstad, 2000).
Dynamic collapse of realistic frame models has been investigated by several authors (Ger et al., 1993; Challa and Hall, 1994; Hall, 1998; Sivaselvan et al., 2009). In these studies, various effects, such as spread of the plastic zone, non-linear material behavior, and/or non-linear geometric effects, were incorporated in the numerical methods.
However, it does not seem that a simple dynamic stability criterion has been proposed even for a rather simple input. In this paper, a simple closed-form dynamic stability criterion is proposed for the first time for the double impulse as a simplification of the near-fault ground motion. It is shown via the closed-form expression that several patterns of unstable behaviors (collapse-process patterns) exist depending on the ratio of the input level of the double impulse to the structural strength and on the ratio of the negative post-yield stiffness to the initial elastic stiffness. The applicability of the proposed method using the double impulse to actual recorded pulse-type ground motions is also investigated.
After Parkfield earthquake in 1966 and San Fernando earthquake in 1971, various aspects of near-fault ground motions have been clarified. At the same time, the effects of near-fault ground motions on structural response have been studied extensively (Bertero et al., 1978; Hall et al., 1995; Sasani and Bertero, 2000; Alavi and Krawinkler, 2004; Makris and Black, 2004; Mavroeidis et al., 2004; Kalkan and Kunnath, 2006; Xu et al., 2007; Rupakhety and Sigbjörnsson, 2011; Yamamoto et al., 2011; Minami and Hayashi, 2013; Khaloo et al., 2015; Vafaei and Eskandari, 2015). These many investigations made clear the characteristics of the fling-step and forward-directivity inputs (Mavroeidis and Papageorgiou, 2003; Bray and Rodriguez-Marek, 2004; Kalkan and Kunnath, 2006; Mukhopadhyay and Gupta, 2013a,b; Zhai et al., 2013; Hayden et al., 2014; Yang and Zhou, 2014). It should be mentioned that Northridge earthquake in 1994, Hyogoken-Nanbu earthquake in 1995, and Chi-Chi earthquake in 1999 brought strong attention to earthquake structural engineers and designers.
It may be interesting to note that the fling-step and forward-directivity inputs are modeled by a few wavelets or a series of harmonic waves. Actually, many useful attempts have been conducted. Mavroeidis and Papageorgiou (2003) summarized the characteristics of this class of ground motions and proposed some simple models (Gabor wavelet, Berlage wavelet, etc.). Xu et al. (2007) made use of the model similar to the Berlage wavelet for evaluating the performance of passive dampers. Takewaki and Tsujimoto (2011) employed the Xu’s model and proposed a method in terms of the drift and input energy demand for scaling ground motions. Takewaki et al. (2012) used a sinusoidal wave for pulse-type ground motions.
Historically, the elastic–plastic earthquake responses were treated for the steady-state response to sinusoidal input or the transient response to an extremely simple sinusoidal input in 1960–1970s (Caughey, 1960a,b; Iwan, 1961, 1965a,b), and these methods have been applied to more complex problems. On the contrary, Kojima and Takewaki (2015a–c, 2016) introduced a completely different approach and demonstrated that the peak elastic–plastic response (continuation of free vibrations) can be derived by an energy approach without solving directly the equations of motion.
In the earthquake-resistant design, the resonance plays a key role and it has a strong effect even in case of near-fault ground motions with short duration. Although the resonant equivalent frequency had to be computed for a specified input level by changing the excitation frequency in a parametric manner in the conventional methods (Caughey, 1960a,b; Iwan, 1961, 1965a,b), no iteration is required in the recently proposed method for the double impulse (Kojima and Takewaki, 2015a). They demonstrated that the resonance can be proved by using energetic investigation and the critical timing of the second impulse can be characterized as the time with zero restoring force. This advantageous feature is retained also in this paper for the structures with negative post-yield stiffness. They also made clear that the maximum elastic–plastic response after impulse can be obtained by equating the initial kinetic energy computed by the initial velocity to the sum of hysteretic and elastic strain energies. It should be reminded that, while most of the previous researches on near-fault ground motions are aimed at disclosing the response characteristics of elastic or elastic–plastic structures with arbitrary stiffness and strength parameters and require tremendous amount of numerical task, the present paper focused on the critical response (resonant response) and enabled the drastic reduction of computational works. Once the critical case is made clear, the other non-resonant case provides a more stable situation.
Double Impulse Input
Double Impulse Input
As explained in the previous papers (Kojima and Takewaki, 2015a,b; Kojima et al., 2015), the fling-step input (fault-parallel) of the near-fault ground motion can be represented effectively by a one-cycle sinusoidal wave (Mavroeidis and Papageorgiou, 2003; Kalkan and Kunnath, 2006), and the forward-directivity input (fault-normal) of the near-fault ground motion can be expressed by a series of three sinusoidal wavelets with different magnitudes (see Figure 1). It is explained in the field of seismology that the fling step is caused by the permanent displacement of the ground induced by the fault dislocation, and the forward-directivity effect is governed by the relation of the movement of the rupture front with the site. In this paper, it is intended to simplify typical near-fault ground motions by a double impulse following the references (Kojima and Takewaki, 2015a; Kojima et al., 2015). This is because the double impulse in the form of shock has a simple characteristic and a straightforward expression of the response can be expected even for elastic–plastic responses based on an energy approach to free vibrations. Furthermore, the double impulse enables us to describe directly the critical timing of impulses (resonant frequency), which is not easy for the sinusoidal and other inputs without a repetitive procedure. Although most of the previous methods (Caughey, 1960a,b; Iwan, 1961) employ the equivalent linearization of the structural model for the unchanged input (see Figure 2A including an equivalent linear stiffness), the method proposed in the works (Kojima and Takewaki, 2015a,b) and in this paper transforms the input into the double impulse for the unchanged structural model (see Figure 2B) It should be noted that the negative post-yield slope cannot be dealt with by the equivalent linearization.
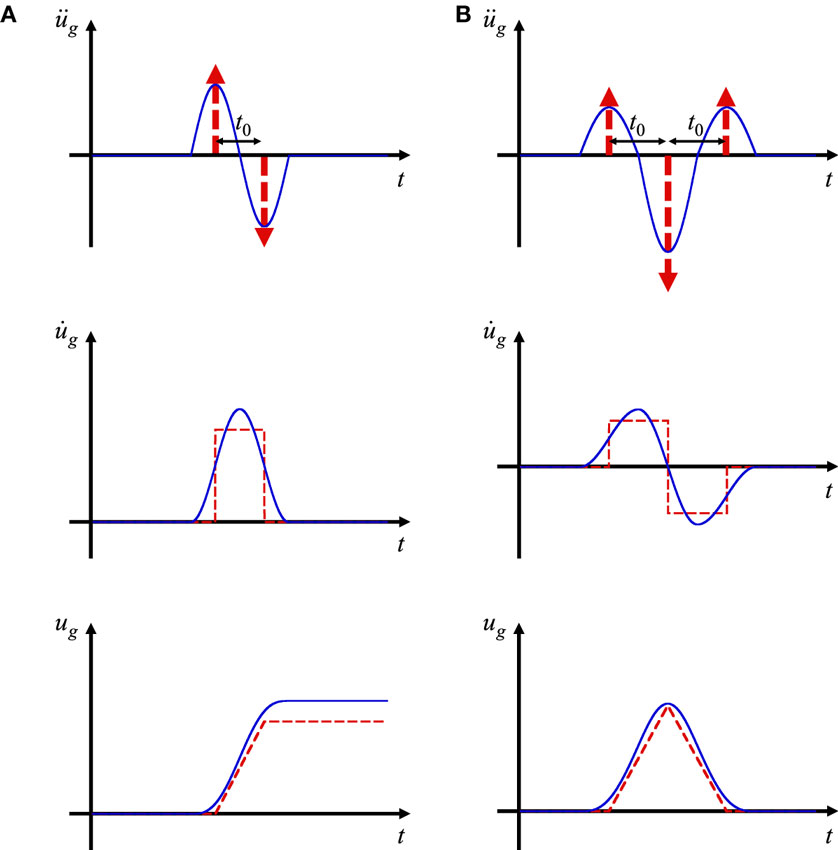
Figure 1. Transformation of acceleration wavelets into a series of impulses, (A) fling-step input (blue) and double impulse (red) and (B) forward-directivity input (blue) and triple impulse (red) (Kojima and Takewaki, 2015a).
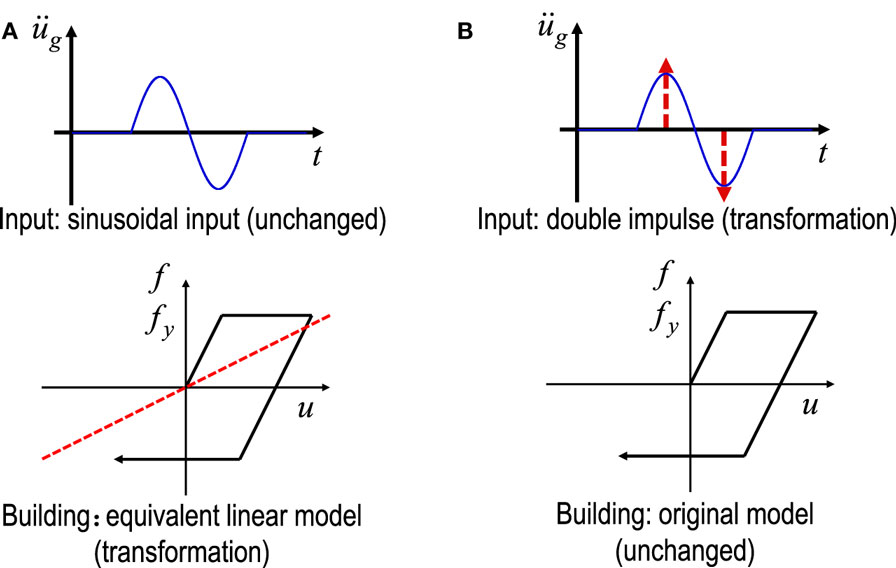
Figure 2. Feature of method of input transformation against method of structural model transformation, (A) previous method (equivalent linearization of structural model for unchanged input), (B) new method (transformation of input into double impulse for unchanged structural model) (Kojima and Takewaki, 2016).
Following the reference (Kojima and Takewaki, 2015a), consider a ground acceleration as double impulse, as shown in Figure 1A, expressed by
where V is the given initial velocity (also the second velocity with an opposite sign) and t0 is the time interval between two impulses. The time derivative is denoted by an over-dot. The comparison with the corresponding one-cycle sinusoidal wave is plotted in Figure 1A. The corresponding velocity and displacement of such double impulse and sinusoidal wave are also plotted in Figure 1A. Those for the triple impulse as a substitute of a forward-directivity input are shown in Figure 1B for reference. It can be understood that the double impulse is a good approximation of the corresponding sinusoidal wave even in the form of velocity and displacement. However, the correspondence in the response should be discussed carefully. This will be conducted in Section “Applicability of Critical Double Impulse Timing to the Corresponding Sinusoidal Wave.”
The Fourier transform of the acceleration of the double impulse can be derived as
Previous Work on Closed-Form Critical Elastic-Perfectly Plastic Response of SDOF System Subjected to Double Impulse
In the previous work (Kojima and Takewaki, 2015a), a closed-form expression of the critical elastic-perfectly plastic response of an SDOF system has been derived for the double impulse. The critical response exhibiting the largest response under possible excitations plays a key role in the worst-case analysis (Drenick, 1970; Takewaki, 2002, 2007; Moustafa et al., 2010; Takewaki et al., 2012). Since a similar classification of response cases is used in this paper, the essence is shown in this section.
Consider an undamped elastic-perfectly plastic SDOF system of mass m and stiffness k. The yield deformation and yield force are denoted by dy and fy (see Figure 3). Let , u and f denote the undamped natural circular frequency, the mass displacement relative to the ground and the restoring force of the model, respectively. The plastic deformation just after the first impulse is expressed by up1 and that just after the second impulse is denoted by up2.
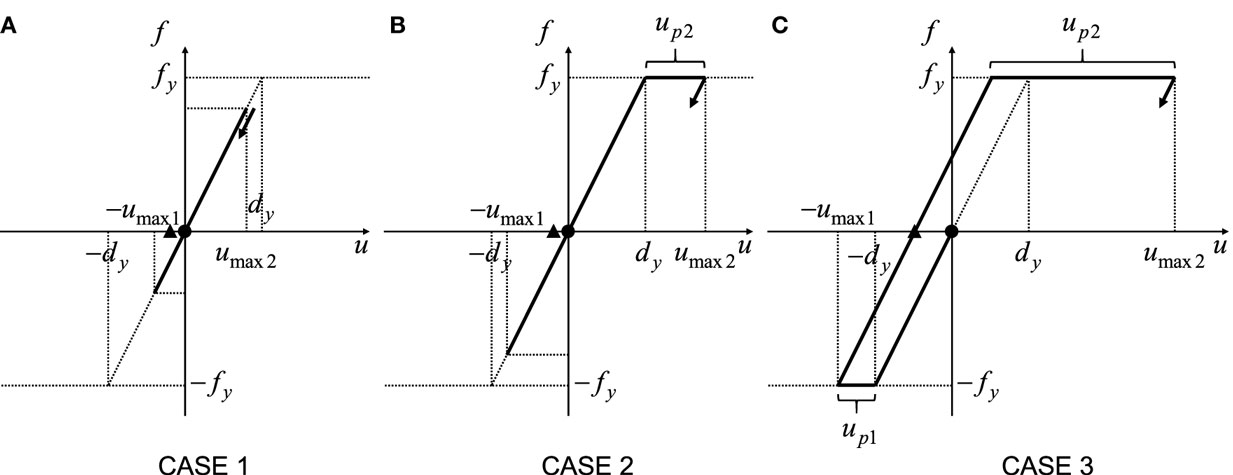
Figure 3. Maximum deformation under double impulse based on energy approach: (A) Case 1: elastic response, (B) Case 2: plastic response only after the second impulse, and (C) Case 3: plastic response even after the first impulse (●: first impulse, ▲: second impulse).
The impulse changes the mass velocity by V instantaneously and the elastic–plastic response of the SDOF system under the double impulse can be expressed by the continuation of free vibrations with different initial conditions. Let umax 1 and umax 2 denote the maximum deformations just after the first impulse and the second impulse, respectively, as shown in Figure 3. Those responses can be derived by an energy approach without solving directly the equation of motion. The kinetic energy given at the initial stage (the time of the first impulse) and at the time of the second impulse is transformed into the sum of the hysteretic energy and the maximum elastic strain energy corresponding to the yield deformation. It has been made clear that the critical timing, relative to the first impulse, of the second impulse corresponds to the state with a zero restoring force and only a kinetic energy exists at this stage as mechanical energies. By using this rule, the maximum deformation under the double impulse can be obtained in a simple manner.
The maximum elastic-perfectly plastic response of the SDOF system under the critical double impulse can be classified into the three cases depending on the yielding stage (input level). Let Vy(=ω1dy) denote the input velocity level of the double impulse at which the SDOF system just attains the yield deformation just after the first impulse. This parameter also presents a strength parameter of the SDOF system. Case 1 is the case of elastic response even after the second impulse, and Case 2 is the case of plastic deformation only after the second impulse. In addition, Case 3 is the case of plastic deformation after the first impulse. Figure 3 shows the diagram for these three cases.
Figure 3A shows the maximum deformation just after the first impulse and that just after the second impulse, respectively, for the elastic case (Case 1) during the whole stage. From the energy balance, umax1 and umax2 can be obtained as follows.
Using the similar energy balance, umax1 and umax2 for the Cases 2 and 3 (Figures 3B,C) can be obtained simply as follows.
Figure 4 shows the maximum deformation normalized by the yield deformation with respect to input level.
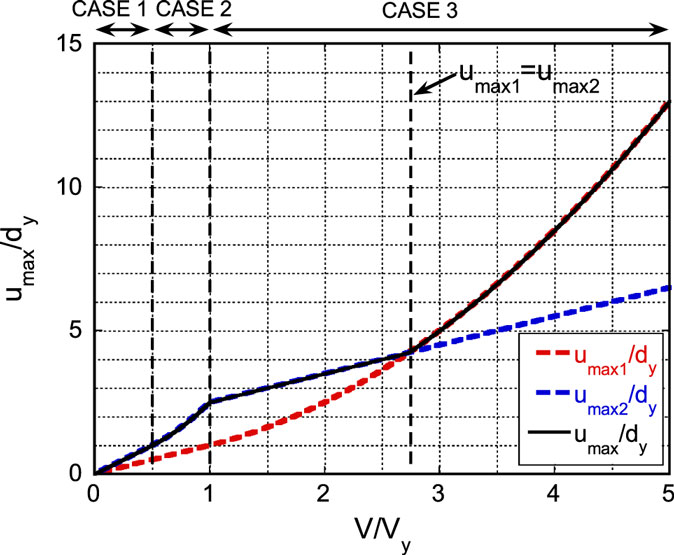
Figure 4. Maximum deformation under double impulse with respect to input level (Kojima and Takewaki, 2015a).
Maximum Elastic–Plastic Deformation and Stability Limit of Structures with Negative Post-Yield Stiffness Subjected to Critical Double Impulse
Consider an elastic–plastic SDOF model with negative post-yield stiffness. The ratio of the post-yield stiffness to the initial elastic stiffness is expressed by α(<0). Other parameters are the same as those in the previous section. Let us introduce the notations shown in Figure 5. The plastic deformation after the first impulse is expressed by up1 and the plastic deformation after the second impulse is described by up2 as in the previous section. In this paper, the collapse of a structure (or stability limit) is characterized by the phenomenon that the restoring force attains 0 in the second stiffness range as shown in Figure 5.
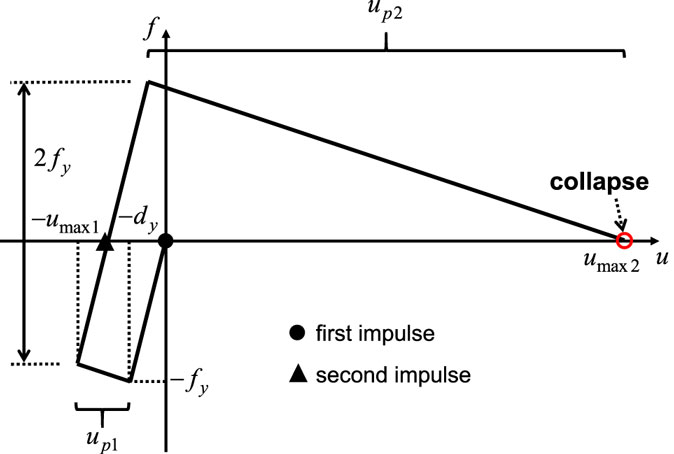
Figure 5. Definition of plastic deformations after the first and second impulses and characterization of collapse of structure.
Pattern 1: Stability Limit after the Second Impulse without Plastic Deformation after the First Impulse
The first collapse pattern is the case where the structure attains the stability limit after the second impulse without plastic deformation after the first impulse as shown in Figure 6. In order to derive the stability limit, the maximum elastic–plastic deformation of a structure with negative post-yield stiffness subjected to the critical double impulse is obtained by using the energy balance law.
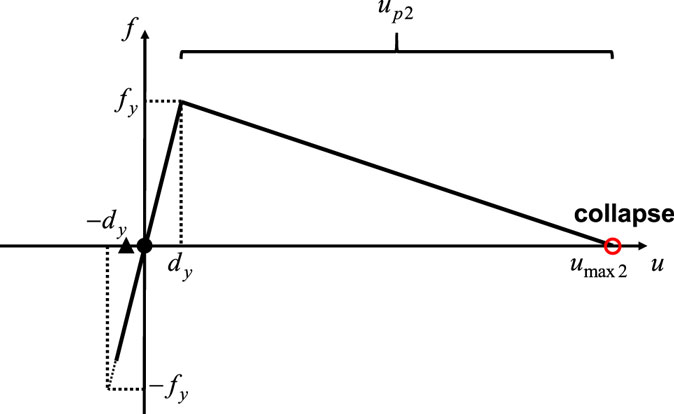
Figure 6. Restoring force characteristic corresponding to Pattern 1 (Stability limit after the second impulse without plastic deformation after the first impulse).
It can be proved that the critical timing of the second impulse to cause the maximum deformation after the second impulse is the time when the restoring force becomes 0 after the first impulse. At this timing, the velocity attains the maximum value V in the unloading process due to the energy conservation law and the velocity V is added just after the second impulse.
The plastic deformation of the structure just attaining the stability limit (zero restoring force) after the second impulse can be obtained from Figure 6.
Equation 9 leads to
Then, the energy balance after the second impulse can be expressed by
Substitution of Eq. 10 into Eq. 11 provides
Rearrangement of Eq. 12 with the use of ω1 dy = Vy provides
From Eq. 13, the input level of the double impulse at the stability limit can be expressed in terms of the post-yield stiffness ratio α as follows.
In this pattern, has to be satisfied.
This stability limit corresponds to that by Sun et al. (1973).
Pattern 2: Stability Limit after the Second Impulse with Plastic Deformation after the First Impulse
The second collapse pattern is the case where the structure attains the stability limit after the second impulse with plastic deformation after the first impulse (see Figure 7). It can also be proved that the critical timing of the second impulse to cause the maximum deformation after the second impulse is the time when the restoring force becomes 0 after the first impulse. At this timing, the velocity attains the maximum value vc due to the energy conservation law in the unloading process and the velocity V is added just after the second impulse.
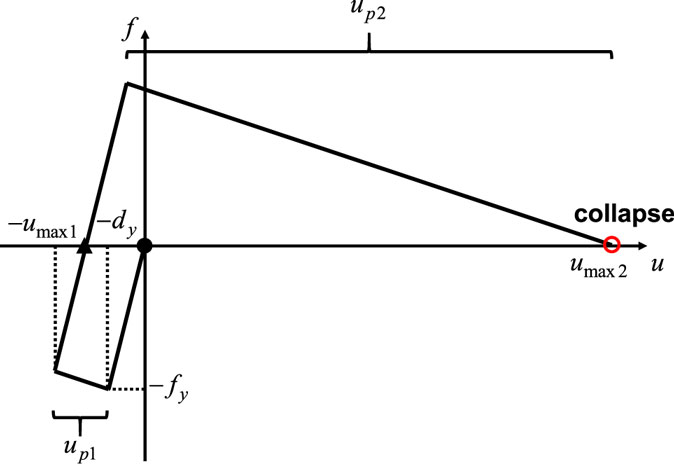
Figure 7. Restoring force characteristic corresponding to Pattern 2 (Stability limit after the second impulse with plastic deformation after the first impulse).
From the energy balance law after the first impulse (see Figure 7), the plastic deformation up1 can be obtained as
In addition, from the energy balance law just after attaining up1 after the first impulse, the maximum velocity vc during the unloading process can be expressed by
The relation of the plastic deformations up1, up2 of the structure just attaining the stability limit (zero restoring force) after the second impulse can be obtained from Figure 7.
From Eq. 17, the plastic deformation up2 can be expressed as
Then, the energy balance after the second impulse (see Figure 7) can be expressed by
Substitution of Eqs 15, 16, 18 into Eq. 19 provides
Rearrangement of Eq. 20 with the use of ω1dy = Vy and k = ω12m provides
Equation 21 can also be expressed as the following quadratic equation.
From Eq. 22, the input level of the double impulse at the stability limit can be expressed in terms of the post-yield stiffness ratio α as follows.
In this pattern, V/Vv ≥ 1.0 has to be satisfied. Therefore, one of two expressions in Eq. 23 is taken and reduced to the following form.
Pattern 3: Stability Limit after the Second Impulse with Closed-Loop in Restoring Force Characteristic
The third collapse pattern is derived here. From Figure 8, the energy balance during free vibration after attaining the maximum deformation after the second impulse can be expressed as
vc and up1 can be obtained from Eqs 16 and 15, respectively, and up2 can be derived from the energy balance law after the second impulse.
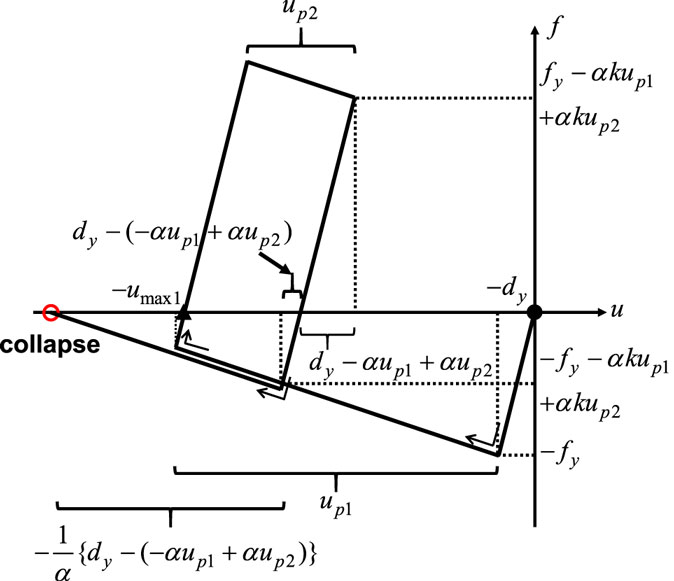
Figure 8. Restoring force characteristic corresponding to Pattern 3 (Stability limit after the second impulse with closed-loop in restoring force characteristic).
With the notation −αup1 + αup2 = λdy, Eq. 25 provides
Division of both sides in Eq. 27 by k/2 and rearrangement of the resulting equation lead to
Division again of both sides of Eq. 28 by and rearrangement of the resulting equation yield
The solution of Eq. 29 can be obtained as
It should be noted that, since provides only complex numbers, this case is eliminated. Then, the solution is
Using Eqs 15, 16, 26, 31 and −αup1 + αup2 = λdy, the following relation is derived.
After some rearrangement, Eq. 32 provides
Equations 16 and 33 lead to
After Eq. 34 is squared, the following fourth-order equation is obtained.
Substitution of Eq. 16 into Eq. 35 yields
Further substitution of Eq. 31 into Eq. 36 and rearrangement of the resulting equation lead to
Equation 37 provides the stability limit in this case which depends on the parameter α.
Additional Pattern 1: Limit after the First Impulse
Another possible collapse pattern is the case where the structure attains the stability limit after the first impulse. Although the stability limit in this pattern is slightly larger than that for the above Pattern 3, its limit is explained here for disclosing the overall property of the stability limit.
The plastic deformation up1 of the structure just attaining the stability limit (zero restoring force) after the first impulse can be obtained from Figure 9.
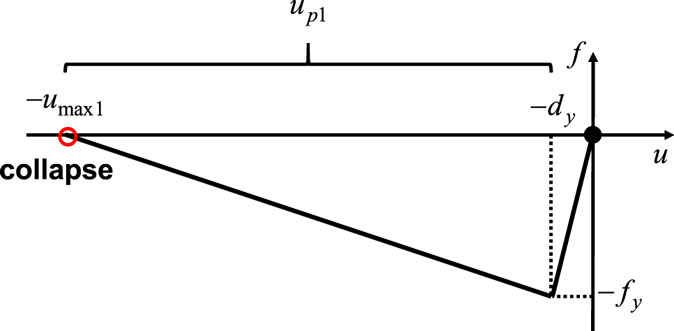
Figure 9. Additional Pattern 1: limit after the first impulse.
Equation 38 leads to
The energy balance after the first impulse can be expressed by
Substitution of Eq. 39 into Eq. 40 provides
Rearrangement of Eq. 41 with the use of ω1dy = Vy provides
From Eq. 42, the input level of the double impulse at the stability limit in this case can be expressed in terms of the post-yield stiffness ratio α as follows.
In this pattern, V/Vy ≥ 1.0 has to be satisfied.
Additional Pattern 2: Limit without Plastic Deformation after the Second Impulse
As in the previous section “Additional Pattern 1: Limit after the First Impulse,” since further analysis of the overall behavior may be beneficial for accurate analysis of the stability limit, another classification analysis is made for the above-mentioned Pattern 3. This classification is characterized by the condition whether the response after the second impulse shown in Figure 10 goes beyond the yield point.
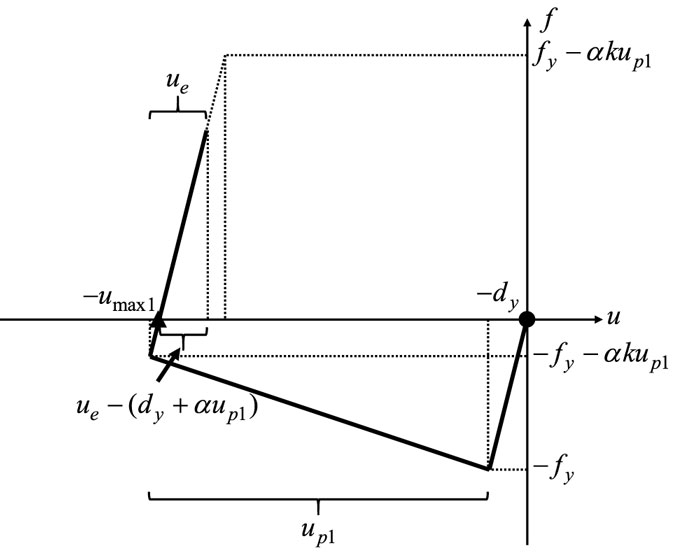
Figure 10. Additional Pattern 2: limit without plastic deformation after the second impulse.
From Figure 10, the energy balance after the second impulse in case of the elastic response after the second impulse can be expressed by
where ue indicates the elastic deformation during the unloading process after attaining the maximum deformation umax1. The maximum deformation after the second impulse can be derived as
vc, up1 have been derived in Eqs 16 and 15. From Eq. 44, ue can be obtained as
If ue becomes larger than 2dy, the response goes into a plastic region after the second impulse. Therefore, the boundary can be characterized by ue = 2dy. Eq. 46 provides such boundary as
Equation 47 leads to the following quadratic equation.
The solution can be derived as
Since V/Vy > 0, V/Vy corresponding to such boundary is expressed as
It has been confirmed that the structure goes into a plastic region after the second impulse in the case of α < −1/3. Therefore, the boundary given by Eq. 50 is used in the range of α > −1/3.
It should be remarked that the present paper deals with the critical double impulse and the stability limit for such critical timing plays a principal role for other non-critical cases. Once the stability limit is derived for a critical timing case, the non-critical case provides a smaller response and leads to a stable state.
Results on Numerical Example
The dynamic stability limit obtained in Section “Maximum Elastic–Plastic Deformation and Stability Limit of Structures with Negative Post-Yield Stiffness Subjected to Critical Double Impulse” is shown in Figure 11A where Cases 1–3 indicate the response cases similar to those in Figure 3 for elastic-perfectly plastic models. For facilitating intuitive understanding, the corresponding collapse patters are shown in Figure 11A. In order to investigate the accuracy of the proposed limit, 15 points slightly smaller or larger than the limit curve for 3 post-yield stiffness ratios of −0.1, −1/3, and −0.6 have been chosen. Those 15 points are indicated in Figure 11B. The solid circles represent the stable models, and the open circles present the unstable models.
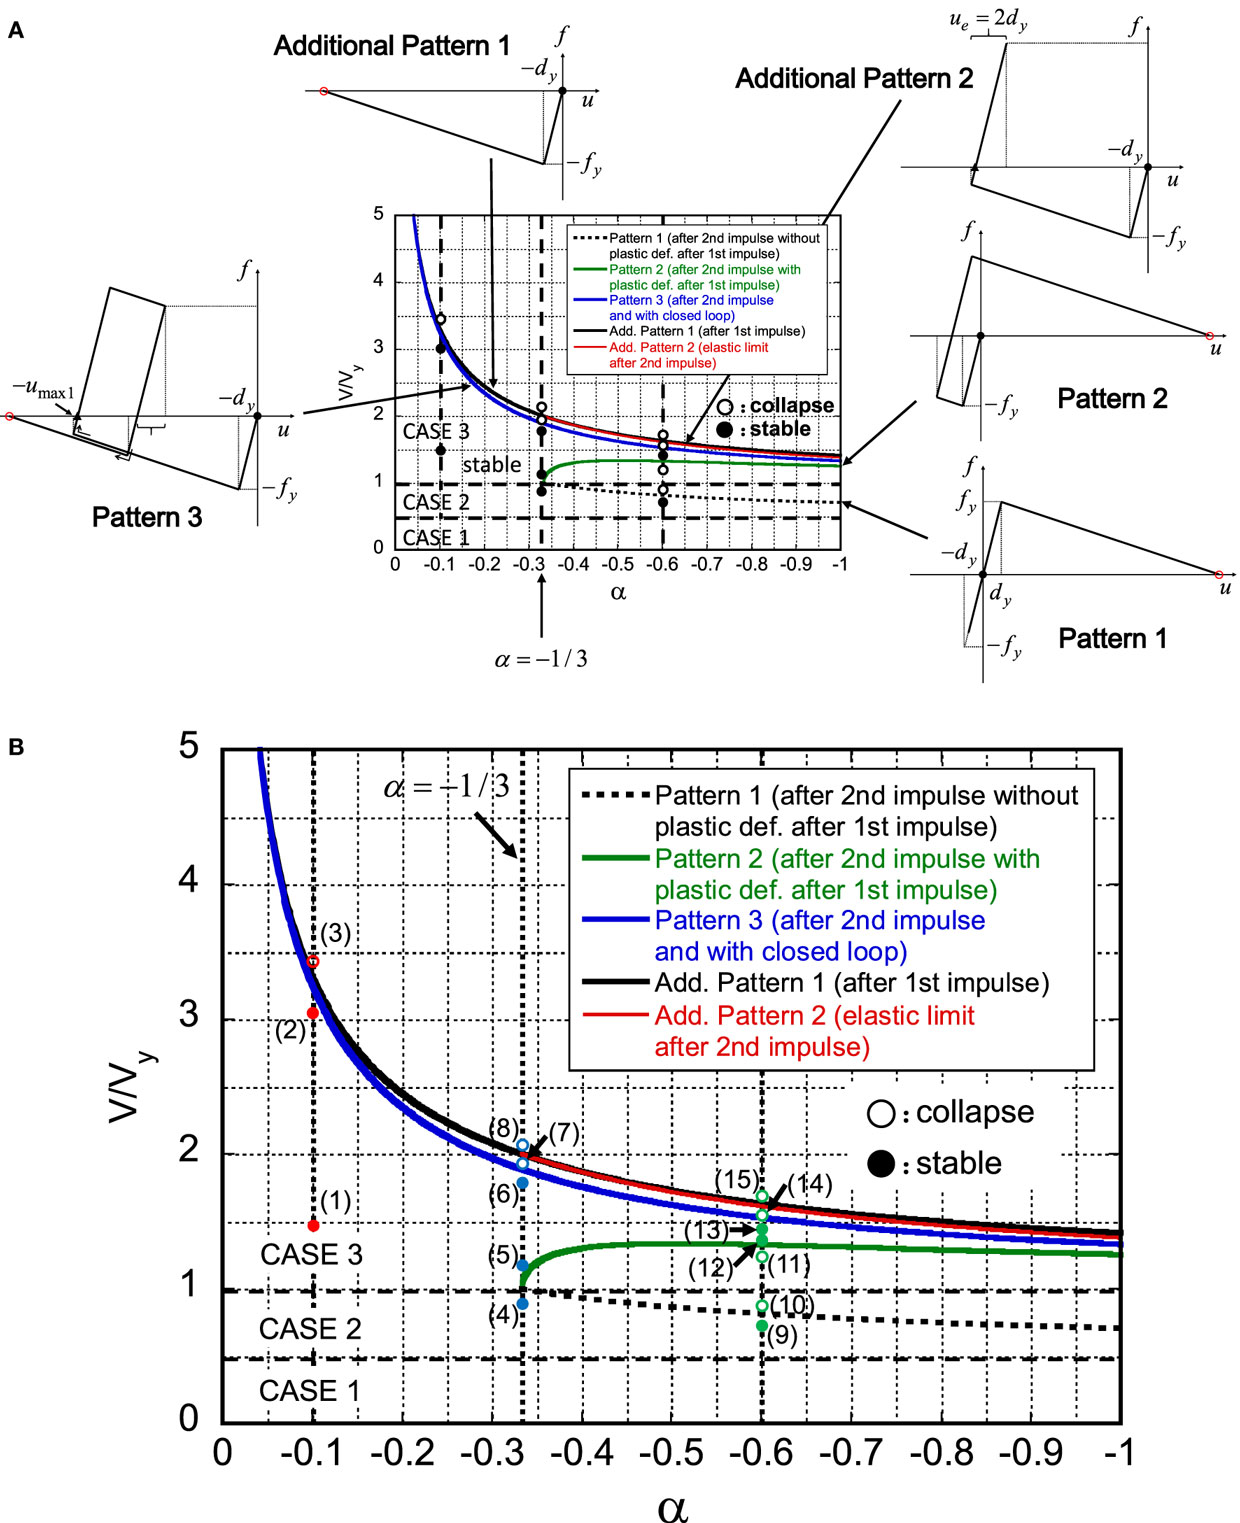
Figure 11. Several patterns of stability limit (patterns of collapse): (A) stability patterns and (B) 15 points to be checked for stability.
Figure 12 shows the restoring force–deformation relations for the above 15 models (3 for the post-yield stiffness ratio −0.1, 5 for the post-yield stiffness ratio −1/3, and 7 for the post-yield stiffness ratio −0.6). The colors correspond to the colors of circles in Figure 11B. It can be confirmed that the proposed stability limit certainly divides the region into the stable one and the unstable one within a reasonable accuracy.
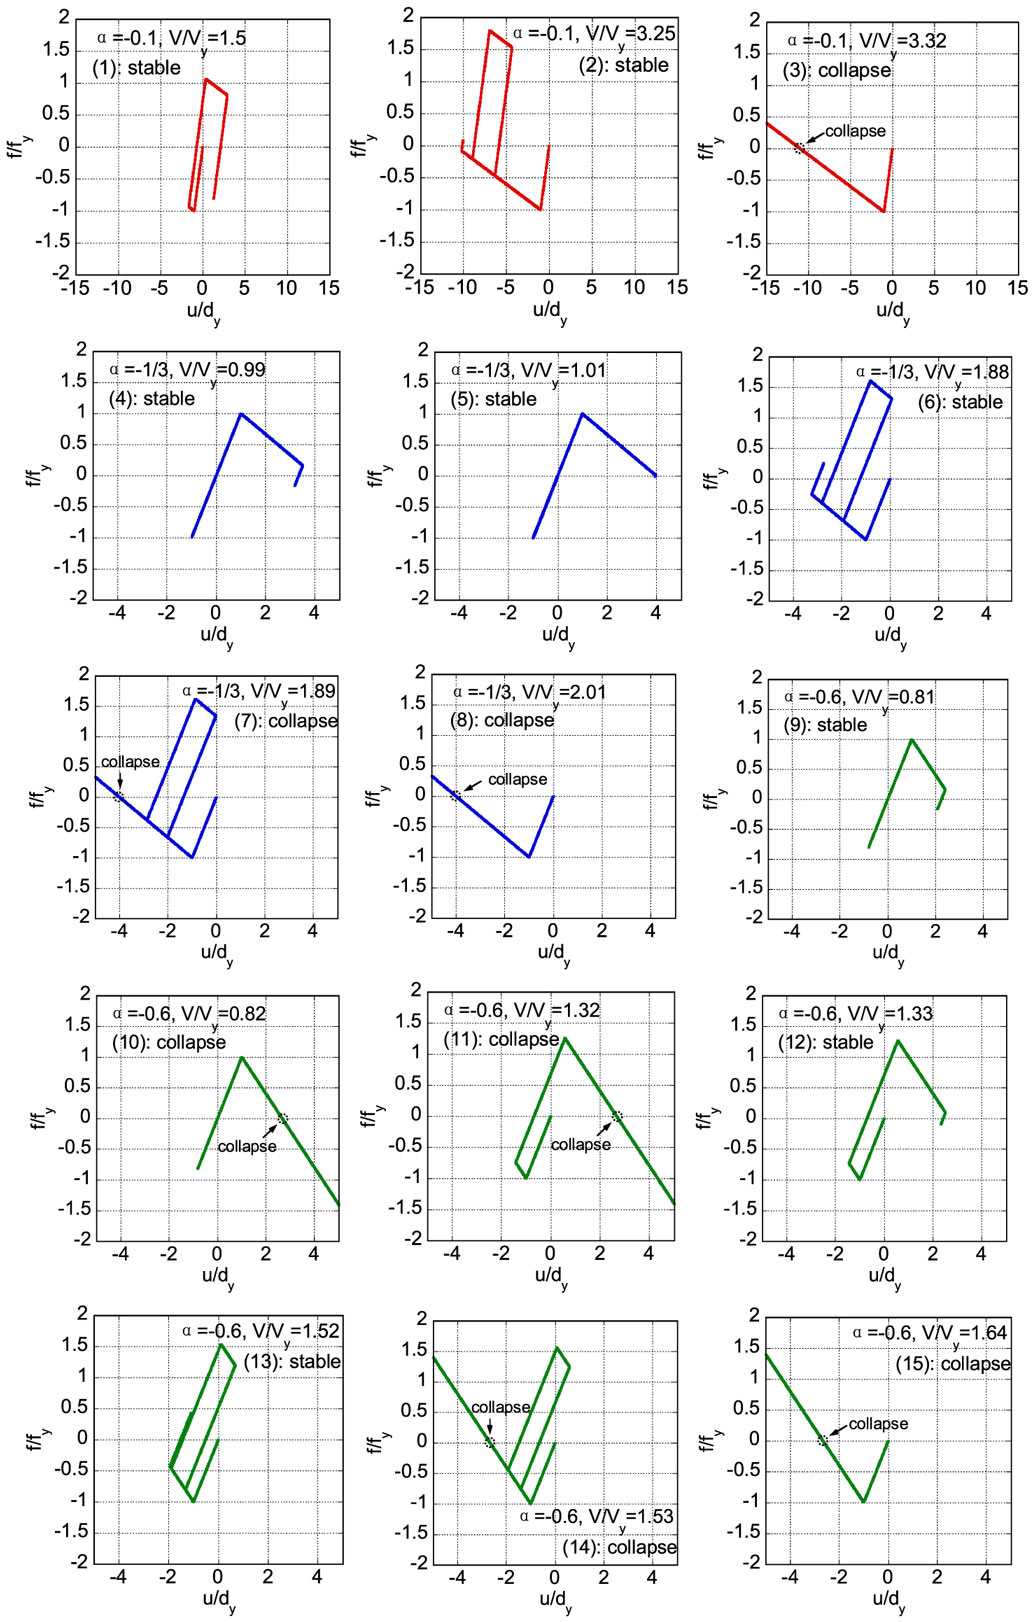
Figure 12. Restoring force–deformation relations for 15 models in stable and unstable regions.
Discussion
Applicability of Critical Double Impulse Timing to the Corresponding Sinusoidal Wave
In the previous paper (Kojima and Takewaki, 2015a), it has been demonstrated that, if the maximum value of the Fourier amplitude is selected as the key parameter, the responses to the double impulse and the corresponding sinusoidal input exhibit a fairly good correspondence. In this section, it is investigated whether the critical timing derived from the double impulse is also an approximate critical timing of the sinusoidal input.
Let denote the critical timing of the double impulse and t0 denote the general timing. The ratio of to the fundamental natural period T1(=2π/ω1) can be expressed as
This relation is plotted in Figure 13A for several post-yield stiffness ratios. It can be observed that the critical timing is delayed due to plastic deformation as the input level increases and the delaying rate is high as the post-yield stiffness ratio becomes smaller. The three vertical lines show the input levels corresponding to the additional Pattern 1 where the collapse is defined after the first impulse. Since the second impulse cannot be acted over this limit, Figure 13A represents this phenomenon exactly.
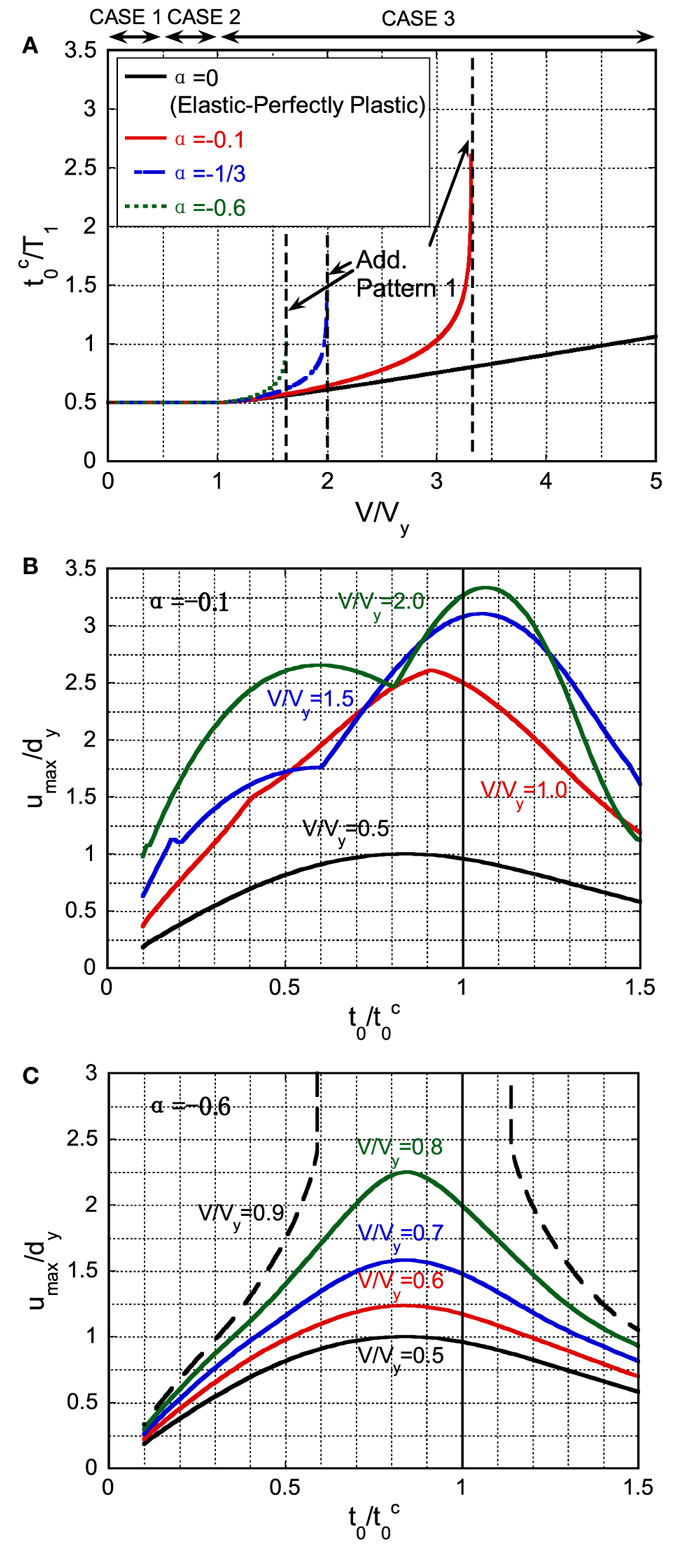
Figure 13. Critical timing of double impulse with respect to input level and correspondence of critical timing between double impulse and the corresponding one-cycle sine wave: (A) critical timing of double impulse with respect to input level, (B) maximum deformation of model with α = –0.1 under sine wave with respect to , and (C) maximum deformation of model with α = –0.6.
Figure 13B shows the maximum deformation of the model with α = −0.1 under the corresponding sine wave with respect to where the sine wave has the circular frequency π/t0 and the velocity amplitude is kept constant in each plot. The first peak for V/Vy = 2.0 corresponds to umax1 and the second peak indicates umax2. On the other hand, Figure 13C presents that of the model with α = −0.6. It can be confirmed that the critical timing derived from the double impulse is also an approximate critical timing of the sinusoidal input.
It has also been clarified from the numerical analysis using the corresponding one-cycle sinusoidal input that the stable models of Point (12) and (13) in Figure 11B are difficult to be produced. This fact may result from the fact that, since the deformation response after the first impulse under the corresponding one-cycle sinusoidal input is smaller than the response under the double impulse, the energy absorption after the first impulse is small under the corresponding one-cycle sinusoidal input and the response after the second impulse under the corresponding one-cycle sinusoidal input goes easily into the unstable region. In such case (α < −1/3), the model of Point (9) represents the model slightly smaller than the stability limit. More detailed examination should be made in the future.
Applicability to Recorded Ground Motions
It seems important to investigate the applicability of the present theory to actual recorded pulse-type ground motions.
Consider the Rinaldi station fault-normal component during the Northridge earthquake in 1994 as a representative pulse-type ground motion. Since the ground motion is fixed, the structural model parameters are selected appropriately, i.e., ω1 or dy in Vy = ω1dy is selected in an appropriate manner. Figure 14 illustrates the modeling of the part of the recorded ground motion acceleration into a one-cycle sinusoidal input. This one-cycle sinusoidal wave is transformed into the double impulse following the method shown in the references (Kojima and Takewaki, 2015a, 2016). In the transformation, the maximum values of Fourier amplitude have been coincided, and the interval of the double impulse is half the sinusoidal wave period. Since the initial velocity V is determined in Figure 14, Vy is selected here. Because ω1 is closely related to the resonance condition, dy is selected principally. This procedure is similar to the well-known elastic–plastic response spectrum developed in 1960–1970.
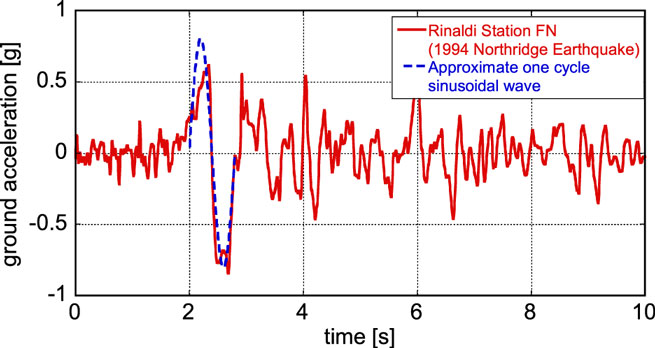
Figure 14. Modeling of part of pulse-type recorded ground motion into the corresponding one-cycle sinusoidal input (Rinaldi station fault-normal component during the Northridge earthquake in 1994).
Figure 15A shows the maximum deformation with respect to V/Vy under the Rinaldi station fault-normal component and the corresponding double impulse. The solid line has been drawn by using the response estimation method shown in Appendix. On the other hand, the dotted line has been obtained from the time–history response analysis for many models with different values of Vy. It can be found that about V/Vy = 0.8 is the approximate limit. From the detailed investigation, V/Vy = 0.78 and V/Vy = 0.79 are selected for candidates to be investigated. These two models corresponds approximately to Point (9) and (10) in Figure 11B. Figure 15B demonstrates the restoring force–deformation relation for the stable case (V/Vy = 0.78) and the unstable case (V/Vy = 0.79) under the Rinaldi station fault-normal component. In addition, Figure 15C presents the deformation time–history for the stable case (V/Vy = 0.78) and the unstable case (V/Vy = 0.79) under the Rinaldi station fault-normal component. On the other hand, Figure 15D shows the corresponding restoring force time–history for stable case (V/Vy = 0.78) and the unstable case (V/Vy = 0.79). It can be confirmed that the proposed stability limit using the double impulse is fairly accurate.
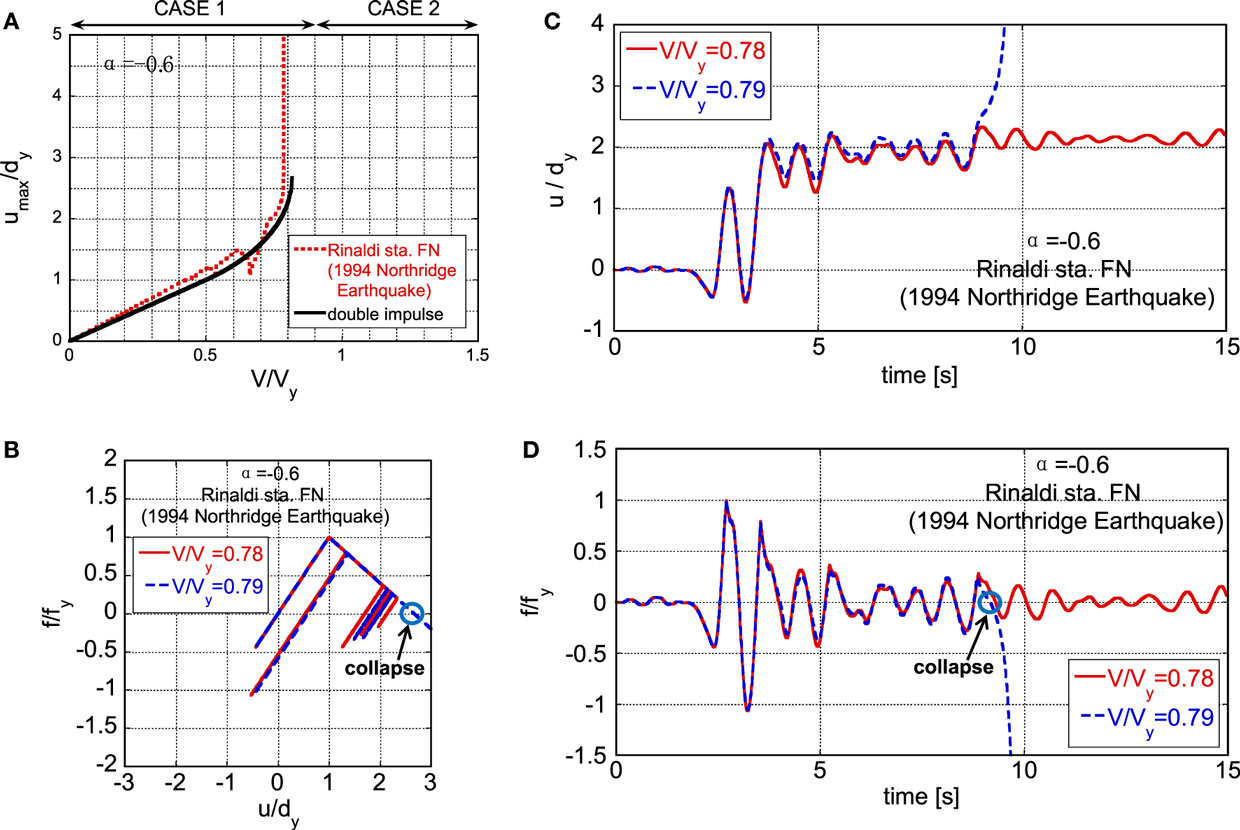
Figure 15. Stable model (V/Vy = 0.78) and unstable model (V/Vy = 0.79) under Rinaldi station fault-normal component. (A) Maximum deformation with respect to V/Vy under Rinaldi station fault-normal component and the corresponding double impulse, (B) restoring force–deformation relation for stable case and unstable case, (C) deformation time–history for stable case and unstable case, and (D) restoring force time–history for stable case and unstable case.
It should be remarked that, although Vy was varied in this section for a fixed set of V and t0, the result can also be regarded to correspond to the case where Vy is fixed and a set of V and t0 is varied.
Conclusion
A dynamic stability criterion for elastic–plastic structures under double impulse as a substitute of a near-fault ground motion has been derived in closed form. The detailed conclusions may be summarized as follows:
(1) The expression for a closed-form solution of the elastic-perfectly plastic response of an SDOF model by the critical double impulse has been extended to a dynamic stability problem of elastic–plastic structures with negative post-yield stiffness in the restoring force characteristic. A negative post-yield stiffness is treated in order to consider the P-delta effect. The double impulse is used as a substitute of the fling-step near-fault ground motion.
(2) It has been shown that, since only the free vibration appears under the double impulse, the energy approach plays a critical role in the derivation of the closed-form solution of an elastic–plastic response of structures with the P-delta effect. It is remarkable that no iteration is needed in the derivation of the closed-form dynamic stability criterion on the critical elastic–plastic response.
(3) It has been shown via the closed-form expression that several patterns of unstable behaviors (collapse-process patterns) exist depending on the ratio of the input level of the double impulse to the structural strength and on the ratio of the negative post-yield stiffness to the initial elastic stiffness. The first pattern is the case where the structure attains the stability limit after the second impulse without plastic deformation after the first impulse. The second pattern is the case where the structure attains the stability limit after the second impulse with plastic deformation also after the first impulse. The third pattern is the case where the structure attains the stability limit after the second impulse with closed loop in restoring force characteristic (the final movement direction is the same as the first movement direction).
(4) The validity of the proposed dynamic stability criterion has been investigated by the numerical response analysis for structures under double impulses with stable or unstable parameters. It has been confirmed that the proposed criterion has a reasonable accuracy.
(5) The reliability of the proposed theory has been tested through the comparison with the response analysis to the corresponding one-cycle sinusoidal input as a representative of the fling-step near-fault ground motion.
(6) It has been demonstrated that the proposed criterion using the double impulse is applicable to actual recorded pulse-type ground motions within a reasonable accuracy.
The present theory may be applicable to an MDOF structure once the MDOF structure is transformed into the corresponding SDOF system using the push-over analysis.
Author Contributions
KK carried out the theoretical and numerical analysis. IT supervised the theoretical analysis. All authors read and approved the final manuscript.
Conflict of Interest Statement
The authors declare that the research was conducted in the absence of any commercial or financial relationships that could be construed as a potential conflict of interest.
Acknowledgments
Part of the present work is supported by the Grant-in-Aid for Scientific Research of Japan Society for the Promotion of Science (No. 15H04079) and the 2013-MEXT-Supported Program for the Strategic Research Foundation at Private Universities in Japan. These supports are greatly appreciated.
References
Adam, C., and Jager, C. (2012). “Dynamic instabilities of simple inelastic structures subjected to earthquake excitation,” in Advances Dynamics and Model-Based Control of Structures and Machines, eds H. Irschik, M. Krommer, and A. K. Belyaev (Wien: Springer), 11–18.
Alavi, B., and Krawinkler, H. (2004). Behaviour of moment resisting frame structures subjected to near-fault ground motions. Earthquake Eng. Struct. Dyn. 33, 687–706. doi: 10.1002/eqe.369
Araki, Y., and Hjelmstad, K. D. (2000). Criteria for assessing dynamic collapse of elastoplastic structural systems. Earthquake Eng. Struct. Dyn. 29, 1177–1198. doi:10.1002/1096-9845(200008)29:8<1177::AID-EQE963>3.0.CO;2-E
Bernal, D. (1987). Amplification factors for inelastic dynamic P-Δ effects in earthquake analysis. Earthquake Eng. Struct. Dyn. 15, 635–651. doi:10.1002/eqe.4290150508
Bernal, D. (1998). Instability of buildings during seismic response. Eng. Struct. 20, 496–502. doi:10.1016/S0141-0296(97)00037-0
Bertero, V. V., Mahin, S. A., and Herrera, R. A. (1978). Aseismic design implications of near-fault San Fernando earthquake records. Earthquake Eng. Struct. Dyn. 6, 31–42. doi:10.1002/eqe.4290060105
Bray, J. D., and Rodriguez-Marek, A. (2004). Characterization of forward-directivity ground motions in the near-fault region. Soil Dyn. Earthquake Eng. 24, 815–828. doi:10.1016/j.soildyn.2004.05.001
Caughey, T. K. (1960a). Sinusoidal excitation of a system with bilinear hysteresis. J. Appl. Mech. 27, 640–643. doi:10.1115/1.3644077
Caughey, T. K. (1960b). Random excitation of a system with bilinear hysteresis. J. Appl. Mech. 27, 649–652. doi:10.1115/1.3644077
Challa, V. R. M., and Hall, J. F. (1994). Earthquake collapse analysis of steel frames. Earthquake Eng. Struct. Dyn. 23, 1199–1218. doi:10.1002/eqe.4290231104
Ger, J.-F., Cheng, Y., and Lu, L.-W. (1993). Collapse behavior of Pino Suarez building during 1985 Mexico City earthquake. J. Struct. Eng. 119, 852–870. doi:10.1061/(ASCE)0733-9445(1993)119:3(852)
Hall, J. F. (1998). Seismic response of steel frame buildings to near-source ground motions. Earthquake Eng Struct. Dyn. 27, 1445–1464. doi:10.1002/(SICI)1096-9845(199812)27:12<1445::AID-EQE794>3.0.CO;2-C
Hall, J. F., Heaton, T. H., Halling, M. W., and Wald, D. J. (1995). Near-source ground motion and its effects on flexible buildings. Earthquake Spectra 11, 569–605. doi:10.1193/1.1585828
Hayden, C. P., Bray, J. D., and Abrahamson, N. A. (2014). Selection of near-fault pulse motions. J. Geotech. Geoenviron. Eng. 140. doi:10.1061/(ASCE)GT.1943-5606.0001129
Herrmann, G. (ed.) (1965). “Dynamic stability of structures,” in Proceedings of an International Conference Held at Northwestern University, 1965 (Oxford: Pergamon Press).
Hjelmstad, K. D., and Williamson, E. B. (1998). Dynamic stability of structural systems subjected to base excitation. Eng. Struct. 20, 425–432. doi:10.1016/S0141-0296(97)00034-5
Ibarra, L.F., and Krawinkler, H. (2005). Global Collapse of Frame Structures Under Seismic Excitations, PEER Center Report 2005/06, Richmond.
Ishida, S., and Morisako, K. (1985). Collapse of SDOF system to harmonic excitation. J. Eng. Mech. 111, 431–448. doi:10.1061/(ASCE)0733-9399(1985)111:3(431)
Iwan, W. D. (1961). The Dynamic Response of Bilinear Hysteretic Systems, Ph.D. thesis, California Institute of Technology, Pasadena.
Iwan, W. D. (1965a). “The dynamic response of the one-degree-of-freedom bilinear hysteretic system,” in Proceedings of the Third World Conference on Earthquake Engineering (New Zealand).
Iwan, W. D. (1965b). The steady-state response of a two-degree-of-freedom bilinear hysteretic system. J. Applied Mech. 32, 151–156. doi:10.1115/1.3625711
Jennings, P. C., and Husid, R. (1968). Collapse of yielding structures during earthquakes. J. Eng. Mech. 94, 1045–1065.
Kalkan, E., and Kunnath, S. K. (2006). Effects of fling step and forward directivity on seismic response of buildings. Earthquake Spectra 22, 367–390. doi:10.1193/1.2192560
Khaloo, A. R., Khosravi1, H., and Hamidi Jamnani, H. (2015). Nonlinear interstory drift contours for idealized forward directivity pulses using “modified fish-bone” models. Adv. Struct. Eng. 18, 603–627. doi:10.1260/1369-4332.18.5.603
Kojima, K., Fujita, K., and Takewaki, I. (2015). Critical double impulse input and bound of earthquake input energy to building structure. Front. Built Environ. 1:5. doi:10.3389/fbuil.2015.00005
Kojima, K., and Takewaki, I. (2015a). Critical earthquake response of elastic-plastic structures under near-fault ground motions (part 1: fling-step input). Front. Built Environ. 1:12. doi:10.3389/fbuil.2015.00012
Kojima, K., and Takewaki, I. (2015b). Critical earthquake response of elastic-plastic structures under near-fault ground motions (part 2: forward-directivity input). Front. Built Environ 1:13. doi:10.3389/fbuil.2015.00012
Kojima, K., and Takewaki, I. (2015c). Critical input and response of elastic-plastic structures under long-duration earthquake ground motions. Front. Built Environ 1:15. doi:10.3389/fbuil.2015.00012
Kojima, K., and Takewaki, I. (2016). Closed-form critical earthquake response of elastic-plastic structures on compliant ground under near-fault ground motions. Front. Built Environ 2:1. doi:10.3389/fbuil.2016.00001
Maier, G., and Perego, U. (1992). Effects of softening in elastic-plastic structural dynamics. Int. J. Numer. Methods. Eng. 34, 319–347. doi:10.1002/nme.1620340120
Makris, N., and Black, C. J. (2004). Dimensional analysis of rigid-plastic and elastoplastic structures under pulse-type excitations. J. Eng. Mech. 130, 1006–1018. doi:10.1061/(ASCE)0733-9399(2004)130:9(1006)
Mavroeidis, G. P., Dong, G., and Papageorgiou, A. S. (2004). Near-fault ground motions, and the response of elastic and inelastic single-degree-freedom (SDOF) systems. Earthquake Eng. Struct. Dyn. 33, 1023–1049. doi:10.1002/eqe.391
Mavroeidis, G. P., and Papageorgiou, A. S. (2003). A mathematical representation of near-fault ground motions. Bull. Seism. Soc. Am. 93, 1099–1131. doi:10.1785/0120020100
Minami, H., and Hayashi, Y. (2013). Response characteristics evaluation of elastic shear beam for pulse waves. J. Struct. Constr. Eng. AIJ 685, 453–461; (in Japanese). doi:10.3130/aijs.78.453
Moustafa, A., Ueno, K., and Takewaki, I. (2010). Critical earthquake loads for SDOF inelastic structures considering evolution of seismic waves. Earthquakes Struct. 1, 147–162. doi:10.12989/eas.2010.1.2.147
Mukhopadhyay, S., and Gupta, V. K. (2013a). Directivity pulses in near-fault ground motions – I: identification, extraction and modeling. Soil Dyn. Earthquake Eng. 50, 1–15. doi:10.1016/j.soildyn.2013.02.017
Mukhopadhyay, S., and Gupta, V. K. (2013b). Directivity pulses in near-fault ground motions – II: estimation of pulse parameters. Soil Dyn. Earthquake Eng. 50, 38–52. doi:10.1016/j.soildyn.2013.02.017
Nakajima, A., Abe, H., and Kuranishi, S. (1990). Effect of multiple collapse modes on dynamic failure of structures with structural instability. Struct. Eng. Earthquake Eng. JSCE 7, 1s–11s.
Rupakhety, R., and Sigbjörnsson, R. (2011). Can simple pulses adequately represent near-fault ground motions? J. Earthquake Eng. 15, 1260–1272. doi:10.1080/13632469.2011.565863
Sasani, M., and Bertero, V. V. (2000). “Importance of severe pulse-type ground motions in performance-based engineering: historical and critical review,” in Proceeding of the Twelfth World Conference on Earthquake Engineering (Auckland).
Sivaselvan, M. V., Lavan, O., Dargush, G. F., Kurino, H., Hyodo, Y., Fukuda, R., et al. (2009). Numerical collapse simulation of large-scale structural systems using an optimization-based algorithm. Earthquake Eng. Struct. Dyn. 38, 655–677. doi:10.1002/eqe.895
Sun, C.-K., Berg, G. V., and Hanson, R. D. (1973). Gravity effect on single-degree inelastic system. J. Eng. Mech. Div. 99, 183–200.
Takewaki, I. (2002). Robust building stiffness design for variable critical excitations. J. Struct. Eng. 128, 1565–1574. doi:10.1061/(ASCE)0733-9445(2002)128:12(1565)
Takewaki, I. (2007). Critical Excitation Methods in Earthquake Engineering. Amsterdam: Elsevier [Second edition in 2013, London].
Takewaki, I., Moustafa, A., and Fujita, K. (2012). Improving the Earthquake Resilience of Buildings: The Worst Case Approach. London: Springer.
Takewaki, I., and Tsujimoto, H. (2011). Scaling of design earthquake ground motions for tall buildings based on drift and input energy demands. Earthquakes Struct. 2, 171–187. doi:10.12989/eas.2011.2.2.171
Takizawa, H., and Jennings, P. C. (1980). Collapse of a model for ductile reinforced concrete frames under extreme earthquake motions. Earthquake Eng. Struct. Dyn. 8, 117–144. doi:10.1002/eqe.4290080204
Tanabashi, R., Nakamura, T., and Ishida, S. (1973). “Gravity effect on the catastrophic dynamic response of strain-hardening multi-story frames,” in Proceedings of 5th World Conference on Earthquake Engineering, Vol. 2 (Rome), 2140–2149.
Uetani, K., and Tagawa, H. (1998). Criteria for suppression of deformation concentration of building frames under severe earthquakes. Eng. Struct. 20, 372–383. doi:10.1016/S0141-0296(97)00021-7
Vafaei, D., and Eskandari, R. (2015). Seismic response of mega buckling-restrained braces subjected to fling-step and forward-directivity near-fault ground motions. Struct. Design Tall Spec. Build. 24, 672–686. doi:10.1002/tal.1205
Williamson, E. B., and Hjelmstad, K. D. (2001). Nonlinear dynamics of a harmonically-excited inelastic inverted pendulum. J. Eng. Mech. 127, 52–57. doi:10.1061/(ASCE)0733-9399(2001)127:1(52)
Xu, Z., Agrawal, A. K., He, W.-L., and Tan, P. (2007). Performance of passive energy dissipation systems during near-field ground motion type pulses. Eng. Struct. 29, 224–236. doi:10.1016/j.engstruct.2006.04.020
Yamamoto, K., Fujita, K., and Takewaki, I. (2011). Instantaneous earthquake input energy and sensitivity in base-isolated building. Struct. Design Tall Spec. Build. 20, 631–648. doi:10.1002/tal.539
Yang, D., and Zhou, J. (2014). A stochastic model and synthesis for near-fault impulsive ground motions. Earthquake Eng. Struct. Dyn. 44, 243–264. doi:10.1002/eqe.2468
Zhai, C., Chang, Z., Li, S., Chen, Z.-Q., and Xie, L. (2013). Quantitative identification of near-fault pulse-like ground motions based on energy. Bull. Seism. Soc. Am. 103, 2591–2603. doi:10.1785/0120120320
Appendix
Maximum Elastic–Plastic Deformation of SDOF Model with Negative Post-Yield Stiffness under Double Impulse
The maximum elastic–plastic deformation of an SDOF model with negative post-yield stiffness can be obtained based on the energy approach.
[Case 1] Since the overall response is elastic as shown in Figure A1A in Appendix, the maximum deformation had been obtained in the reference (Kojima and Takewaki, 2015a).
[Case 2] The maximum deformation umax occurs after the second impulse (umax = umax2) as shown in Figure A1B in Appendix. The maximum plastic deformation up2 after the second impulse can be derived from the energy balance after the second impulse.
[Case 3] The maximum plastic deformation up1 after the first impulse can be obtained from the following energy balance after the first impulse (see Figure A1C in Appendix).
On the other hand, the maximum plastic deformation up2 after the second impulse can be derived from the following energy balance after the second impulse (see Figure A1C in Appendix).
where vc is the velocity at the zero restoring force state and can be obtained from the following energy balance after the starting point of the unloading process.
The maximum deformation umax can be obtained as the larger value among umax1 derived from Eq. A2 and umax2 derived from Eq. A3.
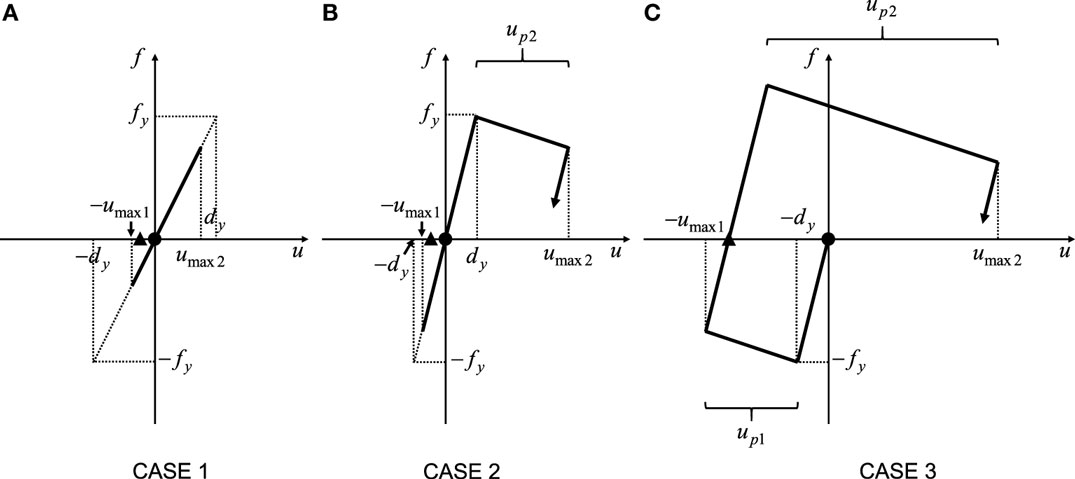
Figure A1. Maximum elastic–plastic deformation of SDOF model with negative post-yield stiffness under double impulse: (A) Case 1: elastic response, (B) Case 2: plastic response after the second impulse, and (C) Case 3: plastic response after the first impulse (●: first impulse, ▲: second impulse).
Keywords: earthquake response, critical response, elastic–plastic response, P-delta effect, dynamic stability, dynamic collapse, near-fault ground motion, double impulse
Citation: Kojima K and Takewaki I (2016) Closed-Form Dynamic Stability Criterion for Elastic–Plastic Structures under Near-Fault Ground Motions. Front. Built Environ. 2:6. doi: 10.3389/fbuil.2016.00006
Received: 01 February 2016; Accepted: 26 February 2016;
Published: 11 March 2016
Edited by:
Nikos D. Lagaros, National Technical University of Athens, GreeceReviewed by:
Sameh Samir F. Mehanny, Cairo University, EgyptMarijana Hadzima-Nyarko, University of Osijek, Croatia
Copyright: © 2016 Kojima and Takewaki. This is an open-access article distributed under the terms of the Creative Commons Attribution License (CC BY). The use, distribution or reproduction in other forums is permitted, provided the original author(s) or licensor are credited and that the original publication in this journal is cited, in accordance with accepted academic practice. No use, distribution or reproduction is permitted which does not comply with these terms.
*Correspondence: Izuru Takewaki, dGFrZXdha2lAYXJjaGkua3lvdG8tdS5hYy5qcA==