 Mohammadtaghi Moravej
 Ioannis Zisis
 Arindam Gan Chowdhury
 Peter Irwin1
- 1Department of Civil and Environmental Engineering, Florida International University, Miami, FL, USA
- 2International Hurricane Research Center, Florida International University, Miami, FL, USA
Wind-induced damage to multi-layer building wall systems, such as systems with vinyl siding, is common, especially in hurricane-prone areas. Wind load distribution through these multi layered walls and the amount of load reduction due to pressure equalization is expressed through pressure equalization factors (PEFs). The ASTM D3679 standard suggests a PEF of 0.36, which means a 64% reduction in the net pressure on the siding. This paper presents results from an experimental study conducted on a low-rise building subjected to realistic wind loading conditions at the wall of wind (WOW) experimental facility at Florida International University. Results from area-averaged mean and peak pressure coefficients indicated that a very small portion of the total wind load is carried by the vinyl siding. However, PEFs were found to be much higher when individual taps were considered. For instance, PEFs ranged from 71 to 106% for the case of pressure coefficients with negative sign (suction) and from 39 to 110% for the case of pressure coefficients with positive sign (pressure). When a combined set of taps was considered, PEFs ranged approximately from 50 to 80% for the case of “suction” and from 15 to 75% for “pressure.” Based on the 1 m2 of tributary area used in ASCE 7-10 Standard, results show that the net load on vinyl wall siding can be obtained by reducing the net design load for the entire wall assembly by 25 and 60% for suctions and pressures, respectively. However, a smaller tributary area (<1 m2) can experience a local peak load that can induce damage to connections, especially in the case of relatively flexible wall coverings, with no or very little load sharing between connection points. Results indicate that for smaller areas (~0.2 m2) the allowable percentage reductions should not be more than 15 and 25% for suctions and pressures, respectively. This study shows that the suggested ASTM PEF of 0.36 may lead to the underestimation of loads for the design of details affected by local loads. However, further research is needed to consider more cases when developing adequate design load guidelines for vinyl wall sidings.
Introduction
Multi-layer wall systems such as vinyl siding walls can provide continuous insulation for buildings. Furthermore, their satisfactory performance in preventing water intrusion and their esthetic quality are among the factors that account for their popularity. However, the performance of these walls during extreme wind events raises concerns. In a detailed study of wood framed buildings damaged by hurricane Katrina, vinyl siding failures were reported in several cases to be the initiation source of more extensive damages, such as gable end wall losses, through a progressive failure mechanism (van de Lindt et al., 2007). In June 2014, more than 25% of homes experienced damage to vinyl siding due to a tornado strike at Angus, ON, Canada (Miller et al., 2015).
The distribution of wind loads across multi-layer systems is complex and is affected by several contributing factors, such as the temporal and spatial gradient of the wind load, the magnitude of the load, spacing between layers, and the flexibility of the siding material. These factors have not yet been investigated extensively but have been the subject of several studies by Kramer et al. (1979), Amano et al. (1988), Cheung and Melbourne (1988) on wind pressure distribution through permeable roofs, and Oh and Kopp (2014), who developed a mathematical model for double-layer roof systems to study the pressure distribution in the cavity of air-permeable layers for given pressures on the external surfaces. In addition, there have been several studies focusing on the wind load distribution across multi-layered walls [e.g., Suresh Kumar (2000), Kopp and Gavanski (2011), Miller et al. (2015), Van Bentum and Geurts (2015)]. Assessing wind loads on the fasteners used in multilayer systems is also an important topic that has been studied by Cope et al. (2014).
Basically, the air permeation into the cavity between layers leads to a pressure equalization on opposite sides of a layer, which can reduce the net loads acting on that layer and thus result in a reduced design load. This equalization mechanism, which develops in small volume cavities, has been observed in other cases of wind studies, e.g., by Moravej et al. (2016), in which hurricane shutters were found to carry just a small amount of the wind load, causing the unprotected window surface to be the main carrier of the induced load.
To design the multi-layer wall systems, the commentary to chapter 30 of the ASCE 7-10 Standard (2010) addresses the load reduction due to the partial air pressure equalization between exterior and interior surfaces. In the absence of detailed information on the load distribution across individual layers, it is conservatively suggested to apply the entire pressure difference of the wall system in the design of individual load carrying layers, or to look for an alternative solution in the recognized literature. However, very few published studies are available on this topic.
Except for a field measurement by TenWolde et al. (1999), the research done on multi-layer wall systems has been conducted primarily in pressure chambers and under uniform static loading. In 2002, a study by Architectural Testing Inc. reported that the pressure equalization factor (PEF) for vinyl siding ranged from 0.03 to 0.18 (Architectural Testing Inc., 2002). The PEF value of 0.03 means a 97% reduction in net pressure on the siding, which implies almost full pressure equalization. Annex A1 of ASTM Standard D3679 (2009, 2013) applies a 0.36 PEF to evaluate the pressures on vinyl siding, which translates into a load obtained by applying a 64% reduction to the net pressure across the entire wall system. It has been observed that when there is a uniformly distributed static pressure applied, the pressure on the back of the siding equalizes the external pressure completely, whereas when there is a pressure gradient across the wall, the net load increases substantially (Miller et al., 2015).
To overcome the limitations of uniform static pressure testing, there have been some efforts to simulate a more realistic testing condition by using dynamic pressure chambers. These studies showed that the PEF value is sensitive to the magnitude of the applied load: a higher magnitude of negative load leads to a lower equalization factor (Kopp and Gavanski, 2011; Kochkin et al., 2012). The PEFs they evaluated for the vinyl siding were close to zero, which was in agreement with the earlier research conducted in uniform static tests (Architectural Testing Inc., 2002). However, the critical point is that the effect of a spatial pressure gradient on the wall’s outer surface was not assessed. Without the spatial pressure gradient, unrealistically low PEF values are quite possible. A recent study by the Insurance Institute for Business & Home Safety (IBHS) research center, which included the spatial pressure gradient effects through tests in a full-scale wind tunnel facility (Cope et al., 2012) and a multi-chamber pressure testing apparatus (Miller et al., 2015), showed high PEF values of about 0.8 for the case of pressure coefficients with negative sign (suction), that is, only a 20% reduction in net pressure. Therefore, according to these studies, carried out in more realistic test conditions, the PEF value of 0.36 (i.e., 64% reduction) suggested by ASTM D3679 should be considered as unconservative. These uncertainties in design load calculations call for further study into the wind effects on vinyl siding walls.
In the current study, wind-induced pressures on a vinyl siding wall were investigated at full scale for various wind directions to determine pressure equalization effects as a function of tap locations and combinations. The objective was to study localized wind effects on smaller tributary areas. The research was conducted at Florida International University (FIU) wall of wind (WOW) experimental facility, which can generate design level wind speeds in a boundary-layer flow. Sections “Experimental Setup” and “Data Analysis Methods” of the paper describe the experiments carried out at the WOW and the analysis method and are followed by Section “Results and Discussion.” Conclusions are presented in Section “Conclusion.”
Experimental Setup
WOW Experimental Facility
The WOW is a state-of-the-art large scale wind engineering experimental facility consisting of 12 fans (Figure 1A), each powered by a 700-hp motor. The 12-fan system is capable of generating wind speeds exceeding 70 m/s (157 mph), which is equivalent to Category 5 hurricane wind speeds as per Saffir–Simpson scale. Spires and roughness elements in a flow management box help generate an atmospheric boundary layer over a length of 9.75 m downstream of the contraction zone (Figure 1B). The open jet test section is 4.3 m high by 6.1 m wide.
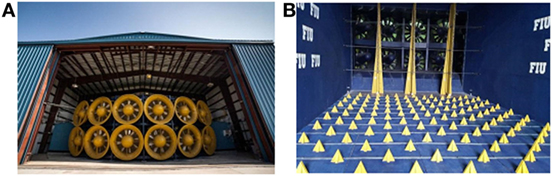
Figure 1. Wall of Wind (WOW) at Florida International University: (A) 12 fans; (B) spires and roughness elements.
The velocity and turbulence intensity profiles corresponding to an open terrain ABL simulation used for this experiment are shown in Figure 2. Wind velocities were measured by Cobra probes (Turbulent Flow Instrumentation, 2008). The velocity profile plot is normalized with the mean wind speed of 28.4 m/s at the reference height, which is taken as the test building model eave height (2.34 m).
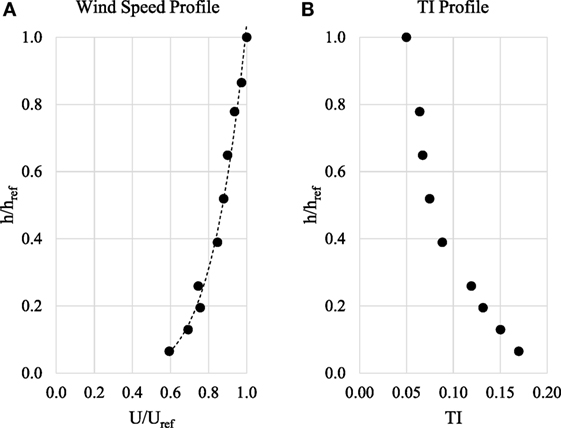
Figure 2. ABL characteristics measured in the WOW: (A) velocity profile; (B) turbulence intensity profile.
Building Model Used for the Study
The wood frame building model used for the study had plan dimensions of 2.43 m × 2.74 m and eave height of 2.34 m. The wood frame building was sheathed by a layer of plywood over which a moisture barrier layer was applied and was then covered by the vinyl siding. Figure 3 shows a view of the finished building placed on the turntable. The vinyl siding consisted of several individual panels that were connected to the building wall sheathing using nails (using spacing of 23 cm or 9″). In order to collect the pressure data on the vinyl siding, one side of the building was instrumented with 49 pressure taps on both the exterior surface of the siding and on the plywood layer. The schematic of Figure 4A shows the locations of the exterior, cavity, and internal taps, that is, (i) exterior taps on the vinyl siding to measure external pressures, (ii) cavity taps on the inner layer (plywood with moisture barrier) to measure pressures in the cavity between the vinyl siding and the inner layer, and (iii) internal taps inside the building model to measure building internal pressures. The model had a total of 102 taps. Sample taps on the building model are shown in Figure 4B, while Figure 4C shows the location of the taps on the building wall and the cavity.
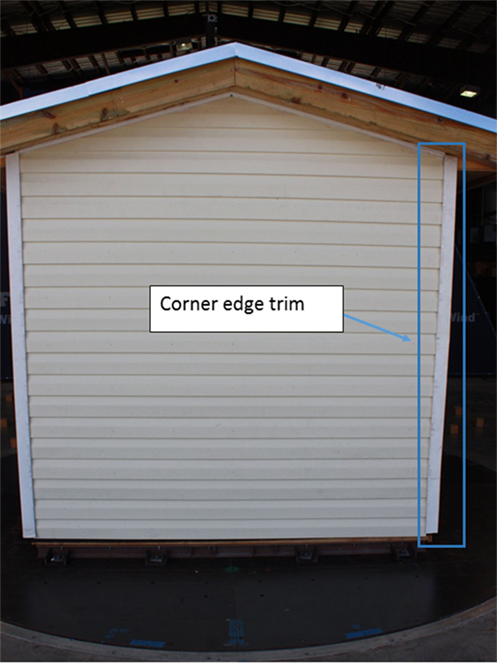
Figure 3. Building model on the turntable.
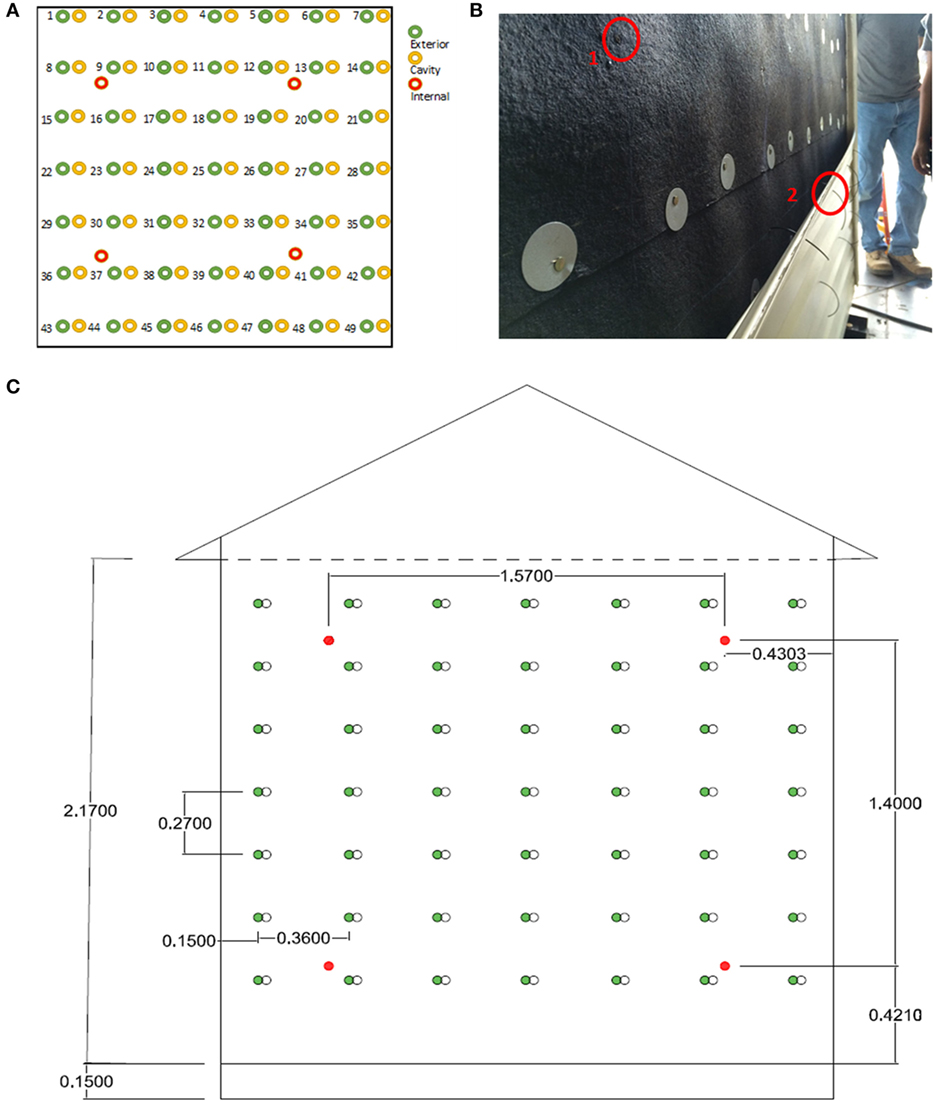
Figure 4. (A) Schematic showing the locations of taps, (B) circles marked as 1 and 2 show sample cavity and exterior surface tap locations, (C) location of taps on the vinyl wall siding (locations marked in green are exterior taps, those marked in red are interior taps, while the remaining taps are located within the cavity).
The model was placed on a turntable, which was rotated to test for wind directions ranging from 0° to 180°, where 0° is wind normal to the wall with siding (shown using bold line in Figure 5A). A section of the wall showing the various parts of the vinyl wall siding is shown in Figure 5B. The pressure data collected on the test model wall system were sampled at a rate of 512 s−1 using a “Scanivalve ZOC 33” miniature pressure system (Scanivalve Corporation, 2013). A tubing transfer function was used to correct for the distortion effects introduced by the tubing (Irwin et al., 1979). The partial turbulence simulation (PTS) technique was used to determine the peak pressure coefficients, as described in Asghari Mooneghi et al. (2016). The PTS technique focuses on obtaining a good match of the high frequency part of the turbulence spectrum, while the effect of the missing low frequency part of the spectrum for large scale models is compensated in the post-test analysis process through a quasi-steady approach. This peak analysis method was used to study the area-averaged net loads on the entire wall. To study the PEF for individual taps or combination of them, observed peaks of instantaneous load summations were calculated, which will be discussed in the following sections.
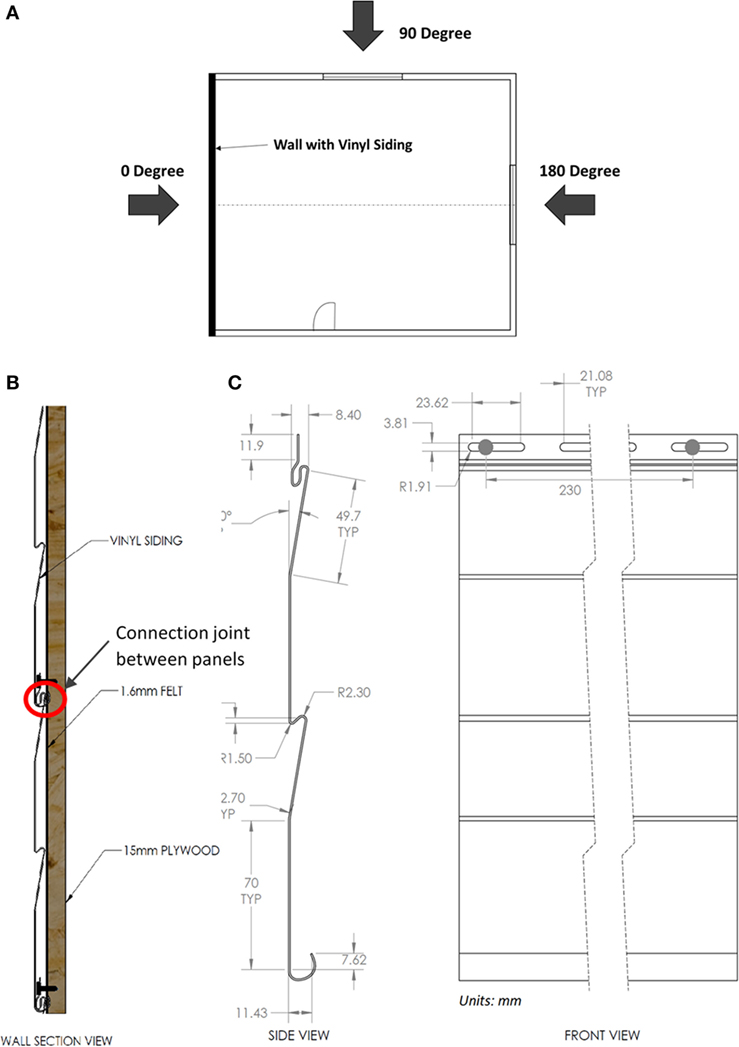
Figure 5. Building model used for the study: (A) plan view and the convention for wind direction; (B) vertical section showing the various parts of the vinyl siding; (C) side and front views of one siding panel (showing nail connections).
Data Analysis Methods
The collected pressures at each of the taps were initially area averaged over the whole wall area to obtain the mean and peak area-averaged pressure coefficients using Eqs 1 and 2.
where Pmean and Ppeak are the mean and peak area-averaged pressures, respectively, and Umean and U3s are the mean and peak (i.e., 3 s) wind speed at the eave height, respectively.
To study the extent of wind load reduction on the siding, peak pressure coefficients on the exterior side of the wall and in the cavity are reported herein, followed by the net peak Cp coefficients on the vinyl siding. The area-averaged peak net pressures were calculated based on the instantaneous pressure differences across each layer to provide an understanding of the pressure equalization phenomenon. In this paper, the terms “pressure” and “suction” have been used to indicate positive and negative pressure differences (relative to an ambient reference pressure), respectively.
However, to further examine the degree of load reduction and the effect of including various areas in the calculation of the PEF, individual taps as well as various combinations of multiple taps were considered. Two methods for calculating the PEF are reported in the literature. One method is based on the peak values over all the directions, which is similar to the approach used in the ASCE 7 for components and cladding (Cope et al., 2012). Following this concept, the PEF of peak values is defined in this paper by Eqs 3–7.
where Pext is the pressure on vinyl siding, Pcav is the pressure on the exterior side of the plywood, which is assumed to be same as the pressure in the cavity between vinyl siding and plywood, and Pint is the internal pressure in the building, as illustrated in Figure 6.
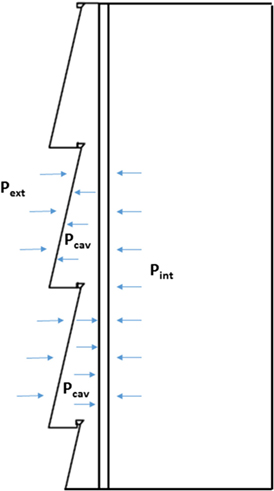
Figure 6. Schematic of the wall section and the locations of pressure measurements.
Then ΔP1,max and ΔPtotal, max are defined, respectively, as the peak values of the ΔP1 and ΔPtotal over all wind directions. The parameter θ denotes the direction as defined in Figure 5. Having ΔP1,max and ΔPtotal, max, the PEFi is calculated for each tap location. Also to calculate the PEF for a group of taps, ΔP1(t,θ) and ΔPtotal(t,θ) should be constructed by summation of instantaneous load vectors formed on the tributary areas of each included tap.
The other method used is to calculate instantaneous PEFs for individual taps or a combination of adjacent taps and generate a time history of PEFs (Cope et al., 2012; NAHBRC, 2012). The PEF time history is calculated for all wind directions and is plotted against the time history of the external pressure exerted on the tributary area of each tap, which eventually produces a plot with a wide dispersion, especially at the lower magnitudes of external pressures. As a result, higher PEFs are obtained at lower external pressure. When used with the worst case exterior pressure, these PEFs could lead to highly conservative results. Therefore, the method of maximum PEFs (Eq. 7) is deemed more appropriate for practical design applications.
Since code provisions provide the worst case combination of exterior and internal pressures, the PEF can be applied to obtain the critical net load on the siding as expressed by Eq. 8.
where qh is velocity pressure, and GCp and GCpi are external and internal pressures, respectively, as described by ASCE7-10 Eq. 30.4-1.
The pressure equalization across a component of the wall is dependent on the instantaneous pressures on both sides on that component as conceptualized using the schematic shown in Figure 6. As explained earlier, the net pressure on the vinyl siding is represented as ΔP1 = (Pext − Pcav), where Pext is the external pressure on vinyl siding and Pcav is the pressure inside the cavity between the vinyl siding and the plywood sheathing. Pressure equalization across the vinyl siding will be significant when the external pressure and the cavity pressure act in opposite directions and have comparable magnitudes. As noted in Figure 3, the corners of the building model were fitted with vertical L-shaped edge trim fittings, which ensure that there is not an opening at the extremities. In addition, the vinyl siding panels were connected to each other using a sliding interlocking mechanism to minimize airflow and water intrusion through the overlaps. These design details are expected to minimize air leakage; however, this also reduces the effect of pressure equalization. The results presented in the study corroborate this phenomenon as they indicate a limited reduction of the net loading on vinyl siding due to pressure equalization.
Results and Discussion
Figures 7–9 illustrate the results for area-averaged mean and peak pressure coefficients over the entire wall, including (i) external pressures (measured on the vinyl siding), (ii) cavity pressures (measured on the plywood), and (iii) net pressures (based on instantaneous differences between the external and cavity pressures). Figure 7 shows that due to pressure equalization the peak Cp values obtained in the cavity and on the exterior of the wall are very comparable for all wind directions. As a result, for all tested wind directions the net peak Cp is considerably low. Figure 8 shows that the mean Cp values for the exterior and cavity had similar trends, as observed in the positive peak Cp plots. In a similar manner, the net mean Cp values are minimal for all wind directions. Finally, Figure 9 shows that peak Cp values (suction) for the exterior and cavity were also comparable for most of wind directions, except between 70° and 90°. For these directions, the net mean Cp values where higher. This observation is generally in agreement with past studies, in which a lower load reduction was observed for higher magnitudes of negative load (Kopp and Gavanski, 2011; Cope et al., 2012). Overall, the results show that for a non-sealed system (as the current vinyl wall siding), when pressures are averaged over a large area of the vinyl siding, significant pressure equalization is observed and net wind pressure is minimal. This effect has been captured in the current testing also. Results presented later (in Table 2) show that, in general, pressure equalization effects increase when pressures are averaged over larger areas, which reduce the net wind pressures.
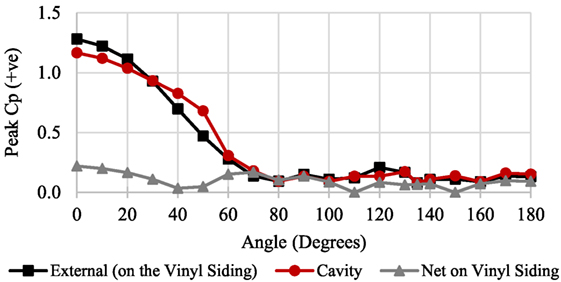
Figure 7. Positive peak Cp for vinyl siding and cavity over the entire wall area.
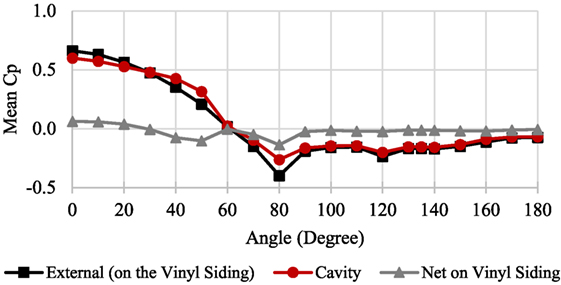
Figure 8. Mean Cp for vinyl siding and cavity over the entire wall area.
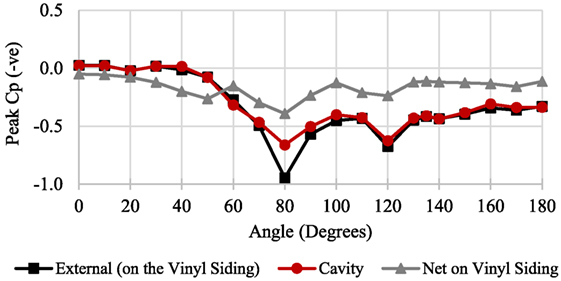
Figure 9. Negative peak Cp for vinyl siding and cavity over the entire wall area.
However, damage reconnaissance after high wind events indicated that the failure of siding is initiated by localized damage. Therefore, the analysis of the experimental data needs to take into consideration smaller tributary areas. Such areas can experience high localized wind loads that may cause local damage leading to progressive failures of large portions of the wall siding. The following section focuses on studying PEFs for smaller tributary areas comprising various combinations of taps.
Pressure Equalization Factors
The PEFs (as discussed earlier) were obtained for individual taps and combination of taps based on Eqs 3–7. Table 1 presents peak PEF values for individual tap locations (see Figure 4A for tap locations) for pressure coefficients with negative sign (suction) and positive sign (pressure). The PEF values shown in Table 1 are the highest (in magnitude) values obtained from all wind directions tested. The results indicate that when local pressure differences are considered, higher values of PEF are possible. Essentially, PEF values are expected to fall between 0 and 1, but the results of individual tap locations showed a few cases with PEFs greater than 1 or less than 0. A value greater than 1 indicates that the pressure on one side of a wall layer is of opposite sign to that on the other. In summary, the PEF values range from 71 to 106% for suctions and from 39 to 110% for pressures.
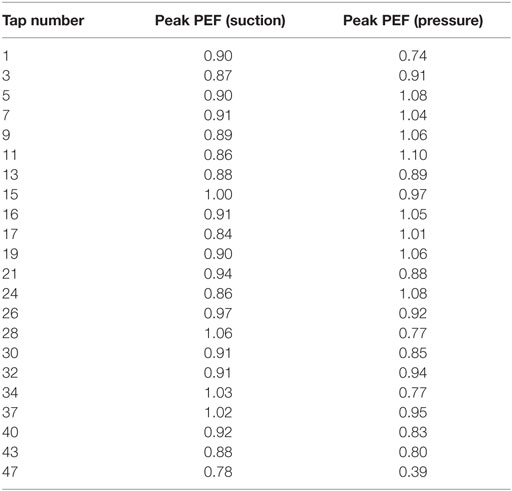
Table 1. Peak pressure equalization factor (PEF) values for individual tap locations.
As discussed previously, aside from looking at individual taps it is important to consider various combinations of multiple taps. The tap combinations considered in this study are shown in Figure 10. The tap combinations were mainly chosen to capture wind effects on tributary areas for one or more connections (i.e., nails connecting the vinyl siding panels to the wall sheathing). This was considered to be important as damages often occur when a single connection fails or a group of connections fail. When considering smaller numbers of taps, such as in combinations C1, C2, C3, C6, and C7, the taps were chosen in one or two row(s) [instead of in column(s)] as that would engage one or more nails attaching the siding panels, which were oriented horizontally as shown in Figure 3. Table 2 presents peak PEF values for a combination of taps as well as the corresponding area covered by those taps. The findings show some considerable differences compared to the individual tap approach. For instance, by considering taps 16 and 17 in case 1 (shown as “C1” in Figure 10B), a peak suction PEF of 0.83 was obtained, which means that the load reduction due to pressure equalization is about 17%—note that the load reduction when taps 16 and 17 were considered individually was 9 and 16% respectively. According to Table 2, PEFs range from 52 to 83% for the case of “suctions” and between 13 and 74% for the case of “pressures.”
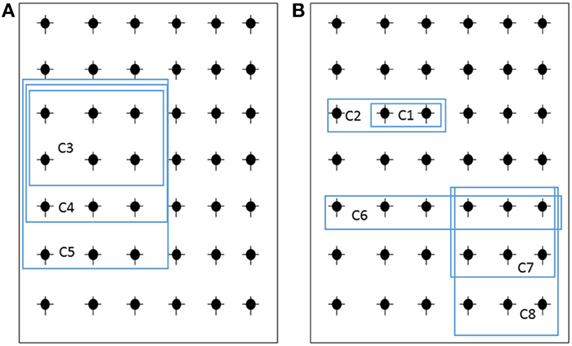
Figure 10. Notation of tap combinations considered in the study; (A) cases 3–5, (B) cases 1–2; 6–8.
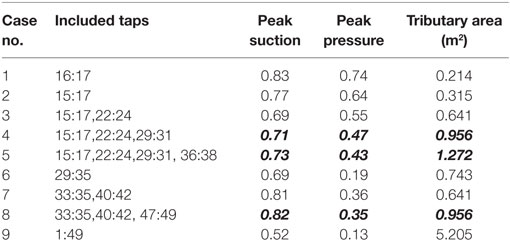
Table 2. Peak PEF values for combinations of adjacent taps.
These results are considerably different from those of pressure chamber tests addressed earlier. However, they are in close agreement with the full-scale study conducted at IBHS (Cope et al., 2012), the result of which indicated that the vinyl siding was subjected to 75–80% of the “suction” design pressures. ASCE 7 wind load provisions use a smallest tributary area of about 1 m2 to estimate localized design pressures for component and cladding elements of buildings. Table 2 shows in bold italic the WOW test-based PEF values for similar tributary areas. The average of these values indicate that for tributary areas of about 1 m2 the design wind loads can be estimated by using PEF values of 0.75 and 0.4 for “suctions” and “pressure” loading, respectively. This suggests that based on Eq. 8, the net load on vinyl wall siding can be obtained by reducing the net design load for the entire wall assembly by 25 and 60% for “suction” and “pressure” loading, respectively. However, it might be more relevant to relate the results to a smaller tributary area (<1 m2) experiencing a local peak load that can induce damage to connections, especially in the case of relatively flexible wall coverings, with no or very little load sharing between connection points. This aspect of smaller tributary areas is relevant to higher maximum loads on the connections (fixings) leading to the initiation of damage to vinyl siding. Depending on the installation method and considering the tributary area of the connections, the effective area may be much smaller than 1 m2, as is the case for C1 and C2 in Figure 10 (which represent the tributary areas for three and five nail connections, respectively). Based on this study, for smaller areas (~0.2 m2) the allowable percentage reductions should not be more than 15 and 25% for suctions and pressures, respectively. It should be emphasized that connection failures will be generally due to suctions.
As discussed earlier and also indicated in Table 2 (and Figures 7–9), when considering the entire wall, there is an increased effect of pressure equalization. This could be attributed to the lack of correlation of external pressures on the vinyl siding over a larger area. The cavity pressure is expected to be more uniform as compared to the external pressure. As a result, the net pressure on the vinyl siding, represented as ΔP1 = (Pext − Pcav), is expected to be smaller in magnitude when averaged over a larger area, which implies higher pressure equalization. As the tributary area reduces (such as for smaller areas as C1), the correlation of external pressures increases, which leads to limited load reduction. Further study is recommended to delve into the aspect of spatial and temporal correlations of external and cavity pressures to improve our understanding of effects of tributary areas on pressure equalizations. Further testing is also needed to consider more types of vinyl siding systems (with different design configurations, panel flexibility, corner details, etc.) when developing adequate design load guidelines for vinyl wall sidings and their connections.
Conclusion
This paper presented results from an experimental study conducted at the WOW experimental facility at FIU to study wind effects on vinyl siding on low-rise buildings. One of the walls of a full-scale test building was cladded with vinyl siding and instrumented to estimate net pressures across the siding and across the entire wall system as a function of different wind directions. The findings from this study indicated that when the area being considered is the whole wall, area-averaged mean and peak pressure coefficients, indicate very low net loads on the wall siding. However, designing vinyl wall siding for these low net loads may not be adequate, as was indicated by the poor performance of vinyl wall systems during past high wind events where most of the failures were initiated by local damages. Thus, it deemed necessary to study localized wind pressures that may lead to local damages and cascading failures.
To study local wind pressures on the wall siding, PEFs were calculated for various tributary areas. Results indicated that for individual points PEFs are not less than about 70% for cases of negative pressure coefficients and about 40% for cases of pressure coefficients with positive sign (pressure). When tap combinations covering larger areas were considered, PEFs ranged from approximately 50 to 80% for cases of pressure coefficients with negative sign (suction) and from 15 to 75% for cases of “pressure.” According to various cases considered, the average wind pressure carried by the vinyl siding is about 75% of the design suction pressure for the whole wall assembly and about 40% of the “pressure.” These results indicate that the suggested ASTM PEF of 0.36 is somewhat unconservative for the design of details and local supports. The current results suggest that the net load on vinyl wall siding for 1 m2 of tributary area can be obtained by applying PEFs of 0.75 and 0.40 to the net design “suction” and “pressure” loading, across the whole wall assembly, respectively. However, for smaller tributary areas (~0.2 m2), the PEF should be about 0.85 to help prevent local failure of connection(s) that could lead to cascading failure. Further research on pressure equalization on vinyl siding cladded wall systems is needed to explore the effects of different size internal cavities and different types of siding materials and wall details. Future studies on this topic should also consider other factors such as different ratio of plan dimensions, change in building height, etc. This will help to establish appropriate wind design provisions to lessen the risk of damage to vinyl wall sidings under high winds.
Author Contributions
MM is a Ph.D. student supervised by AC (associate professor in CEE, FIU) and PI (professor of practice in CEE, FIU). MM has carried out most of the data analysis along with PI and AC as part of a research project funded by “The State of Florida Division of Emergency Management” and has written sections of this paper in collaboration with co-authors. BH is a research scientist at the WOW at FIU and has carried out data analysis, in addition to writing parts of this paper. IZ is an assistant professor at the CEE at FIU and has reviewed the results presented and developed the structure of the paper, in addition to checking all the data collected during the experiments and revising the manuscript.
Conflict of Interest Statement
The authors declare that the research was conducted in the absence of any commercial or financial relationships that could be construed as a potential conflict of interest.
Acknowledgments
The authors greatly acknowledge the help offered by Walter Conklin and Roy Liu-Marques to conduct the experiments at FIU Wall of Wind. Also, The authors acknowledge Jorge Damas for his valuable help with the technical drawings presented in this paper.
Funding
The authors would like to acknowledge the financial contributions of the State of Florida Division of Emergency Management, USA, and also support from the National Science Foundation (NSF Award No. CMMI-1151003).
References
Amano, T., Fujii, K., and Tazaki, S. (1988). Wind loads on permeable roof-blocks in roof insulation systems. J. Wind Eng. Ind. Aerodyn. 29, 39–48. doi: 10.1016/0167-6105(88)90143-2
Architectural Testing Inc. (2002). Wind Pressure Equalization Research Project Report. No. 01-40776.01. Washington, DC: Vinyl Siding Institute. Available at: https://www.vinylsiding.org/
ASCE 7-10 Standard. (2010). Minimum Design Loads for Buildings and Other Structures. Reston, VA: American Society of Civil Engineers.
Asghari Mooneghi, M., Irwin, P., and Gan Chowdhury, A. (2016). Partial turbulence simulation method for predicting peak wind loads on small structures and building appurtenances. J. Wind Eng. Ind. Aerodyn. 157, 47–62. doi:10.1016/j.jweia.2016.08.003
ASTM Standard D3679. (2009). Standard Specification for Rigid Poly Vinyl Chloride (PVC) Siding. West Conshohocken, PA: ASTM International.
ASTM Standard D3679. (2013). Standard Specification for Rigid Poly Vinyl Chloride (PVC) Siding. West Conshohocken, PA: ASTM International.
Cheung, J. C. K., and Melbourne, W. H. (1988). Wind loading on a porous roof. J. Wind Eng. Ind. Aerodyn. 29, 19–28. doi:10.1016/0167-6105(88)90141-9
Cope, A., Crandell, J., Liu, Z., and Stevig, L. (2014). Wind loads on fasteners used to attach flexible porous siding on multi-layer wall systems. J. Wind Eng. Ind. Aerodyn. 133, 150–159. doi:10.1016/j.jweia.2014.06.007
Cope, A. D., Crandell, J. H., Johnston, D., Kochkin, V., Liu, Z., Stevig, L., et al. (2012). “Wind loads on components of multi-layer wall systems with air-permeable exterior cladding”, in Advances in Hurricane Engineering : Learning from Our Past (American Society of Civil Engineers), 238–257. doi:10.1061/9780784412626.022
Irwin, H. P. A. H., Cooper, K. R., and Girard, R. (1979). Correction of distortion effects caused by tubing systems in measurements of fluctuating pressures. J. Wind Eng. Ind. Aerodyn. 5, 93–107. doi:10.1016/0167-6105(79)90026-6
Kochkin, V., Davies, R., and DeRenzis, A. (2012). “Evaluation of the wind pressure performance of walls with exterior rigid foam sheathing”, in Advances in Hurricane Engineering : Learning from Our Past (American Society of Civil Engineers), 258–269. doi:10.1061/9780784412626.023
Kopp, G., and Gavanski, E. (2011). Effects of pressure equalization on the performance of residential wall systems under extreme wind loads. J. Struct. Eng. 138, 526–538. doi:10.1061/(ASCE)ST.1943-541X.0000476
Kramer, C., Gerhardt, H. J., and Kuster, H. W. (1979). On the wind-loading mechanism of roofing elements. J. Wind Eng. Ind. Aerodyn. 4, 415–427. doi:10.1016/0167-6105(79)90016-3
Miller, C., Kopp, G., and Morrison, M. (2015). “Pressure equalization in residential wall cladding systems,” in Presented at the 14th International Conference on Wind Engineering, Porto Alegre, Brazil.
Moravej, M., Gan Chowdhury, A., Zisis, I., Irwin, P., and Hajra, B. (2016). “The effect of a shutter on the wind induced loads on a window and wind driven rain intrusion into the building through experiments at the Wall of Wind Experimental Facility,” in 8th International Colloquium on Bluff Body Aerodynamics and Applications (Boston: Northeastern University).
National Association of Home Builders Research Center (NAHBRC). (2012). Evaluation of the Wind Pressure Performance of Walls with Exterior Rigid Foam Sheathing. Upper Marlboro, MD: NAHB Research Center, Inc.
Oh, J. H., and Kopp, G. A. (2014). Modelling of spatially and temporally-varying cavity pressures in air-permeable, double-layer roof systems. Build. Environ. 82, 135–150. doi:10.1016/j.buildenv.2014.08.008
Scanivalve Corporation. (2013). ZOC 33/64Px Electronic Pressure Scanning Module, Instruction and Service Module. Liberty Lake, WA: Scanivalve Corporation. Available at: www.scanivalve.com
Suresh Kumar, K. (2000). Pressure equalization of rainscreen walls: a critical review. Build. Environ. 35, 161–179. doi:10.1016/S0360-1323(99)00015-3
TenWolde, A., Carll, C. G., and Malinauskas, V. (1999). “Air pressures in wood frame walls,” in Proceedings Thermal VII (Atlanta: ASHRAE Publications).
Turbulent Flow Instrumentation. (2008). Series 100 Cobra Probe Manual, Turbulent Flow Instrumentation. 1–13. Available at: http://www.turbulentflow.com.au/
Van Bentum, C., and Geurts, C. (2015). “Full scale measurements of pressure equalization on air permeable façade elements,” in Presented at the ICWE14 (Porto Alegre, Brazil).
Keywords: pressure equalization factor, vinyl siding, PVC siding, multi-layer wall, wall of wind, low-rise building
Citation: Moravej M, Zisis I, Chowdhury AG, Irwin P and Hajra B (2016) Experimental Assessment of Wind Loads on Vinyl Wall Siding. Front. Built Environ. 2:35. doi: 10.3389/fbuil.2016.00035
Received: 01 October 2016; Accepted: 12 December 2016;
Published: 27 December 2016
Edited by:
Gregory Alan Kopp, University of Western Ontario, CanadaReviewed by:
Bochao Cao, Fudan University, ChinaDorothy Reed, University of Washington, USA
Chris Geurts, Netherlands Organisation for Applied Scientific Research, Netherlands
Copyright: © 2016 Moravej, Zisis, Chowdhury, Irwin and Hajra. This is an open-access article distributed under the terms of the Creative Commons Attribution License (CC BY). The use, distribution or reproduction in other forums is permitted, provided the original author(s) or licensor are credited and that the original publication in this journal is cited, in accordance with accepted academic practice. No use, distribution or reproduction is permitted which does not comply with these terms.
*Correspondence: Ioannis Zisis, aXppc2lzQGZpdS5lZHU=