 Shuichi Kamagata
 Izuru Takewaki
- 1Nuclear Power Department, Kajima Corporation, Tokyo, Japan
- 2Department of Architecture and Architectural Engineering, Graduate School of Engineering, Kyoto University, Kyoto, Japan
The KiK-net is a vertical array system, and seismic motions are recorded at the ground surface and in the borehole. With the peak acceleration of 24.5 m/s2 at AKTH04 (EW) and 38.7 m/s2 at IWTH25 (UD) during the Iwate–Miyagi Nairiku earthquake in 2008, the occurrence mechanism of large accelerations is investigated by the non-stationary Fourier spectra and the double integrated displacement profile. From the difference in the occurrence time, the frequency, and the amplitude of dominant components between the surface and the borehole, it is clear that the amplification in the surface soil caused the large acceleration at the surface. In the deformation process of the surface soil, the whipping mode is picked up at AKTH04. The relative displacement profile between the surface and the borehole is analyzed by the phase curves. The orbit at AKTH04 is identified by the sinusoidal waves of the sway, up–down, and rocking modes. It can be concluded that the large accelerations at AKTH04 may be due to an irregular local mode caused by the collision between the base-mat and surrounding soil. From the orbit at IWTH25, the vertical pulse can be regarded as “an induced vertical motion” due to the collision between the base-mat of an observation house and the soil beneath it.
Introduction
After the Hyogoken-Nanbu earthquake in 1995 (moment magnitude Mw = 6.9), the importance of seismic records was re-recognized for mitigation of seismic hazard, and the Strong-motion Seismograph Networks (K-NET, KiK-net) were established by the National Research Institute for Earth Science Disaster Prevention (NIED, 2016) in 1996. The number of seismic events with Mw 6.0 or larger measured by K-NET and KiK-net and the maximum magnitude from 1996 to 2017 (January) are illustrated in Figure 1.
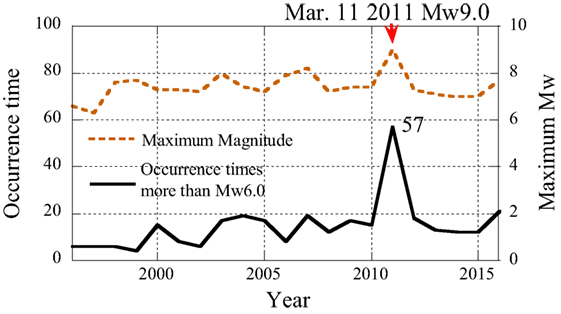
Figure 1. Seismic events recorded by K-NET and KiK-net (as of January, 2017).
Forty-eight seismic records (as of January 2017) with the peak acceleration larger than the acceleration of gravity alerted us to the reevaluation of the seismic design force for nuclear facilities. The Nuclear Safety Commission of Japan (NSC) started the reevaluation of the Nuclear Reactor Regulations in June 2001. The specialist working group for the Nuclear Reactor Regulation reported the revised version in May 2006, and the NSC revised the Regulation in September 2006 (The World Nuclear Association, 2016). The electric companies were requested to certify the soundness of the nuclear power plants for the revised regulation as the back-check. During the back-check process, three large seismic events attacked the nuclear power plants every 2 years, i.e., the Niigata-ken Chuetsu-oki earthquake in 2007 (MW 6.6), the Suruga Bay earthquake in 2009 (MW 6.3), and the 2011 off the Pacific coast of Tohoku earthquake (MW 9.0). The 2011 earthquake forced the upheaval of the Japanese nuclear policy. The Nuclear Regulation Authority was newly established in place of the Nuclear and Industry Safety Agency in 2012. The electric companies were forced to reevaluate the soundness of the nuclear power plants as the back-fit, which is against the non-retroactivity. The authors have investigated the occurrence mechanism of large accelerations, in which the non-linear interaction between a building and the surrounding soil was detected (Kamagata and Takewaki, 2013a,b; Kojima et al., 2014).
In the guideline of Japan Nuclear Energy Safety Organization (Kobayashi et al., 2014), 16 seismic events are listed up as the seismic events by hidden faults, 1 of which is the Iwate–Miyagi Nairiku earthquake in 2008 (MW 6.9). The seismic records with large accelerations, i.e., AKTH04 (EW) with 24.5 m/s2 and IWTH25 (UD) with 38.7 m/s2, were evaluated as the basis of seismic design motions with the peak value 20 m/s2 or larger.
Regarding the seismic records at IWTH25, many researchers investigated the occurrence mechanism of large accelerations from various viewpoints. Mogi et al. (2013) focused on the non-linearity of surface soil and evaluated the change of the shear wave velocity by the Normalized Input-Output Minimization analysis. Yamada et al. (2010) also focused on the non-linearity of surface soil and evaluated the deterioration ratio of the surface soil by the deconvolution method. Aoi et al. (2010) proposed the “trampoline effect” of surface soil. Tobita et al. (2010) supported the trampoline effect by the FEM analysis with the non-linear multiple simple shear mechanism. Yamada et al. (2009) also supported the trampoline effect by introducing the mechanism of slapdown and evaluated the uplifted amplitude of the near surface layer. Kinoshita (2011) also focused on the near surface layer and explained it as the “bouncing-ball effect.” All the above studies focus on the seismic behavior of surface soil from the geo-mechanical research field.
On the other hand, Ohmachi et al. (2011) introduced a different occurrence mechanism from the viewpoint of engineering. They insisted that the “collision between the base-mat of the observation house and the soil beneath it” caused the pulse-like wave with large acceleration. This may be an acceptable assumption from the engineering viewpoint. The collision between the base-mat and the below soil has been discussed as an “induced vertical motion” by the uplift of the base-mat in the seismic analysis of the nuclear power plant.
While Ohmachi et al. (2011) provided a hypothesis on the occurrence mechanism of large amplitudes of ground motions and investigated the validity of such hypothesis, the authors investigate the occurrence mechanisms by introducing the following unique approaches: (i) the non-stationary Fourier spectra for detecting the frequency components contributing to the pulse wave, (ii) the maximum amplitude spectra for detecting the amplitude values of dominant components, (iii) the double integrated displacement profile for identifying the displacement profile corresponding to the acceleration pulse, (iv) the deformation process of surface soil for detecting the seismic behavior, such as the whipping mode and uniform layered mode, (v) the relative displacement profile between the surface and the borehole for suggesting the deterioration state as the average shear strain, and (vi) the use of phase curve for identifying the sway, the up–down, and the rocking modes. From above analytical results, the authors attempt to investigate the occurrence mechanism of pulse wave at AKTH04 (EW) as the collision between the observation house and the side soil. Regarding the upward pulse at IWTH25 (UD), the collision between the observation house and the below soil is considered as the plausible occurrence mechanism of observed large acceleration.
Seismic Event of Iwate–Miyagi Nairiku Earthquake in 2008
The site map of AKTH04, IWTH25, and epicenter of the Iwate–Miyagi Nairiku earthquake are illustrated in Figure 2 together with the fault plane and the GPS-displacement (GSI, 2016). The maximum horizontal displacement of 1.533 m was measured at the GPS-based control point of Kurikoma-2. This is five times larger than those at the nearby GPS-based control points. The epicentral distance of IWTH25 is 3 km and that of AKTH04 is 22 km. The seismic event of the Iwate–Miyagi Nairiku earthquake in 2008 was reported by The Headquarters for Earthquake Research Promotion (2016).
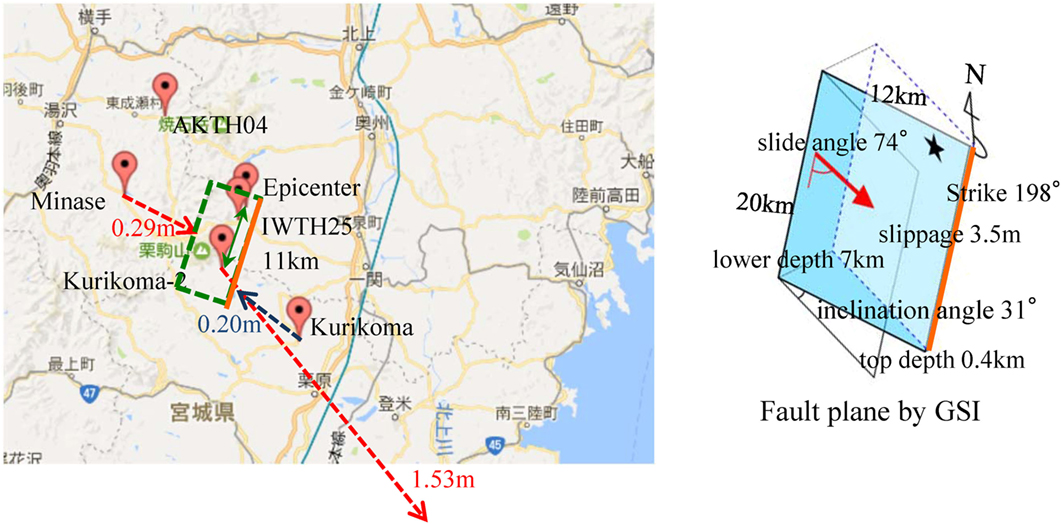
Figure 2. Seismic event of the Iwate–Miyagi Nairiku earthquake in 2008.
Regarding horizontal components at ground surface, the peak values at AKTH04 are larger than those at IWTH25. On the other hand, in vertical components at ground surface, the peak value at IWTH25 is larger than that at AKTH04. Since the epicentral distance of AKTH04 is greater than that of IWTH25, the large acceleration at AKTH04 may be caused by some amplification mechanisms in the propagation process from the borehole to the ground surface. At the borehole, the peak values at IWTH25 are larger than those at AKTH04. This is considered to be mainly related to the shorter epicentral distance. The amplification ratios at IWTH25 are smaller than those at AKTH04. This may be related to the amplification in the propagation process including the interaction between the observation house and the surrounding soil.
Analysis of Dominant Component Property by Non-Stationary Fourier Spectra
The property of distribution of dominant components is analyzed by the non-stationary Fourier spectra defined by Eq. 1:
where
; seismic acceleration record,
tj (j = 1, 2, …, M); j-th time, ωi (i = 1, 2, …, N/2); i-th frequency,
N; number of steps in FFT analysis,
M = T/ΔT; number of steps in sweep process,
T; duration time of seismic record,
ΔT; sweep interval time.
ta; width of data window (s).
The influence of data window width is shown in Supplementary Material.
The analytical result can be illustrated by the contours with the horizontal axis of time and the vertical axis of frequency. The contour level is normalized by the maximum value and is displayed in percentage. The maximum amplitude spectra are introduced by Eq. 2 to evaluate the amplitudes of dominant component. Also, the peak amplitude (VPA) is defined by Eq. 3.
Non-Stationary Fourier Spectra of AKTH04
In order to compare the property of dominant components between the surface and the borehole, the non-stationary Fourier spectra and the maximum amplitude spectra are illustrated with acceleration profiles in Figure 3. The peak accelerations at the surface and the borehole are listed with the amplification ratio in Table 1. In the acceleration profiles of AKTH04 (EW), the peak acceleration 24.5 m/s2 occurred as the single downward pulse wave.
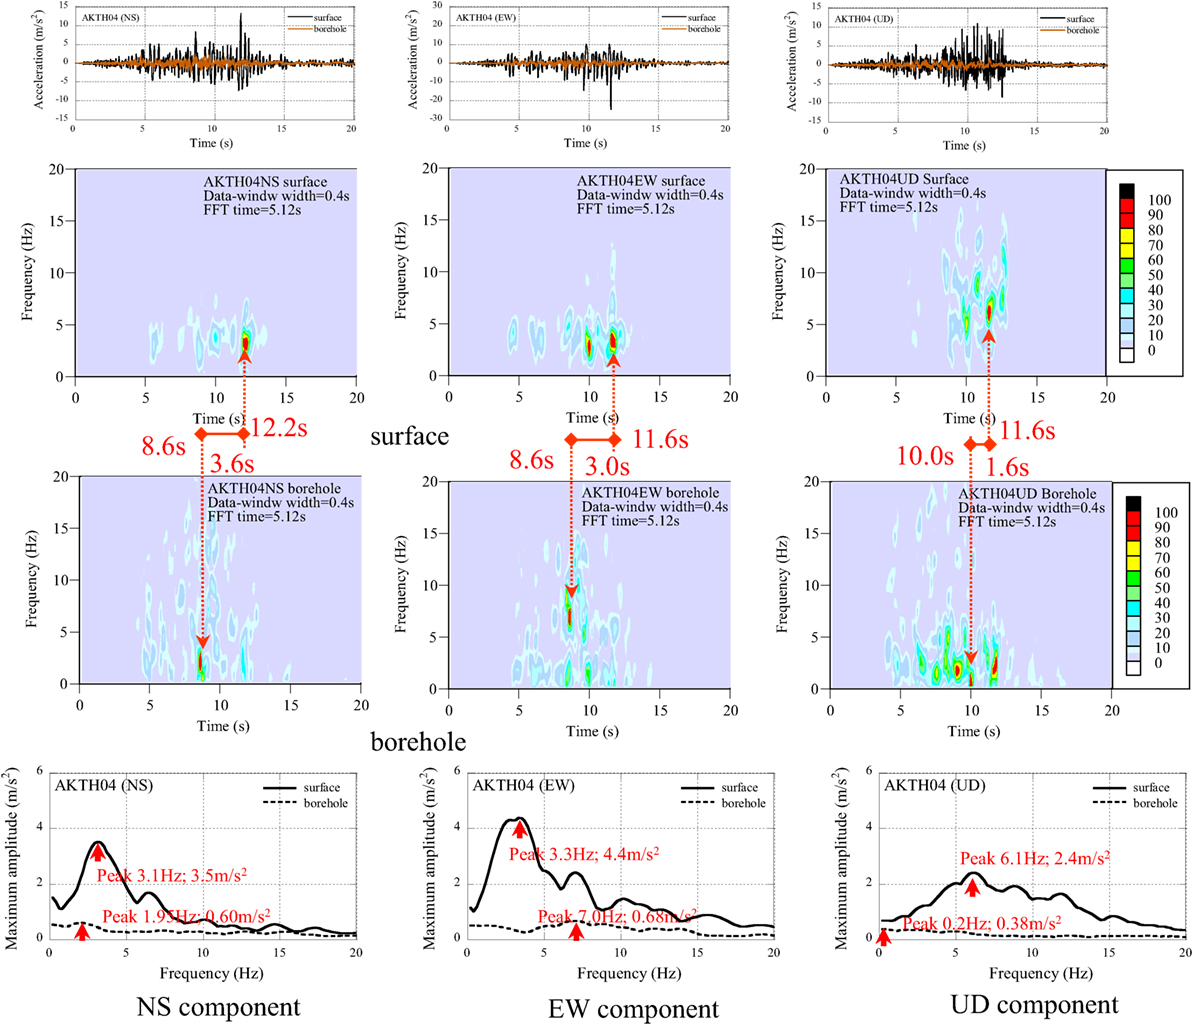
Figure 3. Acceleration profiles, non-stationary Fourier spectra, and maximum amplitude spectra of AKTH04.
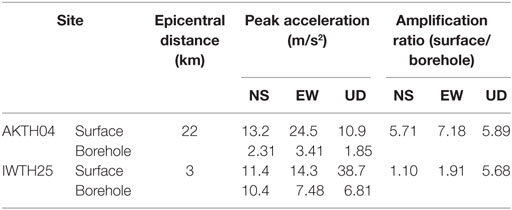
Table 1. Peak accelerations and amplification ratio (surface/borehole).
The property of dominant components was analyzed as follows:
(1) The peak components at the borehole arrived earlier than the peak components at the surface.
(2) The dominant components at the surface occurred in a narrow frequency range, and those at the borehole occurred in a wide frequency range.
(3) The maximum amplitudes of the peak components at the surface are larger than those at the borehole.
The analytical results suggest that the dominant components at the surface were amplified in the propagation process from the borehole to the surface.
Non-Stationary Fourier Spectra at IWTH25
Consider next the NS, EW, and UD components at IWTH25. The acceleration profiles, the non-stationary Fourier spectra, and the maximum amplitude spectra are compared in Figure 4 between the surface and the borehole. In the acceleration profiles of IWTH25 (UD), the peak acceleration 38.7 m/s2 occurred as the maximum pulses of several upward pulses.
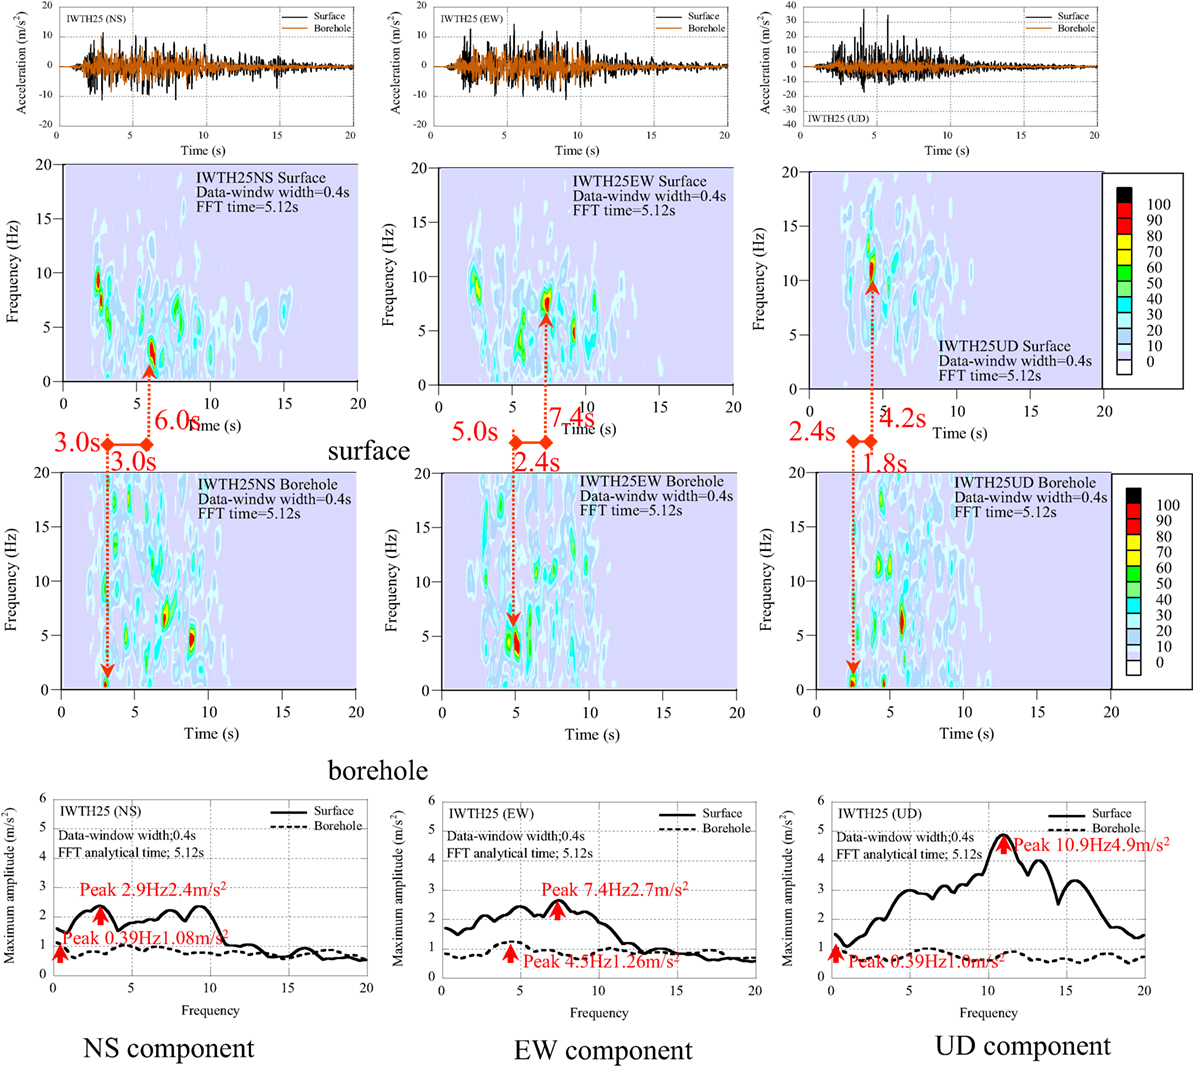
Figure 4. Acceleration profiles, non-stationary Fourier spectra, and maximum amplitude spectra of IWTH25.
The property of dominant components was analyzed as follows:
(1) The dominant components at the surface in the NS and EW components scatter in the frequency range of 10 Hz or smaller with the amplitude values of 2.0 m/s2 or larger.
(2) The dominant components at the surface in the UD component scatter in the wide frequency range of 20 Hz or smaller with the amplitude of 3.0 m/s2 or larger.
The analytical results indicate that the large accelerations at the surface in the UD component were caused by the superposition of several higher frequency components from 5 to 17 Hz.
The peak and average values of dominant components are listed in Table 2 with the average amplification ratio (surface/borehole). The property of dominant components was analyzed as follows:
(1) At the surface at AKTH04, the peak maximum amplitude occurred in the EW component at the frequency of 3.3 Hz with the amplitude 4.4 m/s2, and the average value is 1.65 m/s2.
(2) At the surface at IWTH25, the peak maximum amplitude occurred in the UD component at the frequency of 10.9 Hz with the amplitude of 4.89 m/s2, and the average value is 2.80 m/s2.
(3) At the borehole at AKTH04, the peak maximum amplitude occurred in the EW component at the frequency of 7.0 Hz with the amplitude of 0.68 m/s2, and the average value is 0.38 m/s2.
(4) At the borehole at IWTH25, the peak maximum amplitude occurred in the EW component at the frequency of 4.5 Hz with the amplitude of 1.26 m/s2, and the average value is 0.88 m/s2.
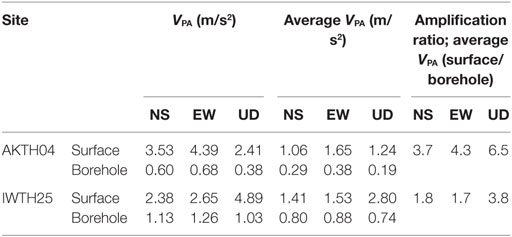
Table 2. Amplitude of dominant components.
The VPA and the average VPA in the borehole at IWTH25 are almost two times larger than those at AKTH04. This may be related to the difference of epicentral distance, i.e., IWTH25 (3 km) and AKTH04 (22 km). The dominant components in the borehole are considered to be related to the radiated components at the seismic asperity.
On the other hand, the peak value in the horizontal components at the surface at AKTH04 is larger than those at IWTH25. This may be related to the amplification property of the surface soil. The peak value in the UD component at the surface at IWTH25 is significantly amplified.
Analysis of Double Integrated Displacement Profiles
In order to identify the occurrence mechanism of pulse waves, the double integrated displacement profile has been analyzed. Since the pulse wave is considered to be composed of high frequency components, the band-pass filter, as shown Figure 5, is adopted to eliminate the low frequency components. Four kinds of cutoff range are set in the lower frequency range as shown in Table 3.
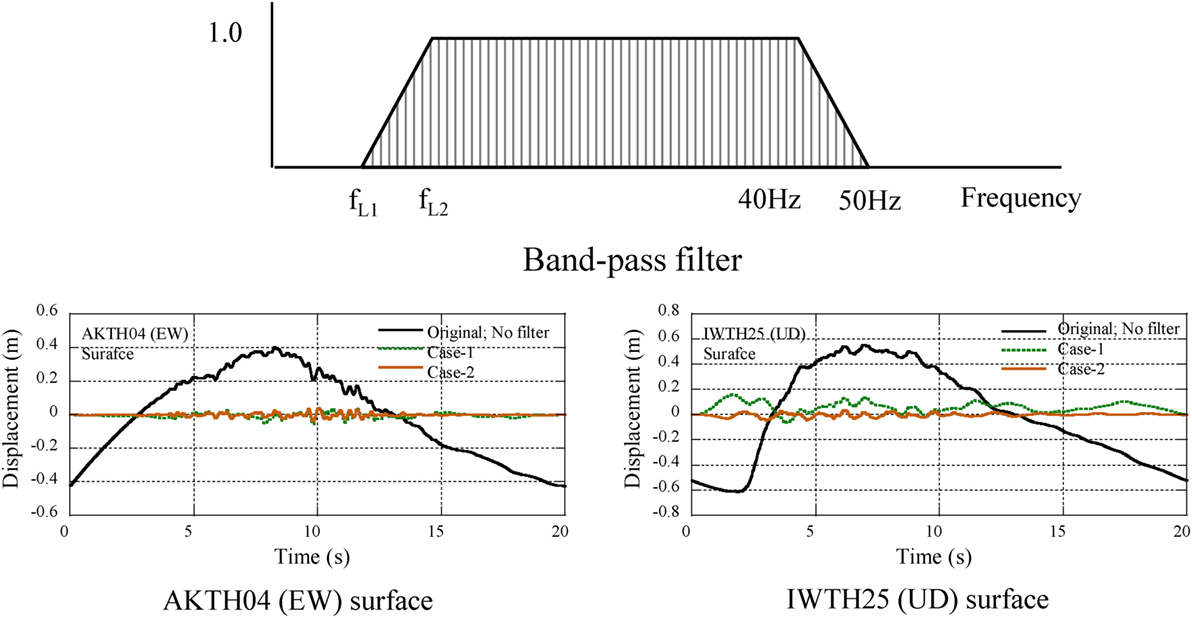
Figure 5. Double integrated displacement profiles.
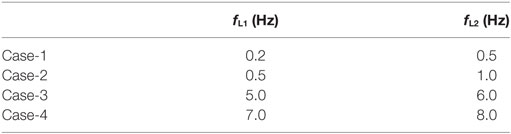
Table 3. List of cutoff range.
The difference in displacement profiles by the band-pass filter has been investigated. Three kinds of double integrated displacement profiles at AKTH04 and IWTH25 are illustrated in Figure 5. One is the double integrated displacement profiles of the original seismic record, and the others are those of Case-1 and Case-2. Regarding AKTH04 (EW), the profile of Case-1 has a smaller difference from that of Case-2. For IWTH25 (UD), the profile of Case-1 has an upward drift component and that of Case-2 has no drift component. Therefore, the double integrated displacement profiles of Case-2 have been adopted to evaluate the seismic behavior at the surface and the borehole.
Seismic Behavior of Surface Soil
The displacement profiles (Case-2) at AKTH04 (EW) and IWTH25 (EW) are illustrated in Figure 6. The shaded parts are illustrated as the deformation process of the surface soil with the interval time of 0.05 s (AKTH04) and 0.1 s (IWTH25). The maximum peak-to-peak displacement at AKTH04 (EW) occurs in the interval from 9.85 to 10.05 s. The amplitude is 0.077 m at the surface and 0.0128 m at the borehole, and the amplification ratio is 6.0. The maximum peak-to-peak displacement at IWTH25 (EW) occurs in the interval from 4.6 to 5.1 s. The amplitude is 0.10 m at the surface and 0.031 m at the borehole, and the amplification ratio is 3.3.
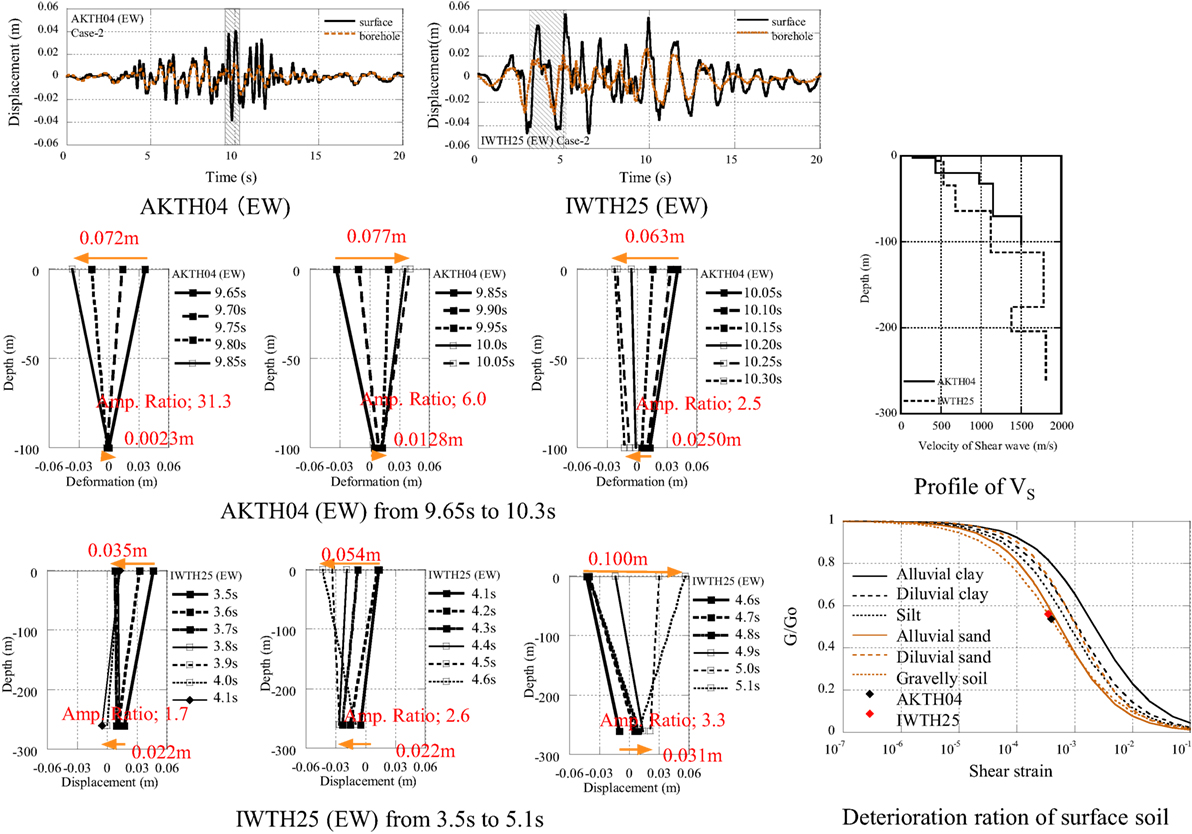
Figure 6. Deformation process of surface soil of AKTH04 (EW) and IWTH25 (EW).
This vibration property is consistent with the shear wave velocity (VS) in the surface soil as shown in Figure 6. Comparing the VS up to 100 m depth, the VS at AKTH04 is larger than that at IWTHH25. The seismic record at the surface is estimated to be influenced by the top soil. On the other hand, the shear wave velocity at the borehole is 1,500 m/s at AKTH04 and 1,810 m/s at IWTH25. These satisfy the engineering bedrock condition of the shear wave velocity 700 m/s or larger.
Comparing the time interval from peak-to-peak, the time interval at AKTH04 is shorter than that at IWTH25. This suggests that the frequency in the surface soil at AKTH04 is higher than that at IWTH25. As for the amplification from the borehole to the surface, the amplification ratio at AKTH04 is larger than that at IWTH25. Comparing the deformation processes in the surface soil between AKTH04 and IWTH25, the whipping mode is predominant in the surface soil at AKTH04. On the other hand, the uniform layered mode is predominant in the surface soil at IWTH25. These properties are consistent with the property of VS profile.
In order to evaluate the seismic behavior of the surface soil, the authors introduce the relative displacement between the surface and the borehole. Using the relative displacement, the shear strain profile can be calculated by dividing the relative displacement by the distance from the borehole to the surface. Assuming the soil condition as the gravel soil, the maximum shear strain at AKTH04 and IWTH25 are plotted in G − γ relation (see Figure 6). The soil state during the seismic event is estimated to be in a deteriorated state (the ratio of stiffness is 0.6 or smaller). Many seismic records in KiK-net with the peak acceleration of 10 m/s2 or larger have been analyzed. The deterioration ratio of 0.6 or smaller was approximately average. Therefore, it may be concluded that the derived deterioration ratios have less influence on the large acceleration.
Amplification in Surface Soil
For the AKTH04 (EW), the distribution property of dominant components in the displacement profiles at the surface and the borehole is compared with that in the relative displacement profile by using the non-stationary Fourier spectra as shown in Figure 7.
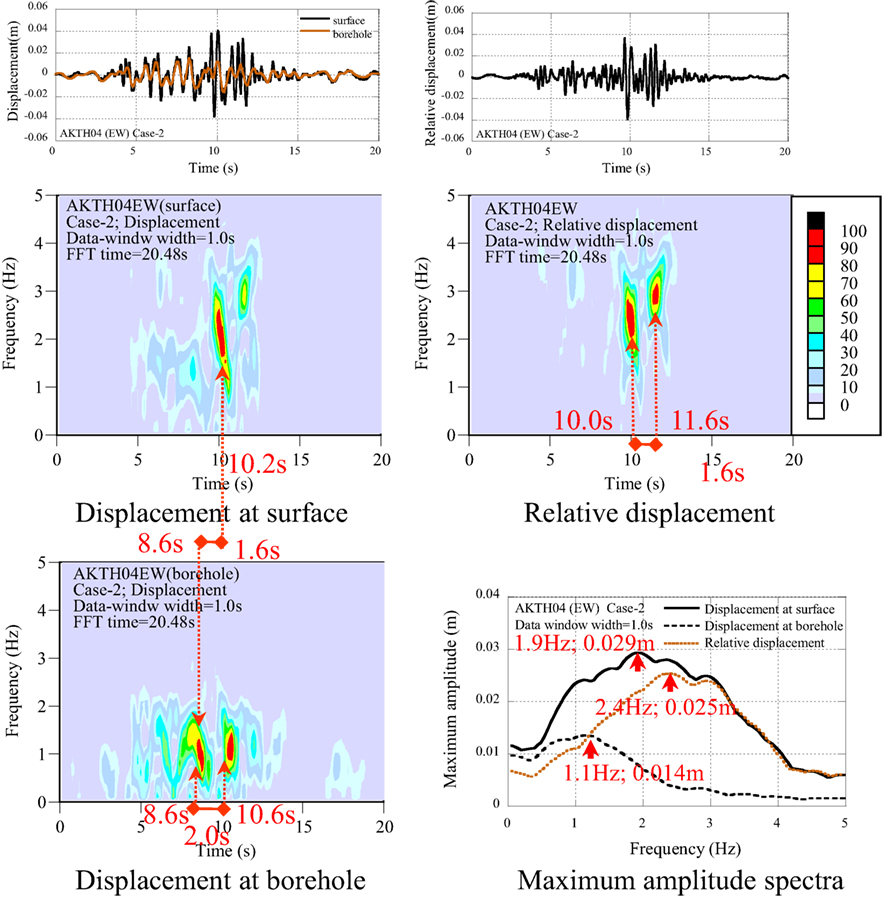
Figure 7. Displacement and relative displacement profiles of AKTH04 (EW).
The property of dominant components can be evaluated as follows:
(1) The dominant components at the borehole occur at the time of 8.6 s. This is earlier than the occurrence time of 10.2 s at the surface.
(2) The frequency of peak dominant component at the borehole is 1.1 Hz. This is lower than the frequency of 1.9 Hz at the surface.
(3) The peak maximum amplitude at the borehole is 0.014 m. This is smaller than that of 0.029 m at the surface.
(4) The distribution property of dominant components in the relative displacement profile is almost similar to that of the displacement profile at the surface.
(5) The peak component at the relative displacement is detected at the frequency of 2.4 Hz with the amplitude of 0.025 m. This is 86% of the peak value at the surface.
It may be concluded that the large acceleration at the surface is related to the local mode in the propagation process from the borehole to the surface.
For IWTH25 (UD), the dominant components in the acceleration profile and the relative displacement profile have been investigated in the interval from 3.5 to 4.5 s of Case-2, Case-3, and Case-4, and those are shown in Figure 8.
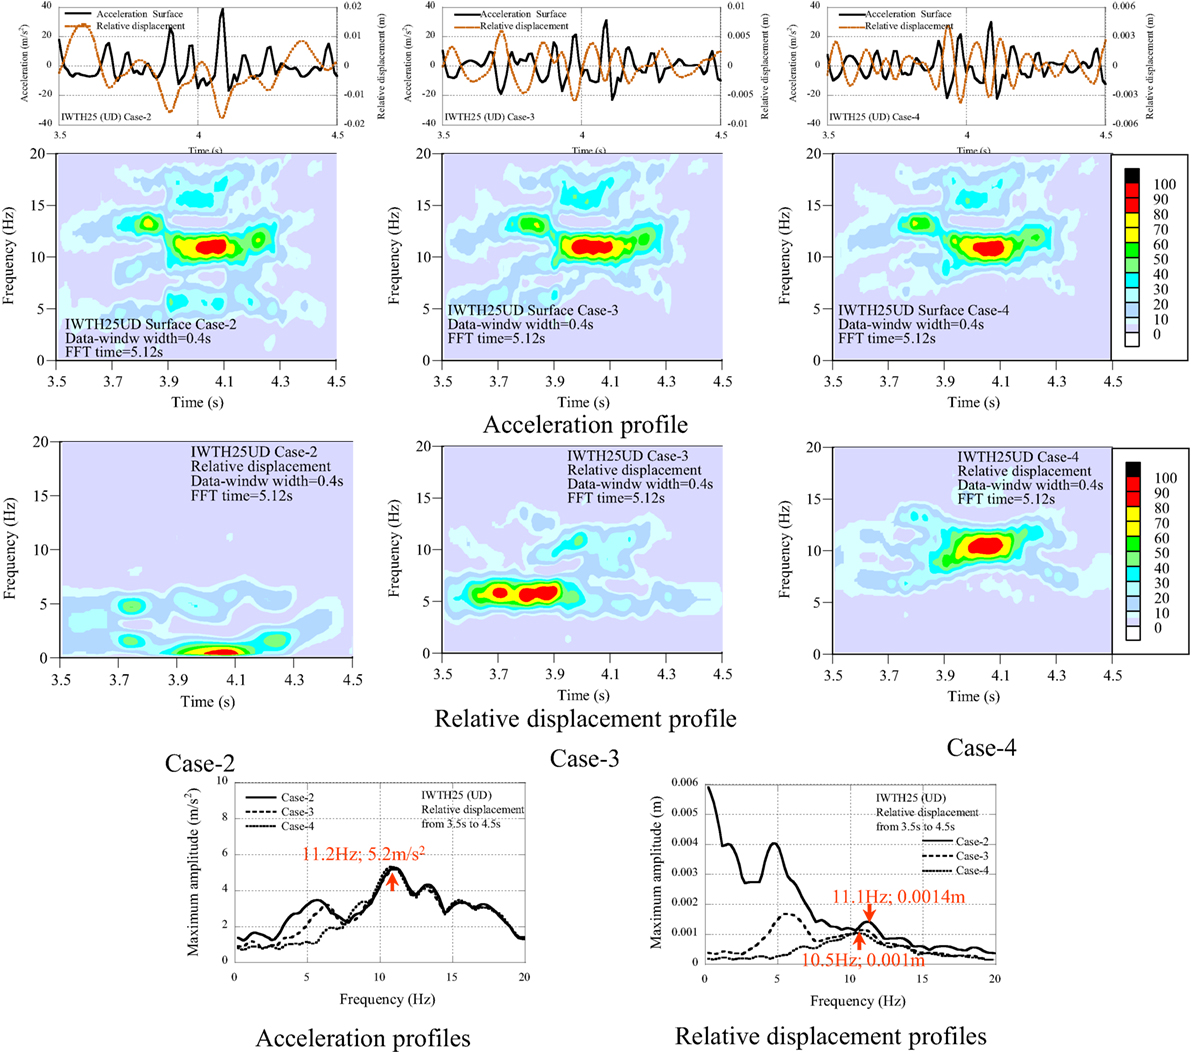
Figure 8. Comparison of cutoff frequency range in band-pass filter of IWTH25 (UD).
In the acceleration profile, the pulse wave of Case-2 has an asymmetric shape (upward), and those of Case-3 and Case-4 are close to a symmetric shape. In the relative displacement profile of Case-2, a low frequency component has been observed, and the peaks are not synchronized with the peaks in the acceleration profile. In the relative displacement of Case-4, the phase is almost coincident with the acceleration in the opposite direction.
The distribution property of the dominant components in the non-stationary Fourier spectra can be evaluated as follows:
(1) In the acceleration profiles, the dominant components scatter in the frequency range higher than 10 Hz. This behavior is the same independent of the applied filter.
(2) The peak amplitude is detected at 11.2 Hz with the amplitude 5.2 m/s2.
(3) In the relative displacement profiles, the dominant components differ in Case-2, Case-3, and Case-4. This is related to the frequency components smaller than 10 Hz.
(4) In the relative displacement profile of Case-2, the dominant component occurs at 11.1 Hz with the amplitude value of 0.0014 m. This corresponds to the dominant component of 11.2 Hz with the amplitude of 5.2 m/s2 in the acceleration profile.
The above analytical results suggest that the acceleration profile of Case-4 includes the pulse components in the seismic record. The double integrated displacement profile of Case-4 also includes the components of pulse wave in the seismic record. From the relation of between the acceleration value (VA) and the displacement value (VD), the peak displacement 0.0014 m in the successive pulses with the frequency of 11.1 Hz corresponds to the acceleration 6.8 m/s2. This is 18% of the peak amplitude 38.7 m/s2. It may be concluded that pulse wave is composed of various frequency components.
Considering the layout of the observation house (see Figure 15), the vertical displacement dv of 0.0014 m corresponds to the rotation angle 2.8/1,000 (=dv/w; w = 0.5 m; w: the length from the pit to the edge at the long side) or 1/1,000 (w = 1.3 m; the length from the pit to the edge at the short side). The estimated small inclination of the observation house would not be observed after the earthquake.
Occurrence Mechanism of Large Acceleration Values
Consider the occurrence mechanism of large acceleration in the seismic record of IWTH25 (UD). Many researchers have investigated the cause of upward pulse waves. They assumed an original occurrence mechanism from the upward pulse shape. The authors analyzed the seismic records and produced additional information from the seismic records. During the Iwate–Miyagi Nairiku earthquake, the large acceleration of 24.5 m/s2 was recorded at AKTH04 (EW). The epicentral distance of AKTH04 is 22 km. This is longer than that of IWTH25 (2 km). The difference of AKTH04 and IWTH25 is due to the direction, i.e., the horizontal component at AKTH04 and the vertical component at IWTH25. Apparently, the previous research on IWTH25 (UD) cannot explain the occurrence mechanism of AKTH04 (EW). In this section, the occurrence mechanisms of large acceleration in the horizontal component and the vertical component will be investigated.
Let us investigate the pulse waves that caused the peak acceleration, i.e., from 11 to 12 s at AKTH04 (EW) and from 3.5 to 4.5 s at IWTH25 (UD). They are compared with the relative displacement profile in Figure 9.
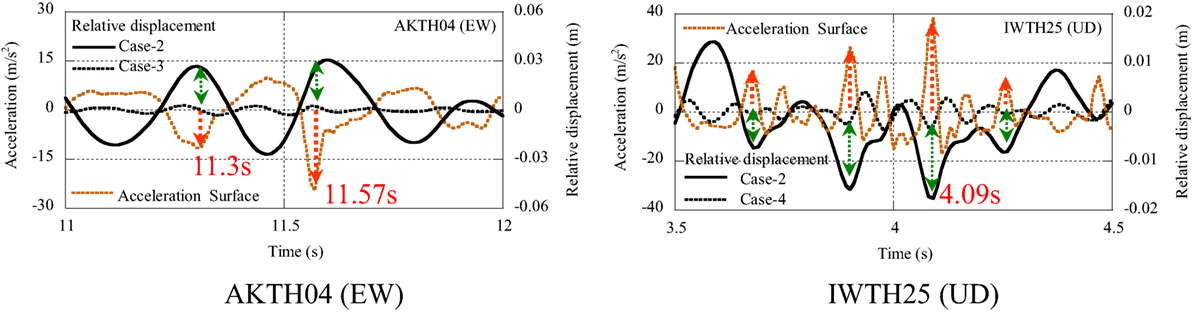
Figure 9. Pulse waves in acceleration and relative displacement profiles of AKTH04 (EW) and IWTH25 (UD).
At AKTH04 (EW), the peak acceleration of 24.5 m/s2 occurred as the single downward pulse wave at 11.57 s. This corresponds to the positive terminal point of cyclic movement in the relative displacement profile of Case-2 and Case-3. At IWTH25 (UD), the multiple upward pulse waves in the acceleration profile occurred from 3.5 to 4.5 s. This corresponds to the negative reversal points of Case-2 and Case-4 in relative displacement profiles.
Both pulse waves in the acceleration profiles in AKTH04 (EW) and IWTH25 (UD) synchronize with the pulse waves in the relative displacement profiles. This suggests that the acceleration 24.5 m/s2 at AKTH04 (EW) is related to the displacement with the amplitude of 0.03 m, and the acceleration 38.7 m/s2 at IWTH25 (UD) is related to the displacement with the amplitude of 0.02 m or less.
Seismic Records at AKTH04
The acceleration and the relative displacement of EW and UD profiles are illustrated in Figure 10. The occurrence point of the peak acceleration is marked by the red-star in the profile and the phase curve. In the profiles of Case-2, the peak acceleration occurs in the process toward the positive reversal point in the relative displacement profile. In the profiles of Case-4, the peak acceleration occurs at the positive reversal point in relative displacement profile.
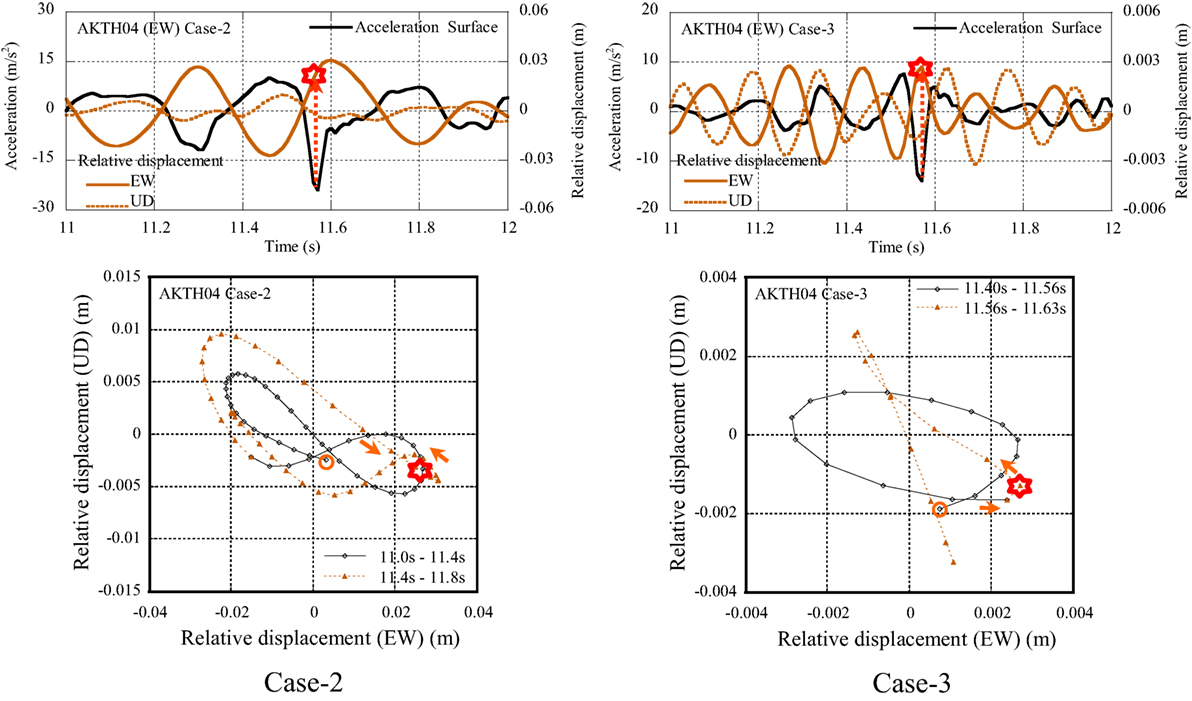
Figure 10. Phase curves correspondent to the pulse wave of AKTH04.
Using the EW and the UD relative displacement profiles, the phase curve for the station AKTH04 is illustrated in Figure 12. The orbit of 8-shape was detected in the phase curve of Case-2. This was identified as the coupling of sway and rocking modes. In the phase curve of Case-3, the elliptical orbit was detected. This was identified as the coupling of the same frequency mode with the phase delay between the EW and UD components.
The dominant components in the relative displacement profile in the EW and UD components were analyzed by the non-stationary Fourier spectra and are shown in Figure 11. The coupling modes of 2.8 and 6.2 Hz were detected in the UD component, and the single mode of 3.1 Hz was detected in the EW component.
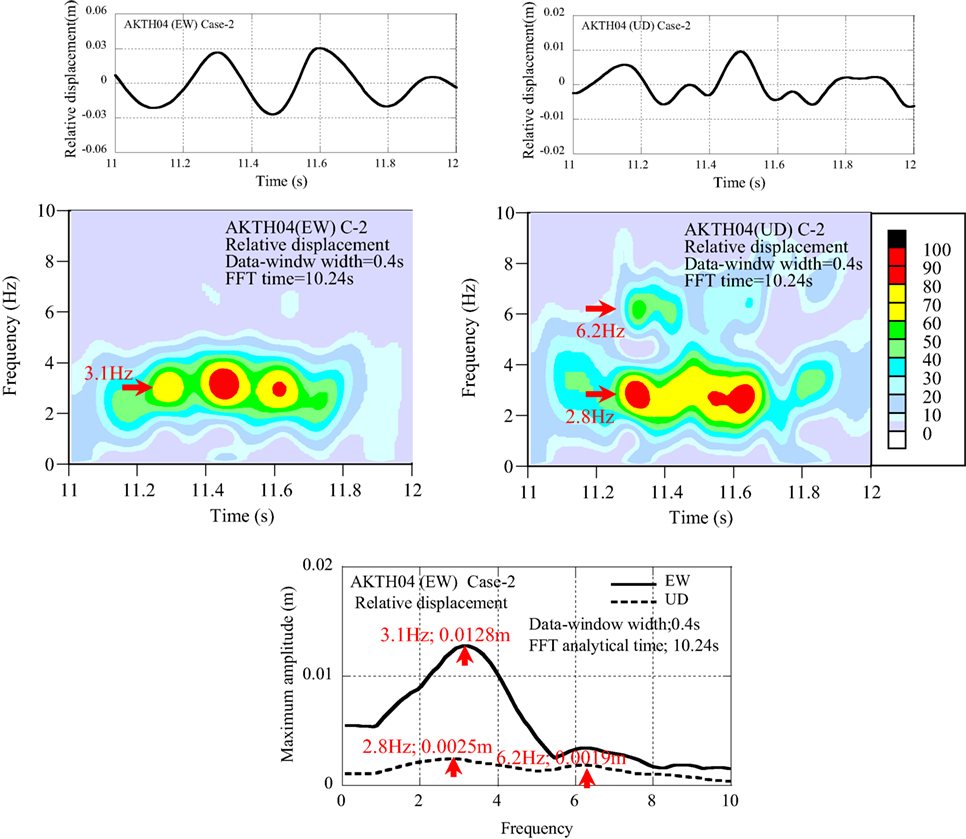
Figure 11. Non-stationary Fourier spectra and maximum amplitude spectra of one of the horizontal (EW) and vertical components of AKTH04.
The occurrence process of the pulse wave can be explained as follows:
(1) In the phase curve of Case-2 in Figure 10, an 8-shape orbit was detected from 11.0 to 11.4 s. This was identified by the sway mode of sinusoidal wave with the frequency of fH (3 Hz) and the rocking mode of a sinusoidal wave with the frequency of fR (6 Hz). The coupling of both sinusoidal waves was plotted as the symmetric 8-shape orbit. As shown in Figure 11, the vertical movement was composed of dual frequency components. This was identified by the up–down mode with the frequency of fV and the rocking mode with the frequency of fR. The relation of fR = 2 × fV was derived from the non-stationary Fourier spectra shown in Figure 11. The amplitudes of horizontal and vertical movements were determined from the relation of the relative displacement profiles of EW and UD components.
The sway mode in the horizontal displacement:
The rocking mode in the vertical displacement:
The up–down mode and rocking mode in vertical displacement:
(2) In the phase curve of Case-3 shown in Figure 10, an elliptical orbit was detected from 11.4 to 11.56 s. This was identified by the coupling of the horizontal and the vertical modes of the same frequency with the phase delay.
The sway mode in horizontal displacement:
The up–down mode in vertical displacement:
The identified displacement profiles and the phase curves are illustrated in Figure 12.
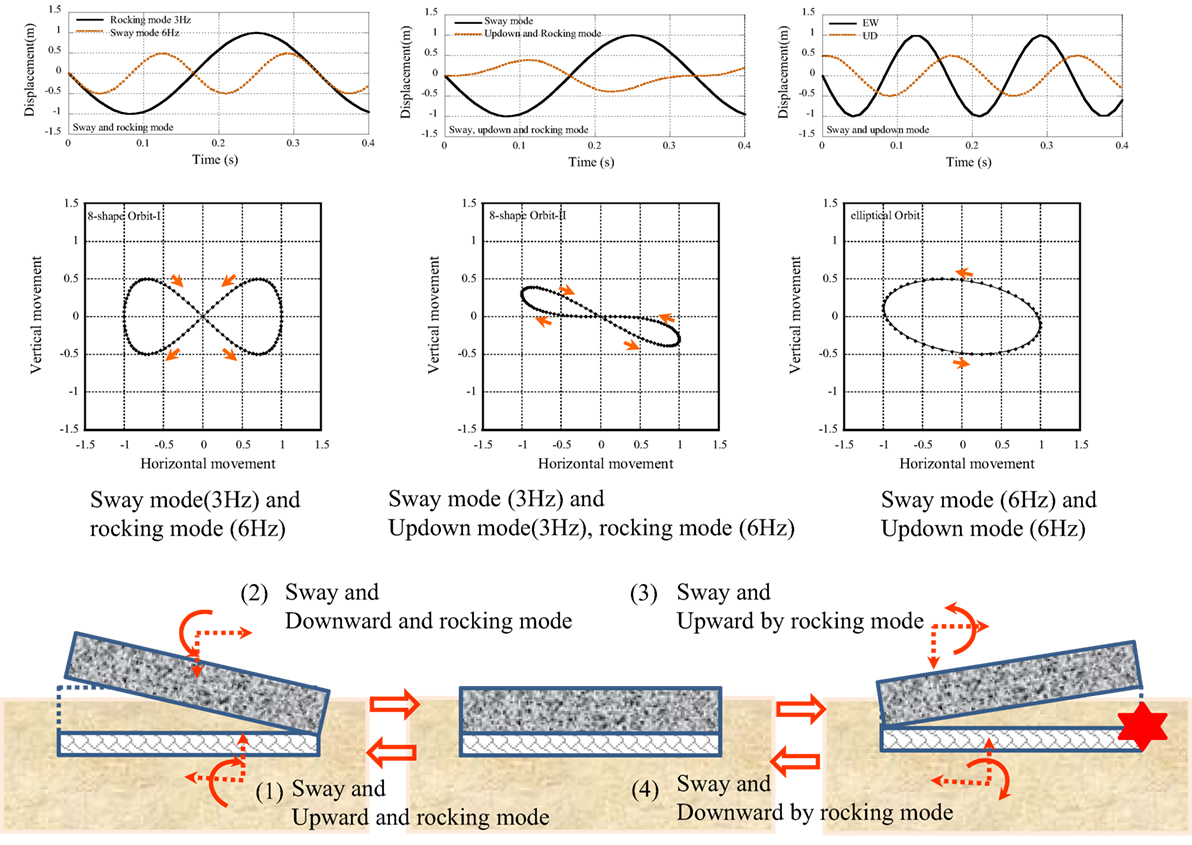
Figure 12. Identified displacement profiles and phase curves of AKTH04.
The occurrence mechanism of the pulse wave can be explained as follows (see Figure 12):
(1) Coupling of the sway mode to the left direction and the upward mode with the clockwise rocking mode.
(2) Coupling of the sway mode to the right direction and the downward mode with the counter-clockwise rocking mode.
(3) Continuous movement from the stage (2) of the coupling of the sway mode to the right direction and the downward mode with the counter-clockwise rocking mode.
(4) Coupling of the sway mode to the left direction and the upward mode with the clockwise rocking mode.
The pulse wave at 11.57 s occurs at the terminal point of the process (3). Some irregular movement like the collision between the base-mat of the observation house and the surrounding soil can be estimated as the occurrence mechanism.
Seismic Records at IWTH25
The relative displacement profile at IWTH25 (UD) is illustrated together with the acceleration profile in the entire profile and the zoomed profile from 3.4 to 4.4 s (hatched in the entire profile) (see Figure 13). In the zoomed profile, the upward pulse waves of the acceleration profile numbering from P1 to P4 are focused upon. They occurred simultaneously at the downward reversal points in the relative displacement profile as shown in the zoomed profile. Furthermore, the authors focused on the additional upward pulse waves numbering from Q1 to Q3, which occurred in each interval of numbered pulses from P1 to P4, and they occurred at the inflection point of the relative displacement profile.
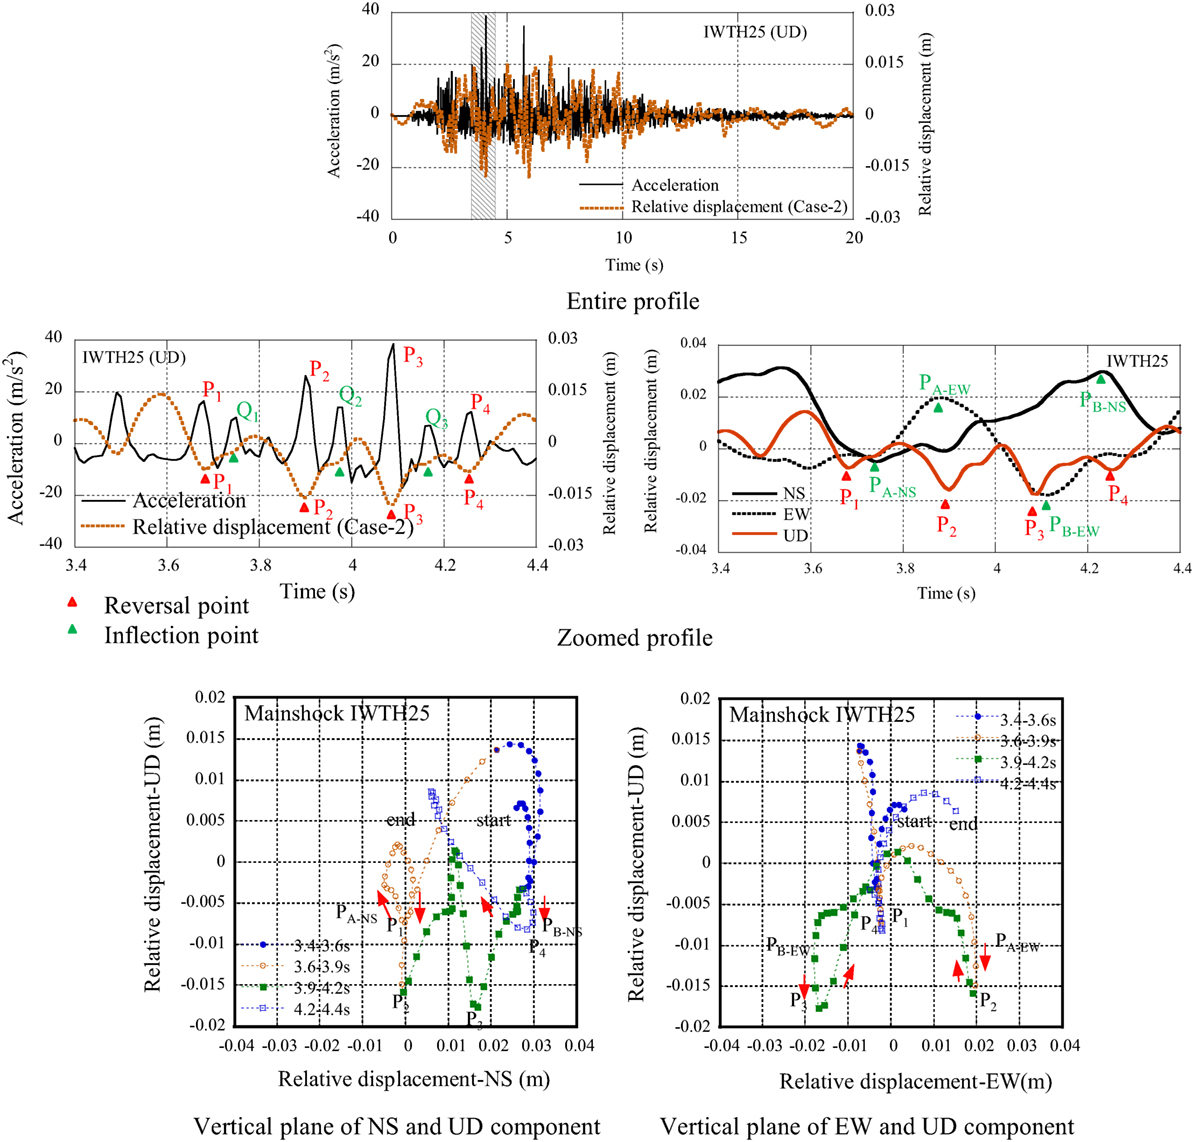
Figure 13. Comparison of acceleration and relative displacement profiles of IWTH25.
The relative displacement profiles are illustrated as the phase curves in two kinds of vertical planes with the axes of the NS and UD components and the EW and UD components (see Figure 13). The seismic behavior of the observation house is summarized as follows:
(1) In the phase curve of the EW and UD components, the reversal point PA-EW is the positive maximum amplitude and the reversal point PB-EW is the negative maximum amplitude in the relative displacement profile of the EW component.
(2) The reversal points P2 and P3 occur simultaneously with the reversal points PA-EW and PB-EW in the relative displacement profile of the EW component.
(3) In the phase curve of the NS and UD components, the reversal point PA-NS is the negative maximum amplitude and the reversal point PB-NS is the positive maximum amplitude in the relative displacement profile of the NS component.
(4) The reversal points P1 and P4 occur simultaneously with the reversal points PA-NS and PB-NS in the relative displacement profile of the NS component.
(5) The typical additional pulses Q1, Q2, and Q3 occur at the interval of P1, P2, P3, and P4.
The property of the pulse waves in NS, EW, and UD components were analyzed by the non-stationary Fourier spectra, the maximum amplitude spectra, and the amplitude spectra at 4.1 s as shown in Figure 14.
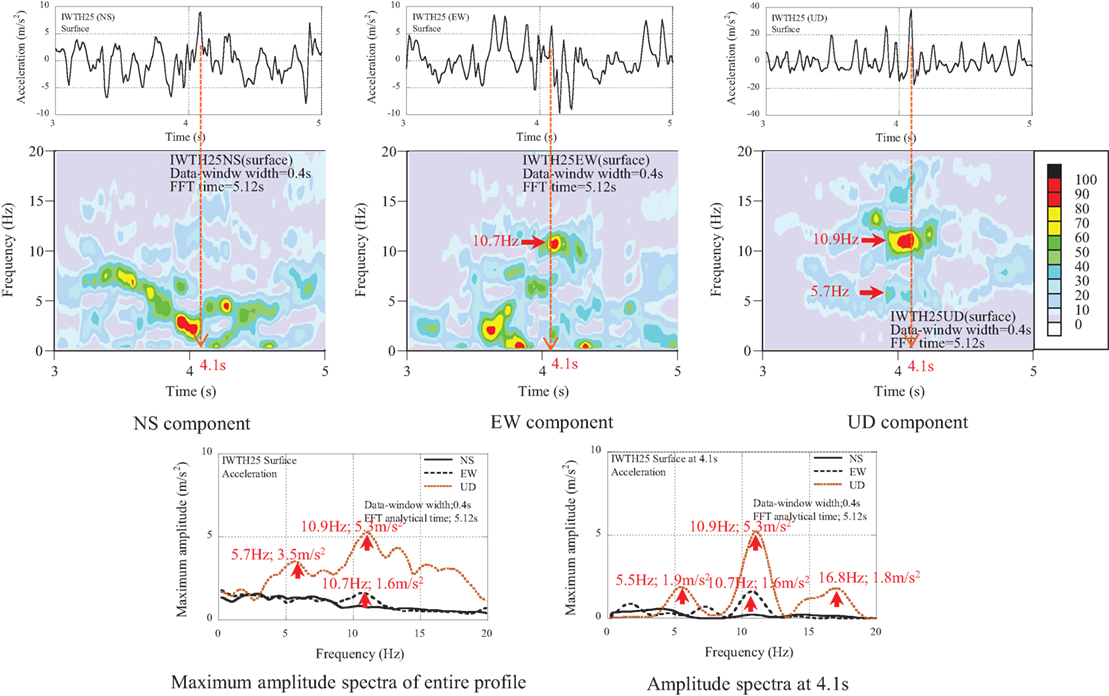
Figure 14. Dominant components of NS, EW, and UD components of IWTH25.
The dominant components are summarized as follows:
(1) The amplitude of dominant components in the UD components exceeds 2.0 m/s2 in the frequency range from 3.5 to 18 Hz.
(2) The peak amplitude occurred at the frequency of 10.9 Hz with the amplitude of 5.3 m/s2 in the UD component.
(3) The components composing the pulse wave of 38.7 m/s2 are analyzed by the amplitude spectra at the time of 4.1 s. Three main components are 5.5 Hz (1.9 m/s2), 10.9 Hz (5.3 m/s2), and 16.8 Hz (1.8 m/s2).
(4) The dominant component of 10.7 Hz (1.6 m/s2) is detected in the amplitude spectra of the EW component.
It was concluded that the analytical findings result from the non-linear interaction between the observation house and the surrounding soil (see Figure 15). In more detail, the following points were obtained.
(1) The upward pulse wave was caused by the collision between the base-mat of the observation house and the soil beneath it.
(2) The additional upward pulse wave was caused by the collision between the base-mat of observation house and the soil beneath it.
(3) The rocking mode can be estimated numerically as the inclination of the base-mat from 2.2/1,000 to 0.85/1,000. The peak displacement corresponding to 10.9 Hz (5.3 m/s2) is 0.0011 m. The inclination can be derived by dividing the vertical displacement by the length from the edge (0.5 and 1.3 m).
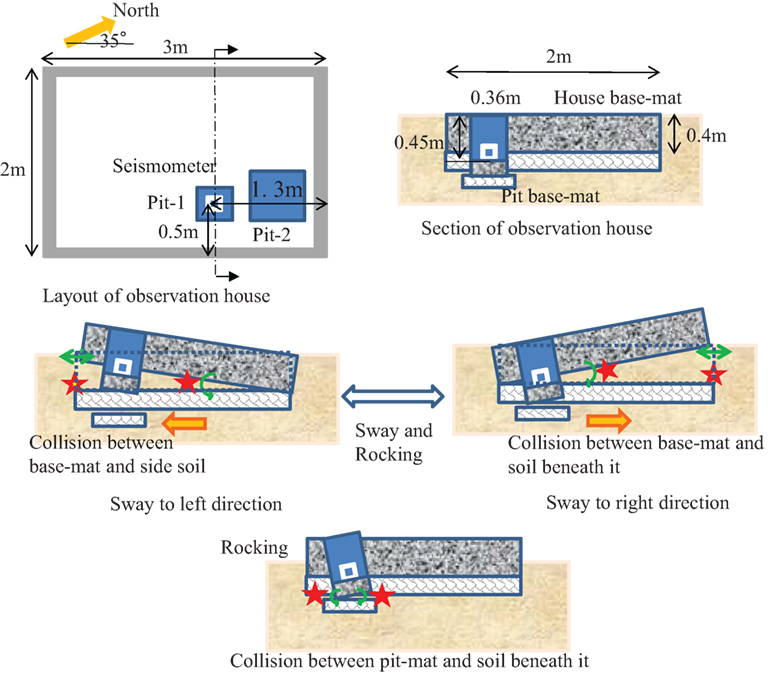
Figure 15. Layout of observation house and occurrence mechanism by rocking mode of base-mat of IWTH25.
Conclusion
During the Iwate–Miyagi Nairiku earthquake in 2008, large accelerations were measured at the KiK-net stations, i.e., 38.9 m/s2 in IWTH25 (UD) and 24.5 m/s2 in AKTH04 (EW). The occurrence mechanisms of such large acceleration have been explained by using several analytical results, such as the non-stationary Fourier spectra and the double integrated displacement profiles.
The frequency components contributing to the pulse wave have been obtained from the non-stationary Fourier spectra. The difference in the frequency and the occurrence time of the maximum amplitude between the surface and the borehole indicates that the large acceleration was excited in the propagation process from the borehole to the surface. The frequency components related to the large acceleration have been identified at the same time.
From the double integrated displacement profile, useful information on the seismic behavior was derived. First, the frequency components that do not cause the large accelerations were eliminated by the band-pass filter. The deformation process in the surface soil was illustrated using the displacement at the surface and the borehole. The whipping mode at AKTH04 and the uniform layered mode at IWTH25 were detected. These phenomena are consistent with the profile of the shear wave velocity. Second, the relative displacement between the surface and the borehole was introduced, and it was made clear that the relative displacement includes the component of large acceleration. Furthermore, the shear strain profile was obtained by dividing the relative displacement by the interval distance between the surface and the borehole. The deterioration state of the surface soil was estimated by plotting the maximum shear strain on the G − γ relation.
The pulse wave in the relative displacement profile was detected. This corresponds to the pulse wave in the acceleration profile. The phase curve was drawn by the relative displacement of the UD and EW components, in which an 8-shape orbit was detected. This was identified by the sway, the up–down, and the rocking modes, and they were modeled by the sinusoidal waves. The pulse wave at AKTH04 (EW) occurred at the typical point in the phase curve. By using these results, it was concluded that the large accelerations were caused by a singular mode, such as the collision between the observation house and the side soil.
Regarding the large acceleration at IWTH25 (UD), the synchronized pulse waves were detected between the acceleration and the relative displacement profiles. Furthermore, the synchronized reversal points were found among the NS, the EW, and the UD components. From the singular orbit in the movement of up–down direction, the occurrence mechanism of large acceleration was explained as the collision between the observation house and the soil beneath it. Also, the additional pulse wave was estimated to be caused by the collision between the pit-mat and the soil beneath it.
Author Contributions
SK carried out the theoretical and numerical analysis. IT discussed the theoretical and numerical analysis.
Conflict of Interest Statement
The authors declare that the research was conducted in the absence of any commercial or financial relationships that could be construed as a potential conflict of interest.
Acknowledgments
The authors used the seismic records of K-NET and KiK-net provided by the National Research Institute for Earth Science and Disaster Prevention. Part of the present work is based on the discussion made in the JNES (Japan Nuclear Energy Safety Organization) committee.
References
Aoi, S., Kunugi, T., and Fujiwara, H. (2010). Trampoline effect in extreme ground motion. Science 322, 727–730. doi: 10.1126/science.1163113
Geospatial Information Authority of Japan (GSI). (2016). GPS Stations Detect Crustal Deformation Caused by the Iwate-Miyagi Nairiku Earthquake in 2008. Available at: http://www.gsi.go.jp/ENGLISH/page_e30283.html
Kamagata, S., and Takewaki, I. (2013a). New insights into seismic behavior of building and surrounding soil at Hamaoka nuclear power station during Suruga Bay earthquake in 2009. Soil Dyn. Earthquake Eng. 53, 73–91. doi:10.1016/j.soildyn.2013.06.007
Kamagata, S., and Takewaki, I. (2013b). Role of records during the 2011 off the Pacific coast of Tohoku earthquake in seismic resistant design of nuclear power station. Int. J. Earthquake Eng. Hazard Mitigation 1, 9–21.
Kinoshita, S. (2011). A stochastic approach for evaluating the nonlinear dynamics of vertical motion recorded at the IWTH25 site for the 2008 Mw 6.9 Iwate-Miyagi inland earthquake. Bull. Seismol. Soc. Am. 101, 2955–2966. doi:10.1785/0120100334
Kobayashi, G., Sugino, H., Tsutsumi, H., and Ebisawa, K. (2014). Guidance for Evaluation of Seismic Ground Motion from Diffuse Seismicity. JNES-RE-Report Series, JNES-RE-2013-2045. Tokyo: Japan Nuclear Energy Safety Organization.
Kojima, K., Kamagata, S., and Takewaki, I. (2014). A new interpretation of large amplitude earthquake acceleration from non-linear local soil-structure interaction. Nucl. Eng. Design 273, 271–287. doi:10.1016/j.nucengdes.2014.03.023
Mogi, H., Shrestha, S. M., Kawakami, H., and Kawamura, J. (2013). Nonlinear soil behavior examined on the basis of propagation time observed at the KiK-net Ichinoseki-Nishi vertical array. Bull. Seismol. Soc. Am. 103, 180–195. doi:10.1785/0120120064
National Research Institute for Earth Science and Disaster Prevention (NIED). (2016). Strong-Motion Seismograph Networks (K-NET, KiK-net). Available at: http://www.kyoshin.bosai.go.jp/
Ohmachi, T., INOUE, S., Mizuno, K., and Yamada, M. (2011). Estimated cause of extreme acceleration records at the KiK-net IWTH25 station during the 2008 Iwate-Miyagi Nairiku earthquake, Japan. Trans. Jpn. Assoc. Earthquake Eng. 11, 32–47.
The Headquarters for Earthquake Research Promotion. (2016). Monthly Reports on Evaluation of Seismic Activities in Japan; Evaluation of Seismic Activities for 2008 (Jun 12 2008). Available at: http://www.jishin.go.jp/main/chousa/08jun_iwate_miyagi2/p07.htm
The World Nuclear Association. (2016). Nuclear Power Plants and Earthquakes. Available at: http://www.world-nuclear.org/information-library/safety-and-security/safety-of-plants/nuclear-power-plants-and-earthquakes.aspx
Tobita, T., Iai, S., and Iwata, T. (2010). Numerical analysis of near-field asymmetric vertical motion. Bull. Seismol. Soc. Am. 100, 1456–1469. doi:10.1785/0120090301
Yamada, M., Mori, J., and Heaton, T. (2009). The slapdown phase in high-acceleration records of large earthquakes. Seismol. Res. Lett. 80, 559–564. doi:10.1785/gssrl.80.4.559
Yamada, M., Mori, J., and Ohmi, S. (2010). Temporal changes of subsurface velocities during strong shaking as seen from seismic interferometry. J. Geophys. Res. 115, B03302. doi:10.1029/2009JB006567
Appendix
Accuracy of Non-Stationary Fourier Spectra
The parameters in non-stationary Fourier spectra are determined based on the analytical results using sinusoidal waves.
(1) One-cycle sinusoidal wave (see Figure A1).
The one-cycle sinusoidal wave with the frequency of 1.0 Hz was analyzed with three kinds of data window width, such as 1.0, 1.5, and 2.0 s. The data window width longer than the duration of dominant component may mislead the occurrence time of the dominant component but has no influence on the maximum amplitude spectra.
In the analysis of seismic records, the dominant frequency can be estimated from the shape of seismic record, i.e. a pulse wave, a cyclic wave. The suitable data window should be selected based on some case studies of data window width. The data window width longer than the dominant component may mislead the occurrence time of the dominant component.
(2) Three cycles of sinusoidal wave (see Figure A2).
The maximum amplitude spectra suggest an important condition on the data window width. The data window width longer than the one-cycle dominant component may mislead the maximum amplitude of the dominant component. As for the cyclic wave, the data window width should be selected appropriately depending on the frequency component in the seismic record. Parametric analysis may be necessary for the data window width.
(3) The continuously modulating sinusoidal waves (see Figure A3).
The non-stationary property of seismic records can be modeled by using the continuously modulating sinusoidal wave (from 1 to 9 Hz) expressed by Eq. A1.
where TN is the duration.
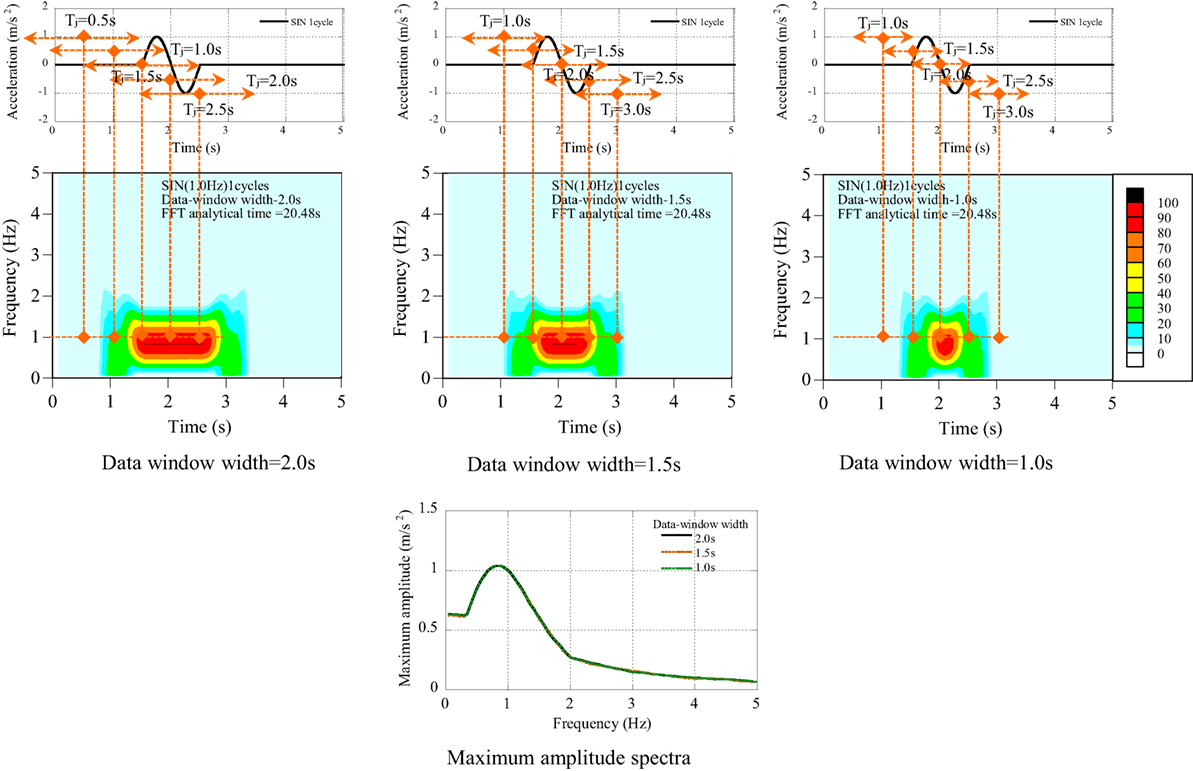
Figure A1. Non-stationary Fourier spectra of one-cycle sinusoidal wave.
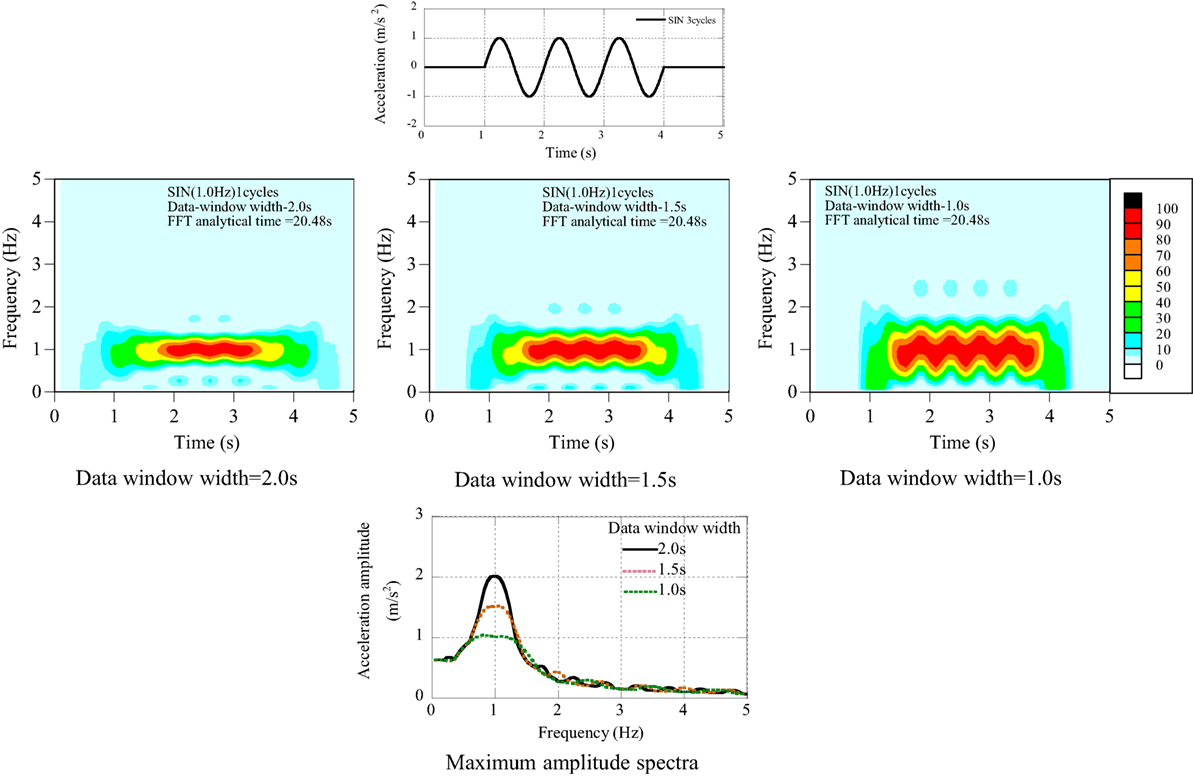
Figure A2. Non-stationary Fourier spectra of three-cycle sinusoidal wave.
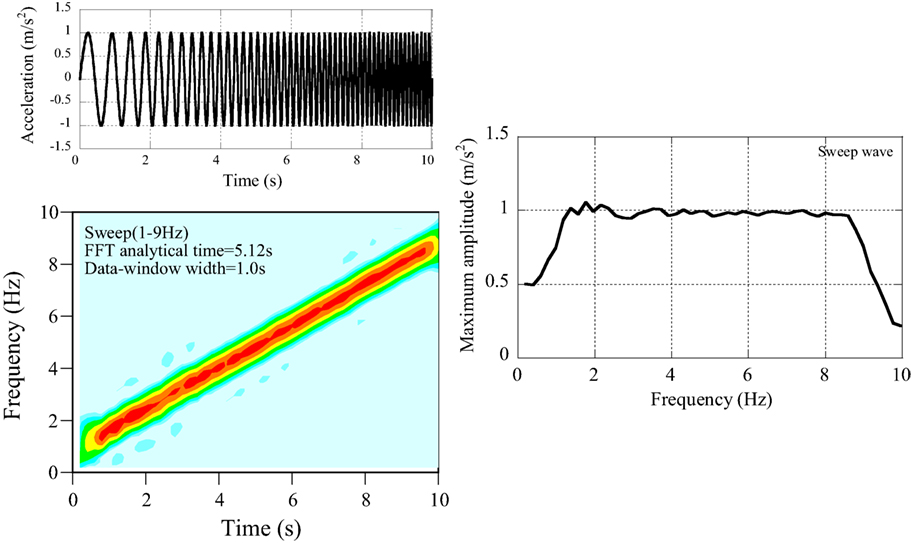
Figure A3. Non-stationary Fourier spectra of continuously modulating sinusoidal wave.
The frequency components with a short duration time can be analyzed correctly. The non-stationary Fourier spectra are applicable to seismic records.
Keywords: KiK-net, pulse wave, non-stationary Fourier spectra, double integrated displacement profile, relative displacement profile, amplification in surface soil, induced vertical motion, collision between base-mat and surrounding soil
Citation: Kamagata S and Takewaki I (2017) Occurrence Mechanism of Large Acceleration in KiK-net Seismic Records during Iwate–Miyagi Nairiku Earthquake in 2008. Front. Built Environ. 3:13. doi: 10.3389/fbuil.2017.00013
Received: 15 December 2016; Accepted: 08 February 2017;
Published: 27 February 2017
Edited by:
Katsuichiro Goda, University of Bristol, UKReviewed by:
Hadi Ghofrani, University of Western Ontario, CanadaNaohiro Nakamura, Hiroshima University, Japan
Copyright: © 2017 Kamagata and Takewaki. This is an open-access article distributed under the terms of the Creative Commons Attribution License (CC BY). The use, distribution or reproduction in other forums is permitted, provided the original author(s) or licensor are credited and that the original publication in this journal is cited, in accordance with accepted academic practice. No use, distribution or reproduction is permitted which does not comply with these terms.
*Correspondence: Izuru Takewaki, dGFrZXdha2lAYXJjaGkua3lvdG8tdS5hYy5qcA==