 Shijia Pan
 Susu Xu
 Mostafa Mirshekari
 Pei Zhang
 Hae Young Noh
- 1Electrical and Computer Engineering, Carnegie Mellon University, Moffett Field, CA, USA
- 2Civil and Environmental Engineering, Carnegie Mellon University, Pittsburgh, PA, USA
This paper presents a collaboratively adaptive vibration monitoring system that captures high-fidelity structural vibration signals induced by pedestrians. These signals can be used for various human activities’ monitoring by inferring information about the impact sources, such as pedestrian footsteps, door opening and closing, and dragging objects. Such applications often require high-fidelity (high resolution and low distortion) signals. Traditionally, expensive high resolution and high dynamic range sensors are adopted to ensure sufficient resolution. However, for sensing systems that use low-cost sensing devices, the resolution and dynamic range are often limited; hence this type of sensing methods is not well explored ubiquitously. We propose a low-cost sensing system that utilizes (1) a heuristic model of the investigating excitations and (2) shared information through networked devices to adapt hardware configurations and obtain high-fidelity structural vibration signals. To further explain the system, we use indoor pedestrian footstep sensing through ambient structural vibration as an example to demonstrate the system performance. We evaluate the application with three metrics that measure the signal quality from different aspects: the sufficient resolution rate to present signal resolution improvement without clipping, the clipping rate to measure the distortion of the footstep signal, and the signal magnitude to quantify the detailed resolution of the detected footstep signal. In experiments conducted in a school building, our system demonstrated up to 2× increase on the sufficient resolution rate and 2× less error rate when used to locate the pedestrians as they walk along the hallway, compared to a fixed sensing setting.
1. Introduction
Structural vibration sensing for pedestrian monitoring has been applied for various spatiotemporal information acquisition purposes. Works have been done on human information monitoring through vibration induced by their activities, including identity (Ekimov and Sabatier, 2006; Itai and Yasukawa, 2008; Pan et al., 2015), gender (Bales et al., 2016a,b), location (Mirshekari et al., 2015, 2016; Poston et al., 2015; Schloemann et al., 2015), trajectory (Dobbler et al., 2014; Pan et al., 2014), traffic (Subramanian et al., 2010; Pan et al., 2016), and activity (Pan et al., 2017). The non-intrusive nature of this sensing system makes it a promising ubiquitous sensing method. Like other sensing systems, structural vibration sensing generally requires three steps in order to fulfill its purposes: signal acquisition, feature extraction, and information learning.
A large amount of research has been focusing on feature extraction and information learning for different vibration-based applications (Dobbler et al., 2014; Mirshekari et al., 2015, 2016; Pan et al., 2015, 2016; Bales et al., 2016b). However, if the raw signals acquired are already distorted (signal clipping) or of low resolution, the learning can hardly compensate for such information loss. One way to improve the signal fidelity is to use sensors with high dynamic range and high resolution. These sensors are often expensive and impractical for large-scale deployment. On the other hand, our target signals induced by pedestrian vary in signal strength (amplitude) fast and significantly, hence existing adaptive hardware settings methods can hardly adapt fast enough to such changes.
Therefore, in this paper, we present a low-cost high-fidelity vibration signal acquisition system targeting at pedestrian-induced structural vibration responses. Our system ensures high signal fidelity by predicting the pedestrian-induced vibration signal strength and calculating the hardware configuration setting required. The predictions mainly are through two solutions: (1) for each sensor, it applies heuristic models of structural responses and adapts amplification settings dynamically to maximize signal resolution while minimizing clipping rate and (2) for the networked sensors, the system models the structural variation through multiple locations to improve dynamic adaption of each local amplification setting. Finally, the system detects and outputs high-fidelity pedestrian-induced vibrations. In general, our paper provides the following contributions:
• We present a hardware system with low-cost off-the-shelf vibration sensors that adapts hardware configuration (e.g., amplification gains) to obtain high-fidelity structural vibration responses induced by pedestrians.
• We propose a prediction method that employs both a heuristic model to adapt hardware based on local signal change and a collaborative model to adapt hardware based on global variance.
• We apply the system to an application: pedestrian monitoring by footstep-induced vibration and evaluate the system performance in this application.
To the best of our knowledge, this is the first work that investigates sensing signal quality for structural vibration monitoring.
The rest of the paper is organized as follows: in Section 2, we detail related work done on improving signal fidelity and what is the research gap between prior works and this work. Then, Section 3 presents the overview of the system. Next, in Section 4 and Section 5, we introduced the optimization solution for hardware configuration, and the algorithm design for collaborative adaptation of the hardware. Then, in Section 6, we present the system implementation. Section 7 evaluates the system modules and analyzes their abilities to preserve footstep-induced structural vibrations with high fidelity. Then, in Section 8, we further discuss the system limitation, trade-offs, and usage. Finally, Section 9 presents the conclusions of this work.
2. Related Work
Prior works that focus on improving sensing signal quality mainly fall into three categories: (1) utilizing expensive enhanced sensors (Barzilai, 2000), (2) postprocessing to restore signal shape (Janssen et al., 1986; Miura et al., 2011; Kitic et al., 2013), and (3) adaptive hardware settings to obtain high-fidelity signals (Loetwassana et al., 2007; Zhang et al., 2011). The cost of enhancing sensing device to achieve high dynamic sensing range as well as high resolution could make large-scale deployment unrealistic. Previous methods for obtaining high-fidelity sensing data mainly fall into two categories: post- and preprocessing. Postprocessing methods restore unknown or lost data after data collection (Janssen et al., 1986; Miura et al., 2011; Kitic et al., 2013). These methods are usually used for audio data and evaluated by the signal-to-noise ratio (SNR). Janssen et al. (1986) proposed an adaptive interpolation method to restore lost data, with the restrictions that the positions of the unknown samples are known. Miura et al. (2011) introduced their clipping removal method through recursive vector projection. Kitic et al. (2013) approached the problem from another perspective with iterative hard thresholding and evaluated the results using both signal-to-noise ratio and human listening. However, for those feature-oriented applications such as identification (Pan et al., 2015) or TDoA-based localization (Dobbler et al., 2014), restored data are not dependable enough since it introduces signal artifacts.
Preprocessing methods utilize signal processing techniques to predict signal clipping and limit distortion of an amplified signal (Krochmal et al., 2007). In addition, Zhang et al. (2011) proposed the robust taking pressure control (RPC) algorithm to adjust the system sensing configuration for better signal collection. For pedestrian-induced excitation, the rapid change and variation make it difficult if not impossible to achieve high fidelity with those methods.
3. System Overview
The system goal is to capture high fidelity structural vibration signals induced by indoor pedestrians using low-cost low-dynamic-range sensors. It is achieved by maximizing the signal resolution while avoiding signal clipping. Figure 1 shows the relationship between the modules in the system. The vibration signal is obtained by the analog signal acquisition module, which specifies the sensing configuration used. Then, the detected impact signals are sent to a collaborative adaptive prediction module where the sensing configuration is decided based on sensing data from the local device as well as from other networked devices.
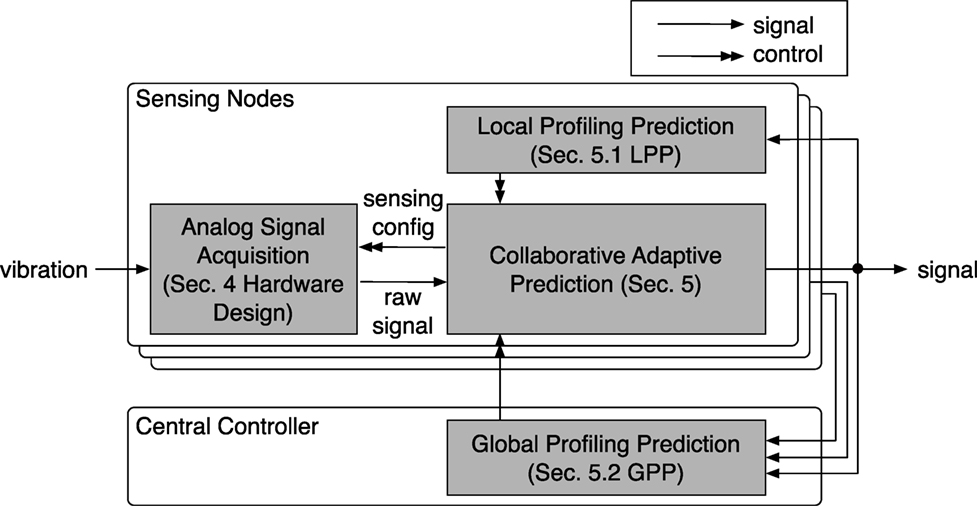
Figure 1. System overview.
The rest of the paper introduces the system based on the application of pedestrian monitoring through footstep-induced vibration. The causes of variation in detected human footstep strength mainly fall into two categories: human and environmental. Human variation includes two aspects: (1) the personal level as inconsistencies of individual footstep-to-sensor distance within a series of steps (we refer it as a trace in the rest of the paper) and (2) the interpersonal level as variations between individuals. Environmental variation occurs when the sensors are placed at different locations, which have different impact response due to structural factors like beams and partitions.
To accommodate these variations, the system, first of all, needs to have a variety of applicable hardware configurations that support the signal variation range (Section 4). Then, the system determines the hardware configuration settings through the collaboratively adaptive algorithm (Section 5).
4. Hardware: Sensing Configuration Optimization
The hardware configuration selection is the foundation of the sensing system. The goal of the selection is to use a minimum number of amplifiers to satisfy the sensing requirement, which we solve through an optimization problem. We define an amplified footstep signal that is represented by a range of integer values as of “sufficient resolution” when that range is over a selected threshold. For a different system or application, this threshold can be defined differently. The goal of optimization is to maximize the probability that a detected signal falls in the sufficient resolution interval after amplification with a limited number of amplifiers. How do we select amplification gain so that amplifiers allow a step signal on a surface to have sufficient resolution? First, we explain the relation between the concept of amplification and signal resolution (Amplification and Signal Resolution). Next, since the optimization mainly targets footstep strength change in a trace due to footstep-to-sensor distance variation, we model the distribution of the signal amplitude at different locations on a floor plane (Signal Amplitude Distribution). We form the optimization problem (Objective Function) to maximize the probability that a signal with the modeled distribution falls in the sufficient resolution range with limited amplification settings and obtain the optimal solution (Optimal Solution). Finally, the hardware design using the optimal solution is discussed.
Before we form the optimization problem, we list the notations used in the following sections in Table 1. In order to model the amplitude distribution of footstep impulses measured by a sensor, we represent the floor with a 2-dimensional X–O–Y Cartesian Coordinate plane. Since the calculation depends only on the relative locations of the footsteps and the sensor, we simplify the computation by taking the sensor’s location as the origin on the plane without losing generality. We make four assumptions to form the optimization problem:
Assumption 1. The sensing area A is a circular area with the sensor at the origin (0,0).
Assumption 2. Attenuation model (Gutowski and Dym, 1976; Verhas, 1979; Pan et al., 2014). When d > R, the impulse is outside the sensing area A, so we assign T = 0.
Assumption 3. The probability distribution of (L1, L2) ∈ X–O–Y is a uniform distribution, that is, the probability that a footstep falls on any point in the sensing area is the same.
Assumption 4. The number of amplifiers is smaller than the least number needed to properly amplify the raw signal over the whole input signal range , i.e., amplification ranges do not overlap.
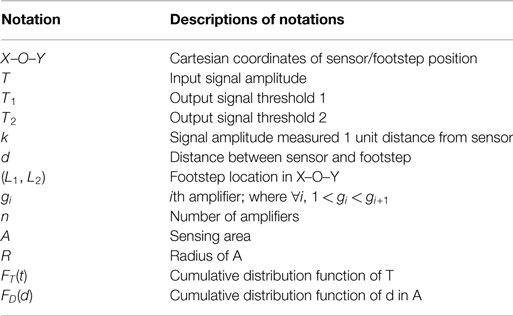
Table 1. Notations.
4.1. Amplification and Signal Resolution
The analog-to-digital converting using a limited number (resolution) of values to describe a signal within a specific voltage range; hence, for each impulsive vibration signal investigated, the amplification that maximizes the resolution is different. For an analog-to-digital converter of the specific resolution, a signal that is represented with a large enough number of different values is defined as sufficient resolution. This indicates that the amplified signal falls into a designated voltage range of [T1, T2]. For different applications requirements, the optimal range of [T1, T2] can be different. For example, human identification may require higher resolution signal to achieve high accuracy compared to the application of presence detection. Thus, identification application may have a higher optimal value for T1 than that of presence detection. We quantify the relation between signal amplitude and resolution level as shown in Table 2. If a signal is amplified by the gain of g and its output falls into the range of [T1, T2], then the original range of the signal is . In that case, the sufficient resolution interval for input signal amplitude is expanded to . With multiple available amplification gains, say 1 = g0 < gi < gn (0 < i < n), the system can cover sufficient resolution intervals within the full expected signal range. Although the method is applicable for any g values, considering the footstep signal range, it is practical to assume that the signal does not need to be amplified down, therefore we have g0 = 1 here.
with this definition of SigRange, we further interpret the optimization goal as follows. Given the number of amplification configurations (amplifier gain) n, find a set of amplification gains 1 = g0 < gi < gn (0 < i < n) so that the probability of the input signal amplitude that belongs to the SigRange is maximized.
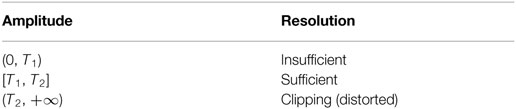
Table 2. Amplitude and resolution.
4.2. Signal Amplitude Distribution
To select the optimal amplification setting combination, we need to understand the possible signal amplitudes (T) and their distribution. To simplify the model, we consider an ideal surface described by Assumptions 1 and 3 as a start. On an ideal surface, the distance (d) between the footstep and the sensor affects this distribution. Therefore, we can estimate the probability of obtaining a signal of amplitude T from the probability of a step falling on a point of d away from the sensor, where a relationship between d and T as (k > 0) can be specified. Based on Assumption 2, the value k is derived from the absolute value of the impulse strength, which is caused by interpersonal level difference and not modeled in the optimization problem.
To model the clipping of amplifiers, we define a threshold T2: when T > T2, the amplitude is too large and exceeds the upper bound output, meaning the signal is clipping. The amplitude in the clipped range (T2, +∞) will always be sensed as the value T2. In that case, according to Assumption 2, given the circular area A around a sensor, we formulate the amplitude T as a function of distance (d) and the impulse strength (k):
Once we understand the relation between d and T, in order to derive the distribution of T, we first calculate the distribution of d. Assumption 1 defines O = (0, 0), so the distance between the sensor and the footstep can be represented as . Assumption 3 defines the probability distribution of (L1, L2), which can be applied here to derive the probability distribution of d as equation (3).
Then, we can derive the cumulative distribution function (CDF) of the signal amplitude from equations (2) and (3), and formulate it in equation (4) as
Figure 2 indicates that the probability distribution of amplitude is continuous in the interval , while discrete at T = T2. For the continuous part, the probability density function of amplitude (PDF) fT(t) decreases when t increases. Together with Assumption 4, this implies that in the optimal solution, the sufficient resolution intervals of different amplifiers should not overlap unless we have more than enough amplifiers to cover the entire input signal range, which violates Assumption 4. That is, ∀gi < gj, if , there must be and , such that probability that amplitude lies in is greater than probability that in (i.e., ).
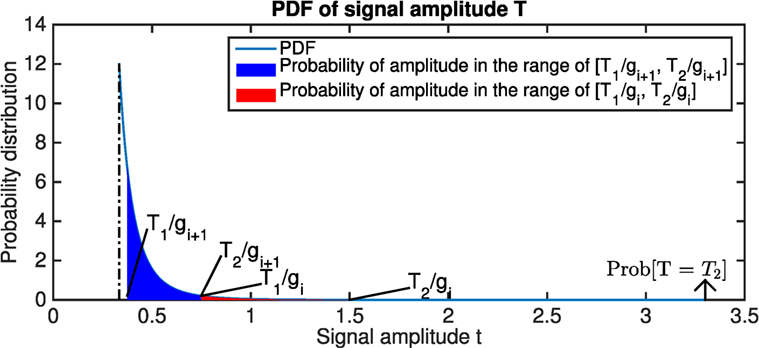
Figure 2. Probability distribution of the signal amplitude T. Note that the distribution is continuous in interval with the function , while discrete at T = T2 due to clipping. This figure shows the scenario where k = 1, R = 9, and T2 = 3.3. The red region is smaller than the blue region, which means when gi increases, the probability that the signal amplitude lies in the sufficient resolution interval also increases. Considering d ≤ R, we can derive that , which leads to , which is the constraint shown in equation (7). In order to prevent overlapping of the red region and the blue region, the constraint in equation (8) should be satisfied.
4.3. Objective Function
We use an optimization problem to describe the goal of our amplification setting selection, which is to maximize the probability that the vibration signal amplitude lies in the sufficient resolution interval. We formulate the optimization problem into equation (5).
Three constraints are applied to the optimization problem:
1. Constraint in equation (5). We simplify the calculation by define the order of amplification gain gi is monotone increasing with i. We consider g0 to represent the scenario where there is no amplifier applied, therefore the gain is g0 = 1, and is the sufficient resolution interval of the raw signal.
2. Constraint in equation (7). Assumption 2 asserts that d ≤ R, which leads to , therefore we can derive that .
3. Constraint in equation (8). Because ∀i, j ∈ {1, …, n}, cannot overlap with and gi < gi+1, the signal that gets clipping when gi+1 is used should not be of insufficient resolution when the next level of gain gi is applied.
4.4. Optimal Solution
To solve the optimization problem (Section 4.3) using the cumulative distribution function of signal amplitude from equation (7), the objective function can be rewritten as
where is a positive constant. Thus, we can maximize the objective function S by maximizing , which provides the optimal solution
The variable k is a structural characteristics determined value affected by the damping factor of the structure. This result is used to select the optimal amplification gain values in our implementation introduced in Section 4.5.
4.5. Hardware Design Using Optimal Solution
To allow the system to obtain signals with different amplification gains, we design the sensing configuration board with multiple amplification settings. As shown in Figure 3, in a situation with n different amplification configurations, the raw signal will go through the sensing unit with each one. Instead of collecting signals from all different configurations, the system selects the optimal one to obtain the signal. Collecting from n configurations limits the sampling rate to 1/n due to the system sampling rate limitation as well as radio band width limitation. Then, the signal from the selected configuration is digitized and stored.
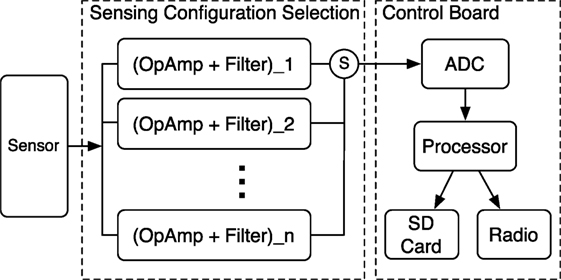
Figure 3. Adaptive amplification module. n Levels of the OpAmp are designed to allow the analog signal to be amplified to different ranges. For each iteration, a level of OpAmp is selected (S) and sent to Analog-to-Digital Converter (ADC). Then, the digitized signal is sent to processor for further analysis.
To obtain the structural variable k for the model, we generate a modeling impulse (for example, a ball drop with a designated strength) at the edge of the targeting sensing area (a designated R that is determined by the structural noise level), and the system tunes amplification gain gn to allow the impulse to achieve the highest resolution possible. Then, we calculate the value k based on the tuned gn and the equation . After that, we calculate the rest of the gain gi, i = 0, …, n − 1 based on the defined T1 and T2, as well as the structural factor k.
5. Algorithm: Collaborative Adaptive Prediction
In order to adapt to signal strength variation caused by pedestrian locations and structural factors, our system operates on two interconnected levels of feedback control as shown in Figure 1: local profiling prediction and global profiling prediction. Local profile prediction refers to the process by which an individual sensing unit uses the data it collects to predict the optimal amplification settings for the next footstep-induced signal. Global profile prediction refers to the collaborative prediction performed by multiple sensing units operating with one another. Together, they serve to provide feedback using known signals to infer and predict optimal amplification selections for future signals on both local and global levels.
5.1. Local Profile Prediction (LPP)
The goal of the LPP is to achieve high resolution for the low signal-to-noise ratio step signals by changing the amplification setting during a pedestrian approaching/leaving the sensor. It predicts the optimal configuration for the next footstep signal that the sensing nodes will detect. To achieve this, the system first detects footstep-induced signals (Step Event Detection). Then, it analyzes the detected signals’ resolution condition (Signal Resolution Analysis). Finally, based on the analysis, it makes a prediction on the next step’s amplitude (Optimal Configuration Prediction).
5.1.1. Step Event Detection
The system detects distinctive signal segments induced by footstep impulses, which we refer to as Step Events in the rest of the paper. They are extracted from the vibration signals through anomaly detection based on a Gaussian model of the background noise (i.e., the signal detected when there is no impulse on the structure) (Pan et al., 2014). We utilize a sliding window to collect the background noise signal. The system calculates the signal energy for each windowed signal, with noise modeled by a Gaussian distribution . If the signal energy in the window falls outside 3σ range of the Gaussian model, we consider the window to contain a detected step event since it is an abnormal segment.
5.1.2. Signal Resolution Analysis
Understanding the current Step Event’s resolution condition allows the system to predict the optimal configuration for the next Step Event. The Step Event resolution is deduced from the relation between the analog signal amplitude and resolution shown in Table 2. For an N-bit analog-to-digital converter configuration, the T1(v) and T2(v) are converted to a function of N as DT1(N) and DT2(N). These thresholds are applied on the detected Step Event range to determine the signal’s resolution class based on the relation demonstrated in Table 2.
5.1.3. Optimal Configuration Prediction
The optimal configuration for the next Step Event is obtained using Algorithm shown in Figure 4 with two main steps: (1) predict the amplitude of the next Step Event and (2) calculate the amplification gain that allows maximum resolution without clipping.
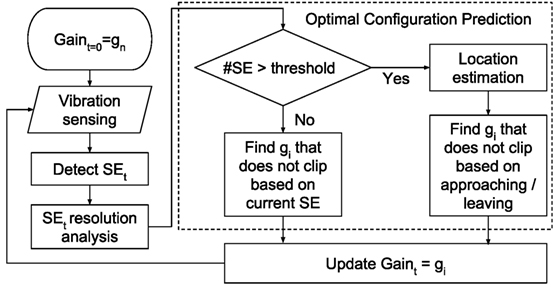
Figure 4. Local profile prediction algorithm.
To predict the amplitude of the next step signal, the system looks into Thhistory number of prior step signals’ condition. When there is less than Thhistory number of steps detected in history, the decision is made by prior step signal. If the step history is almost linear, which is the most common step energy change behavior when the steps are far away due to the noise, the system predicts the next step amplitude Ampt+1 with linear model estimated from the step history. On the other hand, if the step history is not linear, which occurs when steps are near the sensor, the system predicts the next step amplitude Ampt+1 with the 1/d model (Pan et al., 2014) estimated from the step history.
To calculate the amplification gain, we separate the cases where the pedestrian approaches and leaves the sensing area. When the pedestrian approaches, the system chooses to overestimate the predicted amplification by the NoiseAmp in order to find the maximum level of amplification gain that will keep Ampt+1 + NoiseAmp from getting clipped. On the other hand, when the pedestrian leaves, the system chooses to underestimate the predicted amplification by the NoiseAmp to find the maximum level of amplification gain that will keep Ampt+1 − NoiseAmp from getting clipped. Then, the system adjusts the amplification gain based on this calculation.
5.2. Global Profile Prediction (GPP)
The goal of the GPP is to achieve low distortion (e.g., clipping) for the high-amplitude step signals by utilizing historical information from neighboring sensors. In practical deployments, structural factors such as building beams and partitions, increase footstep strength variance. Such complications may cause different sensors to observe different local sensing behavior, e.g., if a sensor is deployed near a beam, the detected footstep amplification is lower than that of a sensor located between two beams. This type of structural variation between different sensors/locations can be propagated through the sensor network based on the pedestrian moving direction detection and allow sensors to improve their sensing resolution with the historical information from other sensors.
GPP can either perform alone or be used with LPP to improve signal fidelity by taking structural variation into account. In this section, we introduce how the GPP works alone to achieve high resolution signal acquisition for high signal-to-noise ratio step signals. Instead of processing on the Step Event level, GPP works on the Trace Event level (the vibration signal induced by a person passing by the sensor, containing contiguous detected Step Events). First, it obtains the direction of the target trace (Trace Event Direction). Then, it predicts the pedestrian’s trace (Trace Prediction), i.e., to a specific neighbor sensing node, based on walking direction. GPP propagates the pedestrian walking information toward these neighboring sensing nodes that the pedestrian might pass based on their walking direction. These nodes rely on their location specifications (Location Specification) and the pedestrian walking direction to make predictions.
5.2.1. Trace Event Direction Estimation
The Trace Event direction allows our system to determine which neighboring sensing nodes a pedestrian approaches and which node they are heading away from. So that the system can inform these neighbor nodes of possible structural anomalies causing signal changes, which we will detail in Location Specification. At least two sensing nodes are required to determine the stride direction based on the relative timing of approaching and leaving different sensors (Pan et al., 2014). Each sensing node detects the footstep when a pedestrian passes by. When the pedestrian approaches then leaves the sensor, their footstep signal strength will increase then decrease. The spatiotemporal information of the footstep signal with the highest energy within a consecutive footstep sequence detected by different sensors indicates the order in which the pedestrian passes sensors. Therefore, the system can determine which direction (i.e., from/to which sensor) the pedestrian walks.
5.2.2. Trace Prediction
Propagating the information to the neighboring nodes that need it makes the system robust for ambiguity when people continuously walk by a sensor. To predict which sensor the pedestrian is walking to, the system models all the deployed nodes as vertexes in a graph. If there is a physical route that a pedestrian can walk between two vertexes without passing a third vertex, there is an edge between these two vertexes. We create this graph heuristically at deployment time as a k × k binary table, where k is the node number, and the table entry value indicates if there is connectivity between two nodes. We choose the binary table for computational search efficiency. When pedestrians walk in the building and their stride directions are detected, the system will notify all the other sensing nodes that share an edge with this node in the graph except the one that the person walked from.
5.2.3. Location Specification
Due to various structural factors such as beams and partitions, sensors may have different sensitivity to the same impulse (i.e., same strength and traveling distance). The goal for the GPP is to achieve high resolution for the high signal-to-noise ratio step signals by utilizing the historical information from neighboring sensors. When multiple pedestrians walk by different sensors/locations, the system learns the different impulse response strength between sensors/locations.
When a pedestrian walks by one sensor and is detected, the system models their step energy change and sends it to the neighboring nodes that the pedestrian will pass by next. The neighboring node then adjusts its own amplification setting based on the historical data, which indicates the impulse response strength variation at these different locations. Then, when the pedestrian approaches the neighboring node, the system detects the step signal with highest energy through the structural variation profile as well as detected step signal strength from the last sensor.
5.3. LPP + GPP
To achieve high resolution for both low- and high-amplitude step signals, we combine LPP and GPP. LPP performs better with low-amplitude step signals because the local adjustment mechanism allows these signals to have higher resolution. However, for high-amplitude step signals, the prediction is highly affected by the variation/noise in the human step strength, which could lead to overcompensation for estimation. On the other hand, GPP performs better with high-amplitude step signals because for those low-amplitude step signals within one trace, there is no adjusting mechanism. However, the fixed amplification means low-amplitude step signals will have low resolution. Therefore, by combining the LPP and the GPP, the system can achieve better performance in step signal resolution.
By combining the LPP and GPP, the system utilizes the LPP to handle step signals with low amplitude when they are far from the sensor. When the amplitude increases and the step history is not linear, instead of using the 1/d model as described in Section 5.1.3, the system relies on the GPP to make the decisions. Instead of using the detected highest step signal energy, the GPP utilizes the step signal energy changing rate detected by the prior sensors and matches the current step history changing rate. The system searches the entire step history of the neighbor nodes and matches the changing rate between continuously detected Thhistory number of steps that has the least square error to that on record. It then predicts the next step strength.
6. Implementation
To validate our design, we develop a prototype sensing node with n = 3 amplification settings. We install three operational amplifiers (LMV385) with customized amplification gains on the sensing configuration board. The processor board is connected to the amplifiers through three analog-to-digital converter pins. Based on equation (10) and the sufficient resolution range we defined in Section 4, we have T1/T2 = 1/2, which leads to the ratio of the optimal gains as (1/2)2:(1/2)1:(1/2)0 = 1:2:4. Through empirical measurements of the other constants (T1 = 1.5, k = 3 × 10⁻⁴, R = 9), we obtain optimal gains of 2,000×, 4,000×, and 8,000×.
The geophone we used is SM-24 (Input/Output Inc, 2006), with the sensitivity of 28.8 V/m/s. The theoretical sensing range of the sensor is limited by its max coil excursion, which is 2 mm. However, in practical scenarios, the sensing range is limited by the amplifier voltage, which in our system is 3.3 V. Therefore, when an amplifier with g0 = 1 is applied, the sensing range of the sensor is 0.1146 m/s. When a 10-bits analog-to-digital converter is used, the resolution of the system is 1.12 × 10⁻⁴ m/s, which is not enough to observe signals with peak values in the range of 10−6 and 10−4 m/s. Therefore, when an amplifier with a gain of 2,000× is applied, the sensing range of the sensor is 5.73 × 10⁻⁵ m/s, with a resolution of 5.6 × 10⁻⁸ m/s. Compare to the setting of g0 = 1, this setting has less sensing range but higher resolution. Similarly, the gain of 4,000× and 8,000× enables even higher resolution (2.8 × 10⁻⁸ and 1.4 × 10⁻⁸ m/s, respectively) with less sensing range (2.865 × 10⁻⁵ and 1.43 × 10⁻⁵ m/s, respectively). Therefore, by combining multiple settings, the system achieves high resolution (1.4 × 10⁻⁸ m/s) as well as high sensing range (5.73 × 10⁻⁵ m/s) at the same time.
Implemented amplification gains, however, differ slightly due to practical constraints. We use two-stage amplifiers in the implementation for better signal filtering, because each stage has a differential amplifier serving as a band pass filter. For the first-stage amplifier, we selected the resistor value of 470 kΩ over 10 kΩ for the amplification gain 470/10 = 47. When selecting the first-stage gain, the corresponding resistor should be available and the gain should not cause clipping under most circumstances; otherwise, the clipped signal is smoothed by the second-stage filter. If that happens, the output signal of the second stage will not show evidence of clipping, even though it is distorted. For the second-stage amplifier, we selected the resistor values of 470 kΩ, 1 MΩ, and 2 MΩ to achieve the designated gain. The calculated gains from this combination were 2,200 ≈ 47 × 47, 4,700 = 47 × 100, and 9,400 = 47 × 200, respectively. However, due to the limited open loop gain and filtering effects of the two-level OpAmp circuit, the actual gains of the configuration were approximately g1 = 2,200, g2 = 4,400, and g3 = 6,400 (Low-Voltage, 2009). With chosen configurations, over 90% of the impulses induced by detected footsteps are not clipped with g1, and the background structural vibration noise after amplification is still less than 1/10 of the entire resolution range with g3.
We placed a prototype sensing node, which is shown in Figure 5, in a hallway and collected data from all configurations when a pedestrian passed by, and the signals are shown in Figure 6. The blue, red, and black lines mark signals collected with configurations of g3, g2, and g1 respectively. Figures 6A–C are signals collected with fixed configurations, from which we can see footstep signals of different amplitude. Figure 6D demonstrates the footstep signals of highest resolution without clipping, i.e., the first six footsteps of g1 configuration, and the rest signals of g2 and g3 configurations. To automatically adapt these configurations during sensing, the signal condition prediction is needed, which we will explain in the next section.
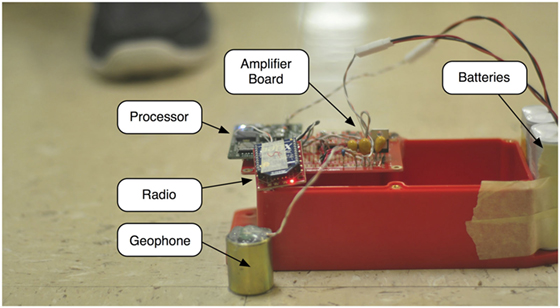
Figure 5. Sensing node.
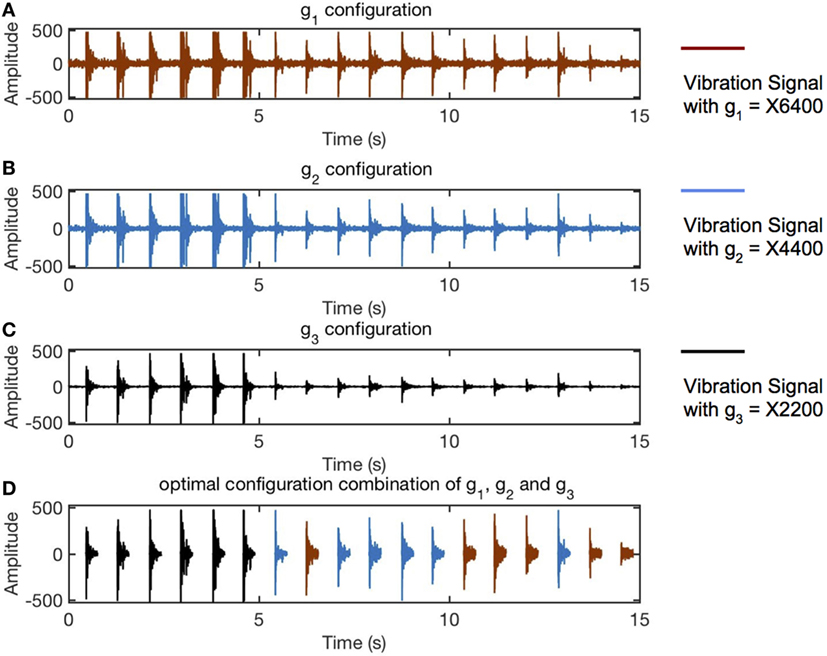
Figure 6. Example of multiple amplification gain configuration. (A–C) Signals collected with amplification gain of 2,200, 4,400, and 6,400. (D) The signal of optimal resolution selection from events detected in panels (A–C). The impulses shown as black lines are of gain 2,200, and those shown as red lines are of gain 4,400. The blue lines are the original line from panel (A) which is of the starting amplification gain 6,400.
7. Evaluation
To understand the system’s performance on high-fidelity signal acquisition, we conduct pedestrian monitoring experiments to evaluate the system. First of all, we introduce the metrics used to define the “high-fidelity signal,” which is used to measure the performance of the system. Next, we present the experiments. Finally, we analyze the results of experiments to verify our system design.
7.1. Evaluation Metrics
Signals that exhibit high distortion or low resolution make it difficult if not impossible to acquire accurate information on vibrations induced by different impulses. Thus, we define “high-fidelity signals” to be signals that minimize signal distortion and noise while maximizing signal resolution. In this subsection, we present the metrics we use to measure and evaluate high-fidelity signals quantitatively.
7.1.1. Signal Resolution
Signal resolution in the context of this paper refers to the number of bits used to represent a signal. We defined the sufficient resolution range in Section 4. To determine if a Step Event is of sufficient resolution, its magnitude is calculated as the maximum absolute value of the zero-mean Step Event signal, and if the magnitude falls into the defined sufficient resolution range, we consider this Step Event is of sufficient resolution. Therefore, the rate of Step Events that of sufficient resolution over all the detected Step Events measures the general signal resolution level. Based on such definition, we define sufficient resolution rate (SRR) as
The higher the SRR value, the more signals of high resolution, and the higher the general signal resolution. In the analysis, we normalize the SRR by the maximum possible SRR value the given system hardware configurations can achieve. This normalized SRR evaluates the performance of LPP and GPP.
7.1.2. Signal Distortion
Signal distortion refers to the degree a measured signal shape differs from the defined baseline. In this work, we focus on the distortion caused by clipping. Therefore, to measure the proportion of Step Events that suffers from such distortion, we calculate the clipping rate of the detected Step Events. The lower the clipping rate, the less signal distortion the system experiences.
7.1.3. Signal Magnitude
Signal magnitude is defined as the maximum absolute value of a zero-mean step event signal. It indicates how many digits are actually used to represent the signal. In the ideal scenario, the system should achieve maximum signal magnitude for each predicted step event signal. However, due to the variation and randomness in human activities as well as the monitored structure, the prediction result can vary, i.e., even a Step Event is count as of sufficient resolution, it might not have maximum magnitude. On the other hand, for different definitions of sufficient resolution, the same magnitude may be of sufficient or insufficient resolution. Therefore, we used magnitude to reveal detailed information about each Step Event.
7.2. Experiment
We conducted experiments to evaluate the system from three different perspectives. First of all, to understand the variables of the proposed system, we evaluated the calculated configuration setting, LPP, and GPP, respectively, through a simulation with different numbers of amplification levels (l < n) implemented (Section 7.3). Then to evaluate the signal quality with the implemented hardware, we placed five sensing nodes in a busy hallway and measured the signal condition with and without our system (Section 7.4). Finally, we evaluated the system’s localization performance by comparing the localization accuracy with and without the adaptive amplification design (Section 7.5).
7.3. Evaluation I: System Variables
The system design is determined by two factors as discussed in Section 4: (1) the definition of sufficient resolution and (2) the implemented number of amplification gains. In this section, we specifically evaluate the system behavior in these two factors under perfect amplification settings by generating an amplified 10-bit signal through a high resolution oscilloscope signal of people walking by one sensor.
In total, 15 traces are collected as the seeds for the 10-bit signal generation. Each seed generates N traces of different amplification settings. The minimum amplification gain does not have any signal beyond the sufficient resolution, while the maximum amplification gain has maximum 0.5% clipped signal among the entire trace of signals. This discrepancy means the starting and ending steps are not clipped while most of the close-to-sensor step signals are clipped. In total 5 sensors with different structural impulse response strength rates are simulated for each collected trace. For the first sensor, the step strength for each trace is derived from the seed, and for the rest of the sensors, the step strength for each step is calculated with a ratio of structural_rate × (1 + human_noise) to simulate the human behavior noise as well as structural variation.
We compare five cases in general: (1) only the LPP algorithm; (2) the baseline, which is defined as the median amplification level available; (3) the ground truth, which is the upper bound performance the system can achieve with the implemented hardware, i.e., the system rejects the settings that result in clipping signal and keeps the highest resolution signal that is not clipped; (4) only the GPP algorithm; and (5) both the LPP and GPP conducted collaborative sensing as discussed in Section 5.3. The acronyms used in the evaluation section are summarized in Table 3.
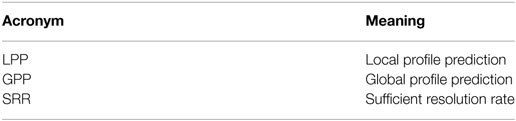
Table 3. Acronyms.
7.3.1. Sufficient Resolution Definition
To understand the effects of different sufficient resolution definition, we define the sufficient resolution parameter as T2 = 1,024 and T1 = i/16 T2, with i = 1, …, 15. For each definition case, we generate N level of amplified traces as described earlier and run the LPP algorithm through the N level amplifications. Figure 7 demonstrates the SRR, clipping rate, and signal magnitude of the results: (1) the blue line with + markers demonstrates the LPP algorithm, (2) the red line demonstrates the baseline, (3) the yellow line demonstrates the ground truth result, (4) the purple line with circle markers shows the GPP algorithm, and (5) the green line with cross markers demonstrates results with both LPP and GPP.
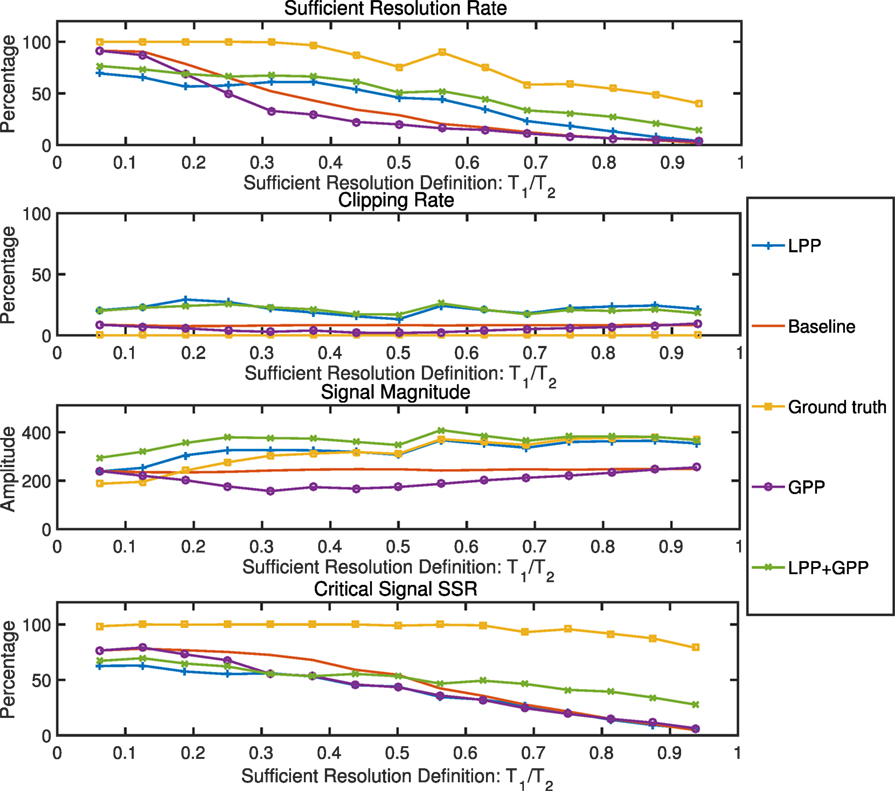
Figure 7. System parameter change: sufficient resolution definition. When the sufficient resolution definition becomes restrict (range [T1, T2] reduces), the SRR reduced for all cases, including LPP, baseline, ground truth, GPP, and LPP + GPP.
When the value of T1/T2 is low, meaning a large portion of the signal between −512 and 512 is considered as sufficient resolution, the change between different amplification gains is large (gi+1/gi = T2/T1). Therefore, a lower number of amplifiers (N) are needed to cover the variation of the footstep signals. This also means that more low magnitude step signals are considered as signals of sufficient resolution and have a high SRR and a low signal magnitude. With the increase of the value of T1/T2, the clipping rate remains stable, while the signal magnitude increases. This means that the signal quality increases, but due to the increment of the sufficient resolution definition, the SRR decreases. In addition, since the GPP is focused on decreasing the clipping rate and hence increasing the sufficient resolution rate, we further explore a fourth metric, the critical signal SRR, which includes only 5 steps with the highest signal-to-noise ratio in a trace.
LPP in general outperforms the baseline when the definition of the sufficient resolution is over 1/4 of the entire resolution range in terms of SRR and signal magnitude by an average of 5 and 34%, respectively. GPP reduces the clipping rate when compared to the baseline when the sufficient resolution is between 1/4 and 3/4 of the entire resolution range, therefore causing a clipping rate 1.6× lower and lowering the signal magnitude as well. When LPP and GPP are combined, the SRR is higher than either algorithm performing alone by 10% on average and raises the signal magnitude by 12% on average. In general, for all the metrics, the LPP and GPP combination follows the trend of LPP and outperforms the LPP mostly in the critical step signals with high signal-to-noise ratio. This advantage shows an average increase of 10% and up to 4× increase for the highest T1/T2 value when the definition of the sufficient resolution is of a high standard (T1/T2 value high) for the critical step signal SRR.
7.3.2. Number of Amplifications
In an ideal scenario, the system could have an infinite number of amplification levels to cover an infinite range of amplification needs. However, in reality, only a limited number of amplification levels can be implemented. Because of this, the number of amplifications actually implemented affects the amplification range the system can achieve and therefore affects the system performance. Based on the results from the experiment results in Section 7.3.1, we selected the definition of T1/T2 = 12/16, which introduces seven levels of amplification gains. The number is selected so that there are large enough available amplification gains involved to demonstrate the system performance when different numbers of amplification gains are implemented.
To understand the number of implementation of amplifications, we selected the median level of amplification, then increased the number of levels by adding one smaller and one larger amplification gain each time, and explored the system performance with these different number of gains. Figure 8 shows the evaluation results of SRR, clipping rate, and the signal magnitude when these different numbers of amplification gains are used. Each metric shows an increasing trend for all evaluated scenarios except the baseline, since the baseline is a fixed amplification setting only affected by the definition of the sufficient resolution rate. The more amplification gain levels are implemented, the more adaptable levels can be used for selection, therefore increasing the sufficient resolution rate and signal magnitude. On the other hand, the more choices on the high amplification gains the system is allowed to have, the higher the chance that the system selects a higher amplification gain that causes clipping, hence the increasing clipping rate as well.
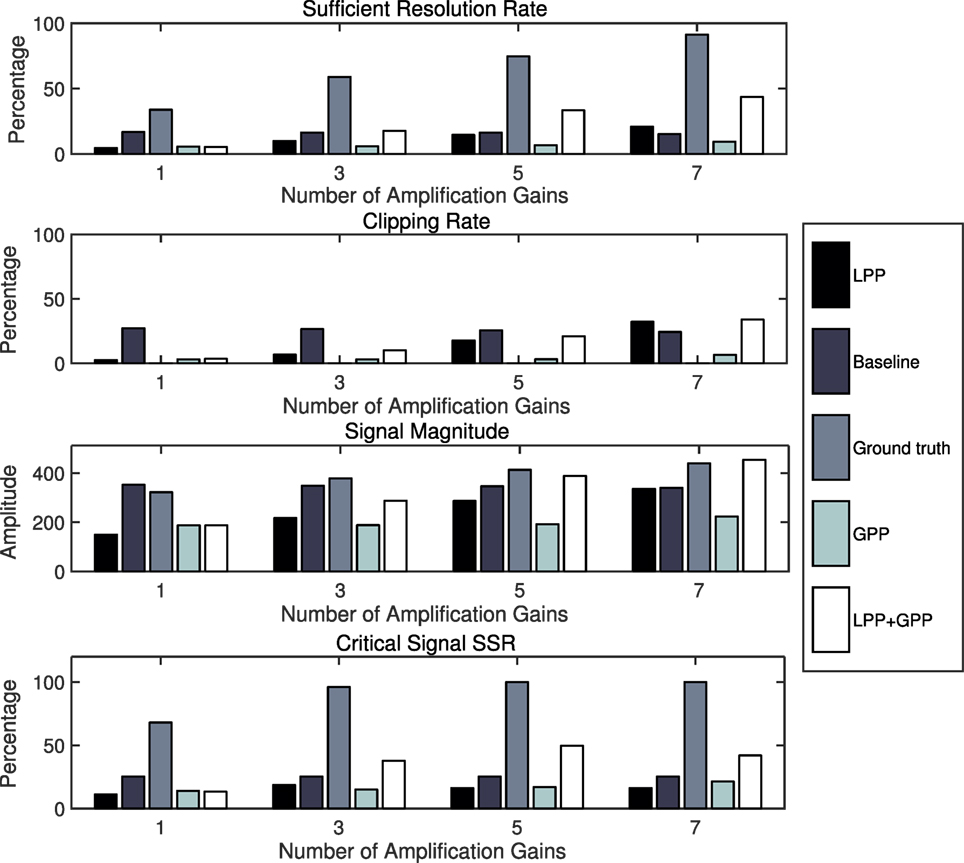
Figure 8. System parameter change: number of amplification gains. When the number of amplification gain implemented is increased, the SRR of the ground truth and the LPP + GPP increases. The clipping rate of the ground truth remains zero since the system can always reject the clipped signal, while that of the LPP + GPP increases due to the prediction error.
7.4. Evaluation II: Adaptive Amplification
To evaluate the system performance in the real-world scenario, we conducted the experiment with a small-scale deployment of five sensing nodes in a school building. We mounted these sensing nodes in a hallway (approximately 20 m × 2 m area, tile floor) inside the school building as shown in Figure 9. The system sampled the vibration data at 1,000 Hz in three amplification configurations. The Real-Time-Clock module on each sensing node provided timestamps for each sensing node’s data collection. 10 subjects were asked to walk naturally down a hallway with no restriction on activities (e.g., cell phones, conversing), with the footstep data being picked up by the system. Figure 10 demonstrates an example of one of the subjects walks along the hallway passing five sensors deployed.
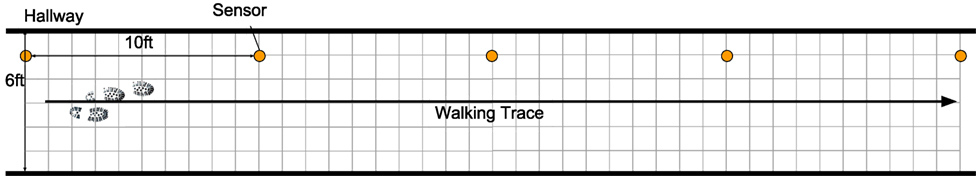
Figure 9. Deployment floor plan of experimental setups in a school building. Five sensing nodes are deployed in a straight line, approximately 3 m apart. Sensors are directly attached to the floor.
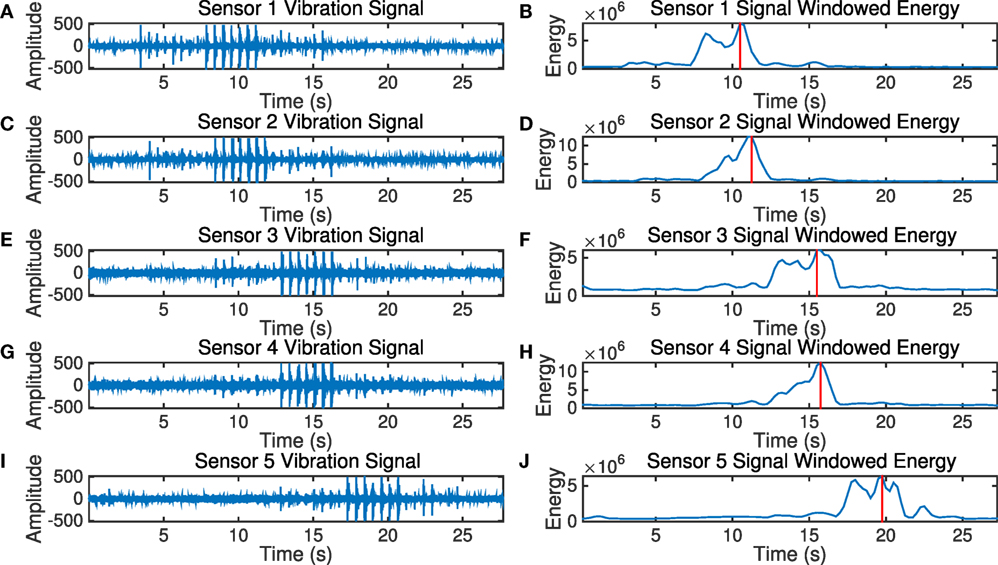
Figure 10. Structural vibration signal detected by sensors when a pedestrian walks by. (A) Sensor 1 vibration signal. (B) Sensor 1 signal windowed energy. (C) Sensor 2 vibration signal. (D) Sensor 2 signal windowed energy. (E) Sensor 3 vibration signal. (F) Sensor 3 signal windowed energy. (G) Sensor 4 vibration signal. (H) Sensor 4 signal windowed energy. (I) Sensor 5 vibration signal. (J) Sensor 5 signal windowed energy.
With the data from the experiment, we conduct configuration adaptation to compare our system (LPP + GPP) with fixed configurations. Figure 11A shows the normalized SRR from three different fixed amplification configurations (g1 = 2,200, g2 = 4,400, and g3 = 6,400), an adaptive configuration using only LPP, and an adaptive configuration with LPP + GPP, respectively, 32, 36, 61, 67, and 69%. The system improvement comparing to g1, g2, and g3 are at least 1.7× and up to 2×. Note that the algorithm is designed for regular footsteps, i.e., footsteps from the same person are assumed to be the same impulses, and uses fixed padding values (P1 and P2 as described in Section 5.1.3). However, the randomness in human footsteps introduced prediction errors, leading to an approximately 30% lower SRR value compared to hardware limitation. The LPP achieves higher SRR compared to that of g1, g2, and g3. g3 and g2 amplify the near field signal so that many of the signals are clipped, leading to low count on sufficient resolution rate. To validate that, we also demonstrated clipping rate of these configurations in Figure 11B, of which values are, respectively, 3, 15, 21, 11, and 11%. g1 obtains most of the near field signals without clipping, but the far field signals are of low resolution due to insufficient amplification, therefore lowering the SRR. In order to understand the low resolution effects, we also present average signal magnitude in Figure 11C. As mentioned earlier, the magnitude of a signal is defined as the maximum absolute value of the zero-mean signal. The figure shows that fixed gains have an expected effect on magnitude while LPP and GPP sometimes reduce and increase gain as needed. The GPP only made slightly higher SRR comparing to LPP in this experiment due to the relative uniform nature of the structure.
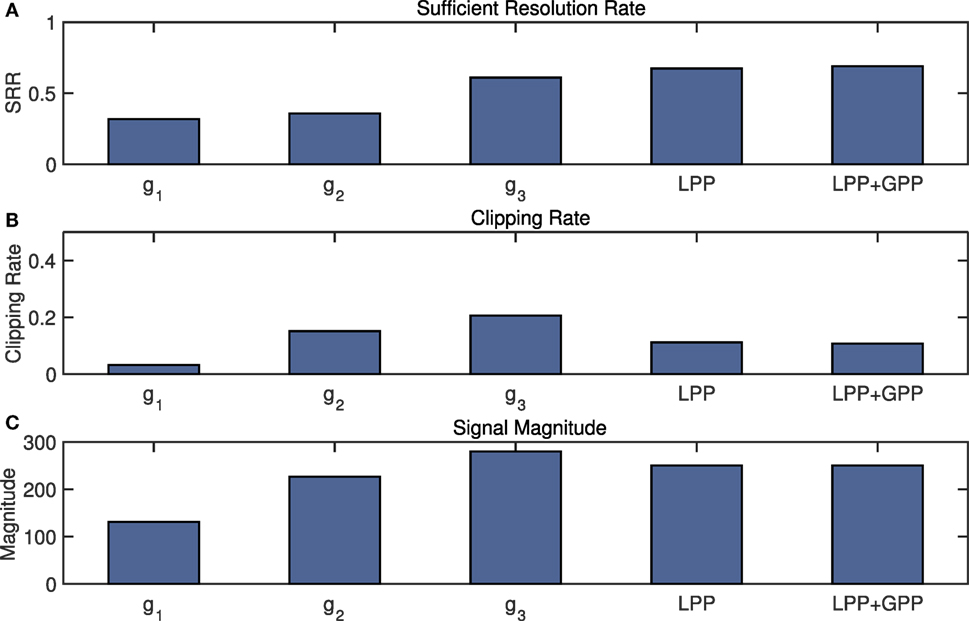
Figure 11. Evaluation of the system with the system performance experiment. Approximate amplification ratios for fixed sensing configurations are g1 = 2,200, g2 = 4,400, and g3 = 6,400. The performance of LPP, as well as LPP + GPP, has higher SRR than the fixed configurations. g3 has highest average signal magnitude resulting from its high clipping rate. Therefore, LPP + GPP’s over all performance is improved compared to fixed amplification gains. GPP results are similar to LPP results due to the lack of structural effects in this experiment. (A) Sufficient resolution rate. (B) Clipping rate. (C) Signal magnitude.
7.5. Evaluation III: Application
We further investigated the system with the application of 1-D localization based on a footstep-induced vibration amplitude decay model (Viktorov, 1970). Based on the Rayleigh-Lamb wave propagation model, we used the system to locate where the pedestrian passes the sensor in a hallway. Accurately detecting the passing point allows localization of the person in one dimension. To evaluate that, we fixed the parameters we investigated in Section 7.3 to T1/T2 = 12/16 and the number of amplification levels as 7. Then, we selected the detected step signal with the highest amplitude as the passing point. We compared the step count error of our system to that of the fixed amplification, in this case selecting the middle level (level 4). The average error for our system in detecting the step where the pedestrian is passing the sensor is 0.47 m, and the average error for the fixed amplification is 1.13 m. Our system shows a 2× less step error when used to locate the pedestrian steps.
8. Discussion
In this section, we discuss the system limitations, the design trade-off, the multiple pedestrian sensing conditions, and the motivating use-cases for the system.
8.1. System Limitations
The limitations of our system come from mainly two assumptions: (1) the assumption that pedestrian-induced structural vibrations have the signal strength that can be predicted and (2) the assumption that the algorithm selects from the amplification configurations so that the monitored signal has a sufficient resolution using at least one of the amplifier gains. When the pedestrian-induced structural vibration strength is not predictable, e.g., erratic crowd behavior, the system prediction accuracy will decrease, which will reduce the signal fidelity. When the monitored signal is extremely high or low in amplitude, the system configuration may always be clipping or of insufficient resolution, despite the accurate prediction, due to a limited number of amplifier configurations.
8.2. Design Trade-offs
Our system implementation considers the trade-offs between a number of analog-to-digital converters and the sampling rate. When the system has access to a large enough number of analog-to-digital converters, which connects to a large enough number of amplification settings, and can sample at a high enough rate, the system, in theory, can obtain highest resolution signal for all monitored structural responses. When the number of analog-to-digital converters is limited, and the sampling rate is high enough, the system can still obtain signals from all available amplification settings. In this case, the system can reject clipped signals, and keep the highest resolution signal without clipping, which is the ground truth scenario in our evaluation. In many practical scenarios, however, it is difficult if not impossible for the system to sample many analog-to-digital converters at the same time, due to limited sampling rates. Then, the LPP and the GPP are used to predict and select the amplification settings needed, and the prediction errors cause the clipping and insufficient resolution incidences we see in the evaluation.
8.3. Multiple People Sensing
When multiple people passing the sensing area at the same time, the vibration signals induced by their steps mix. When people passing by the sensing area in a different manner (side by side, one after another, toward each other, etc.), their footstep signals may show different energy change patterns, which may not agree with the heuristic rules used in LPP. In this case, our system can utilize the mobility model of the pedestrians and rely on the GPP more than LPP to achieve more stable prediction of the structural response strengths.
8.4. Motivating Use-Cases
Monitoring human activity-induced excitations enables human information inference. When people walk on the floor, the footstep-induced structural vibration can be used to track, identify, and count pedestrian in the sensing area (Pan et al., 2014, 2015, 2016; Mirshekari et al., 2016). When people lie on the bed, their heartbeat-induced vibration can also be detected, hence be used for health status estimation (Jia et al., 2016). When people cook in the kitchen, play games in the living room, or cleaning in the house, their interaction with the physical environment induces structural vibration too, which enables activity recognition (Kodeswaran et al., 2016). Furthermore, this inevitable interaction with the objects in the physical environment makes it possible to turn ambient objects with a flat solid surface into a touch screen (Pan et al., 2017). These types of information enable smart home applications such as kid monitoring and kitchen safety monitoring. When deployed in large-scale scenarios, such as in a nursing home or hospital, the human activity-induced excitation monitoring can enable patient/elderly monitoring.
9. Conclusion
In this paper, we introduce a high-fidelity structural vibration acquisition sensing system. It is an easy-to-install sparse sensing system that improves the sensing signal fidelity through adapting hardware configurations based on target signal prediction. The prediction is achieved through two key aspects: (1) each individual sensor predicts the step strength change based on a pedestrian walking model and (2) networked devices collaboratively predict the step strength through a global profile on a structural variation model. In our pedestrian footstep monitoring application, our system demonstrated up to 2× increase on SRR in our evaluation experiments and up to 2× less error rate when used to locate the pedestrian when they walk along the hallway. We believe that such a signal acquisition system can be applied to various future applications in smart buildings for human activity-induced excitation vibration data acquisition.
Ethics Statement
This study was carried out in accordance with the recommendations of “CMU IRB Consent Form” with written informed consent from all subjects. All subjects gave written informed consent in accordance with the Declaration of Helsinki. The protocol was approved by the “CMU IRB committee,” IRB Protocol Number: HS15-009.
Author Contributions
Conception and design of the study; drafting/revising the manuscript: SP, SX, MM, PZ, and HN. Acquisition of data: SP. Analysis and/or interpretation of data: SP and SX.
Conflict of Interest Statement
The authors declare that the research was conducted in the absence of any commercial or financial relationships that could be construed as a potential conflict of interest.
Funding
This work is partially supported by Intel, Pennsylvania Infrastructure Technology Alliance (PITA)—a partnership of Carnegie Mellon, Lehigh University, and the Commonwealth of Pennsylvania’s Department of Community and Economic Development (DCED)—CMU-SYSU Collaborative Innovation Research Center (CIRC), and Google.
References
Bales, D., Tarazaga, P., Kasarda, M., Batra, D., Woolard, A., Poston, J. D., et al. (2016a). Gender classification of walkers via underfloor accelerometer measurements. IEEE Internet Things J. 3, 1259–1266. doi:10.1109/JIOT.2016.2582723
Bales, D., Tarazaga, P., Kasarda, M., and Batra, D. (2016b). “Gender classification using under floor vibration measurements,” in Dynamics of Coupled Structures, Vol. 4 (Orlando: Springer), 377–383.
Barzilai, A. (2000). Improving a Geophone to Produce an Affordable Broadband Seismometer. Stanford: Mechanical Engineering, Stanford University.
Dobbler, K., Fišer, M., Fellner, M., and Rettenbacher, B. (2014). “Vibroacoustic monitoring: techniques for human gait analysis in smart homes,” in Ambient Assisted Living (Berlin: Springer), 47–58.
Ekimov, A., and Sabatier, J. M. (2006). Vibration and sound signatures of human footsteps in buildings. J. Acoust. Soc. Am. 120, 762–768. doi:10.1121/1.2217371
Gutowski, T. G., and Dym, C. L. (1976). Propagation of ground vibration: a review. J. Sound Vib. 49, 179–193. doi:10.1016/0022-460X(76)90495-8
Input/Output Inc. (2006). Geophone sm-24. Available at: https://www.sparkfun.com/products/11744
Itai, A., and Yasukawa, H. (2008). “Footstep classification using simple speech recognition technique,” in IEEE International Symposium on Circuits and Systems, 2008. ISCAS 2008 (Seattle, WA: IEEE), 3234–3237.
Janssen, A., Veldhuis, R., and Vries, L. (1986). Adaptive interpolation of discrete-time signals that can be modeled as autoregressive processes. IEEE Trans. Acoust. Speech Signal Process 34, 317–330. doi:10.1109/TASSP.1986.1164824
Jia, Z., Alaziz, M., Chi, X., Howard, R. E., Zhang, Y., Zhang, P., et al. (2016). “Hb-phone: a bed-mounted geophone-based heartbeat monitoring system,” in 2016 15th ACM/IEEE International Conference on Information Processing in Sensor Networks (IPSN) (Vienna, Austria: IEEE), 1–12.
Kitic, S., Jacques, L., Madhu, N., Hopwood, M. P., Spriet, A., and De Vleeschouwer, C. (2013). “Consistent iterative hard thresholding for signal declipping,” in 2013 IEEE International Conference on Acoustics, Speech and Signal Processing (ICASSP) (Ithaca, NY: IEEE), 5939–5943.
Kodeswaran, P. A., Kokku, R., Sen, S., and Srivatsa, M. (2016). “Idea: a system for efficient failure management in smart IoT environments,” in Proceedings of the 14th Annual International Conference on Mobile Systems, Applications, and Services (Singapore: ACM), 43–56.
Krochmal, A. C., Stewart, D. P., and Whitecar, J. E. (2007). Variable Distortion Limiter Using Clip Detect Predictor. US patent 7202731.
Loetwassana, W., Punchalard, R., Lorsawatsiri, A., Koseeyaporn, J., and Wardkein, P. (2007). “Adaptive howling suppressor in an audio amplifier system,” in Asia-Pacific Conference on Communications (Bangkok: IEEE), 445–448.
Mirshekari, M., Pan, S., Bannis, A., Lam, Y. P. M., Zhang, P., and Noh, H. Y. (2015). “Step-level person localization through sparse sensing of structural vibration,” in Proceedings of the 14th International Conference on Information Processing in Sensor Networks (Seattle, WA: ACM), 376–377.
Mirshekari, M., Pan, S., Zhang, P., and Noh, H. Y. (2016). “Characterizing wave propagation to improve indoor step-level person localization using floor vibration,” in SPIE Smart Structures and Materials+ Nondestructive Evaluation and Health Monitoring (Las Vegas, NV: International Society for Optics and Photonics), 980305–980305.
Miura, S., Nakajima, H., Miyabe, S., Makino, S., Yamada, T., and Nakadai, K. (2011). “Restoration of clipped audio signal using recursive vector projection,” in TENCON 2011-2011 IEEE Region 10 Conference (Bali: IEEE), 394–397.
Pan, S., Bonde, A., Jing, J., Zhang, L., Zhang, P., and Noh, H. (2014). “BOES: building occupancy estimation system using sparse ambient vibration monitoring,” in SPIE Smart Structures and Materials+ Nondestructive Evaluation and Health Monitoring (San Diego, CA: International Society for Optics and Photonics), 90611O.
Pan, S., Mirshekari, M., Zhang, P., and Noh, H. Y. (2016). “Occupant traffic estimation through structural vibration sensing,” in SPIE Smart Structures and Materials+ Nondestructive Evaluation and Health Monitoring (Las Vegas, NV: International Society for Optics and Photonics), 980306.
Pan, S., Ramirez, C., Mirshekari, M., Fagert, J., Chung, A. J., Hu, C. C., et al. (2017). “SurfaceVibe: vibration-based tap and swipe tracking on ubiquitous surfaces,” in 2017 15th ACM/IEEE International Conference on Information Processing in Sensor Networks (IPSN) (Pittsburgh, PA: IEEE), 1–12.
Pan, S., Wang, N., Qian, Y., Velibeyoglu, I., Noh, H. Y., and Zhang, P. (2015). “Indoor person identification through footstep induced structural vibration,” in Proceedings of the 16th International Workshop on Mobile Computing Systems and Applications (Santa Fe, NM: ACM), 81–86.
Poston, J. D., Schloemann, J., Buehrer, R. M., Malladi, V., Woolard, A. G., and Tarazaga, P. A. (2015). “Towards indoor localization of pedestrians via smart building vibration sensing,” in 2015 International Conference on Localization and GNSS (ICL-GNSS) (Gothenburg: IEEE), 1–6.
Schloemann, J., Malladi, V. S., Woolard, A. G., Hamilton, J. M., Buehrer, R. M., and Tarazaga, P. A. (2015). “Vibration event localization in an instrumented building,” in Experimental Techniques, Rotating Machinery, and Acoustics, Vol. 8 (Orlando: Springer), 265–271.
Subramanian, A., Mehrotra, K. G., Mohan, C. K., Varshney, P. K., and Damarla, T. (2010). “Feature selection and occupancy classification using seismic sensors,” in International Conference on Industrial, Engineering and Other Applications of Applied Intelligent Systems (Cordoba: Springer), 605–614.
Verhas, H. (1979). Prediction of the propagation of train-induced ground vibration. J. Sound Vib. 66, 371–376. doi:10.1016/0022-460X(79)90854-X
Keywords: structural vibration sensing, indirect sensing, pedestrian monitoring, structural response monitoring, collaboratively adaptive sensing
Citation: Pan S, Xu S, Mirshekari M, Zhang P and Noh HY (2017) Collaboratively Adaptive Vibration Sensing System for High-fidelity Monitoring of Structural Responses Induced by Pedestrians. Front. Built Environ. 3:28. doi: 10.3389/fbuil.2017.00028
Received: 09 January 2017; Accepted: 13 April 2017;
Published: 08 May 2017
Edited by:
Benny Raphael, Indian Institute of Technology Madras, IndiaReviewed by:
Dimitrios Giagopoulos, University of Western Macedonia, GreeceIrwanda Laory, University of Warwick, UK
Kirk Grimmelsman, Intelligent Infrastructure Systems, USA
Copyright: © 2017 Pan, Xu, Mirshekari, Zhang and Noh. This is an open-access article distributed under the terms of the Creative Commons Attribution License (CC BY). The use, distribution or reproduction in other forums is permitted, provided the original author(s) or licensor are credited and that the original publication in this journal is cited, in accordance with accepted academic practice. No use, distribution or reproduction is permitted which does not comply with these terms.
*Correspondence: Shijia Pan, c2hpamlhcGFuQGNtdS5lZHU=