 Nobuhito Mori
 Ario Muhammad
 Katsuichiro Goda
 Tomohiro Yasuda4
- 1Disaster Prevention Research Institute, Kyoto University, Kyoto, Japan
- 2Department of Civil Engineering, University of Bristol, Bristol, United Kingdom
- 3Department of Civil Engineering, University of Narotama, Surabaya, Indonesia
- 4Department of Civil, Environmental and Applied System Engineering, Kansai University, Suita, Japan
- 5Centro de Ciencias de la Atmósfera, Universidad Nacional Autónoma de México, Mexico City, Mexico
This study develops a novel computational framework to carry out probabilistic tsunami hazard assessment for the Pacific coast of Mexico. The new approach enables the consideration of stochastic tsunami source scenarios having variable fault geometry and heterogeneous slip that are constrained by an extensive database of rupture models for historical earthquakes around the world. The assessment focuses upon the 1995 Jalisco–Colima Earthquake Tsunami from a retrospective viewpoint. Numerous source scenarios of large subduction earthquakes are generated to assess the sensitivity and variability of tsunami inundation characteristics of the target region. Analyses of nine slip models along the Mexican Pacific coast are performed, and statistical characteristics of slips (e.g., coherent structures of slip spectra) are estimated. The source variability allows exploring a wide range of tsunami scenarios for a moment magnitude (Mw) 8 subduction earthquake in the Mexican Pacific region to conduct thorough sensitivity analyses and to quantify the tsunami height variability. The numerical results indicate a strong sensitivity of maximum tsunami height to major slip locations in the source and indicate major uncertainty at the first peak of tsunami waves.
Introduction
An accurate assessment of tsunami hazards and quantification of uncertainty associated with the assessment are essential to mitigate and to control disaster risk exposures from a tsunami risk management point of view. Research on probabilistic tsunami hazard analysis/assessment (PTHA) has been improved after two mega seismic events, the 2004 Indian Ocean Tsunami (e.g., McCloskey et al., 2008) and the 2011 Tohoku Earthquake Tsunami (e.g., Mori et al., 2011). PTHA is a viable approach to evaluate the uncertainty of tsunami sources and related hazard modeling. One of the major challenges for tsunami impact assessment is to predict the earthquake source characteristics of future tsunamigenic events (e.g., location and geometric slip distribution), and then to quantify the uncertainty associated with the variability in earthquake rupture (tsunami generation) and tsunami inundation processes (e.g., Burbidge et al., 2008). In particular, tsunami generation is influenced by the complex and non-linear interaction of earthquake generation properties, while offshore tsunami propagation, affected by changes in sea bathymetry, is generally considered as a solved problem (Geist, 2002; McCloskey et al., 2008; Goda et al., 2014).
There are many scientific studies related to PTHA, which have been conducted worldwide. The earliest study that considered the probabilistic nature of tsunami hazard was by Rikitake and Aida (1988). Although they did not consider a full PTHA methodology, they used historical records and a typical earthquake fault model to estimate the probability of tsunami height exceeding a certain level at the shoreline. After the 2004 Indian Ocean event, there were several PTHA studies for other areas worldwide (e.g., Geist and Parsons, 2006; Annaka et al., 2007; Thio et al., 2007) and it accelerated after the 2011 Tohoku Earthquake Tsunami (e.g., Goda et al., 2015; Park and Cox, 2016). There are three major approaches for PTHA, which are commonly used [see a review article by Mori et al. (2017)]. The first approach is to use a combination of many source scenarios based on expert opinion (e.g., González et al., 2009). The second approach is to use a logic-tree based on a combination of slip scenarios and geometric slip parameters with a weight function (e.g., Sánchez and Farreras, 1987; Annaka et al., 2007; Horspool et al., 2014; Fukutani et al., 2015; Lorito et al., 2015; Park and Cox, 2016). The third approach is to generate synthetic slip distributions, which are constrained by seismological theories and models, by slip wavenumber spectra assuming a random phase approximation (e.g., Geist and Oglesby, 2014; Goda et al., 2014, 2015; Davies et al., 2015). The latter two methods are widely used for PTHA. Moreover, PTHA for landslide-triggered tsunamis is challenging and involves significant uncertainty in the tsunami generation process (e.g., Geist and Lynett, 2014).
The Pacific States of Mexico, i.e., Jalisco, Michoacan, Guerrero, and Oaxaca, are positioned at the subduction interface between the Rivera–Cocos Plates and the North American Plate (Bird, 2003). The slip rate along the plate boundary is in the range between 50 and 70 mm/year (DeMets et al., 1994), and hence, the potential for hosting large earthquakes is high. Historically, many large subduction earthquakes have occurred, causing severe shaking along the coastline and inland areas (e.g., Mexico City), and tsunami damage in coastal areas. Particularly, for this region, one of the major earthquakes that have been studied in the literature is the 28 March 1787 Earthquake (Suárez and Albini, 2009). According to the historical records, tsunami wave heights at specific locations had exceeded 10 m, and extensive inundation had occurred along southern Pacific Mexican coast (Nunez-Cornu et al., 2008). The estimated magnitude for this event ranges from Mw 8.4 to Mw 8.6. More recently, many moderate-to-large earthquakes have occurred in the Mexican subduction zone (Ramírez-Herrera et al., 2012). The large (>Mw 8) earthquakes in this zone include the 1932 Jalisco Earthquake (Farreras and Sánchez, 1991; Ramírez-Herrera et al., 2014), the 1985 Michoacan Earthquake (Mendoza, 1993), and the 1995 Jalisco–Colima Earthquake [denoted by the 1995 Colima Earthquake hereafter; Mendoza and Hartzell (1999)].
The offshore areas near Guerrero have not ruptured since 1911, which are prone to cause large earthquakes. This segment of the Cocos–North American Plate interface is referred to as the Guerrero seismic gap (Kostoglodov et al., 2003). The recent geophysical investigations by Perez-Campos et al. (2008) and Pacheco and Singh (2010) indicate that the Cocos Plate is subducting beneath the North American Plate with a dip angle of about 15°, and the slab reaches a depth of about 25 km at the distance of about 65 km from the Trench. In this region, both interface events and inslab events may be generated. Gradually, the subduction interface becomes flatter and becomes almost horizontal at the distance of about 120 km from the Trench (depth of about 40 km). The low coupling of the interface at the distance range beyond 100 km from the Trench results in low seismicity of inslab earthquakes. At the farther distance of about 300 km from the Trench, the subduction interface falls off sharply into the mantle. In the Guerrero seismic gap, some of the accumulated strain along the plate interface is also released as episodic slow slip events (Pacheco and Singh, 2010). Recently, one example of slow slip event sequences was triggered by the 2010 Maule, Chile Earthquake (Zigone et al., 2012).
Regarding future Earthquake–Tsunami events in the Guerrero region, major concerns are that (i) the segment has a potential to host large mega-thrust subduction events and (ii) no events greater than Mw 8 have not occurred in the segment in the recent history. In case of large subduction events, touristic places, such as Acapulco, will be devastated by earthquake and tsunami. Although Geist and Parsons (2006) showed PTHA results based on the logic-tree approach targeted Acapulco region, it is difficult to setup plausible scenarios in the Guerrero region due to lack of scientific data of historical events. A recent study by Perez-Campos et al. (2013) considered a scenario magnitude of Mw 8.2 for the Guerrero seismic gap, having the fault length and fault width of 210 and 90 km, respectively, and average slip of 4.0 m. Even when the magnitude of the scenario event can be defined for disaster risk mitigation purposes, geometry as well as slip distribution of the earthquake rupture may vary significantly. These rupture characteristics have significant influence on the earthquake ground motions as well as tsunamis. In addition, Jaimes et al. (2016) developed tsunami hazard maps in Mexico using several earthquake source scenarios and highlighted that it is essential to incorporate multiple earthquake source scenarios to produce reliable tsunami hazard maps. Therefore, it is important to take into account various earthquake rupture scenarios as part of disaster risk reduction strategy. Furthermore, there are many PTHA studies but the comparisons with historical records are limited. For benchmarking tsunami hazard predictions with past experience and future development of PTHA research, it is important to compare PTHA results to historical observations.
This study develops a stochastic source model for large tsunamigenic earthquakes in the Guerrero region. The stochastic source modeling approach is useful for generating synthetic realizations of realistic source models (Mai and Beroza, 2002). The generated rupture models can be implemented in Monte Carlo tsunami simulation to assess the uncertainty of tsunami propagation and shoaling characteristics (Goda et al., 2014), and such uncertainties can be further propagated in tsunami hazard and damage estimation to promote effective tsunami risk mitigation decisions (Goda and Song, 2016). Recently, new scaling relationships of various earthquake source parameters, such as fault geometry and slip statistics, have been developed for tsunamigenic events (Goda et al., 2016). The new empirical scaling models are based on an extensive statistical analysis of numerous source inversion models of the past earthquakes obtained from the SRCMOD (Mai and Thingbaijam, 2014; see http://equake-rc.info/SRCMOD/), which is an online database of finite-fault rupture models of past earthquakes. Using these equations, source parameters can be predicted by taking into account uncertainty and dependency of other parameters (note: source parameters are physically inter-related and thus prediction errors of these parameters are correlated). In short, stochastic tsunami simulation is valuable for assessing the regional tsunami impact due to future large earthquakes in the Guerrero region.
The study is organized as follows. First, a summary of the finite-fault rupture models for Mexican subduction earthquakes is presented; nine source models are obtained from the SRCMOD database. Based on the characteristics of the source models, a generic fault model for stochastic source modeling in the Guerrero region is developed. In synthesizing earthquake source models, new scaling relationships are implemented in the Monte Carlo tsunami simulation. Then, a numerical procedure of the stochastic tsunami simulation is described for the Guerrero region. Finally, an application of the stochastic tsunami simulation for the 1995 Colima Earthquake is presented, which facilitates the retrospective investigation and comparison with observed tsunamis during the historical event.
Analysis of Historical Sources
Analysis of Fault Models
Numerous source models have been developed for historical Mexican subduction earthquakes. In the well-organized source database, such as SRCMOD (Mai and Thingbaijam, 2014), nine finite-fault models are available for the Mexican subduction zone. The locations of the nine finite-fault models are shown in Figure 1 (see also Table 1). The strike angles of the finite-fault models range from 283° to 309°, which are consistent with the boundary between the Cocos Plate and the North American Plate (Bird, 2003). The dip angles of the source models are typically in the range of 12–14°, except for Model 7.
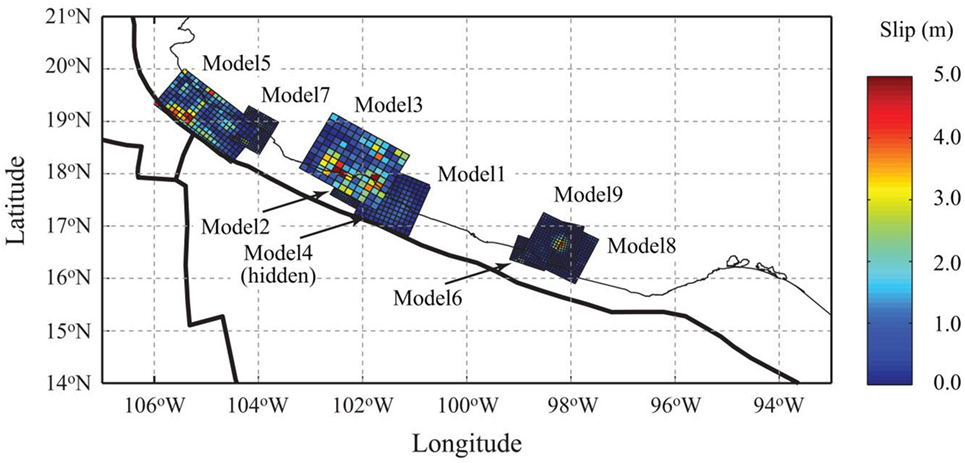
Figure 1. Finite-fault models, along the Mexican Pacific coastline, available in the SRCMOD database (see details of parameters in Table 1).
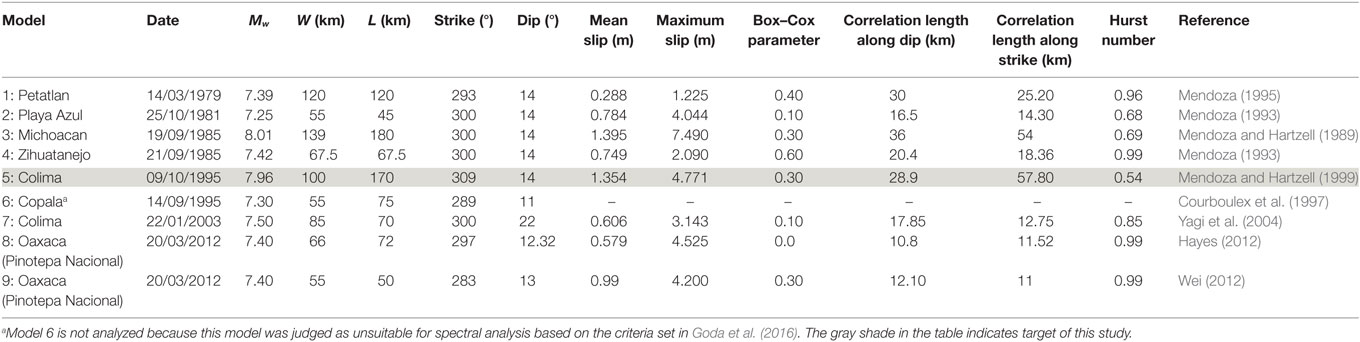
Table 1. Summary of the finite-fault source parameters for the Mexican subduction earthquakes.
Using these finite-fault model data, Goda et al. (2016) evaluated the macro source parameters: fault length (L), fault width (W), mean slip (Da), maximum slip (Dm), Box–Cox parameter (λ), correlation length along strike direction (Az), correlation length along dip direction (Ax), and Hurst number (H) as a function of moment magnitude. The fault width and length, together with strike and dip, define the geometry of the fault plane. The mean slip, maximum slip, and Box–Cox parameter characterize the probability distribution of the slip values. The correlation lengths and Hurst number are used to model the spatial heterogeneity of the slip values. The obtained values of the source parameters for the Mexican subduction earthquakes are listed in Table 1, except for Model 6. Because the majority of the slip values of Model 6 are 0 (Figure 1), Model 6 was regarded as unsuitable for spectral analysis of the source model and thus excluded from further investigations in this study.
Based on the geometry of the Mexican finite-fault models, a generic fault model for the Guerrero region is defined for the synthetic source generation (Figure 2). It covers the offshore region of the Pacific Mexican coast. The length and width of the Guerrero source zone are 930 and 170 km, respectively. The top edge of the fault plane is positioned at a depth of 3 km. The fault plane has a constant strike of 293° and a constant dip of 13°. For stochastic source modeling and Monte Carlo tsunami simulation, the Guerrero source zone is discretized into 10/10 km sub-faults. In stochastic source modeling, slip values that are consistent with the considered spatial slip distribution characteristics are generated.
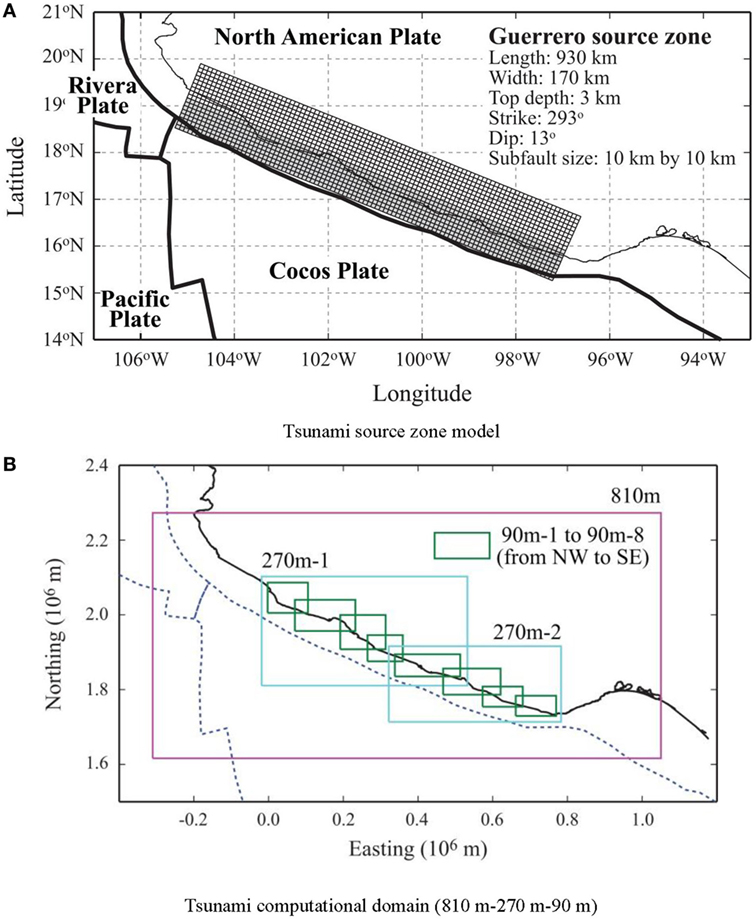
Figure 2. Tsunami source zone model and tsunami propagation domain for the Guerrero region. (A) Tsunami source zone model. (B) Tsunami computational domain (810 m–270 m–90 m).
Scaling Relationships for Source Parameters for Guerrero Region
The stochastic source models are synthesized based on a set of new scaling relationships of source parameters developed by Goda et al. (2016). Equations 1–6 are the relationships for W, L, Da, Dm, Az, and Ax, respectively, and are given as a function of Mw. The error terms of the source parameters are correlated; Table 2 lists the linear correlation coefficients of the prediction errors for Eqs 1–6.
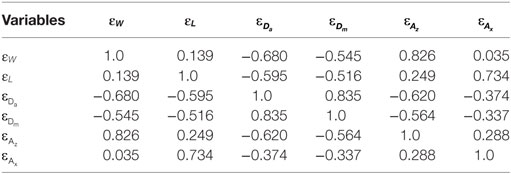
Table 2. Linear correlation coefficients of regression residuals of the scaling relationships for the six earthquake source parameters.
The equations for the Box–Cox parameter and the Hurst number are independent of Mw (Goda et al., 2016). The Box–Cox parameter is modeled as a normal random variable with mean equal to 0.312 and SD equal to 0.278. On the other hand, the Hurst number is modeled as a random variable that takes a deterministic value of 0.99 with probability of 0.43 and a sampled (random) value from the normal distribution with mean equal to 0.714 and SD equal to 0.172 with probability of 0.57. See Goda et al. (2016) for further details of the probabilistic models of the source parameters. The prediction errors of the Box–Cox parameter/Hurst number are considered to be uncorrelated with those of other source parameters.
The consistency of the estimated source parameters for the eight finite-fault models of the Mexican subduction earthquakes (Table 1) with the prediction models of the source parameters mentioned above is examined, and the results are shown in Figure 3. In Figure 3, the results for the 1995 Colima Earthquake by Mendoza and Hartzell (1999) are represented by a different symbol. The stochastic tsunami simulation of the 1995 Colima Earthquake is carried out, in comparison with the field observations, in the latter part of this study. The results shown in Figure 3 indicate that the estimated source parameters agree with the scaling relationships; for most cases, the estimated parameters fall within the 16th–84th percentile confidence interval of the prediction equations, Eqs 1–6. Therefore, the use of the developed scaling relationships by Goda et al. (2016) for Mexican subduction events in the Guerrero region can be justified by the historical slip models along the Pacific Mexican subduction zone.
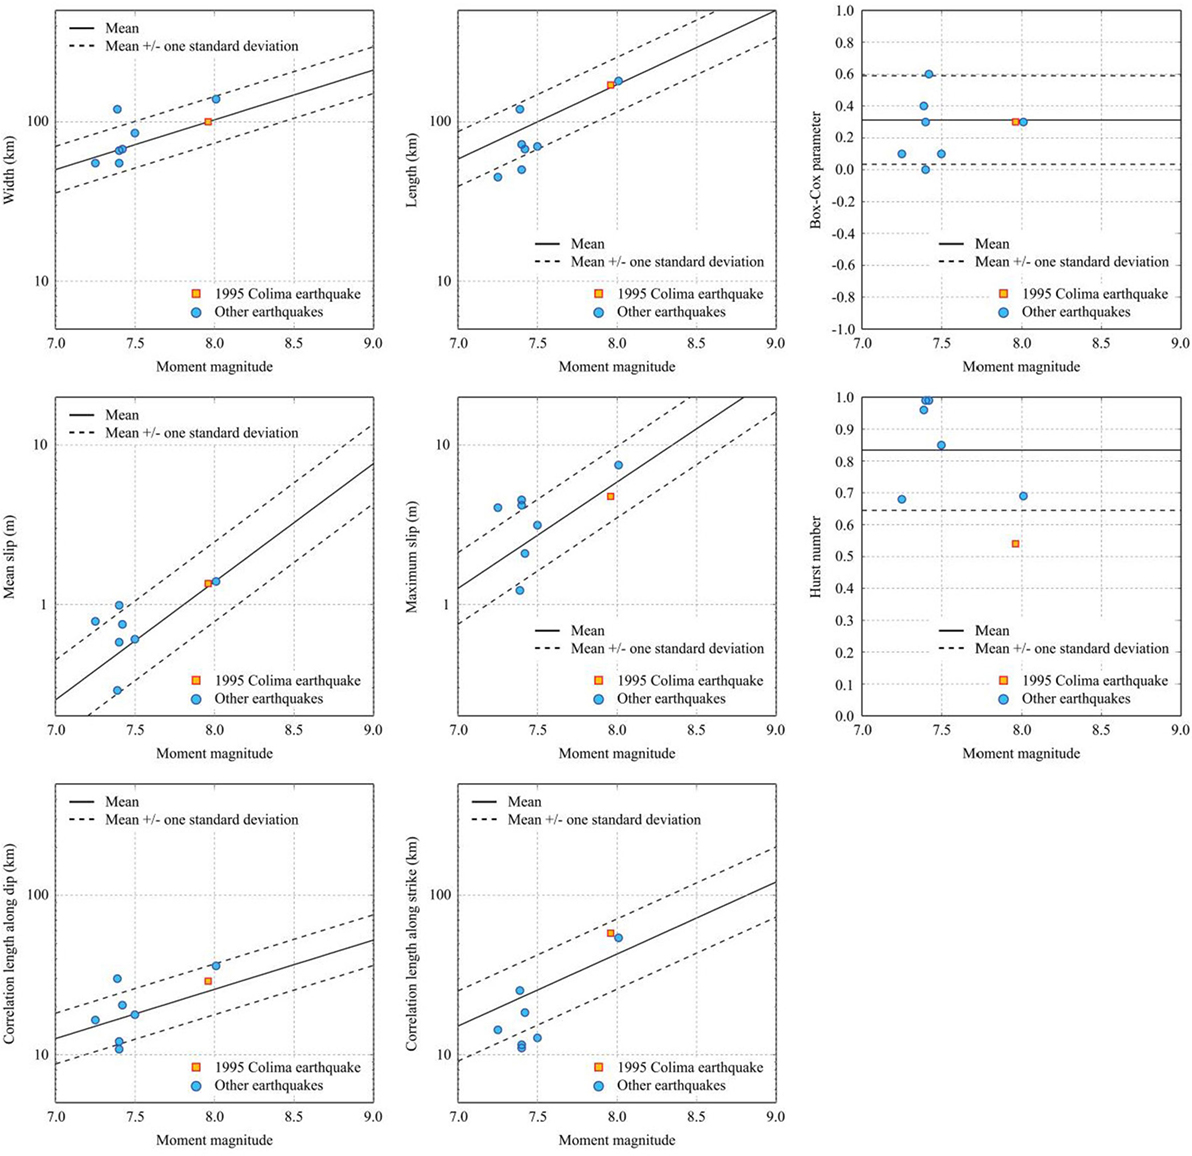
Figure 3. Comparison of the estimated source parameters for the eight finite-fault models of the Mexican subduction earthquakes with the corresponding scaling relationships.
Outline of Numerical Model
Numerical Model for Tsunami Simulation
A series of numerical simulations for tsunami propagation from the source to coastline is performed by non-linear shallow water equations by Goto et al. (1997). The governing equations are evaluated using a leap-frog staggered-grid finite difference scheme. The nesting grid systems that are implemented considering the size of continental shelf for the Guerrero region and nearshore bathymetry have three levels as shown in Figure 2B.
The grid discretization at the coarsest level is 810 m, while the finest level is 90 m; a factor of 3 is considered to connect individual grid systems with different resolutions. The coarsest 810 m region covers the entire Guerrero region, and the deformation due to fault rupture is computed at this resolution using Okada (1985) and Tanioka and Satake (1996) equations for the region shown in Figure 2A. There are two 270 m regions shown in Figure 2B; within the 270 m−1 and 270 m−2 regions, five 90 m regions are defined, respectively. The nested domains of 270 and 90 m resolutions are shown in Figure 2B. It is noted that at the same resolution, regions overlap with the nearby (same-resolution) regions. This is to ensure that the solutions of tsunami waves, especially edge wave, in simulation are propagated across different regions properly. The duration of each simulation is set to 2 h and the time step for the simulation is 0.25 s to satisfy the Courant–Friedrichs–Lewys condition, which is a necessary condition of time and space discretization for convergence when partial differential equations are numerically solved by the finite difference method. No tidal variation is taken into account.
Bathymetry Data
To carry out tsunami modeling, bathymetry (i.e., measured water depth) data and digital elevation model for Mexico are collected. For bathymetry data, the General Bathymetric Chart of Oceans (GEBCO) Dataset (2014) whose grid spacing is about 900 m is used for deep to shallow water regions. The GEBCO2014 data for the Pacific Mexico and target area are shown in Figure 4. In Figure 4, the SRTM Water Body Data (SWBD, 2008) shoreline data SWBD of Shuttle Radar Topography Mission (SRTM) (2008) and plate boundary data by Bird (2003) are also displayed. The plate boundary between the Cocos Plate and the North American Plate coincides with the Trench based on the GEBCO2014 data.
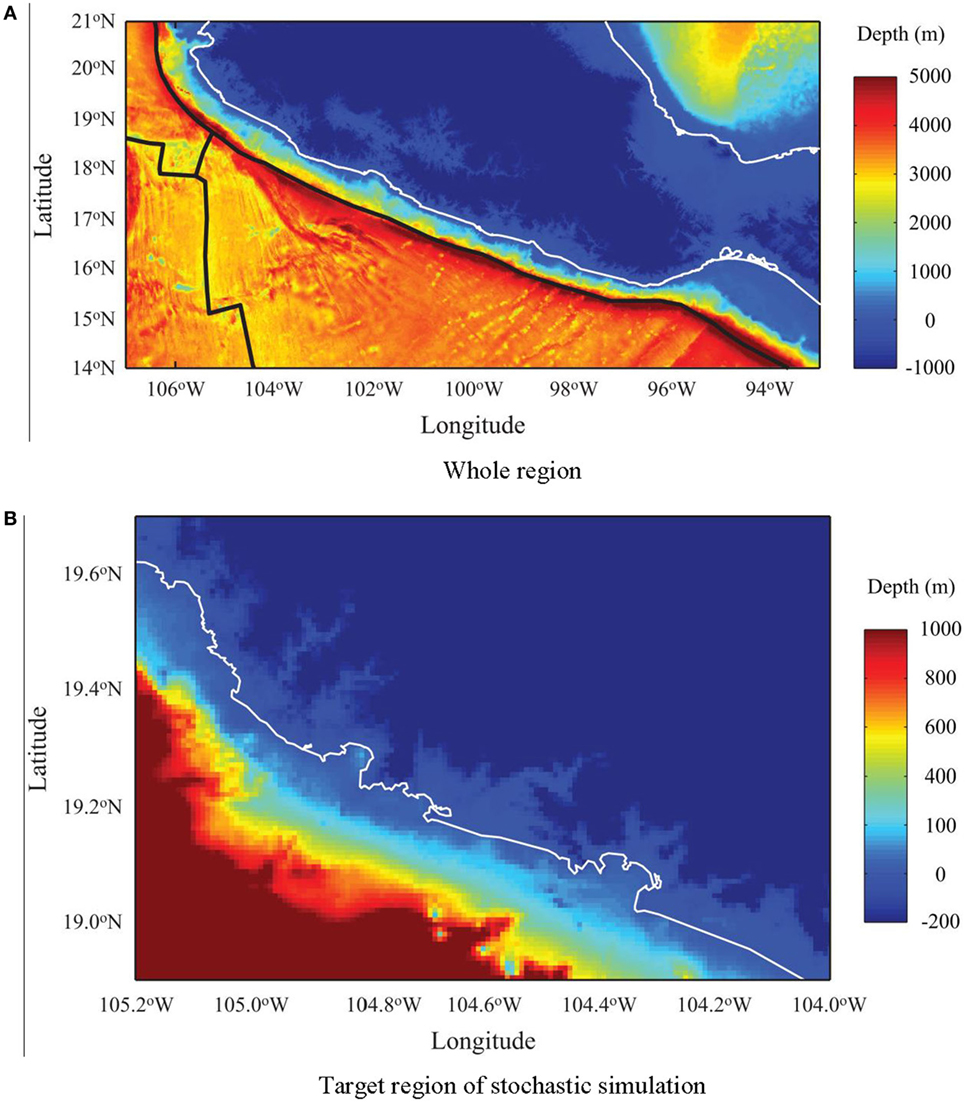
Figure 4. Bathymetry data for the Guerrero region (GEBCO2014, unit: meters). (A) Whole region. (B) Target region of stochastic simulation.
An accurate inundation calculation is excluded in this study, although inland inundation is simulated during the computation. Therefore, the main results presented in this study focus on the tsunami heights along the coast. Note that the tsunami wave height that is discussed in this study is the height of water flow above mean sea level. It is important to emphasize that GEBCO2014 has bias in very shallow waters and the data also need to match with water depths along the shoreline. Thus, GDEM2 data (2011) are used for onshore topography. The integration of bathymetry data and elevation data are not trivial because the spatial resolutions of these data are very different. For the cases of GEBCO2014 and GDEM2, the resolutions differ by a factor of 30 (i.e., 900 versus 30 m). The effects of the interpolation are expected to be significant at shallow depths near the shoreline. In developing the “depth” data for tsunami simulation (i.e., combined elevation data for a given region), first, three datasets, namely GEBCO2014, GDEM2, and SWBD, are combined without interpolation. The points in the “combined” data are spaced neither regularly nor uniformly. Within the onshore areas, the corresponding GEBCO2014 data between 0 and 200 m in elevation are replaced by the counterparts of GDEM2 data. In addition, the SWBD shoreline data are overlaid as zero elevation data points. Once this composite dataset is developed, linear interpolation is carried out. In future studies, new bathymetry data (probably compiled from local sources) should be incorporated to improve the reliability and accuracy of the tsunami simulation, especially in the very shallow water environment.
Stochastic Tsunami Simulation
Stochastic tsunami simulation can be conducted by generating multiple stochastic source models for a given earthquake scenario and by performing tsunami forward modeling repeatedly. A computational flowchart of stochastic tsunami simulation is shown in Figure 5. The detail of stochastic tsunami modeling is available in Goda et al. (2014, 2016) but it will be explained briefly in the following.
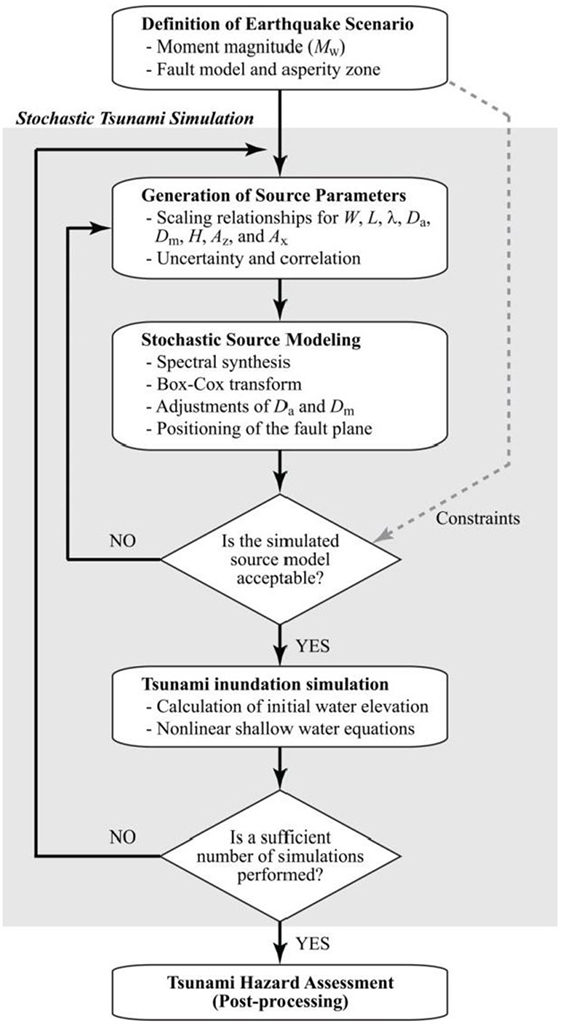
Figure 5. Flowchart of stochastic tsunami simulation.
The first step of the method is to define a suitable tsunami source zone model. For the Guerrero region, the model shown in Figure 2A is adopted. The scenario magnitude should be selected according to the objective of the analysis. Within the fault plane, the so-called asperity zone is setup, together with the required slip concentration range. Essentially, the asperity zone works as crude constraints of the generated source model regarding the slip concentration within the fault plane. It requires that a certain amount of slip must be concentrated within the target region. One example is that more than 50% of the total slip should be concentrated in the shallow part of the fault plane (e.g., shallower than 20 km). The asperity zone parameters should reflect the seismological knowledge of earthquake rupture in the target region.
Second, the macro earthquake source parameters, such as W, L, Da, Dm, λ, Az, Ax, and H, are generated using the scaling relationships. Uncertainty as well as correlation associated with the regression models should be taken into account in sampling the values of the source parameters (Eqs 1–6 and Table 2). In the simulation, random variables for these residuals can be sampled from the multivariate normal distribution. In addition, at this stage, consistency among the simulated values of W, L, and Da can be tested by comparing the target seismic moment (as specified by the given scenario magnitude) and the simulated seismic moment (Mo = μWLDa, where μ is the rock rigidity). An inadequate combination of W, L, and Da values is resampled until the scenario magnitude is satisfied.
Third, using the generated spatial slip distribution parameters, a random slip field is generated using a Fourier integral method (Pardo-Iguzquiza and Chica-Olmo, 1993). To achieve slip distribution with realistic positive skewness, the synthesized slip distribution is converted via Box–Cox transformation (Goda et al., 2014). The transformed slip distribution is then adjusted to achieve the target mean slip Da and to avoid very large slip values exceeding the target maximum slip Dm. Subsequently, the position of the synthesized fault plane is determined randomly within the source region. To ensure that the synthesized slip distribution is realistic with respect to the seismotectonic characteristics of the region, two criteria/constraints are implemented to determine the final acceptance of the generated source model. The first constraint requires that the asperity area ratio of the candidate slip distribution falls between 0.2 and 0.3. The second constraint requires that the simulated earthquake slip is more concentrated in the designated asperity region. Multiple slip distributions are simulated repeatedly until an acceptable source model, which has all desirable characteristics, is obtained.
Fourth, for a given acceptable source model, the initial water surface elevation (i.e., initial boundary conditions for tsunami simulation) is evaluated based on formula by Okada (1985) and Tanioka and Satake (1996). Tsunami wave propagation is evaluated by solving non-linear shallow water equations (Goto et al., 1997). The run-up of tsunami is considered by the model but it is incomplete due to coarse grid size in this study. Finally, the above simulation procedure is repeated until a sufficient number of acceptable source models are generated and their tsunami inundation heights/depths at locations of interest are evaluated. The results from the Monte Carlo tsunami simulation are useful for evaluating variability of tsunami simulation results at different locations and for developing stochastic tsunami hazard maps along the coast.
Results and Discussion: Case Study of the 1995 Colima Earthquake
Synthetic Slips
A brief discussion of generated synthetic/stochastic tsunami sources for the Guerrero region is given before analyzing synthetic tsunami characteristics. To demonstrate the stochastic tsunami simulation model for the Guerrero region, the 1995 Colima Earthquake is considered, which is one of the most major tsunami events in the northern part of the Guerrero region. More specifically, the selection of the 1995 Colima Earthquake is relevant because the size of the earthquake (Mw 8.0) is sufficiently large to cause tsunami waves and post-event tsunami survey data (e.g., Borerro et al., 1997; Trejo-Gómez et al., 2015) as well as an inverted slip model (Mendoza and Hartzell, 1999) are available for this event. Our aim in setting up the case study is to compare the results of stochastic tsunami simulations with the past survey data of the 1995 Colima Earthquake.
The moment magnitude of the event was Mw 8.0 and occurred near the junction of the Cocos–Rivera–North American Plates (Model 5 in Figure 1). Borerro et al. (1997) reported that the observed run-up heights along the Colima coast line (longitudes between 104 and 105°W) were mostly 2–3 m and was ranged up to 5 m (note: at one particular point, north end of Santiago Bay, the observed run-up height reached 10.9 m; this high run-up was likely to be caused by the very local topographical effect).
To setup the stochastic tsunami simulations for the 1995 Colima Earthquake, a separate source zone model is defined within the whole source zone model for the Guerrero region. The 1995 Colima Earthquake source zone model restricts ranges of slip along the subduction zone shorter than the Guerrero region and is based on the source model by Mendoza and Hartzell (1999), i.e., Model 5 in Figure 1 and Table 1. A zoom-up of the Mendoza–Hartzell fault plane model (1999) is shown in Figure 6A. The maximum slip is 4.78 m, and it is located around 19°N in latitude and 106–105.5°W in longitude. To incorporate the variations of the fault plane size, the source zone model for the 1995 Colima Earthquake has the width equal to 150 km and the length equal to 310 km, which is larger than the original fault plane by Mendoza and Hartzell (1999) (note: the top edge of the fault plane model is identical). It is also noteworthy that the Mendoza–Hartzell model agrees with the scaling relationships developed by Goda et al. (2016) shown as the square marks in Figure 3.
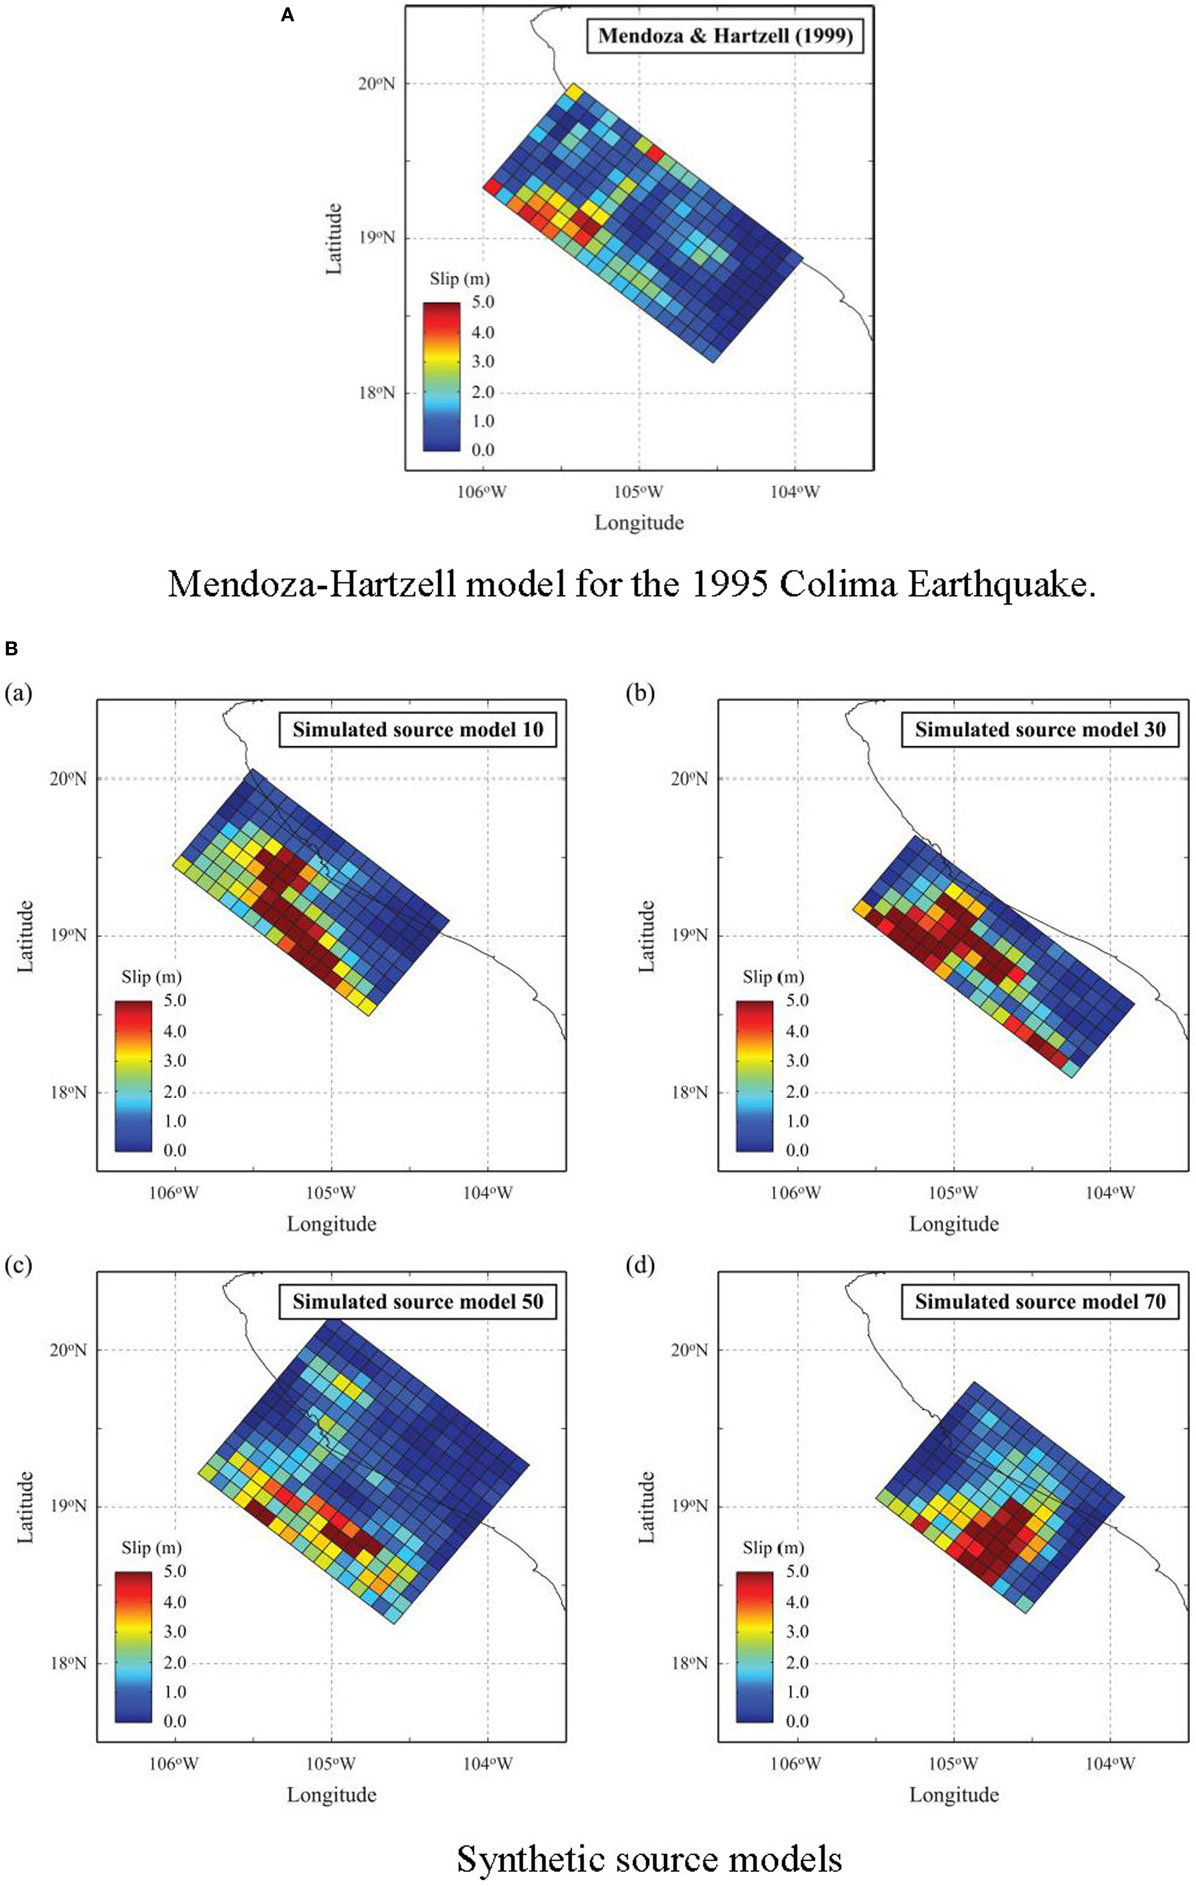
Figure 6. Stochastic source models for the 1995 Colima Earthquake scenario by considering prediction errors of the scaling relationships. (A) Mendoza–Hartzell model for the 1995 Colima Earthquake. (B) Synthetic source models.
Synthetic Tsunami Simulation
To carry out the stochastic tsunami simulation, two sets of 100 stochastic source models are generated for the Mw 8.0 scenario. The first set takes into account uncertainty of the scaling relationships of the source models, whereas the second set does not. The practical consequences of not incorporating the uncertainty of the scaling relationships are that the generated source models have identical dimensions and slip heterogeneity parameters, while the slip distribution and location of the source model are varied. On the other hand, when the uncertainty of the scaling relationships is considered, both dimensions and slip heterogeneity are varied. Note that such uncertainty sometimes is ignored, and scaling relationships are used as deterministic equations relating two source parameters. In addition to the two sets of 100 stochastic source models, a hindcast simulation for the 1995 Colima Earthquake Tsunami is performed by using the original Mendoza–Hartzell fault plane model (Figure 6A) as a benchmark. Figure 6B shows examples for four realizations of the stochastic source models for the cases where the uncertainty of the scaling relationships is accounted for. The synthetic slips in Figure 6B demonstrate that realistic locations of maximum slip along the Trench and coherent structure of sub-slips around the maximum slip given by spectral decomposition. Note that each realization has the similar tail of slip spectra, which are controlled by the spectral decomposition and Box–Cox parameter. The generation of arbitrary number of synthetic slips is one of advantages of using the random phase approach in PTHA, which is different from the logic-tree approach. Therefore, it is possible to discuss probabilistic tsunami heights along the coast. Although the examples of stochastic source models without the uncertainty of the scaling relationships are not shown due to limitation of space, the synthetic source models considering the uncertainty of the scaling relationships shown in Figure 6B change fault size, i.e., L and W, and the other slip characteristics due to the uncertainty terms ε in Eqs 1–6. Consequently, the rupture aspect ratios (i.e., L/W) become variable even when the same magnitude is considered. To discuss the tsunami heights along the coast probabilistically and to investigate the uncertainty effects on earthquake source modeling, the tsunami simulation results are presented in two sections, i.e., sensitivity of tsunami simulated heights and effects of accounting for parameter uncertainty in earthquake source generation.
Sensitivity of Tsunami Simulated Heights
Figure 7 shows the maximum wave height of the 1995 Colima Earthquake Tsunami simulated by the Mendoza–Hartzell model. The large tsunami heights are located in the northern part of the domain due to the large slip concentration as shown in Figure 7. There is less significant tsunami amplification inside bays; however, the amplification of tsunami heights along the northern coast facing the Pacific due to shallow water shoaling effects is remarkable. The tsunami height in the southern part of the domain is less than 1 m, noting that this should be regarded one of realizations from ensemble events. The mean and SD of maximum tsunami heights based on the 100 stochastic models considering the uncertainty of scaling relationships are shown in Figure 8. Besides the southern end of the computational domain, the mean maximum tsunami height by the stochastic models are more uniformly distributed along the coast compared with other sites, although the wave deformation from the offshore to onshore are different especially in the middle of the domain. The SD of maximum tsunami heights along the coast is large outside of bays facing the Pacific but is not significant inside.
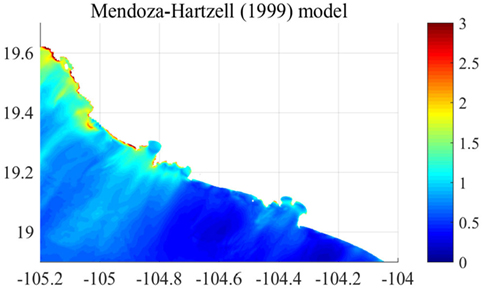
Figure 7. Maximum surface elevation, in meters, of the 1995 Colima Earthquake Tsunami based on the Mendoza–Hartzell model.
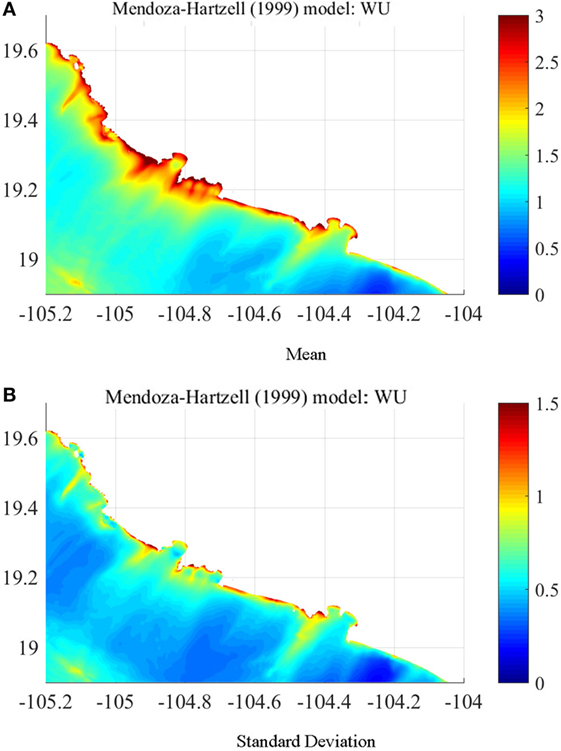
Figure 8. Mean and SD of maximum surface elevation, in meters, by the stochastic models considering prediction errors of the scaling relationships. (A) Mean. (B) SD.
The comparison of the mean maximum tsunami heights from the stochastic tsunami simulations and the maximum tsunami height of the hindcast tsunami simulation is conducted by calculating the ratio between them. The results are shown in Figure 9. The ratio of the maximum tsunami heights, shown in Figure 9, is mostly larger than 1. Thus, the predicted tsunami hazards based on the inverted source model developed using actual observed geophysical data for the 1995 Colima Earthquake Tsunami are less than the averaged realization of the stochastic tsunami simulation. There are three major factors to amplify tsunami heights at particular coastal locations. The first is source characteristics (e.g., location of maximum slip), the second is wave shoaling and focusing due to large-scale bathymetry features, and the third is convergence of energy due to the shape of a bay. The second effects, i.e., wave shoaling, are proportional to h−1/4 where h is water depth, if wave non-linearity is negligible (i.e., Green’s law). Figure 10 shows the spatial distribution of h−1/4 of GEBCO2014 data around the target area shown in Figure 7. The value of h−1/4 constantly increases from offshore to onshore lower than 19.3°N in latitude. Therefore, the amplification of tsunami heights shown in Figure 9 is not influenced by offshore bathymetry. It can be concluded that the source characteristics are the main cause of the observed spatial inhomogeneity of mean maximum tsunami height rather than the tsunami propagation processes.
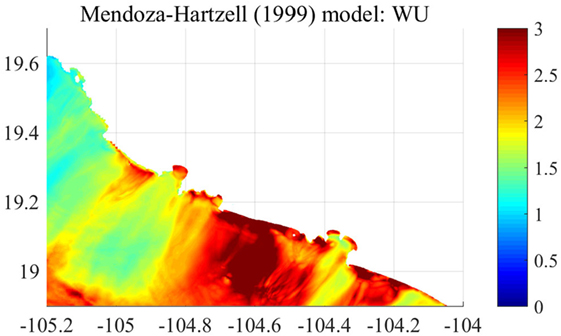
Figure 9. Ratio of average maximum surface elevation by the stochastic model considering prediction errors of the scaling relationships to maximum surface elevation calculated based on the Mendoza–Hartzell model.
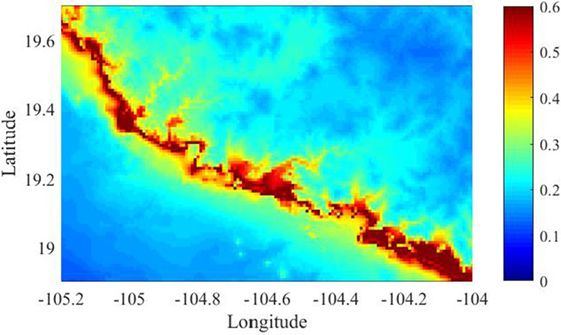
Figure 10. Spatial distribution of h−1/4 around target area (the areas correspond Figure 4B).
The maximum tsunami heights along the coastal line (elevation is between –1.0 and 1.0 m) are then extracted for every 450 m (i.e., five grids) in the longitudinal direction to examine the spatial variation of the tsunami heights along the coast; the results can be compared with the tsunami survey results. The locations of the extracted points are shown in Figure 11. In total, there are 284 sites along the coast. In addition, tsunami waveforms (i.e., temporal profile) at three recording locations along the Colima coast are also focused on to investigate the temporal characteristics of the tsunami profiles for different source models. In relation to the surveyed locations by Borerro et al. (1997), the recording location 2 is in Tenacatita Bay, whereas the recording location 3 is in Manzanillo Bay. The depths at the recording locations 1–3 are 1.3, 10.1, and 36.2 m, respectively.
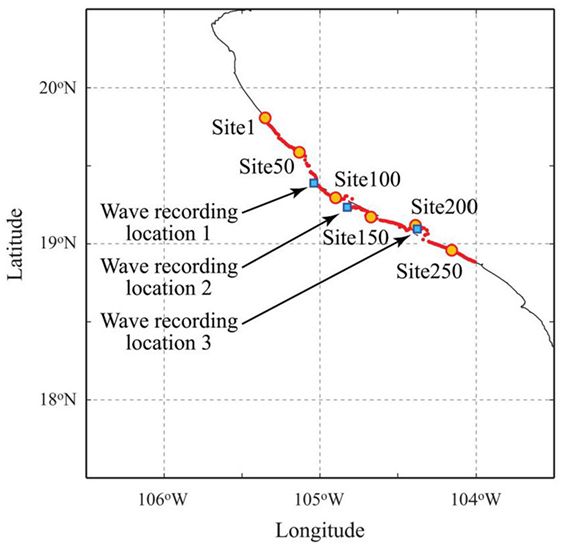
Figure 11. Site locations (1–284) and wave recording locations (1–3) for the analysis of time series of tsunami surface elevation.
First, the maximum tsunami heights along the coast line from north to south are shown in Figure 12. The mean and the upper and lower 16th percentiles of the simulated tsunami heights with and without the uncertainty of the scaling relationships (red solid and dashed line) are shown in the figure. These results are also compared with the hindcast simulation of the 1995 Colima Earthquake Tsunami (blue solid line) and observed run-up heights (dots) by Trejo-Gómez et al. (2015). The past tsunami height profile of the 1995 Colima Earthquake shows that the wave heights for sites 1–100 are higher than others, which are consistent with the source model by Mendoza and Hartzell (1999), having large asperities in the north-western segment of its fault plane. The maximum tsunami profiles for the stochastic source models vary significantly along the coast; for instance, the median curve varies between 2.0 and 5.5 m, while the 84th percentile curve varies between 3.0 and 7.5 m. The spatial distributions of mean maximum tsunami heights from sites 0 to 70 are generally similar to the historical run as well as the measured tsunami run-up heights by Trejo-Gómez et al. (2015). On the other hand, the maximum tsunami height profile for the stochastic source models from the sites 100 and more (toward south-east) differs from the historical run and measured tsunami run-up heights, noting that the locations shown in Figure 2 of Borerro et al. (1997) approximately correspond to sites 100–200. It emphasizes that the Mendoza–Hartzell source model is not based on the tsunami data; therefore, disagreement between the observed and the simulated tsunami results is not unexpected.
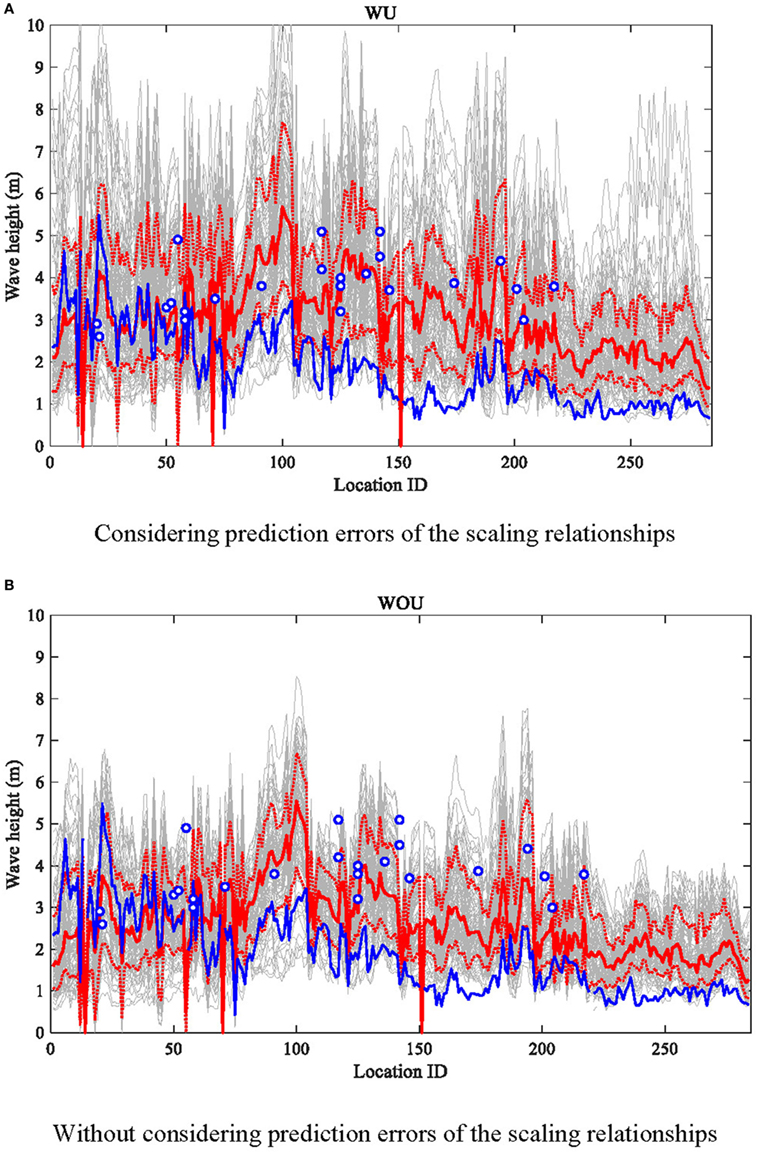
Figure 12. Maximum tsunami wave height profile along the coastal line for the stochastic models with and without considering prediction errors of the scaling relationships [red solid line: mean, red dashed line: upper and lower 16%, gray line: individual stochastic run, blue solid line: historical run, circle: observed run-up height by Trejo-Gómez et al. (2015)]. (A) Considering prediction errors of the scaling relationships. (B) Without considering prediction errors of the scaling relationships.
Effects of Accounting for Parameter Uncertainty in Earthquake Source Generation
Regarding the effects of the uncertainty of the scaling relationships (i.e., Figure 12A versus Figure 12B), it can be seen that the variability of the simulation results is significantly increased, especially for the maximum tsunami height profiles (although general trends of the results are similar for both cases). The mean and upper 16th percentile values of the simulated results with the uncertainty of the scaling relationships are larger than the results without the uncertainty of the scaling relationships. Especially, when the uncertainty of the scaling relationships is taken into account, the upper 16th percentile and upper bound of the maximum tsunami height, shown as background gray lines in Figure 12, become quite large and are related to the increase of the maximum slip due to the uncertainty by Eq. (4). Thereby, the estimation of scaling relationship for the maximum slip and its uncertainty by analyzing inversion slip models are important for tsunami hazard assessment.
The impact of stochastic modeling on time series of tsunami profile at the recording locations 1–3 (from north to south) are illustrated in Figure 13. The tsunami waveforms at the recording locations 1–3 show that the wave amplitudes are generally higher at the recording location 1 than those at the recording stations 2 and 3. The simulated tsunami waveforms for the recording locations 1–3 also exhibit large variations in the temporal tsunami profiles, indicating that tsunamis having amplitudes up to 5 m may be expected at offshore locations for the Mw 8.0 earthquake scenario. The largest variability due to different stochastic source models is found at the first peak of tsunami waves; such large variability is also observed for a few subsequent waves after the first one. However, the signs of the first wave do not change over the stochastic simulations, and the first waves always begin with positive change. Moreover, edge waves following continental shelf are mainly affected by large-scale nearshore bathymetry, which is independent of slip source modeling. Consequently, there is less influence due to the stochastic source models on the later parts of the simulated waves.
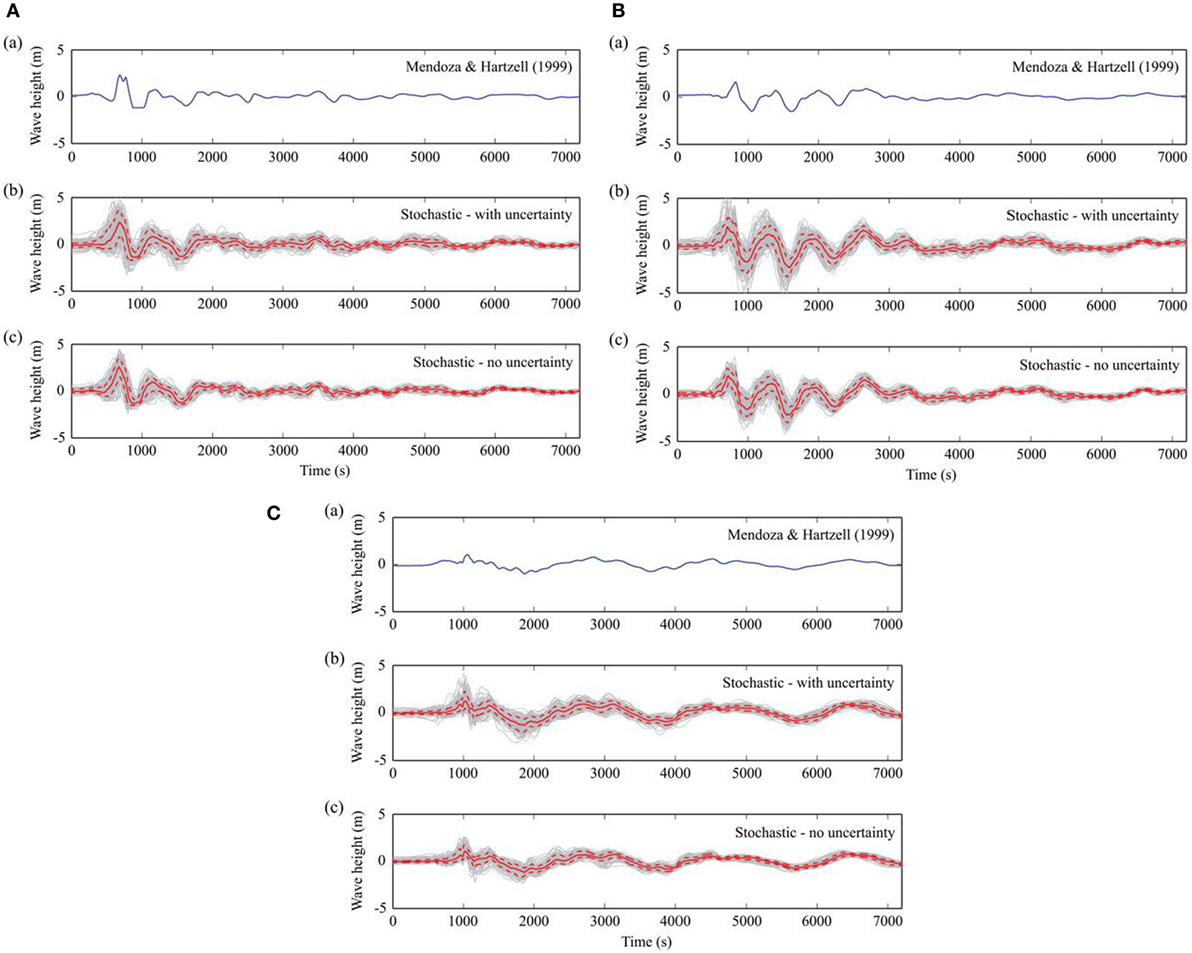
Figure 13. Tsunami waveforms at the recording locations: top to bottom: location 1–3. (A) Mendoza–Hartzell model, (B) stochastic models by considering prediction errors of the scaling relationships, and (C) stochastic models without considering prediction errors of the scaling relationships (solid line: mean, dashed line: upper and lower 16%, gray line: individual run).
Conclusion
PTHA for the Guerrero region, Mexico has been carried using the novel stochastic tsunami simulation method. The method takes into account uncertainty of the key source parameters and randomness of slip heterogeneity over the fault plane and, hence, is capable of quantifying the tsunami hazard probabilistically. Such a methodology has not been implemented in the previous PTHA studies for Mexico. The scaling relationships used in the stochastic earthquake source generation have been developed based on extensive statistical analyses of the source models parameters estimated from the SRCMOD database. The bathymetry and elevation data for the region were compiled based on the GEBCO2014 and GDEM2 to develop the nesting grid systems that are suitable for regional tsunami simulation studies. Finally, the developed stochastic tsunami simulation method was applied to the 1995 Colima Earthquake scenario. The results indicated that the effects of the source model characteristics on the simulation results are important. It was also found that the tsunami simulation results using the stochastic source models exhibit significant variability of tsunami profiles, while the results overall agree with the tsunami run-up survey results for the 1995 Colima event.
The extension of the source zone model to the Guerrero region by varying earthquake scenario magnitudes will be the focus of our future study. Such investigations have been carried out for Japan using the similar stochastic tsunami simulation method (Goda et al., 2017). It is also important to simulate tsunami inundation and run-up and to assess tsunami damage to structures based on the stochastic tsunami simulations along the Pacific Mexican coast.
Author Contributions
NM analyzed numerical results. He wrote half part in this manuscript. AM made bathymetry data. He wrote bathymetry setup part of this manuscript. KG setup stochastic slip model. He wrote another half part in this manuscript. TY setup numerical tsunami model. AR-A analyzed historical slips and tsunamis.
Conflict of Interest Statement
The authors declare that the research was conducted in the absence of any commercial or financial relationships that could be construed as a potential conflict of interest.
The reviewer, IT, declared a shared affiliation, though no other collaboration, with one of the authors, NM, to the handling editor, who ensured that the process nevertheless met the standards of a fair and objective review.
Acknowledgments
The part of this research is supported by The Project for Hazard Assessment of Large Earthquakes and Tsunamis in the Mexican Pacific Coast for Disaster Mitigation, SATREPS funded by JICA-JST. This work was also supported by the Engineering and Physical Sciences Research Council (EP/M001067/1).
Funding
JICA/JST SATREPS 1500601 research program on earthquake and tsunami hazard assessment and implementation in Mexico.
References
Annaka, T., Satake, K., Sakakiyama, T., Yanagisawa, K., and Shuto, N. (2007). Logic-tree approach for probabilistic tsunami hazard analysis and its applications to the Japanese coasts. Pure Appl. Geophys. 164, 577–592. doi: 10.1007/s00024-006-0174-3
Bird, P. (2003). An updated digital model of plate boundaries. Geochem. Geophys. Geosyst. 4, 1027. doi:10.1029/2001GC000252
Borerro, J., Ortiz, M., Titov, V., and Synolakis, C. (1997). Field survey of Mexican tsunami produces new data, unusual photos. EOS Trans. Am. Geophys. Union 78, 85–88. doi:10.1029/97EO00054
Burbidge, D., Cummins, P. R., Mleczko, R., and Thio, H. K. (2008). A probabilistic tsunami hazard assessment for Western Australia. Pure Appl. Geophys. 165, 2059–2088. doi:10.1007/s00024-008-0421-x
Courboulex, F., Santoyo, M. A., Pacheco, J. F., and Singh, S. K. (1997). The 14 September 1995 (M=7.3) Copala, Mexico, earthquake: a source study using teleseismic, regional, and local data. Bull. Seismol. Soc. Am. 87, 999–1010.
Davies, G., Horspool, N., and Miller, V. (2015). Tsunami inundation from heterogeneous earthquake slip distributions: evaluation of synthetic source models. J. Geophys. Res. 120, 6431–6451. doi:10.1002/2015JB012272
DeMets, C., Gordon, R., Argus, D., and Stein, R. (1994). Effect of recent revisions to the geomagnetic reversal time scale and estimates of current plate motions. Geophys. Res. Lett. 21, 2191–2194. doi:10.1029/94GL02118
Farreras, S., and Sánchez, A. (1991). The tsunami threat on the Mexican West coast: a historical analysis and recommendations for hazard mitigation. Nat. Hazards 4, 301–316. doi:10.1007/BF00162795
Fukutani, Y., Suppasri, A., and Imamura, F. (2015). Stochastic analysis and uncertainty assessment of tsunami wave height using a random source parameter model that targets a Tohoku-type earthquake fault. Stoch. Environ. Res. Risk Assess. 29, 1763–1779. doi:10.1007/s00477-014-0966-4
GDEM2 data. (2011). GDEM2: ASTER Global Digital Elevation Model Version 2. Summary of Validation Results. Available at: https://asterweb.jpl.nasa.gov/gdem.asp
Geist, E., and Oglesby, D. D. (2014). Earthquake mechanism and seafloor deformation for tsunami generation. Encycl. Earthquake Eng. 1, 1–17. doi:10.1007/978-3-642-36197-5_296-1
Geist, E. L. (2002). Complex earthquake rupture and local tsunamis. J. Geophys. Res. 107, ESE2-1–ESE2-15. doi:10.1029/2000JB000139
Geist, E. L., and Lynett, P. J. (2014). Source processes for the probabilistic assessment of tsunami hazards. Oceanography 27, 86–93. doi:10.5670/oceanog.2014.43
Geist, E. L., and Parsons, T. (2006). Probabilistic analysis of tsunami hazards. Nat. Hazards 37, 277–314. doi:10.1007/s11069-005-4646-z
General Bathymetric Chart of Oceans (GEBCO) Dataset. (2014). Gridded Bathymetry Data (General Bathymetric Chart of the Oceans) GEBCO2014 Dataset. Available at: https://www.gebco.net/
Goda, K., Li, S., Mori, N., and Yasuda, T. (2015). Probabilistic tsunami damage assessment considering stochastic source models: application to the 2011 Tohoku earthquake. Coast. Eng. J. 57, 1–38. doi:10.1142/S0578563415500151
Goda, K., Mai, P. M., Yasuda, T., and Mori, N. (2014). Sensitivity of tsunami wave profiles and inundation simulations to earthquake slip and fault geometry for the 2011 Tohoku earthquake. Earth Planets Space 66, 105. doi:10.1186/1880-5981-66-105
Goda, K., and Song, J. (2016). Uncertainty modeling and visualization for tsunami hazard and risk mapping: a case study for the 2011 Tohoku earthquake. Stoch. Environ. Res. Risk Assess. 30, 2271–2285. doi:10.1007/s00477-015-1146-x
Goda, K., Yasuda, T., Mai, P. M., Maruyama, T., and Mori, N. (2017). “Tsunami simulations of mega-thrust earthquakes in the Nankai-Tonankai Trough (Japan) based on stochastic rupture scenarios,” in Tsunamis: Geology, Hazards and Risks, 456 eds E. M. Scourse, N. A. Chapman, D. R. Tappin, and S. R. Wallis (London: Geological Society), 456.
Goda, K., Yasuda, T., Mori, N., and Maruyama, T. (2016). New scaling relationships of earthquake source parameters for stochastic tsunami simulation. Coastal Eng. J. 58. doi:10.1142/S0578563416500108
González, F. I., Geist, E. L., Jaffe, B., Kânoğlu, U., Mofjeld, H., Synolakis, C. E., et al. (2009). Probabilistic tsunami hazard assessment at seaside, Oregon, for near- and far-field seismic sources. J. Geophys. Res. 114, C11023-1–C11023-19. doi:10.1029/2008JC005132
Goto, C., Ogawa, Y., Shuto, N., and Imamura, F. (1997). “Numerical method of tsunami simulation with the leap-frog scheme,” in IOC Manual, No. 35 (Paris, France: UNESCO).
Hayes, G. (2012). Preliminary Result of the March 20, 2012 Mw 7.4 Oaxaca, Mexico Earthquake. Available at: https://earthquake.usgs.gov/archive/product/finite-fault/usp000jghj/us/1486510843869/p000jghj.html
Horspool, N., Pranantyo, I., Griffin, J., Latief, H., Natawidjaja, D. H., Kongko, W., et al. (2014). A probabilistic tsunami hazard assessment for Indonesia. Nat. Hazards Earth Syst. Sci. 14, 3105–3122. doi:10.5194/nhess-14-3105-2014
Jaimes, M. A., Reinoso, E., Ordaz, M., Silva, R., Mendoza, E., Huerta, B., et al. (2016). An earthquake-event-based method for mapping tsunami hazards. Proc. Inst. Civ. Eng. 169, 148–162. doi:10.1680/jmaen.2015.37
Kostoglodov, V., Singh, S. K., Santiago, J. A., Franco, S. I., Larson, K. M., Lowry, A. R., et al. (2003). A large silent earthquake in the Guerrero seismic gap, Mexico. Geophys. Res. Lett. 30, SD9-1–SD9-4. doi:10.1029/2003GL017219
Lorito, S., Selva, J., Basili, R., Romano, F., Tiberti, M. M., and Piatanesi, A. (2015). Probabilistic hazard for seismically induced tsunamis: accuracy and feasibility of inundation maps. Geophys. J. Int. 200, 574–588. doi:10.1093/gji/ggu408
Mai, P. M., and Beroza, G. C. (2002). A spatial random field model to characterize complexity in earthquake slip. J. Geophys. Res. 107, ESE10-1–ESE10-21. doi:10.1029/2001JB000588
Mai, P. M., and Thingbaijam, K. K. S. (2014). SRCMOD: an online database of finite source rupture models. Seismol. Res. Lett. 85, 1348–1357. doi:10.1785/0220140077
McCloskey, J., Antonioli, A., Piatanesi, A., Sieh, K., Steacy, S., Nalbant, S., et al. (2008). Tsunami threat in the Indian Ocean from a future megathrust earthquake west of Sumatra. Earth Planet. Sci. Lett. 265, 61–81. doi:10.1016/j.epsl.2007.09.034
Mendoza, C. (1993). Coseismic slip of two large Mexican earthquakes from teleseismic body waveforms: implications for asperity interaction in the Michoacan plate boundary segment. J. Geophys. Res. 98, 8197–8210. doi:10.1029/93JB00021
Mendoza, C. (1995). Finite-fault analysis of the 1979 March 14 Petatlan, Mexico, earthquake using teleseismic P-wave-forms. Geophys. J. Int. 121, 675–683. doi:10.1111/j.1365-246X.1995.tb06430.x
Mendoza, C., and Hartzell, S. H. (1989). Slip distribution of the 19 September 1985 Michoacan, Mexico, earthquake – near-source and teleseismic constraints. Bul. Seismol. Soc. Am. 79, 655–669.
Mendoza, C., and Hartzell, S. H. (1999). Fault-slip distribution of the 1995 Colima-Jalisco, Mexico, earthquake. Bull. Seismol. Soc. Am. 89, 1338–1344.
Mori, N., Goda, K., and Cox, D. T. (2017). “Recent process in probabilistic tsunami hazard analysis (PTHA) for mega thrust subduction earthquakes,” in Reconstruction and Restoration after the 2011 Japan Earthquake and Tsunami: Insights and Assessment after 5 Years (Berlin: Springer).
Mori, N., Takahashi, T., Yasuda, T., and Yanagisawa, H. (2011). Survey of 2011 Tohoku earthquake tsunami inundation and run-up. Geophys. Res. Lett. 38, L00G14-1–L00G16-6. doi:10.1029/2011GL049210
Nunez-Cornu, F. J., Oritz, M., and Sanchez, J. J. (2008). The great 1787 Mexican tsunami. Natural Hazards 47, 569–576. doi:10.1007/s11069-008-9239-1
Okada, Y. (1985). Surface deformation due to shear and tensile faults in a half-space. Bull. Seismol. Soc. Am. 75, 1135–1154.
Pacheco, J. F., and Singh, S. K. (2010). Seismicity and state of stress in Guerrero segment of the Mexican subduction zone. J. Geophys. Res. 115, B01303. doi:10.1029/2009JB006453
Pardo-Iguzquiza, E., and Chica-Olmo, M. (1993). The Fourier integral method: an efficient spectral method for simulation of random fields. Math. Geol. 25, 177–217. doi:10.1007/BF00893272
Park, H., and Cox, D. T. (2016). Probabilistic assessment of near-field tsunami hazards: inundation depth, velocity, momentum flux, arrival time, and duration applied to Seaside, Oregon. Coast. Eng. 117, 79–96. doi:10.1016/j.coastaleng.2016.07.011
Perez-Campos, X., Kim, Y. H., Husker, A., Davis, P. M., Clayton, R. W., Iglesias, A., et al. (2008). Horizontal subduction and truncation of the Cocos Plate beneath central Mexico. Geophys. Res. Lett. 35, L18303. doi:10.1029/2008GL035127
Perez-Campos, X., Melgar, D., Singh, S. K., Cruz-Atienza, V., Iglesias, A., and Hjorleifsdottir, V. (2013). Rapid estimation of fault parameters for tsunami warning along the Mexican subduction zone: a scenario earthquake in the Guerrero gap. Seismol. Res. Lett. 84, 474–484. doi:10.1785/0220120156
Ramírez-Herrera, M. T., Corona, N., Lagos, M., Černý, J., Goguitchaichvili, A., Goff, J., et al. (2014). Unearthing earthquakes and their tsunamis using multiple proxies: the 22 June 1932 event and a probable fourteenth-century predecessor on the Pacific coast of Mexico. Int. Geol. Rev. 56, 1584–1601. doi:10.1080/00206814.2014.951977
Ramírez-Herrera, M. T., Lagos, M., Hutchinson, I., Kostoglodov, V., Machain, M. L., Caballero, M., et al. (2012). Extreme wave deposits on the Pacific coast of Mexico: tsunamis or storms? A multi-proxy approach. Geomorphology 139-140, 360–371. doi:10.1016/j.geomorph.2011.11.002
Rikitake, T., and Aida, I. (1988). Tsunami hazard probability in Japan. Bull. Seismol. Soc. Am. 78, 1268–1278.
Sánchez, A. J., and Farreras, S. F. (1987). Tsunami flooding extension for coastal zones of Mexico. Mar. Geod. 11, 127–135. doi:10.1080/15210608709379555
Suárez, G., and Albini, P. (2009). Evidence for great tsunamigenic earthquakes (M 8.6) along the Mexican subduction zone. Bull. Seismol. Soc. Am. 99, 892–896. doi:10.1785/0120080201
SWBD of Shuttle Radar Topography Mission (SRTM). (2008). SRTM Water Body Data (SWBD) Shoreline Data. Available at: https://lta.cr.usgs.gov/srtm_water_body_dataset
Tanioka, Y., and Satake, K. (1996). Tsunami generation by horizontal displacement of ocean bottom. Geophys. Res. Lett. 23, 861–864. doi:10.1029/96GL00736
Thio, H. K., Somerville, P., and Ichinose, G. (2007). Probabilistic analysis of strong ground motion and tsunami hazards in Southeast Asia. J. Earthquake Tsunami 1, 119–137. doi:10.1142/S1793431107000080
Trejo-Gómez, E., Ortiz, M., and Núñez-Cornú, F. J. (2015). Source model of the October 9, 1995 Jalisco-Colima Tsunami as constrained by field survey reports, and on the numerical simulation of the tsunami. Geofísica Int. 54, 149–159. doi:10.1016/j.gi.2015.04.010
Wei, S. (2012). March/20/2012 (Mw 7.4), Oaxaca, Mexico Source Models of Large Earthquakes. Available at: http://www.tectonics.caltech.edu/slip_history/2012_Mexico/index.html
Yagi, Y., Mikurno, T., Pacheco, J., and Reyes, G. (2004). Source rupture process of the Tecoman, Colima, Mexico earthquake of 22 January 2003, determined by joint inversion of teleseismic body-wave and near-source data. Bull. Seismol. Soc. Am. 94, 1795–1807. doi:10.1785/012003095
Keywords: tsunami, probabilistic tsunami hazard assessment, synthetic slip, slip spectra, 1995 Colima earthquake
Citation: Mori N, Muhammad A, Goda K, Yasuda T and Ruiz-Angulo A (2017) Probabilistic Tsunami Hazard Analysis of the Pacific Coast of Mexico: Case Study Based on the 1995 Colima Earthquake Tsunami. Front. Built Environ. 3:34. doi: 10.3389/fbuil.2017.00034
Received: 12 March 2017; Accepted: 23 May 2017;
Published: 13 June 2017
Edited by:
Luigi Di Sarno, University of Sannio, ItalyReviewed by:
Izuru Takewaki, Kyoto University, JapanDavid De Leon, Universidad Autónoma del Estado de México, Mexico
Copyright: © 2017 Mori, Muhammad, Goda, Yasuda and Ruiz-Angulo. This is an open-access article distributed under the terms of the Creative Commons Attribution License (CC BY). The use, distribution or reproduction in other forums is permitted, provided the original author(s) or licensor are credited and that the original publication in this journal is cited, in accordance with accepted academic practice. No use, distribution or reproduction is permitted which does not comply with these terms.
*Correspondence: Nobuhito Mori, bW9yaUBvY2VhbndhdmUuanA=