 Shuichi Kamagata
 Izuru Takewaki
- 1Nuclear Power Department, Kajima Corporation, Tokyo, Japan
- 2Department of Architecture and Architectural Engineering, Graduate School of Engineering, Kyoto University, Kyoto, Japan
Three amplification mechanisms of large accelerations over 20 m/s2 are related to various non-liner behaviors and explained by using the non-stationary Fourier spectra. The frequencies of dominant components are compared with the natural frequencies with the ratios (1:3:5:7) of a shear-spring model of the underground soil. Thus, one of the amplification mechanisms is supposed to result from the natural modes in the underground soil. Furthermore, the similarity of pulse waves between MYG012 (EW) and AKTH04 (EW) is pointed out in the non-stationary Fourier spectra and the double-integrated displacement profiles. The pulse waves are identified by the Ricker wavelet. This amplification mechanism is supposed to be caused by the collision between the observation house and the side soil. The modulation of dominant component is also detected in the high frequency range. The shear strain of AKTH04 is calculated using the relative displacement profiles between the surface and the borehole. The peak shear strain is fitted to the G-γ relation and the deterioration ratio of shear stiffness is evaluated. The third amplification mechanism is related to the change of depth of isolated surface soil. The depth of the isolated surface soil is evaluated from the deterioration area shallower than 20 m. It is pointed out finally that the seismic records at the ground surface are unsuitable for the database of seismic design wave.
Introduction
The strong-motion Seismograph Networks (K-NET, KiK-net) was established to mitigate the seismic hazard after the Hyogo-ken Nanbu earthquake in 1995, and it has been operated by the National Research Institute for Earth Science and Disaster Resilience [National Research Institute for Earth Science and Disaster Prevention (NIED), 2017]. The database of seismic records promoted the revision of seismic design (Kamae et al., 2004; Fuketa, 2013; Ohsuga, 2013; Kobayashi et al., 2014; Goda et al., 2015). Especially the revision of the seismic design wave (Ss) was required for each nuclear power plant in Japan as “Back-Fit” after three seismic events, i.e., the Niigata-ken Chuetsu-oki earthquake in 2007, the Suruga-Bay earthquake in 2009 and the 2011 off the Pacific coast of Tohoku earthquake. The tentative design basis earthquake ground motion (SS) at the Hamaoka nuclear power plant has a peak value of 20 m/s2 (Chubu Electric Power Co., Inc., 2015). The value of SS is based on the seismic records with accelerations over 20 m/s2. The upper bound of the seismic design wave may be important from the viewpoint of seismic engineering [Nuclear Regulation Authority (NRA), 2013].
The seismic records with the peak accelerations over 20 m/s2 were measured by the K-NET and KiK-net as shown in Table 1. The peak value of 38.7 m/s2 in IWTH25 (UD) was supposed to be caused by the vertical behavior of the base-mat in the observation house (Ohmachi et al., 2011; Kamagata and Takewaki, 2017). In addition, the peak value of 24.5 m/s2 in AKTH04 (EW) was supposed to result from the collision between the observation house and the side soil (Kamagata and Takewaki, 2017).
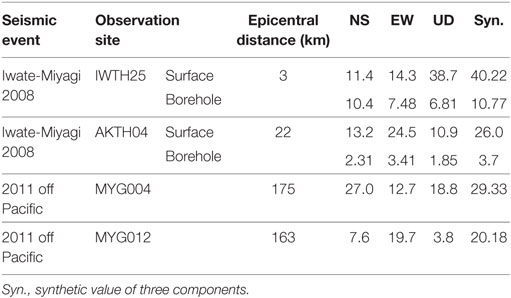
Table 1. Peak acceleration values over 20 m/s2.
In this paper, the seismic records of MYG004 (NS) with the peak value of 27 m/s2 and MYG012 (EW) with the peak value of 19.7 m/s2 are analyzed by the non-stationary Fourier spectrum and the double-integrated displacement profile. The seismic records of AKTH04 are re-analyzed to make clear the amplification mechanism due to the collision between the observation house and the side soil. The deterioration of the surface soil at AKTH04 is explained by the shear strain between the surface and the borehole.
The new findings from the analysis results are as follows.
(1) The frequencies of dominant components were compared with the natural frequencies with the ratios (1:3:5:7) of a shear-spring model of the underground soil. It was found that these correspond well. This suggests that the peak acceleration was caused by the amplification of natural modes in the surface soil.
(2) The similarity of pulse waves between MYG012 (EW) and AKTH04 (EW) was confirmed by the dominant components in the non-stationary Fourier spectra. This suggests the same amplification mechanism, i.e., the collision between the observation house and the side soil.
(3) The shear strain in the surface soil was evaluated from the double-integrated displacement profiles at AKTH04 and the deterioration ratio (G/Go) of soil stiffness was evaluated. Based on this fact, it is supposed that the existence of isolated surface soil may be one of the amplification mechanisms.
It may be concluded that the peak acceleration over 20 m/s2 was caused by various non-linear behaviors in the surface soil. These facts suggest that they should be eliminated from the database for the seismic design wave. The seismic records at the borehole of KiK-net are recommended to be used in the database for the seismic design wave.
Analysis Methods
Three KiK-net sites (MYG004, MYG012, and AKTH04) and both epicenters (Iwate-Miyagi Nairiku earthquake in 2008 and 2011 off the Pacific coast of Tohoku earthquake) are shown in Figure 1 together with the acceleration profiles. The peak accelerations over 20 m/s2 occurred at the surface, but the peak value at the borehole was smaller than 5.0 m/s2. The peak value 24.5 m/s2 at the surface of AKTH04 (EW) was supposed to be amplified in the propagation process from the borehole to the surface.
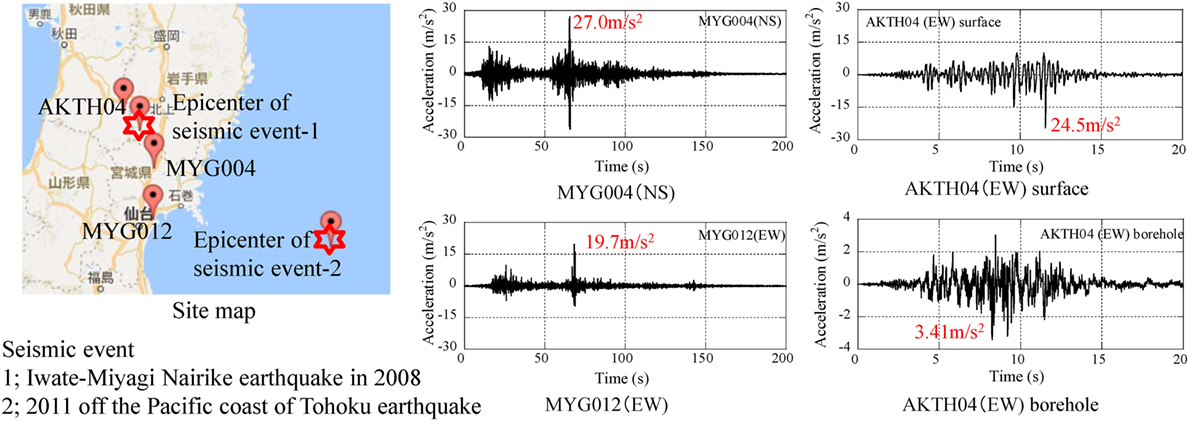
Figure 1. Seismic records with peak value over 20 m/s2.
The acceleration and displacement profiles were analyzed by the non-stationary Fourier spectra defined by Eq. 1.
where
, ,
Seismic record,
tj(j = 1, 2, …, M); j-th time, ωi(i = 1, 2, …, N/2); i-th frequency,
N; Number of steps in FFT analysis,
M = T/ΔT; Number of steps in sweeping process,
T; Duration time of seismic record,
ΔT; Sweeping interval time,
ta; Data-window width.
The non-stationary Fourier spectra are illustrated by using the contour with the horizontal axis of time and the vertical axis of frequency. The amplitude values are normalized by the peak amplitude value as the percentage. The maximum amplitude spectra at the frequency of ωi are derived by Eq. 2.
The series of amplitude spectra at the selected time of tj are newly introduced to investigate the transient process of dominant components.
In the parameters of non-stationary Fourier spectra, the data-window width ta affects the amplitude and the occurrence time of the dominant components. One-cycle and three-cycle sinusoidal waves of 1 Hz were analyzed by three kinds of ta (1.0, 1.5, and 2 s) as shown in Figure 2.
(1) In the maximum amplitude spectra of one cycle, the peak values of the maximum amplitude have the same value of 1.0 m/s2 in three kinds of data-window width.
(2) In the maximum amplitude spectra of three cycles, the peak values of the maximum amplitude were incorrectly evaluated as 2.0 m/s2 in the data-window width of 2 s.
(3) In the non-stationary Fourier spectra of one cycle, the occurrence time was incorrectly evaluated from 1.5 to 2.5 s.
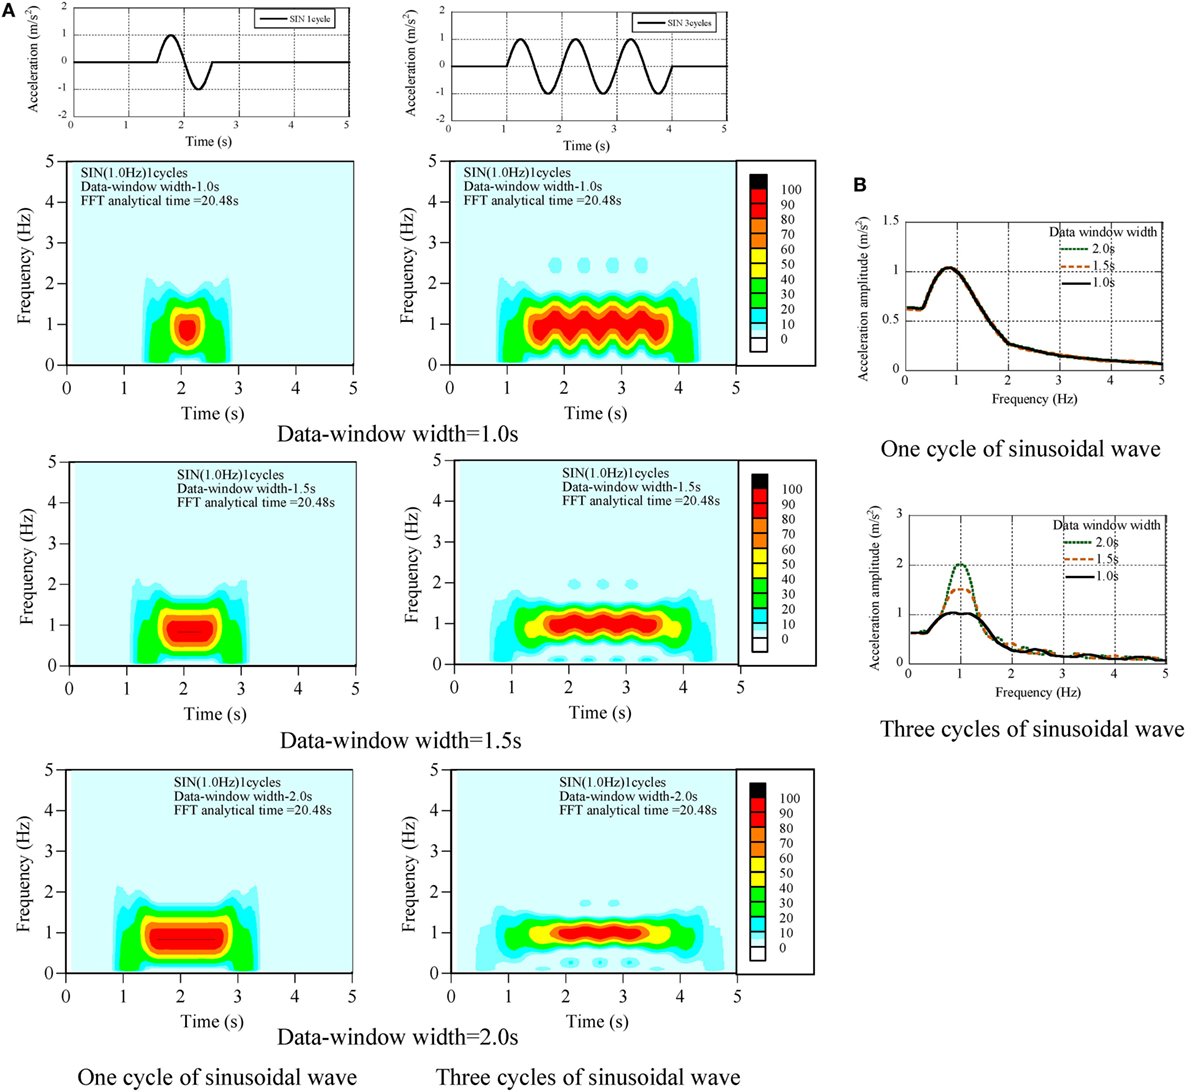
Figure 2. Calibration of data-window width, (A) non-stationary Fourier spectra, (B) maximum amplitude spectra.
To set the suitable data-window width, the band-pass filtering was introduced as shown in Figure 3. The non-stationary Fourier spectra can detect the peak dominant component in the global seismic record. The dominant frequency of the focused pulse wave is supposed to be composed of high frequency components. Therefore, the low frequency components were gradually eliminated in Case-1, Case-2, and Case-3. The filtered acceleration profiles have advantage to enable the setting of the suitable data-window width since the focusing frequency is restricted. The data-window width of each filtered case was set as shown in Table 2.
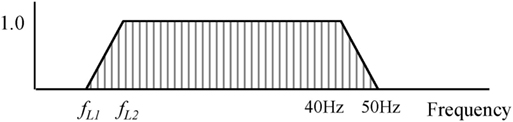
Figure 3. Band-pass filter.
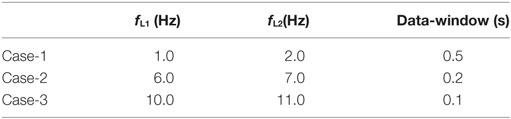
Table 2. Three kinds of band-pass filter.
Amplification by Natural Mode of Surface Soil
In the previous studies (Kamagata and Takewaki, 2013a,b,c, 2015), the amplification mechanism of pulse waves was investigated by using the non-stationary Fourier spectra and the double-integrated displacement profile. At the No.1 unit reactor building in the Kashiwazaki-Kariwa nuclear power plant during the Niigata-ken Chuetsu-oki earthquake in 2007, it was explained that the pulse wave with the value of 6.8 m/s2 resulted from the collision between the base-mat and the surrounding soil (Kojima et al., 2014). Regarding the seismic record of IWTH25 (UD), the pulse wave with the maximum acceleration 38.7 m/s2 was supposed to result from the induced vertical movement between the base-mat of observation house and the beneath soil (Kamagata and Takewaki, 2017).
Seismic Records of MYG004 (NS) and MYG012 (EW)
The soil properties, the velocity of shear wave and pressure wave at MYG004 and MYG012 are illustrated in Figures 4A–C. The surface soil condition of MYG004 is the alternation of sandy soil, silt, and gravel soil up to the depth of GL–20 m. The velocity of shear wave is smaller than 200 m/s in the depth of GL–12 m. That of MYG012 is the fill soil and the silt from GL–0 m to GL–6 m and the rock below GL–6 m. The velocity of shear wave is smaller than 200 m/s in the depth of GL–6 m and is 800 m/s or larger below GL–7 m.
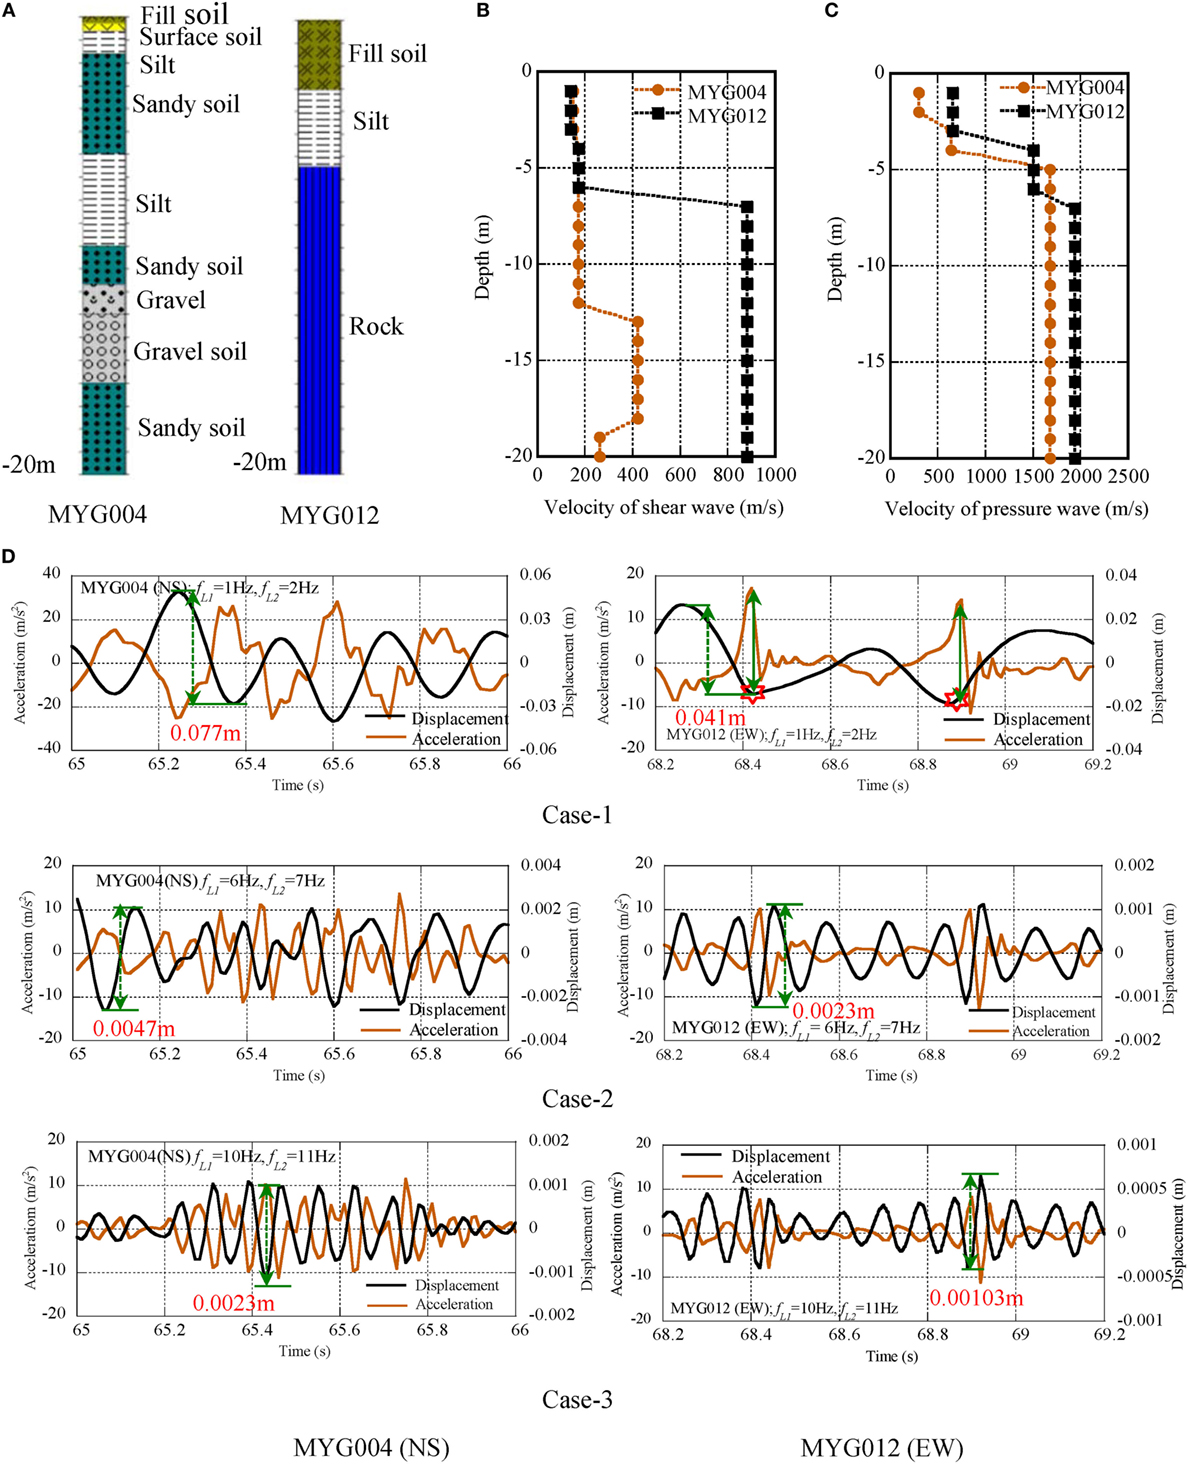
Figure 4. Acceleration and displacement profiles of MYG004 (NS) and MYG012 (EW), (A) surface soil condition, (B) VS, (C) VP, (D) comparison of acceleration and displacement profiles.
The pulse waves were detected in the seismic records of MYG004 (NS) from 65 to 66 s and in MYG012 (EW) from 68.2 to 69.2 s.
The acceleration and displacement profiles at MYG004 (NS) and MYG012 (EW) are illustrated in Figure 4D. The peak acceleration at MYG004 was detected in the cyclic waves from 65.2 to 65.8 s. On the other hand, the peak acceleration at MYG012 was observed in the form of pulse waves at 68.4 and 68.9 s. This difference suggests the different amplification mechanism of peak acceleration.
The peak acceleration at 65.24 s of MYG004 was correspondent to the displacement profile with the peak-to-peak amplitude of 0.077 m. The pulse waves at 68.42 s of MYG012 were correspondent to that of 0.041 m. The difference was supposed to be related to the deference of Vs in the surface soil shallower than 20 m. The pulse waves at MYG012 with the amplitude of 20 m/s2 were correspondent to the negative peak of displacement profile as shown by the red star at 68.4 and 68.9 s in Figure 4D. The additional high frequency components with the amplitude of 10 m/s2 were correspondent to the peak-to-peak displacement of 0.0023 m at MYG004 and that of 0.00103 m at MYG012 as shown in the profiles of Case-3.
In order to evaluate the dominant components of pulse waves of MYG004 (NS), the acceleration profiles of Case-1 and Case-3 were analyzed by the non-stationary Fourier spectra as shown in Figure 5A. The maximum amplitude spectra are illustrated in Figure 5B. The amplitude spectra with the interval time 0.04 s are illustrated from 65.24 to 65.52 s in Figure 5C.
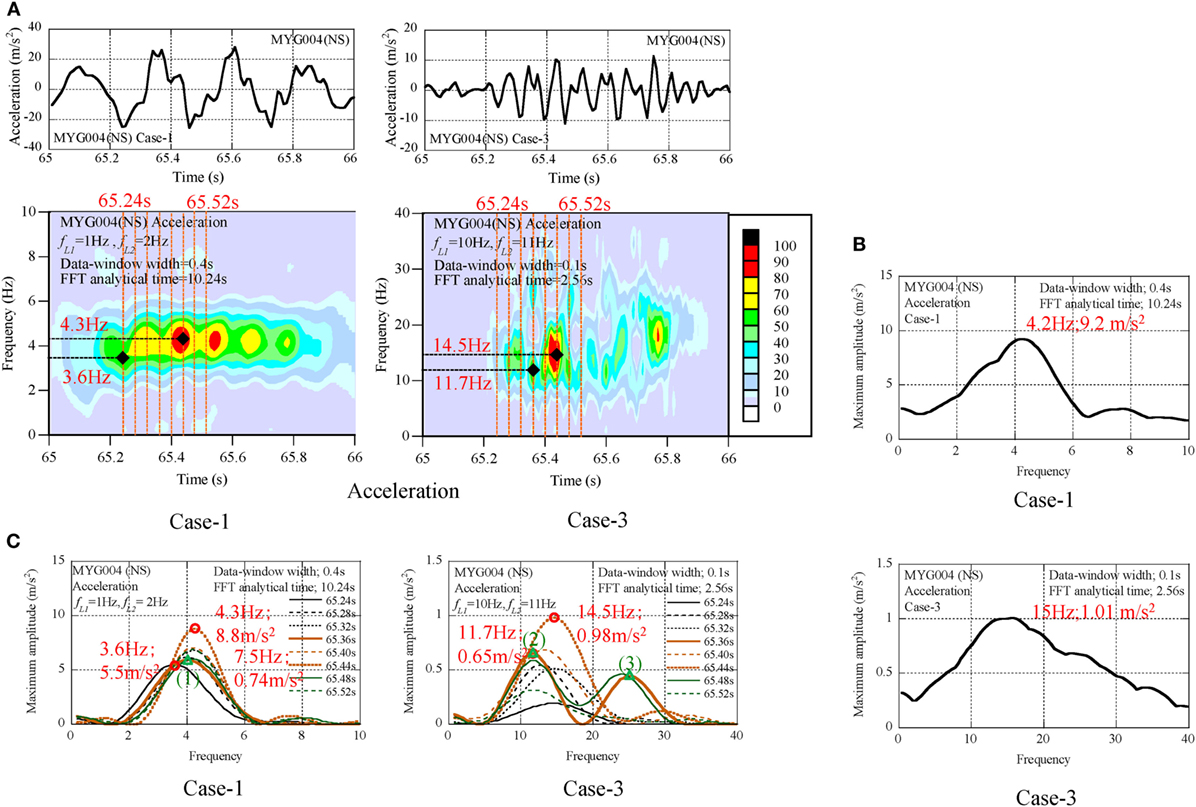
Figure 5. Seismic records of MYG004 (NS), (A) non-stationary Fourier spectra, (B) maximum amplitude spectra, (C) transient process of amplitude spectra.
The seismic behavior was evaluated as follows:
(1) The dominant components were found at the frequency of 4 Hz in the profiles of Case-1, and at the frequency from 11 to 15 Hz in the profiles of Case-3.
(2) The peak amplitude in the profiles of Case-1 was 9.2 m/s2 at 4.2 Hz. The derived peak amplitude was 34% of the peak value (27 m/s2). The peak amplitude in the profiles of Case-3 was 0.98 m/s2 at 14.5 Hz. The derived additional peak amplitude was 4% of the peak value.
(3) In the series of amplitude spectra from 65.24 to 65.52 s, the authors focused on the explicitly separated modes at 65.36 and 65.44 s, and these were identified by the number of (1), (2), (3), and (4). The frequency and amplitude of each mode are listed in Table 3. Each frequency was normalized by the frequency of the first mode in the form of the frequency ratio. The frequency ratio was close to the natural frequency ratios (1:3:5:7:9) of the shear-spring model of the surface ground (see Figure 6), and this suggests that the peak value at the surface was composed of the natural modes in the underground soil.
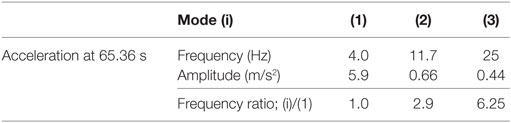
Table 3. Dominant frequency and amplitude in amplitude spectra (MYG004).
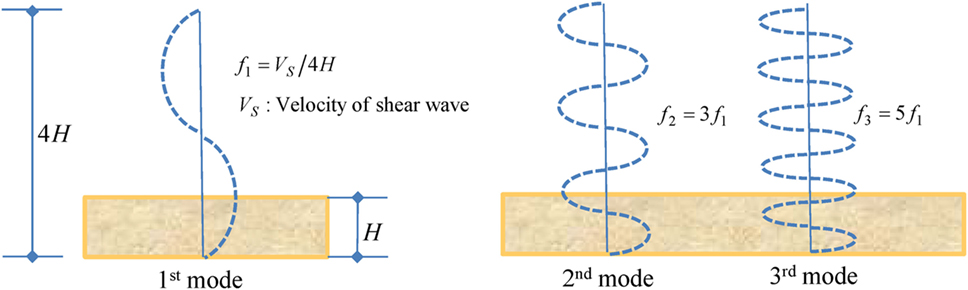
Figure 6. Natural modes of shear-spring model.
The dominant components of pulse waves of MYG012 (EW) in the acceleration profiles of Case-1 and Case-2 were analyzed by the non-stationary Fourier spectra as shown in Figure 7A. The maximum amplitude spectra are illustrated in Figure 7B. The series of amplitude spectra with the interval time 0.05 s are illustrated from 65.3 to 65.55 s in Figure 7C. The seismic behavior was evaluated as follows:
(1) The dominant components were found around 3 Hz in the filtered profiles of Case-1, and at the frequency from 7 to 12 Hz in the filtered profiles of Case-2.
(2) The peak amplitude in the filtered profile of Case-1 was 1.96 m/s2 at 2.9 Hz. This was 10% of the peak acceleration (19.7 m/s2).
(3) In the series of amplitude spectra, the authors focused on the explicitly separated modes in the amplitude spectra at 68.35 s and identified the modes by the number of (1), (2), (3), (4), and (5) (see Table 4). The frequency ratios were close to the natural frequency ratios of the shear-spring model of the surface ground (1:3:5:7:9).
(4) In the amplitude spectra at 68.55 s, the fundamental frequency was 1.8 Hz. The difference of the fundamental frequency between 68.35 and 68.55 s was caused in the non-stationary transient seismic process.
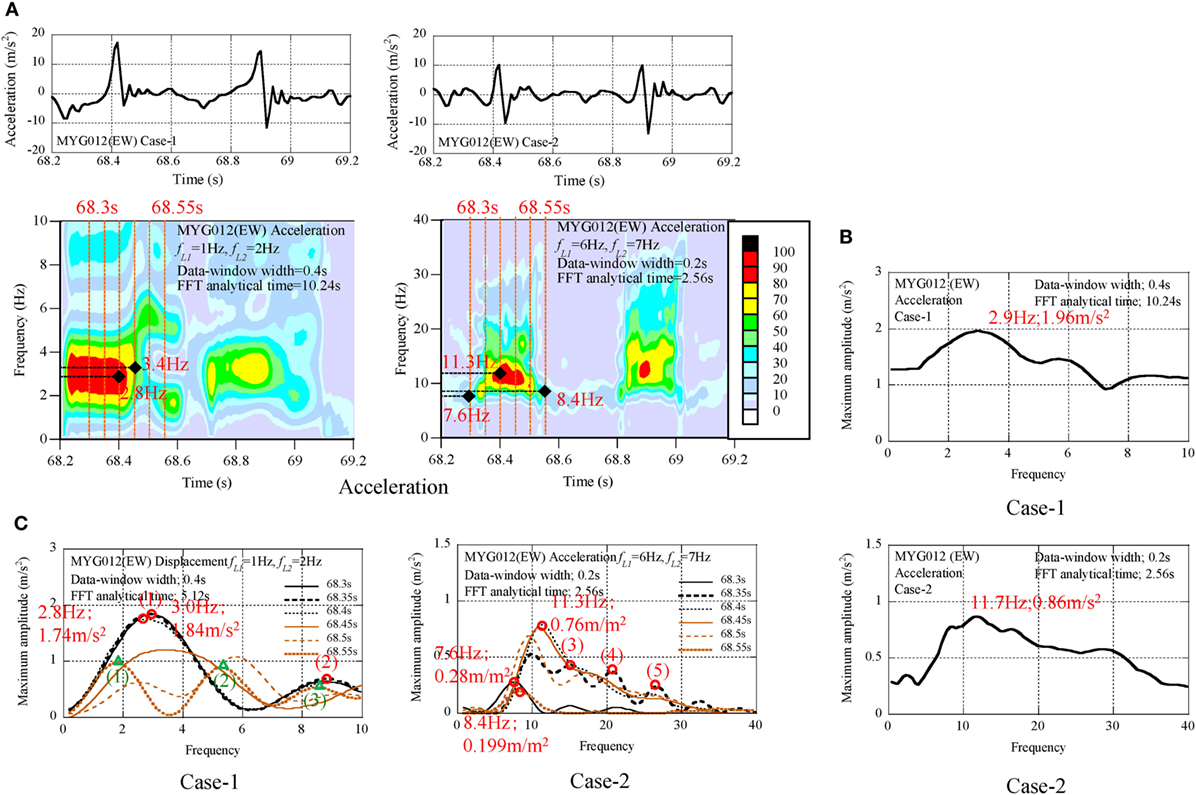
Figure 7. Seismic records of MYG012 (EW), (A) non-stationary Fourier spectra, (B) maximum amplitude spectra, (C) transient process of amplitude spectra.
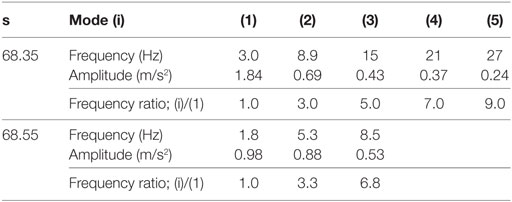
Table 4. Dominant frequency in acceleration amplitude spectra.
Seismic Records of AKTH04 (EW)
The acceleration profiles of Case-1 and Case-2 during 11–12 s at the surface were analyzed by the non-stationary Fourier spectra as shown in Figure 8A. The Maximum amplitude spectra were illustrated in Figure 8B. The series of amplitude spectra with the time interval 0.05 s are illustrated as the transient process from 11.35 to 11.75 s (see Figure 8C).
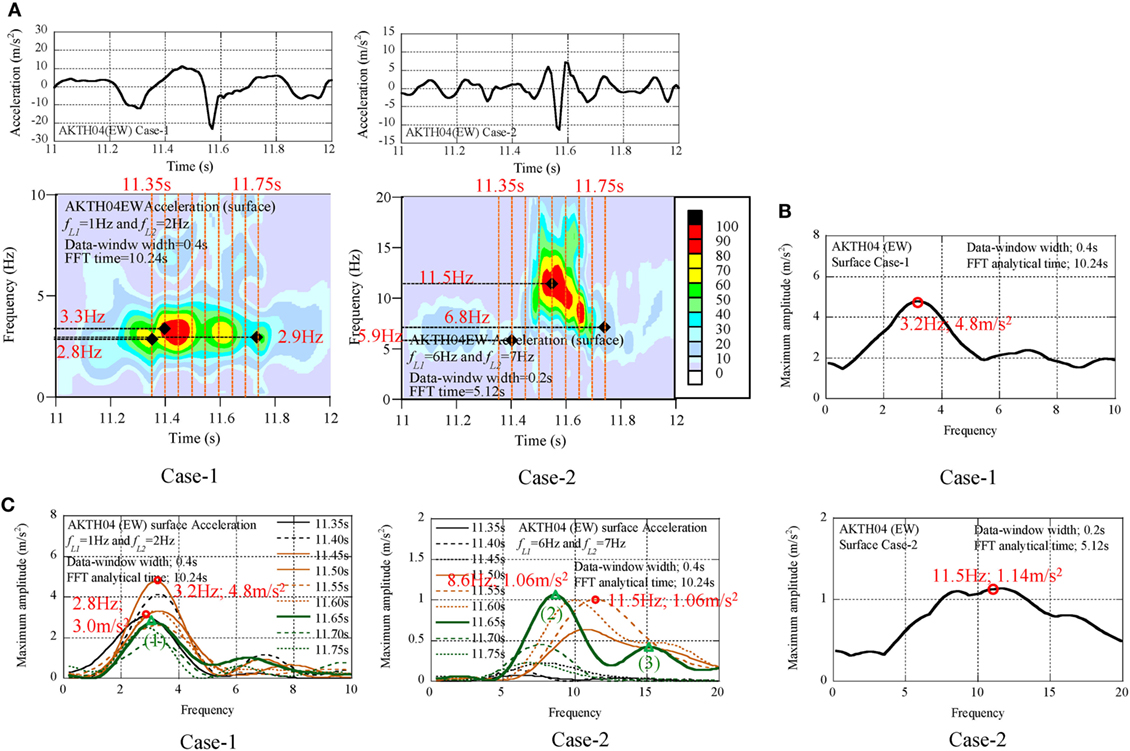
Figure 8. Seismic records of AKTH04 (EW); surface, (A) non-stationary Fourier spectra, (B) maximum amplitude spectra, (C) transient process of amplitude spectra.
The following findings were derived from the analysis results.
(1) In the non-stationary Fourier spectra of Case-1, no dominant component was found in the pulse wave at 11.57 s.
(2) In the non-stationary Fourier spectra of Case-2, the modulation from 11.5 to 6.8 Hz was found in the pulse wave at 11.57 s.
(3) In the maximum amplitude spectra of Case-1, the peak values were 4 m/s2 around 3.0 Hz. The peak value was 16% of the peak value (25.4 m/s2).
(4) In the maximum amplitude spectra of Case-2, the amplitude of modulating components was around 1.0 m/s2.
(5) In the transient process of amplitude spectra, the dominant components differed at each time, and this was considered as the progressing process of natural modes.
(6) In the amplitude spectra at 11.65 s, the dominant components were numbered (1), (2), and (3). Their frequencies and amplitude values are listed in Table 5.
(7) The frequency ratios were near to the natural frequency ratios of the shear-spring model of the surface ground (1:3:5), and this phenomenon was common to the frequency ratios of MYG004 and MYG012.
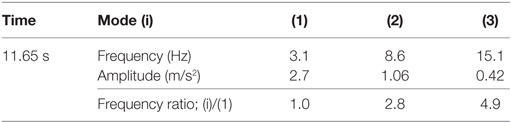
Table 5. Dominant frequency in acceleration amplitude spectra.
The acceleration at the borehole was also analyzed as shown in Figure 9. In the profiles of Case-1, the phase of the acceleration profile was different from that of the displacement profile. The following findings were derived from the analysis results.
(1) The peak value of the acceleration profile of Case-1 was 0.35 m/s2 at 5.2 Hz. The peak value of the dominant component was 11% of the peak value (3.2 m/s2).
(2) The peak value of the acceleration profile of Case-2 was 0.12 m/s2 at 13.3 Hz. The peak value of the dominant component was 5% of the peak value (2.3 m/s2).
(3) The frequency ratio of the dominant component in the acceleration amplitude spectra at 11.65 s was close to 1:3:5, and this implies that the dominant components at the borehole were also related to the natural modes of surface soil (see Table 6).
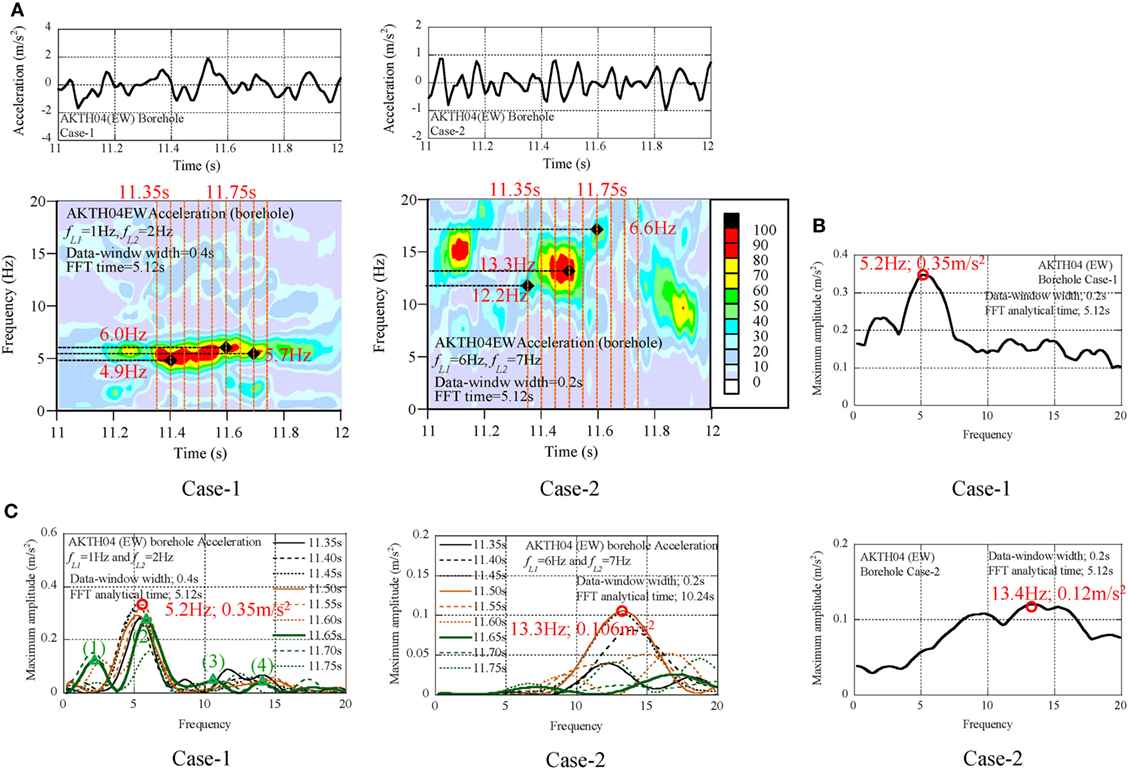
Figure 9. Seismic records of AKTH04 (EW); borehole, (A) Non-stationary Fourier spectra, (B) Maximum amplitude spectra, (C) Transient process of amplitude spectra.
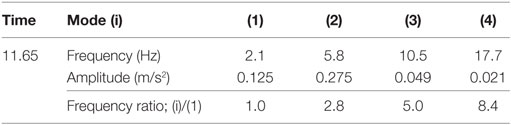
Table 6. Dominant frequency in amplitude spectra.
Amplification Due to Collision Between Observation House and Side Soil
The Strong-motion Seismograph Network (KiK-net) measures the seismic data at the surface and the borehole. The open seismic data are useful to investigate the seismic behavior of the underground soil [National Research Institute for Earth Science and Disaster Prevention (NIED), 2017]. The seismic data with the peak value over 20 m/s2 were recorded at IWTH25 (UD) and AKTH04 (EW) during the Iwate-Miyagi Nairiku earthquake in 2008. The authors analyzed them by the non-stationary Fourier spectra and the double-integrated displacement and derived the amplification mechanism of pulse waves with the peak value over 20 m/s2 (Kamagata and Takewaki, 2017). The vertical mode induced by the collision between the base-mat of the observation house and the beneath soil was found in the record at IWTH25 (UD). The collision between the base-mat of the observation house and the side soil was supposed in the horizontal mode at AKTH04 (EW).
Similarity of MYG012 (EW) and AKTH04 (EW)
The authors focused on the similarity of pulse waves between MYG012 (EW) and AKTH04 (EW). The acceleration profiles from 68.2 to 69.2 s of MYG012 (EW) and from 11 to 12 s of AKTH04 (EW) are illustrated in the form of global profile of Case-1, and those from 68.85 to 69.0 s of MYG012 (EW) and from 11.5 to 11.7 s of AKTH04 (EW) are illustrated in the form of the zoomed profile of Case-3 (see Figure 10A).
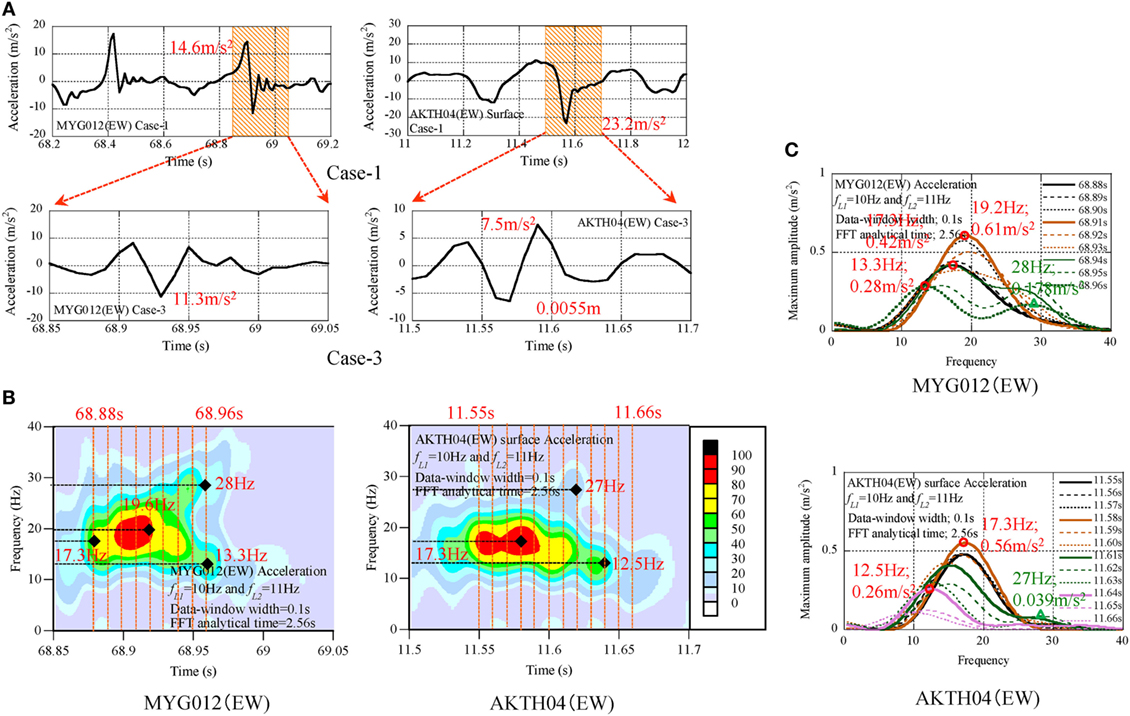
Figure 10. Comparison of pulse wave in MYG012 (EW) and AKTH04 (EW): surface, (A) acceleration and displacement profiles, (B) non-stationary Fourier spectra, (C) transient process of amplitude spectra.
To detect precisely the occurrence time of dominant components in the non-stationary Fourier spectra, the sampling time 0.01 s was linearly interpolated with the sampling time 0.001 s and they were analyzed with the sweep interval time 0.002 s (see Figure 10B). The series of the amplitude spectra are illustrated with the interval time 0.01 s (see Figure 10C).
The authors supposed that the similarity of both pulse waves occurred as follows:
(1) In the zoomed profiles of Case-3, the peak values were 11.3 m/s2 in MYG012 and 7.5 m/s2 in AKTH04, and this indicated that the 50% or more of pulse waves was composed of the frequency components of 10 Hz and larger.
(2) The peak values of MYG012 (EW) were 0.61 m/s2, and this was close to the peak values 0.56 m/s2 in AKTH04 (EW).
Identification of Pulse Waves by Ricker Wavelet
The similarity of pulse waves in AKTH04 (EW) and MYG012 (EW) suggested the same occurrence mechanism of pulse waves. The authors observed the similarity of pulse waves and identified them by the Ricker wave as shown in Figures 11A,C. The pulse wave with the shape of the Ricker wave was supposed to be caused by the one-sided displacement as shown in Figure 11B. It may result from the collision between the observation house and the side soil (see Figure 11D).
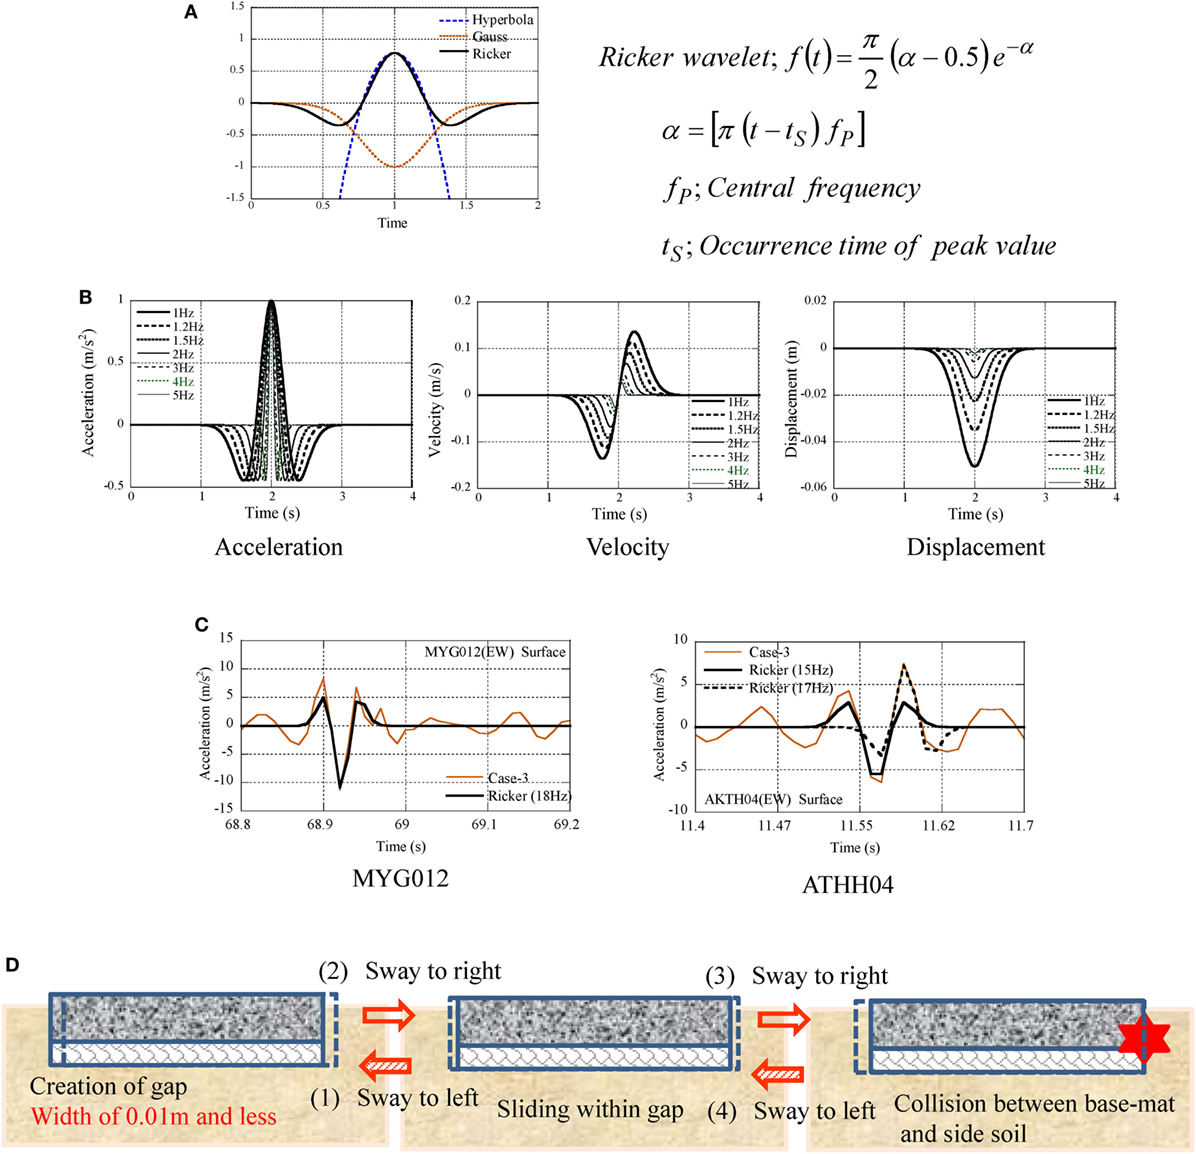
Figure 11. Identification of pulse wave by Ricker wavelet, (A) components of Ricker wavelet, (B) wave shape of Ricker wavelet, (C) identification of pulse wave by Ricker wavelet, (D) pulse wave by collision between the observation-house and the side soil.
Amplification by the Local Mode of Isolated Surface Soil
In the non-stationary Fourier spectra, the modulation of dominant components was observed. The modulation to the higher frequency was supposed to be induced by the local mode in the surface soil. The concept of isolated surface soil was newly introduced to explain the modulation.
Deterioration of Underground Soil at AKTH04
The profile of Vs is illustrated in Figure 12A. In the surface soil from GL–0 m to GL–20 m, Vs attains 430 m/s. The soil property is illustrated in Figure 12B. In addition, the displacement profiles at the surface and borehole are illustrated in Figure 12C and the deformation process of underground soil is illustrated in Figure 12D from 9.65 to 10.30 s with the time interval 0.05 s. The sway mode and the whipping mode in the underground soil were found in these figures. Furthermore, the shear strain was calculated from the relative displacement between the borehole and the surface (see Figure 12E). The maximum shear strain was fitted to the G-γ curve of gravel soil and the deterioration ratio of 0.54 was evaluated (see Figure 12F).
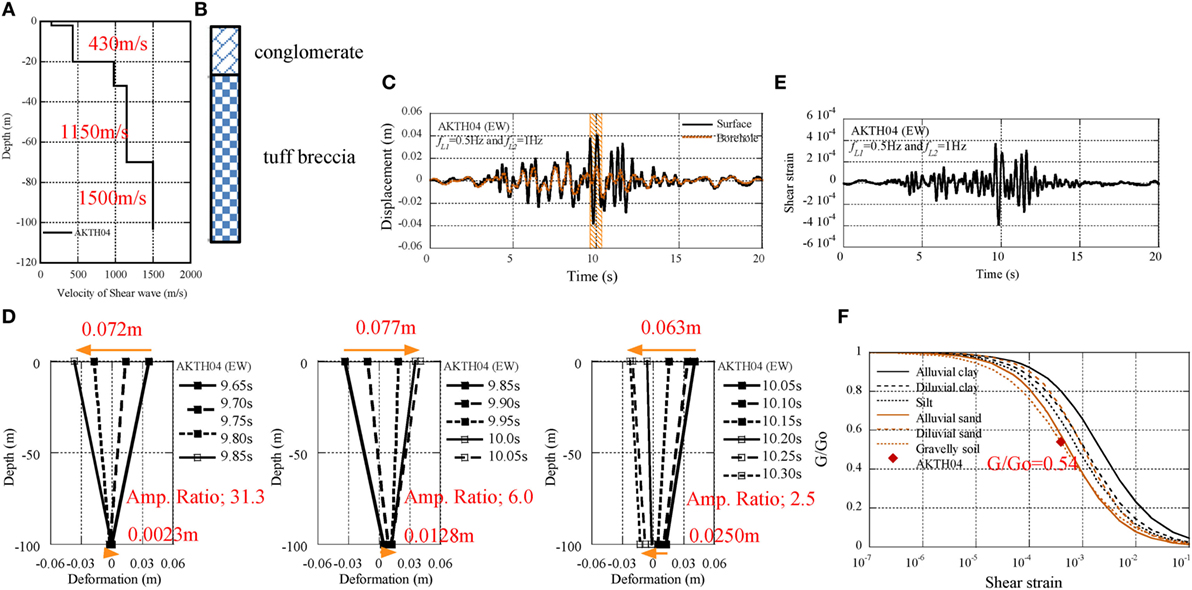
Figure 12. Deterioration of underground soil at AKTH04, (A) profile of VS, (B) soil property, (C) displacement profile at surface and borehole, (D) deformation process of surface soil from 9.65 to 10.3 s, (E) shear strain profile, (F) deterioration ratio of surface soil.
The deterioration of the underground soil can be observed as follows:
(1) The displacement profile at the surface was coincident with that at the borehole except the time range from 9.5 to 12.5 s, and this was regarded as the sway mode.
(2) In the interval from 9.65 to 9.85 s, the peak-to-peak displacement at the surface was 0.072 m, and this was 31.3 times of the peak-to-peak displacement at the borehole. This amplification may be due to the whipping mode.
(3) The shear strain of the underground soil was evaluated in the extent of 4 × 10⁻⁴.
(4) Finally, the deterioration ratio of soil stiffness (G/GO) was evaluated as 0.54.
Using the seismic records of the Kashiwazaki-Kariwa site during the Niigata-ken Chuetsu-oki earthquake in 2007, the reduction of the shear moduli in the upper softer layer was found to be about 30–35% (Pavienko and Irikura, 2012).
Evaluation of Local Mode Induced by Isolated Surface Soil
The deterioration in the underground soil may be acceptable as a mechanism of the modulation to the lower frequency. The authors introduced the concept of isolated surface soil to explain the modulation to the higher frequency as follows:
(1) The arrived seismic wave at the bedrock propagated to the surface accompanying with the amplification of the natural vibration modes in the underground.
(2) In the propagation from the bedrock to the surface, the deterioration of underground soil started in the deeper underground with the depth of βH, and this caused the isolated surface soil with the depth of (1 − β)H as shown in Figure 13B.
(3) As the deterioration depth of βH enlarged in the underground, the depth of (1 − β)H decreased and the natural frequency of isolated surface soil (fI) became larger.
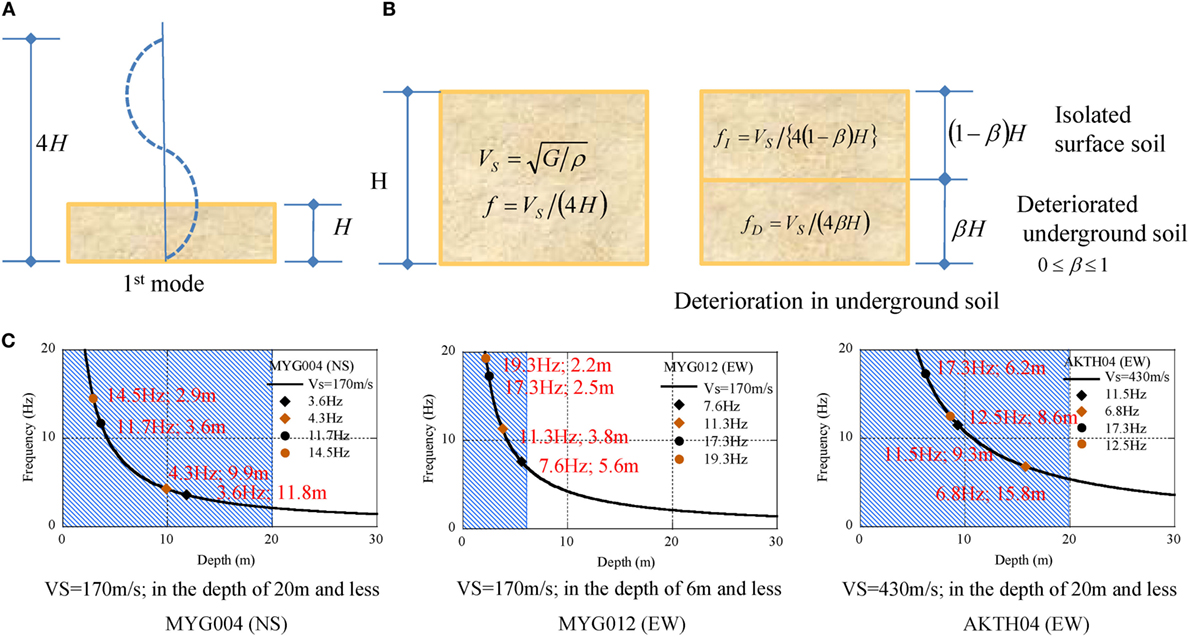
Figure 13. Modulation mechanism by deterioration of underground soil, (A) fundamental mode, (B) isolated surface soil, (C) evaluated depth of surface spoil.
The modulation frequencies from the starting frequency f(t1) to the ending frequency f(t2) are listed in Table 7 with the estimated depth of isolated surface soil. The relation between the soil depth and the frequency is illustrated in Figure 13A. The derived depth of isolated surface soil is plotted by the marks of circle and square, and the depth extension with Vs of surface soil is shaded in Figure 13C.
(1) In the seismic record of MYG004, the related depth of modulation, i.e., from 4.3 to 3.2 Hz in Case-1 and from 11.2 to 14.5 Hz in Case-3, was detected in the underground shallower than 20 m with Vs of 170 m/s or smaller.
(2) In the seismic record of MYG012, the related depth of modulation, i.e., from 7.6 to 11.3 Hz in Case-2 and from 17.3 to 19.3 Hz in Case-3, was detected in the underground shallower than 6 m with Vs of 170 m/s or smaller.
(3) In the seismic record of AKTH04, the related depth of modulation, i.e., from 11.5 to 6.8 Hz in Case-2 and 17.3 to 12.5 Hz in Case-3, was detected in the underground shallower than 20 m with Vs of 430 m/s or smaller.
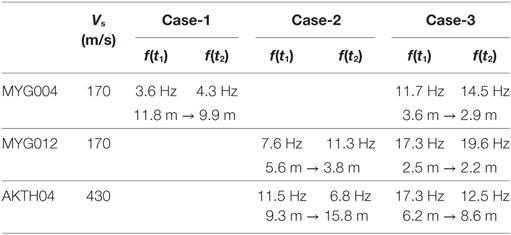
Table 7. Modulation of dominant frequency in non-stationary Fourier spectra.
The analysis results suggest that the modulating frequencies in the higher frequency range were excited in the surface soil with the depth of 20 m or shallower.
Conclusion
The seismic records of MYG004 (NS), MYG012 (EW), and AKTH04 (EW) with the peak accelerations over 20 m/s2 were analyzed by the non-stationary Fourier spectra and the double-integrated displacement. The band-pass filtering was applied to the acceleration profiles to extract the dominant components of pulse waves. The dominant components of pulse waves were analyzed by the amplitude spectra at the specific time in the non-stationary Fourier spectra. The frequencies of dominant components were evaluated in terms of the frequency ratios by comparing with the natural frequencies of the surface ground. The derived frequency ratios 1:3:5 were coincident with the natural frequency ratios of the shear-spring model of the surface ground. Thus, one of the amplification mechanisms of waves over 20 m/s2 was supposed to result from the amplification of natural modes in the underground soil.
The pulse wave was analyzed by using the acceleration and displacement profiles with various band-pass filters. The components over 50% of peak acceleration values were composed of the components with the frequency of 5 Hz and higher. The similarity of pulse waves between MYG012 (EW) and AKTH04 (EW) was confirmed. The pulse waves were identified by the Ricker wavelet. The acceleration pulse wave with the shape of Ricker wavelet corresponds to the one-sided displacement. Thus, the second amplification mechanism of peak acceleration was supposed to be induced by the collision between the observation house and the side soil.
The seismic behavior of surface soil was investigated by the double-integrated displacement profiles at the surface and borehole of AKTH04 (EW). The whipping mode was detected in the surface soil and the shear strain of the underground soil was calculated from the relative displacement between the surface and the borehole. The deterioration ratio was evaluated by fitting the peak shear strain to the G-γ relation.
Considering the deterioration in the underground, the modulation of dominant components was explained by using the idea of the isolated surface soil. The isolated surface soil was calculated from the modulating-frequency range. The depth of the isolated surface soil was estimated to be shallower than 20 m. The additional mode induced by the deterioration in the underground was supposed to be the third amplification mechanism of pulse waves. Thus, it may be said that the higher frequency components occupying 50% or more of acceleration values were excited in the shallower surface soil.
The shear wave velocity Vs at the borehole of AKTH04 was 1,500 m/s, which satisfies the engineering bedrock condition of 700 m/s. The half or more of 20 m/s2 were caused by various non-linear behaviors from the borehole (engineering bedrock) to the surface. The upper-bound acceleration of the seismic design waves should refer to the seismic records at the borehole of KiK-net.
Author Contributions
SK carried out the theoretical and numerical analysis. IT discussed the theoretical and numerical analysis.
Conflict of Interest Statement
The authors declare that the research was conducted in the absence of any commercial or financial relationships that could be construed as a potential conflict of interest.
Acknowledgments
The authors appreciate the National Research Institute for Earth Science and Disaster Prevention for the publication of seismic records (K-NET and KiK-net).
References
Chubu Electric Power Co., Inc. (2015). Hamaoka Nuclear Power Plant: Formulation of design basis earthquake ground motion–Ss, July 24, 2015. Available at: https://www.nsr.go.jp/data/000116088.pdf. in Japanese
Fuketa, T. (2013). Proposed Regulatory Requirements in Japan. Nuclear Regulation Authority (NRA). Available at: http://www.nsr.go.jp/data/000067048.pdf
Goda, K., Kurahashi, S., Ghofrani, H., Askinson, G. M., and Irikura, K. (2015). Nonlinear response potential of real versus simulated ground motion for 11th March 2011 Great East Japan earthquake. Earthq. Spectra 31, 1711–1734. doi: 10.1193/071213EQS201M
Kamae, K., Kawabe, H., and Irikura, K. (2004). “Strong ground motion prediction for huge seduction earthquake using characterized source model and several simulation techniques,” in Proc. of the 13th WCEE (Vancouver).
Kamagata, S., and Takewaki, I. (2013a). Occurrence mechanism of recent large earthquake ground motion at nuclear power plant sites in Japan under soil-structure interaction. Earthq. Struct. 4, 557–683. doi:10.12989/eas.2013.4.5.557
Kamagata, S., and Takewaki, I. (2013b). New insights into seismic behavior of building and surrounding soil at Hamaoka nuclear power station during Suruga Bay earthquake in 2000. Soil Dyn. Earthq. Eng. 53, 73–91. doi:10.1016/j.soildyn.2013.06.007
Kamagata, S., and Takewaki, I. (2013c). Role of records during the 2011 off the Pacific coast of Tohoku earthquake in seismic resistant design of nuclear power station. Int. J. Earthq. Eng. Hazard Mitigation 1, 9–21.
Kamagata, S., and Takewaki, I. (2015). Non-linear transient behavior during soil liquefaction based on re-evaluation of seismic records. Soil Dyn. Earthq. Eng. 71, 163–184. doi:10.1016/j.soildyn.2015.01.017
Kamagata, S., and Takewaki, I. (2017). Occurrence mechanism of large acceleration in KiK-net seismic records during the Iwate-Miyagi Nairiku earthquake in 2008. Front. Built Environ. 3:13. doi:10.3389/fbuil.2017.00013
Kobayashi, G., Sugino, H., Tsutsumi, H., and Ebisawa, K. (2014). “Guidance for evaluation of seismic ground motion from diffuse seismicity,” in JNES-RE-Report Series (Japan Nuclear Energy Safety Organization). JNES-RE-2013-2045.
Kojima, K., Kamagata, S., and Takewaki, I. (2014). A new interpretation of large amplitude earthquake acceleration from non-linear local soil-structure interaction. Nucl. Eng. Des. 273, 271–287. doi:10.1016/j.nucengdes.2014.03.023
National Research Institute for Earth Science and Disaster Prevention (NIED). (2017). Strong-Motion SEISMOGRAPH Networks (K-NET, KiK-net). Available at: http://www.kyoshin.bosai.go.jp/
Nuclear Regulation Authority (NRA). (2013). Outline of New Regulatory Requirements (Design Basis). Available at: https://www.nsr.go.jp/data/000067117.pdf
Ohmachi, T., Inoue, S., Mizuno, K., and Yamada, M. (2011). Estimated cause of extreme acceleration records at the KiK-net IWTH25 station during the 2008 Iwate-Miyagi Nairiku earthquake, Japan. Trans. Jpn. Assoc. Earthq. Eng. 11, 32–47. doi:10.5610/jaee.11.1_32
Ohsuga, Y. (2013). New regulatory guide for nuclear power plants in Japan after the Fukushima accident. Int. J. Nucl. Saf. Simul. 4, 115–126.
Keywords: large acceleration over 20 m/s2, nuclear power plant, non-stationary Fourier spectra, double-integrated displacement profile, collision between house and side soil, deterioration of surface soil, modulation of dominant frequency, isolated surface soil
Citation: Kamagata S and Takewaki I (2018) Various Occurrence Mechanisms of Large Acceleration over 20 m/s2 and Its Suitability in Design Use. Front. Built Environ. 4:3. doi: 10.3389/fbuil.2018.00003
Received: 29 August 2017; Accepted: 10 January 2018;
Published: 14 February 2018
Edited by:
Luigi Di Sarno, University of Sannio, ItalyReviewed by:
Elias G. Dimitrakopoulos, Hong Kong University of Science and Technology, Hong KongXinzheng Lu, Tsinghua University, China
Copyright: © 2018 Kamagata and Takewaki. This is an open-access article distributed under the terms of the Creative Commons Attribution License (CC BY). The use, distribution or reproduction in other forums is permitted, provided the original author(s) and the copyright owner are credited and that the original publication in this journal is cited, in accordance with accepted academic practice. No use, distribution or reproduction is permitted which does not comply with these terms.
*Correspondence: Izuru Takewaki, dGFrZXdha2lAYXJjaGkua3lvdG8tdS5hYy5qcA==