 Kohei Fujita
 Izuru Takewaki
- Department of Architecture and Architectural Engineering, Graduate School of Engineering, Kyoto University, Kyoto, Japan
A system identification problem is investigated for high-rise buildings to identify the story stiffnesses of a shear-bending model (SB model). In the previously proposed stiffness identification method due to the present authors, the shear and bending stiffnesses of the SB model were identified by means of the subspace and inverse-mode methods. The lowest mode of horizontal displacements and floor rotation angles of the objective building was identified first by using measured data of both horizontal and rotational accelerations via the subspace method. Taking into account the resolution in the measurement of floor rotation angles in lower stories, floor rotation angles in all stories were predicted from the floor rotation angle at the top floor. However, it was difficult to obtain the bending stiffnesses reliably in the previous method. In this paper, to overcome the difficulty in the stiffness identification method using the SB model, a statistical model-updating approach is proposed, where the probability distribution of floor rotation angles in the lowest mode is obtained for the identified SB model, and a conditional probability problem is applied by providing additional measured data on floor rotation angle. The proposed stiffness identification method is useful for the structural health monitoring of high-rise buildings. For investigation of the validity of the proposed stiffness identification method, a 10-story plane-building frame is examined under micro-tremor.
Introduction
The structural health monitoring (SHM) has a long history (Hart and Yao, 1977; Boller et al., 2009; Nagarajaiah and Basu, 2009; Takewaki et al., 2011). A variety of techniques are utilized in SHM and the methodologies of system identification (SI) play a central role in SHM. It is well acknowledged that the modal parameter technique and physical parameter technique are two major areas in SI. Much interest has been directed to the modal parameter technique (Hart and Yao, 1977; Agbabian et al., 1991; Nagarajaiah and Basu, 2009; Takewaki and Nakamura, 2010), which has a stable characteristic and can determine the overall mechanical properties of a structural system. On the other hand, the physical parameter technique has a different property that the physical parameters (e.g., stiffness, damping) can be found straightforwardly. From the viewpoint of damage detection, this is quite effective. Although the physical parameter technique is preferred in the reliable development of SHM, its research advancement is limited because of the strict requirement on measurements (multiple measurement points) or the necessity of complex manipulation (Hart and Yao, 1977; Udwadia et al., 1978; Shinozuka and Ghanem, 1995; Takewaki and Nakamura, 2000, 2005; Brownjohn, 2003; Nagarajaiah and Basu, 2009; Takewaki et al., 2011; Zhang and Johnson, 2013a,b; Johnson and Wojtkiewicz, 2014; Wojtkiewicz and Johnson, 2014; Fujita and Takewaki, 2016; Song et al., 2017; Takewaki et al., 2017).
In the physical parameter technique, a smart identification method was developed by Takewaki and Nakamura (2000). They devised a unique SI formulation based on the original work by Udwadia et al. (1978). Udwadia et al. (1978) identified the physical parameters (stiffness and damping coefficients) of a specific story in a shear-building model (S model) by using the directly related floor acceleration records, i.e., ones just above and below the target story. In their formulation, the so-called identification function consisting of the transfer function between the directly related floor acceleration records was introduced. In the approach developed by Takewaki and Nakamura (2000, 2005), a crucial issue resulting from the small signal/noise (SN) ratio in the low-frequency range exists when applying to actual micro-tremors. In addition, it should be noted that an S model is not necessarily an appropriate model for SI of tall buildings with large height:width ratios. This is because overall bending deformation influences greatly the accuracy of SI of such buildings. The former noise-bias problem has been a troublesome problem in the physical parameter technique because the noise affects the accuracy of the limit value evaluation of the transfer function at zero frequency. To overcome this difficulty, the Auto-Regressive with eXogenous (ARX) model with constraints on the ARX parameters has been introduced and developed by Maeda et al. (2011), Kuwabara et al. (2013), and Minami et al. (2013). By using the ARX model in the analysis of transfer functions, the difficulty has been avoided in the evaluation of limit value for a small SN ratio data. On the other hand, the latter modeling problem has been tackled by expanding the SI algorithm to the shear-bending model (SB model) (Fujita et al., 2013; Minami et al., 2013). The SB model is regarded as an effective model in the SI of tall buildings because the influence of overall bending deformation on the structural response, e.g., interstory drifts, can be evaluated appropriately in the SB model. In addition, comparing with the S model, the lower natural frequencies of the identified SB model correspond precisely to those of the objective building.
To develop a modal parameter and physical parameter hybrid method in SI, some investigators developed a natural and reliable method of SI in which the parameters of stiffness and damping are recovered from the modal parameters determined previously (Hjelmstad et al., 1995; Hjelmstad, 1996). In developing such SI method, it seems absolutely necessary to consider the relation between the modal parameters and the physical parameters. Furthermore, the sophisticated investigation on inverse problem is inevitable.
The present authors proposed a hybrid SI method for high-rise buildings, where both modal parameters and physical parameters of the SB model are identified simultaneously (Fujita et al., 2017). In this method, the shear stiffnesses and bending stiffnesses of the SB model were found by means of the subspace method for modal SI and the inverse-mode method for physical SI. The lowest mode of the building was obtained first by applying the subspace method to recorded data of horizontal displacements and floor rotation angles because the inverse-mode method can lead to the shear and bending stiffnesses of the SB model. By using the maximum amplitude of transfer function in the subspace method, the identification of lowest mode was performed. In addition, since the resolution issue exists in the measurement of floor rotation angles in lower stories, the floor rotation angles in all stories were guessed from the floor rotation angle at the top floor. This scenario was based on the non-simultaneous measurement system, where a few sensors are relocated repeatedly. An empirical estimation equation on floor rotation angle was proposed by investigating the lowest mode shape of floor rotation angles of various building models. However, since the distribution of the bending stiffnesses of practical building frames is strongly influenced by the difference of column sections in each story, the applicability of the empirical equation may be arguable from the practical viewpoint of SI.
In this paper, to identify the shear and bending stiffnesses of the SB model more accurately, a new SI method based on the statistical model-updating approach is presented, where the lowest mode shape of floor rotation angles is corrected by using additional measurement data. Compared with the previously proposed SI method, it is supposed that the floor rotational acceleration at the middle story can be used in the identification in addition to that at the top floor. By using the additional floor rotational response, it can be expected that the identified bending stiffnesses are corrected through a model-updating approach based on the statistical analysis. Similar studies on the statistical model-updating approach have been proposed, where the Bayesian’s method is applied to determine some identification parameters (Beck and Yuen, 2004; Saito and Beck, 2010). Compared with such studies, it is shown that the lowest mode shape of floor rotation angles is updated from the empirical formula in the proposed SI method by applying the conditional probability problem based on the additional measured floor rotation angles. For investigation of the validity of the proposed method of SI, a 10-story plane-building frame is examined under micro-tremor.
Stiffness Identification by Subspace and Inverse-Mode Methods in SB Model
A new stiffness identification method is presented in this section for an SB model. The method takes full advantage of the subspace and inverse-mode methods. In the previous works (Fujita et al., 2013; Minami et al., 2013) on the SI method using the SB model, only the horizontal accelerations were measured to recover both shear and bending stiffnesses. Because the measurable data were restricted in the previous identification method, it was required to incorporate some minimization algorithms of error in the adjustment of modal parameters, i.e., natural frequencies. This procedure caused some accuracy problems in the identification of bending stiffnesses. On the other hand, it is supposed that the floor rotational responses can be used for estimation of the lowest mode shape of rotational angle in this paper.
Inverse-Mode Method for SB Model
Consider an N-story SB model, as shown in Figure 1, consisting of the shear and rotational springs and having 2N degrees of freedom, i.e., N for horizontal responses and N for rotational responses. These springs are linked in series. Under the ground acceleration , the equations of motion can be described by
where M, C, and K are the mass, damping, and stiffness matrices of the SB model. The vector u(t) denotes a set of displacements consisting of N for horizontal responses and N for rotational responses
where uj(t) and θj(t) are the N-th story horizontal displacement and floor rotation angle of the SB model. In Eq. 1, r is the influence coefficient vector defined by {1, …, 1, 0, …, 0}.
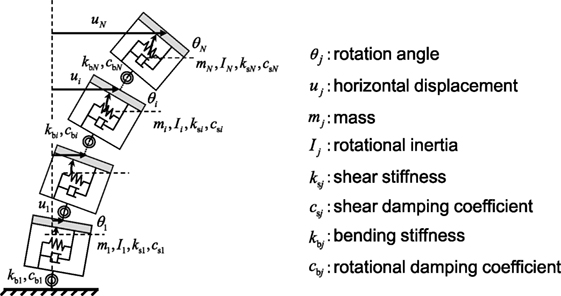
Figure 1. Shear-bending model.
Considering the undamped eigenvalue problem of the SB model, the shear and bending stiffnesses ks = {ks1, ks2,…,ksN}, kb = {kb1, kb2, …, kbN} of the SB model can be directly derived by the lowest mode shapes U = {U1, U2, …, UN, Θ1, Θ1, …, ΘN}T of both horizontal displacements and floor rotation angles. In the proposed stiffness identification method, U can be obtained by the subspace method explained in the next section. Figure 2 illustrates the scheme of the identification of the shear and bending stiffnesses using the lowest mode shape. As seen in Figure 2, sj and ϕj are the interstory shear deformation and the inter-floor rotation angle. In addition, mj, Ij, and Hj are the floor mass, the floor rotational inertia, and the story height of the j-th story, respectively. Let ω1 denote the fundamental natural circular frequency of the mode. In this paper, we call the following formulation as the inverse-mode method. In the inverse-mode method, ks and kb can be determined by
where
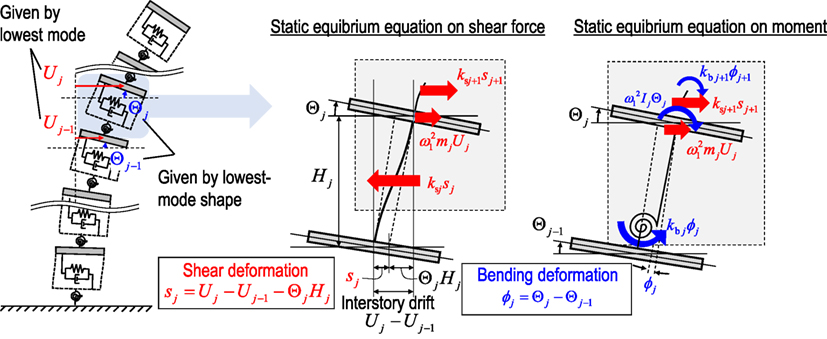
Figure 2. Scheme of inverse-mode method for shear-bending model.
Evaluation of Transfer Function via Subspace Method
To identify the shear and bending stiffnesses of the SB model via the inverse-mode method, the lowest mode components of the SB model are required, i.e., horizontal displacements and rotation angles. The method of estimation of the lowest mode shape is presented for the SB model in this section by using the subspace method.
First of all, the subspace method is explained briefly (Katayama, 2005). This method can provide a sequence of the state vector in the state space described for each step k = 1, 2, …, Nd as
where w(k), y(k), x(k), and Nd are the input, output, state vectors, and data length, respectively. Furthermore, A, B, C, and D denote the matrices including the unknown system parameters which can be derived by the least-squares estimation using the N4SID method in the framework of the subspace method. The transfer function G(z) between y(k) and w(k) can be given by using A, B, C, and D as
where and T0 is the sampling rate. In this paper, the observed micro-tremor at the first story is used as the input vector w(t) and measured floor accelerations and floor rotation angles are used as the output vector y(k) as
It is noted that the function of time is expressed here as the function of step.
For the practical limitation of measurement systems, e.g., velocity sensors for micro-tremor measurement and recorders, the SI using the non-simultaneous measurement is investigated in this paper, where the horizontal and rotational accelerations at each story are measured independently by shifting the location of sensors. In the non-simultaneous measurement system, it was shown that the top floor horizontal acceleration is absolutely necessary to obtain the transfer function stably in the subspace method. This may result from the fact that the amplitude of the transfer function at the i-th floor can change because utilized micro-tremors may be different in the non-simultaneous measurement system. Therefore, the input and output vectors in the case of the non-simultaneous measurement are given by
where denotes the observed micro-tremor and the superscript (i) denotes the non-simultaneous measurement index.
The lowest mode horizontal displacements and rotational angles can be determined by the ratio of the amplitudes of transfer function at the fundamental natural frequency. The fundamental natural circular frequency ω1 can be obtained as the frequency that maximizes the top floor horizontal amplitude of transfer function. The lowest mode shape of horizontal displacements and floor rotation angles in the non-simultaneous measurement can be evaluated as
where the subscript on G denotes the objective measured data of the transfer function. Figure 3 shows the essence of the lowest mode identification in the non-simultaneous measurement system. More detailed explanation on identification of the lowest mode in the simultaneous and non-simultaneous scenarios can be found in the study by Fujita et al. (2017).
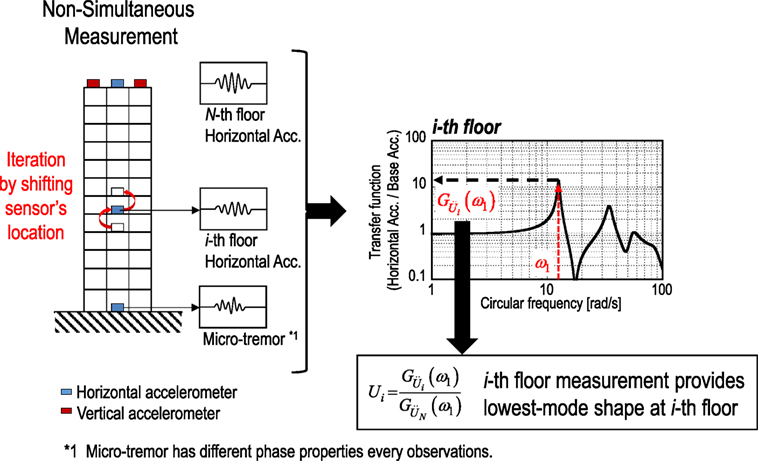
Figure 3. Essential schematic diagram of lowest mode identification in non-simultaneous measurement system.
Statistical Model-Updating Approach for Stiffness Identification
Because the reliable measurement of vertical accelerations on the slab at lower stories is difficult resulting from the problem of low S/N ratio and resolution, let us consider the limitation of available measurement data of floor rotation angles. Fujita et al. (2017) proposed an empirical equation on the lowest mode shape of floor rotation angles derived from various building frame investigations. For simplicity, let Θ = {Θ1, Θ2, …, ΘN} denote the lowest mode shape of floor rotation angles. In the non-simultaneous measurement scenario, it was supposed that ΘN can be obtained from the top floor record, and the remaining components in Θ were evaluated by applying the empirical equation on floor rotation angle, i.e., Θj = Θj+1 − 0.004Θj+1(N − j)2 for a 10-story model (see Fujita et al., 2017). However, the identified bending stiffnesses of the SB model based on the empirical equation on Θ may include estimation errors compared with the reference values of the objective building frame.
In this paper, to identify the bending stiffnesses more accurately, the statistical model-updating approach is proposed, where the probability density function p(Θi) of the lowest mode shape of floor rotation angles is evaluated by using the Monte Carlo simulation for the varied set of the previously identified shear and bending stiffnesses. Let us suppose that the shear and bending stiffnesses , of the identified SB model follow the normal distribution as
where (μ, σ2) denotes the normal distribution with the mean value μ and variance σ2. In the Monte Carlo simulation, is calculated for the normally distributed shear and bending stiffnesses , of the SB model. Finally, p(Θi) can be obtained. It is noted that the mean values μΘi and variances are different at each floor. If we assume that pi(Θi) can be regarded as a normal distribution, pi(Θi) is described at each floor as
To present the statistical model-updating approach, let us suppose that it is possible to make additional measurement of floor rotation angles at a specified floor iA except the top floor. Let denote the measured floor rotation angle at floor iA in the lowest mode. By applying the obtained additional measurement data at iA-th floor to the simulation-based probability distribution , the probability distributions of Θ at all degrees of freedom can be updated from the viewpoint of the conditional probability problem as
where denotes the updated probability of the i-th floor rotation angle for the given situation (ΔL and ΔU denote the specified small values). ΔL and ΔU are necessary so that the previously measured is included in the updated probability distribution at the top floor. Since the number of simulations is limited, the non-zero region of is finite.
It is necessary to determine the modified lowest mode shape of floor rotation angles at all degrees of freedom corresponding to the updated probability distribution for the stiffness identification. Since the rotational angles at the top and additional floors can be measured, the linear interpolation is proposed by using the cumulative distribution function (CDF). CDFs can be described by using the probability
The linear interpolation for CDFs at all stories can be determined by referring to the available measured amplitudes and of lowest mode shape. Finally, can be determined as
where denotes the inverse function of y = FΘi(x). The argument of the inverse function of FΘi(x) is given by the value of the linear interpolation equation L(i) at i-th floor described as
Figure 4 shows the schematic diagram to explain the linear interpolation based on the updated CDF FΘi. The overall flowchart of the proposed stiffness identification method in the non-simultaneous measurement scenario is summarized in Figure 5.
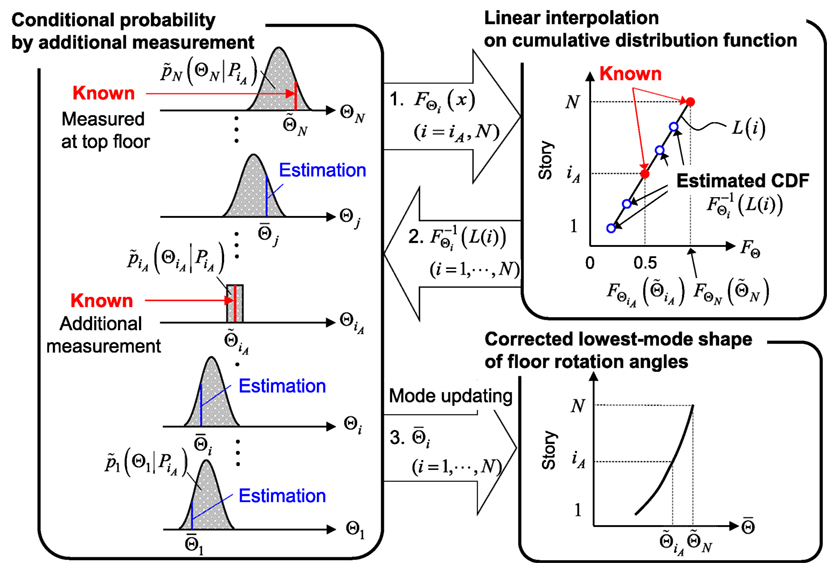
Figure 4. Estimation of floor rotation angles in lowest mode by linear interpolation on cumulative distribution function (CDF).
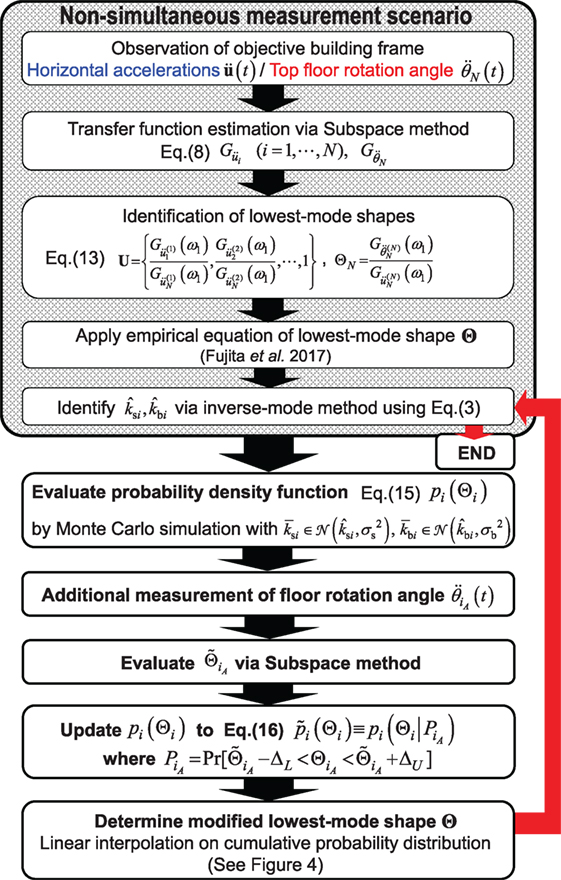
Figure 5. Flowchart of stiffness identification in simultaneous measurement scenario.
Numerical Examples
A 10-story plane-building frame is taken as a simple example. The story heights, story masses, and rotary inertias are constant through all stories and specified as 4.0 m, 1.2 × 10⁵ kg, and 1.62 × 10⁶ kgm2, respectively. The number of spans is four and the length of span is 3.0 m. Figure 6 shows the objective building frame. Table 1 shows the member section list. The output time-history data for the micro-tremor base input, i.e., horizontal and vertical accelerations at the corner column nodes, are obtained by using the response analysis software, SNAP [see software detail at http://www.kozo.co.jp/program/kozo/snap/index.html (in Japanese)]. In this paper, the floor rotation angles are evaluated by dividing the difference of the vertical accelerations at the corner columns by the width of the objective building frame. Because the amplitudes of floor vertical accelerations, especially in lower stories, are relatively small and the measurement noise can be involved easily, the reliable and exact measurement of floor rotation angles may be difficult. In the non-simultaneous measurement scenario, the shear and bending stiffnesses are evaluated first by substituting the empirically derived floor rotation angles in lowest mode to the inverse-mode method.
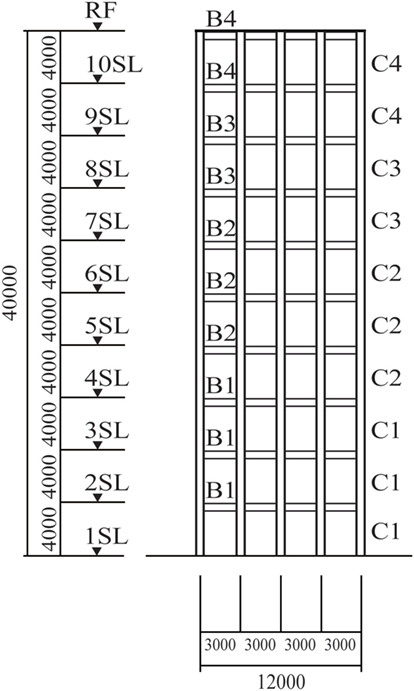
Figure 6. 10-story building frame.

Table 1. Member cross sections.
Figure 7 shows an example of the recorded time history and the acceleration response spectrum of a micro-tremor, which is used as the base input. These micro-tremors data were obtained at Disaster Prevention Research Institute of Kyoto University, Japan (Fujita et al., 2015). In following numerical examples, the band-limited white noise is added to the output data as the measurement noise, i.e., horizontal and rotational accelerations, independently at each story. The amplitude of the noise is determined so as to adjust the root-mean-square (RMS) of noise to 5 or 10% of the RMS of the horizontal and rotational response at the first story, respectively.
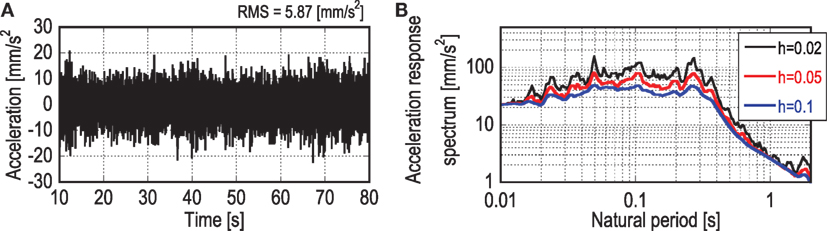
Figure 7. Micro-tremor: (A) time history and (B) acceleration response spectrum.
To verify the validity and stability of the formulation of the proposed stiffness identification, 10 different micro-tremor records are examined. The influence of the measurement noise is taken into account, where the horizontal and rotational response at each story includes 0, 5, and 10% noises. Figure 8 shows the comparison of mean value of the identified shear and bending stiffnesses in the simultaneous measurement system with the reference values. The reference shear and bending stiffnesses can be derived from the static analysis result of the object-building frame. Table 2 shows the comparison of mean and SD of the error ratio of identified stiffnesses. As seen in Figure 8, the shear and bending stiffnesses can be identified reliably since the lowest mode shape can be derived stably by using all degrees of freedom. From Table 2, it can be observed that the SD of error ratios increases with increasing noise level. This means that the stability in the stiffness identification is influenced by the measurement noise. Although the noise may affect the stability of identification, the mean values of error ratios of identified stiffnesses considering the noise are almost the same compared with those without noise.
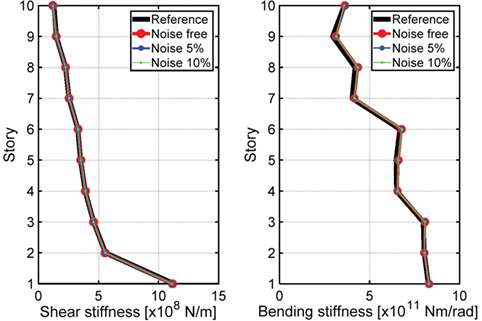
Figure 8. Identified shear and bending stiffnesses in simultaneous measurement system.
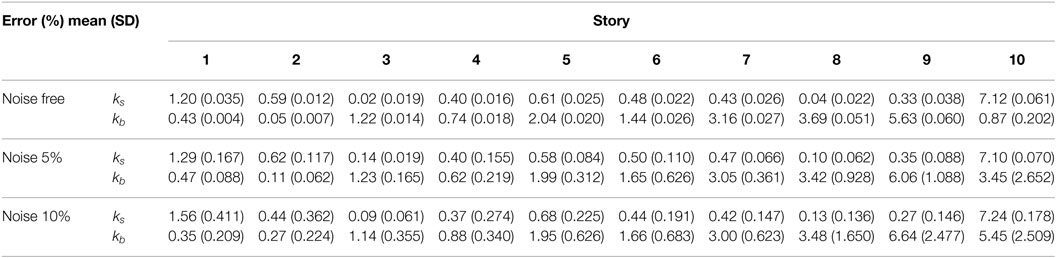
Table 2. Mean and SD of error ratio of identified stiffnesses in simultaneous measurement (10 times investigation using different micro-tremors).
Compared with the result by the simultaneous measurement system, it is needed to estimate the lowest mode shape of floor rotation angles in the non-simultaneous measurement system. Figure 9 shows the comparison of mean value of identified stiffnesses based on the previously proposed SI method. Table 3 presents the mean and SD of the error ratio of identified stiffnesses in non-simultaneous measurement system. The obtained bending stiffnesses in the non-simultaneous measurement are slightly different from the reference values even in the case without noise. This may be caused by the estimation error in the lowest mode rotation angles based on the empirical equation.
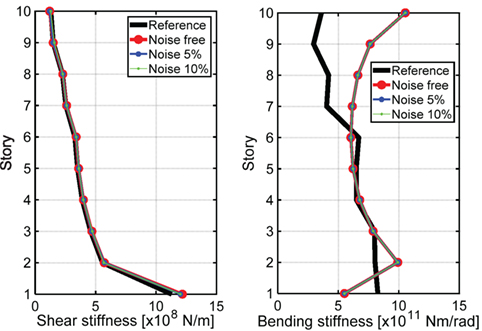
Figure 9. Identified shear and bending stiffnesses in non-simultaneous measurement using empirical equation.
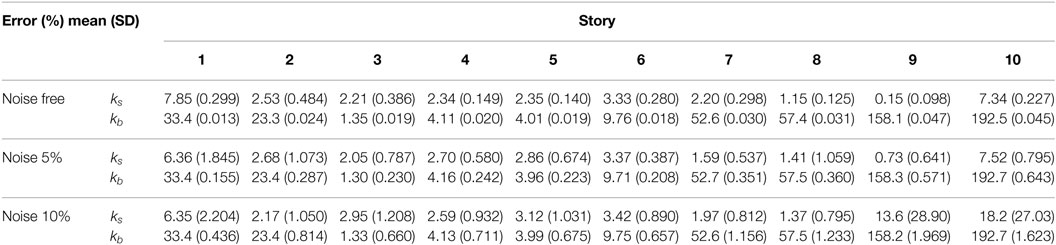
Table 3. Mean and SD of error ratio of identified stiffnesses in non-simultaneous measurement using empirical equation (10 times investigation using different micro-tremors).
The statistical model-updating approach is applied to modify the identification accuracy from the previously identified SB model. The variances and in Eq. 14 are the same for all stories and given by 0.10 and 0.20, respectively. Some figures are shown to present the statistical model-updating approach by using the boxplot. For clearly understating the result of figures, Figure 10 shows the relationship between the CDF in Eq. 17 and the boxplot. As seen in Figure 10, the box plot is useful to show the statistical quantities, e.g., median, quartile, and outliers.
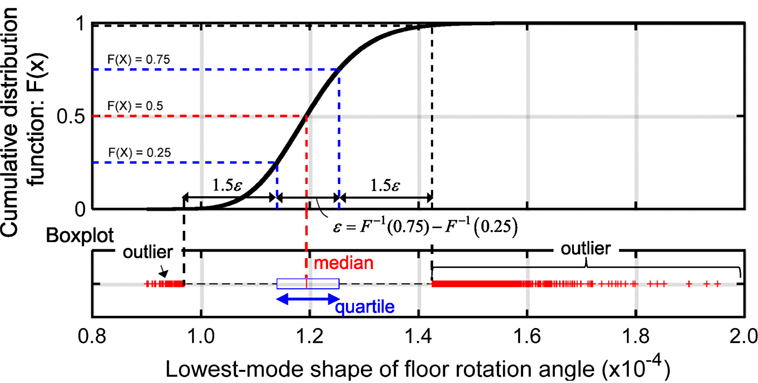
Figure 10. Relationship between cumulative distribution function and boxplot.
Figure 11 shows the boxplot of the obtained lowest mode shape of floor rotation angles in the Monte Carlo simulation based on the previously identified SB model shown in Figure 9. The number of samples is 105. In this figure, the red vertical lines denote the median of the probability distribution of floor rotation angle at each floor in the lowest mode shape, and the red cross markers are shown as the outlier. In addition, the black and white circle markers are added to compare with the reference lowest mode shape of the objective building frame and previously measured at the top floor, respectively. Since the mean values of and in Eq. 14 are determined in the previously identified SB model in the non-simultaneous measurement, these probability distributions of floor rotation angles in the lowest mode are influenced by the empirical equation.
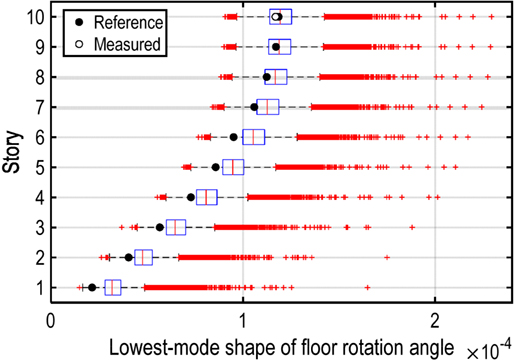
Figure 11. Boxplot of floor rotation angle in lowest mode.
To identify the bending stiffness of the SB model more accurately, we suppose that additional measured data of the floor rotation angles, e.g., θ(t) at fifth story, can be available. By applying the obtained data to the subspace method again, the floor rotation angle at the measured story in the lowest mode can be used in the identification. The probability distribution of floor rotation angles in the lowest mode can be updated as shown in Figure 12. The time-history record of floor rotation angle at the fifth story is used for conditioning of the probability distributions derived in Figure 11. For updating the probability distributions, the probability distribution at the fifth story is conditioned so as to adjust the median of itself in accordance with the observed floor rotation angles in the lowest mode. The number of samples of the updated probability distribution is given as 103, i.e., 1% of the previously obtained probability distribution. In this case, ΔL and ΔU are determined as 1.86 × 10⁻⁷, 1.93 × 10⁻⁷, i.e., the ratios of those small values to correspond to 0.22 and 0.23%, respectively. Although this selection of dataset in Θ5 related to the conditional probability depends on ΔL and ΔU, it has been observed that the corrected lowest mode shape of floor rotation angles and the corrected bending stiffnesses can be obtained stably for varied set of ΔL and ΔU.

Figure 12. Conditioning of probability distribution based on additional measurement data.
As seen in the updated probability distribution at the top floor, the previously measured floor rotation angles in the lowest mode are not located at the median of the updated probability distribution. Therefore, the floor rotation angles in the lowest mode are estimated by the linear interpolation of the probability in the CDF. Figure 13 shows the determination of the floor rotation angles in the lowest mode using the liner interpolation. In this case, the coefficients of linear interpolation can be derived by the cumulative probability of measured floor rotation angles at the fifth and top floors in the lowest mode. By applying the corrected floor rotation angles in the lowest mode to the inverse-mode method, the bending stiffnesses can be updated as shown in Figure 14. It can be observed that the distribution in upper stories has been updated significantly. This indicates the effectiveness of the proposed statistical model-updating approach.
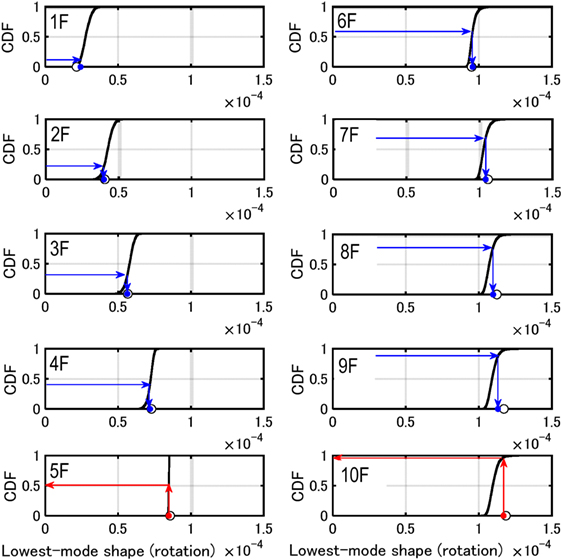
Figure 13. Determination of floor rotation angles in lowest mode based on linear interpolation of probability in cumulative distribution function (CDF).
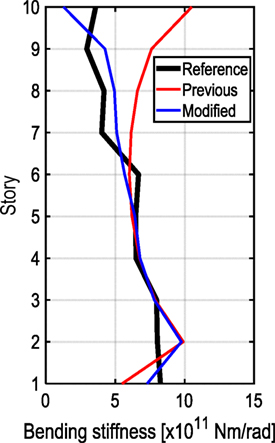
Figure 14. Comparison of identified bending stiffnesses based on empirical formula with modified bending stiffness using probability distribution simulation-based method.
Since the shear and bending stiffnesses of the SB model representing the objective high-rise building can be obtained reliably in the proposed method as shown in Figure 14, the structural engineer can estimate the structural responses more accurately for other earthquake ground motions. Furthermore, from the viewpoint of the SHM, it may be possible to find structural damages from the change of identified stiffnesses using the SB model. Applicability of the proposed stiffness identification method to the problem of SHM will be studied in the future.
In the numerical example in this paper, since the steel building frame has been investigated to identify the shear and bending stiffnesses, the limitations of the proposed stiffness identification method, e.g., applicability to other building types (wood, reinforced concrete, etc.), is needed to be discussed in more detail.
Conclusion
This paper proposed an identification method of stiffness using an SB model for tall buildings with a relatively large aspect ratio based on a statistical model-updating approach. The subspace method was applied first to identify the lowest mode, i.e., horizontal displacements and floor rotation angles. In the non-simultaneous measurement scenario for simplification of measurement, only the rotational response at the top floor is supposed to be measurable. For identifying the shear and bending stiffnesses accurately, it is needed to identify the lowest mode shape within certain accuracy. By using the obtained lowest mode, the shear and bending stiffnesses of the SB model were determined by taking advantage of the inverse-mode method. Although an empirical equation has been proposed to estimate the lowest mode of floor rotation angles in the non-simultaneous measurement system, the accuracy of the identified bending stiffnesses is not sufficient when compared with the shear stiffnesses.
It has been demonstrated that the correction of the lowest mode shape of floor rotation angles is possible through a newly proposed statistical model-updating approach. In the proposed SI method, we supposed that additional measurement data on the floor rotation angle are available. Taking into account the conditional probability problem using the additionally obtained lowest mode shape of floor rotation angles, the probability distribution of floor rotation angles can be updated. A method of linear interpolation of the CDF was developed to determine the lowest mode shape of floor rotation angles from the updated probability distribution. As a verification of the proposed method, numerical simulations were conducted for a 10-story plane-building frame. It has been confirmed that the proposed identification method possesses an allowable accuracy even in the non-simultaneous measurement scenario.
The proposed stiffness identification method using the statistical model-updating approach has been presented under the additional floor rotational measurement data at the middle story. As shown in the numerical demonstration, although the bending stiffnesses can be reliably corrected by using the additional rotational acceleration at the fifth story, it is desirable to suggest the number of iterations for selection of additional floor rotational measurement and the location of such additional measurement. This subject may depend on the building properties influencing the lowest mode shape of floor rotation angle. The applicability of the proposed stiffness identification method to various building types should be discussed in the future.
Author Contributions
KF formulated the problem, conducted the computation, and wrote the paper. IT supervised the research and wrote the paper.
Conflict of Interest Statement
The authors declare that the research was conducted in the absence of any commercial or financial relationships that could be construed as a potential conflict of interest.
Funding
Part of the present work is supported by the Grant-in-Aid for Scientific Research (KAKENHI) of Japan Society for the Promotion of Science (No. 16K18184, 15H04079, 17J00407).
References
Agbabian, M. S., Masri, S. F., Miller, R. K., and Caughey, T. K. (1991). System identification approach to detection of structural changes. J. Eng. Mech. 117, 370–390. doi: 10.1061/(ASCE)0733-9399(1991)117:2(370)
Beck, J. L., and Yuen, K. V. (2004). Model selection using response measurements: Bayesian probabilistic approach. J. Eng. Mech. 30, 192–203. doi:10.1061/(ASCE)0733-9399(2004)130:2(192)
Boller, C., Chang, F.-K., and Fujino, Y. (eds) (2009). Encyclopedia of Structural Control and Health Monitoring, Vol. 1–5. Chichester, UK: Wiley.
Brownjohn, J. M. W. (2003). Ambient vibration studies for system identification of tall building. Earth Eng. Struct. Dyn. 32, 71–95. doi:10.1002/eqe.215
Fujita, K., Fujimori, Y., and Takewaki, I. (2017). Modal-physical hybrid system identification of high-rise building via subspace and inverse-mode methods. Front. Built Environ. 3:51. doi:10.3389/fbuil.2017.00051
Fujita, K., Ikeda, A., Shirono, M., and Takewaki, I. (2013). “System identification of high-rise buildings using shear-bending model and ARX model: experimental investigation,” in Proceedings of the ICEAS13 in ASEM13; Sep 8–12 (Jeju, Korea), 2803–2815.
Fujita, K., Ikeda, A., and Takewaki, I. (2015). Application of story-wise shear building identification method to actual ambient vibration. Front. Built Environ. 1:2. doi:10.3389/fbuil.2015.00002
Fujita, K., and Takewaki, I. (2016). Advanced system identification for high-rise building using shear-bending model. Front. Built Environ. 2:29. doi:10.3389/fbuil.2016.00029
Hart, G. C., and Yao, J. T. P. (1977). System identification in structural dynamics. J. Eng. Mech. Div. 103, 1089–1104.
Hjelmstad, K. D. (1996). On the uniqueness of modal parameter estimation. J. Sound Vib. 192, 581–598. doi:10.1006/jsvi.1996.0205
Hjelmstad, K. D., Banan, Mo. R., and Banan, Ma. R. (1995). On building finite element models of structures from modal response. Earth Eng. Struct. Dyn. 24, 53–67. doi:10.1002/eqe.4290240105
Johnson, E., and Wojtkiewicz, S. (2014). Efficient sensitivity analysis of structures with local modifications. II: transfer functions and spectral densities. J. Eng. Mech. 140. doi:10.1061/(ASCE)EM.1943-7889.0000769
Kuwabara, M., Yoshitomi, S., and Takewaki, I. (2013). A new approach to system identification and damage detection of high-rise buildings. Struct. Control Health Monit. 20, 703–727. doi:10.1002/stc.1486
Maeda, T., Yoshitomi, S., and Takewaki, I. (2011). Stiffness-damping identification of buildings using limited earthquake records and ARX model. J. Struct. Constr. Eng. 666, 1415–1423. (in Japanese). doi:10.3130/aijs.76.1415
Minami, Y., Yoshitomi, S., and Takewaki, I. (2013). System identification of super high-rise buildings using limited vibration data during the 2011 Tohoku (Japan) earthquake. Struct. Control Health Monit. 20, 1317–1338. doi:10.1002/stc.1537
Nagarajaiah, S., and Basu, B. (2009). Output only modal identification and structural damage detection using time frequency & wavelet techniques. Earth. Eng. Eng. Vib. 8, 583–605. doi:10.1007/s11803-009-9120-6
Saito, T., and Beck, J. L. (2010). Bayesian model selection for ARX models and its application to structural health monitoring. Earth. Eng. Struct. Dyn. 39, 1737–1759. doi:10.1002/eqe.1006
Shinozuka, M., and Ghanem, R. (1995). Structural-system identification II: experimental verification. J. Eng. Mech. 121, 265–273. doi:10.1061/(ASCE)0733-9399(1995)121:2(265)
Song, M., Yousefinanmoghadam, S., Mohammadi, M. E., Moaveni, B., Stravridis, A., and Wood, R. L. (2017). An application of finite element model updating for damage assessment of a two-story reinforced concrete building and comparison with lidar. Struct. Health Monit. 1–22. doi:10.1177/1475921717737970
Takewaki, I., Fujimori, Y., and Fujita, K. (2017). “Stiffness identification of high-rise buildings via subspace and inverse-mode methods,” in Proceedings of the 11th International Workshop on Structural Health Monitoring (IWSHM 2017); Sep 12–14 (USA: Stanford University), 291–298.
Takewaki, I., and Nakamura, M. (2000). Stiffness-damping simultaneous identification using limited earthquake records. Earth. Eng. Struct. Dyn. 29, 1219–1238. doi:10.1002/1096-9845(200008)29:8<1219::AID-EQE968>3.0.CO;2-X
Takewaki, I., and Nakamura, M. (2005). Stiffness-damping simultaneous identification under limited observation. J. Eng. Mech. 131, 1027–1035. doi:10.1061/(ASCE)0733-9399(2005)131:10(1027)
Takewaki, I., and Nakamura, M. (2010). Temporal variation of modal properties of a base-isolated building during an earthquake. J. Zhejiang Univ. Sci. A 11, 1–8. doi:10.1631/jzus.A0900462
Takewaki, I., Nakamura, M., and Yoshitomi, S. (2011). System Identification for Structural Health Monitoring. UK: WIT Press.
Udwadia, F. E., Sharma, D. K., and Shah, P. C. (1978). Uniqueness of damping and stiffness distributions in the identification of soil and structural systems. J. Appl. Mech. 45, 181–187. doi:10.1115/1.3424224
Wojtkiewicz, S., and Johnson, E. (2014). Efficient sensitivity analysis of structures with local modifications. I: time domain responses. J. Eng. Mech. 140. doi:10.1061/(ASCE)EM.1943-7889.0000768
Zhang, D., and Johnson, E. (2013a). Substructure identification for shear structures I: substructure identification method. Struct. Control Health Monit 20, 804–820. doi:10.1002/stc.1497
Keywords: system identification, stiffness identification, model-updating, shear-bending model, high-rise building
Citation: Fujita K and Takewaki I (2018) Stiffness Identification of High-Rise Buildings Based on Statistical Model-Updating Approach. Front. Built Environ. 4:9. doi: 10.3389/fbuil.2018.00009
Received: 05 December 2017; Accepted: 02 February 2018;
Published: 26 February 2018
Edited by:
Solomon Tesfamariam, University of British Columbia, CanadaReviewed by:
Hossein Mostafaei, FM Global, United StatesEmanuele Brunesi, European Centre for Training and Research in Earthquake Engineering, Italy
Copyright: © 2018 Fujita and Takewaki. This is an open-access article distributed under the terms of the Creative Commons Attribution License (CC BY). The use, distribution or reproduction in other forums is permitted, provided the original author(s) and the copyright owner are credited and that the original publication in this journal is cited, in accordance with accepted academic practice. No use, distribution or reproduction is permitted which does not comply with these terms.
*Correspondence: Izuru Takewaki, dGFrZXdha2lAYXJjaGkua3lvdG8tdS5hYy5qcA==