 Yan Zhang
 Luc E. Chouinard
 David Conciatori
- 1Department of Civil Engineering and Applied Mechanics, McGill University, Montreal, QC, Canada
- 2Département de Génie Civil et de L’environnement, Université Laval, Québec City, QC, Canada
Over the last decade, there has been an increasing interest in models for the evaluation and prediction of the condition of bridges in Canada due to their large number in an advanced state of deterioration. The models are used to develop optimal maintenance and replacement strategies to extend service life and optimally allocate financial and technical resources. The main process of deterioration of concrete bridges in Canada is corrosion of the reinforcing steel due to the widespread use of de-icing salts. In this article, numerical models of the diffusion process and chemical reactions of chloride ions in concrete are used to estimate the time to initiation of corrosion and for the progression of corrosion. The analyses are performed for a range of typical concrete properties, exposure and climatic conditions. The results from these simulations are used to develop parametric surrogate Markov chain models of increasing states of deterioration. The surrogate models are more efficient than physical models for the portfolio analysis of a large number of structures. The procedure provides an alternative to Markov models derived from condition ratings when historical inspection data is limited.
Introduction
Reinforced concrete bridges are critical elements of the transportation network in Canada. Many of these bridges are reaching the end of their service life and showing advanced stages of deterioration. Due to the large number of structures requiring repairs or replacement, a rational procedure is needed to prioritize interventions and optimally allocate financial and technical resources. The main process of deterioration for concrete bridges in Canada is due to the use of de-icing salts to maintain bare pavement conditions during winter (NACE, 2012). Several physical models are available to predict the ingress of chloride ions in concrete. The simplest models are based on the diffusion equation (Crank and Gupta, 1975), while more advanced models can account for other ion transport mechanisms, types of exposure, climatic conditions (Conciatori et al., 2009, 2010), and chemical reactions (Samson and Marchand, 2007). Most models are developed for undamaged concrete elements; however, corrosion induced cracking of the concrete can greatly accelerate the deterioration process once corrosion has progressed (Jefremczuk, 2005).
The model used in this application is Transchlor® (Conciatori et al., 2010), which uses hourly climate data (precipitation, temperature, relative humidity, solar radiation) to replicate the application of de-icing salts within a given climatic region. The model also differentiates between the types of exposure (direct, splash, or mist) for different bridge elements. However, the one-dimensional finite element program is computer intensive, which limits its application in practice to a limited number of cases.
When data from inspections and condition assessments are available, statistical models for the evolution of condition states can be used as an alternative to physical models. Markov chain models have been used extensively for predicting conditions states (Jiang and Sinha, 1989; Cesare et al., 1992; Thomas and Sobanjo, 2016). The transition probabilities for these models are usually estimated using statistics from inspection data but have also been derived from simulations with physical models that are correlated to condition states (O’Connor et al., 2011).
The transition probabilities can be parametrized as a function of physical characteristics of the concrete or of the climatic region. The latter approach is proposed in this work to derive parametrized transition probabilities for specified geographical regions as a function of concrete properties. For this purpose, a multinomial logit model is used for the transition probabilities as a function of diffusion properties of concrete for specific climatic and exposure conditions. The model is applied and demonstrated for bridges located in the Montreal area.
Bridge Deterioration Modeling
Decisions on the maintenance, rehabilitation, or replacement of bridges are based on evaluations of current condition and predicted residual life. Current condition is evaluated qualitatively from inspection reports and rating procedures and quantitatively using standards that account, among others, for the level of investigations performed for a specific structure (CSA, 2014). Similarly, future conditions can be qualitatively extrapolated from current conditions when historical data from inspections and condition ratings is sufficient to develop empirical prediction models or quantitatively by using numerical models of deterioration. In the latter case, predictions may be tainted by large uncertainties on the model, the history of exposure, and material properties, which must be accounted for in the development of maintenance and rehabilitation strategies (Estes and Frangopol, 2005).
Discrete Markov chain models are usually derived for a small number (3–4) of condition states. Four types of models are most often used for this purpose: (1) physical models to determine the time to the initiation of corrosion, (2) regression models, (3) duration models, and (4) artificial intelligence (AI) prediction models.
Regression models are the most commonly used by agencies for modeling asset performance. Adaptive methods and latent variables can be employed to gradually forecast condition as a function of previous performance and features as well (Washington et al., 2010a). If inspection data on bridge condition are not available, a duration model can be used to determine the residual life defined as the period of time remaining before the threshold of lowest admissible performance is reached (Caner et al., 2008). Duration (also survival or reliability) analysis is a probabilistic method to predict the time to failure of a structure and is commonly used for mechanical and electrical components (Yang, 2007). Duration models may be parametric, semi-parametric, or non-parametric (Washington et al., 2010b). AI refers to computer techniques for automating decisions based on a set of inputs. AI techniques include genetic algorithm (GA), expert systems, case-based reasoning, and artificial neural networks (ANN). Sobanjo (1997) uses ANN for modeling bridge deterioration. A multilayer ANN is used to relate the condition of the bridge superstructure to the number of years of service of the bridge and other relevant inputs. Tokdemir et al. (2000) use ANN to forecast the bridge condition as a function of bridge geometry, level of traffic, years in service, and structural attributes as explanatory variables.
The development of deterioration functions for bridge is most often accomplished with discrete Markov chains. The Markov chain is defined for a sequence of condition states starting with a new structure and ending with a failed or obsolete structure (Micevski et al., 2002). The condition states can be defined on either a qualitative or quantitative scale. The Markov chain is a memoryless process since the probability of transition probabilities from one state to the next is only a function of the current state (Morcous, 2006). The Markov chain is completely characterized by the transition probabilities and the initial probabilities for each state. The transition probabilities are typically defined for a standard step or time interval of 1 year corresponding to the interval between inspections. The transition probabilities can be parametrized as a function of material properties, degree of exposure, and even number of years of service. The probabilities can be displayed on a directed graph [Figure 1 or in a matrix (Table 1)] (Jiang and Sinha, 1989).
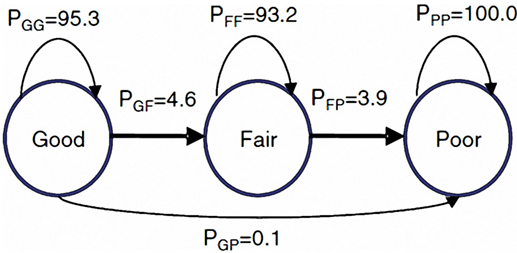
Figure 1. Example Markov chain graph with three states.
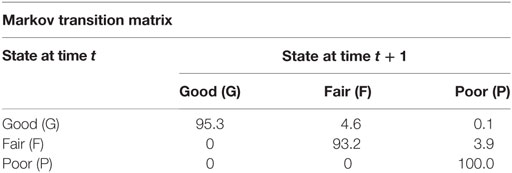
Table 1. Example of Markov chain transition matrix.
Modeling of Chloride Ions Transport
In probabilistic service life prediction for reinforced concrete structures, modeling the time to initiation of corrosion is the most critical parameter (Shafei and Alipour, 2015). The time to initiation of corrosion corresponds to the time required for the chloride ion content (e.g., % of Cl− per unit weight of cement) to reach a critical level (Ccrit). Reported values for the critical level vary greatly due to differences in the definition of initiation, the type of reinforcement, and the stochastic nature of corrosion. In some cases, the critical value corresponds to the depassivation of the protective layer at the surface of the reinforcing steel while from a practical engineering point of view it is identified as the level when the degree of deterioration of the concrete becomes unacceptable which is highly subjective (Deb, 2012).
The surrogate Markov model is derived by defining a set of discrete states for the chloride ion concentration at the depth of the reinforcement from the concrete surface. Historical climatic data are used to model the time series for the chloride content and uncertainties associated with transport properties are addressed by performing a set of analyses for optimally selected values from the probability distribution functions of the transport and diffusion parameters using the Rosenblueth point estimation procedure (Rosenblueth, 1975; Conciatori et al., 2009; Wolofsky, 2011). The simulation is used to generate a large sample of state transitions for estimating the transition probabilities. In this application, only direct exposure is considered since the analysis is performed only for the concrete deck. Hourly climate data was obtained for a period starting at the beginning of the service life (1965) of a typical older bridge in Montreal until present (Figure 2).
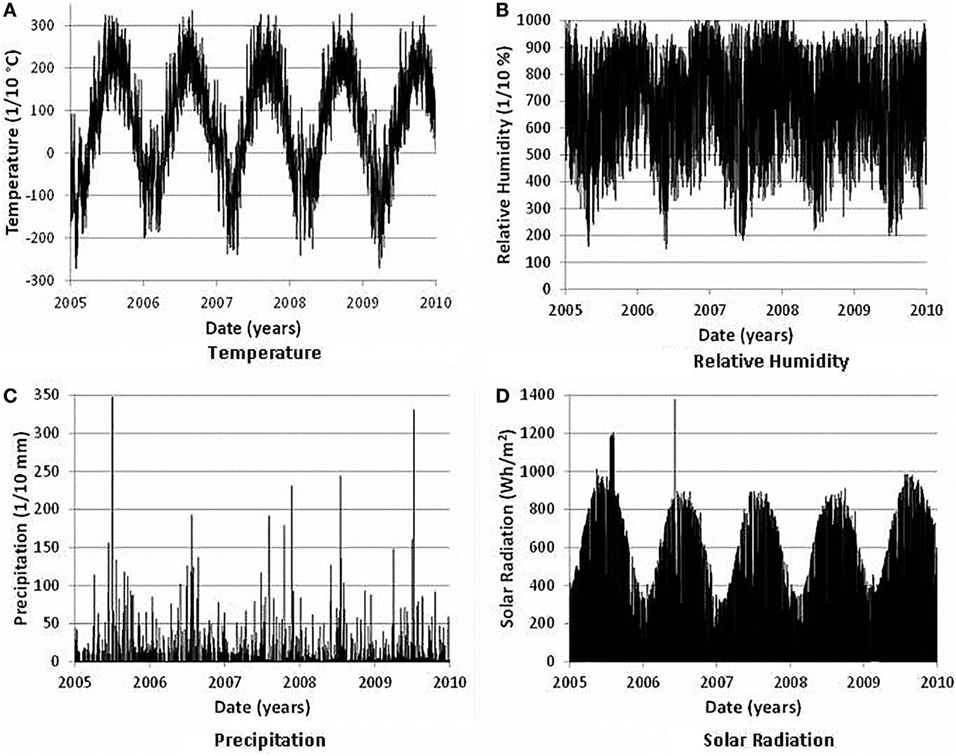
Figure 2. Sample of climate data for Montreal (A) temperature; (B) relative humidity; (C) precipitation; (D) SOLAR radiation.
The TransChlor® model includes the effects of two primary chemical reactions: carbonation and adsorption of chloride ions by the cement paste. The model is implemented through a 1-dimensional linear finite element model for the transport of chlorides in space and a finite difference model in time. The transport modules include thermal and vapor transfers, liquid water transport with and without chloride ions, capillary suction, chloride ion diffusion in water, and carbon dioxide diffusion in concrete (Conciatori et al., 2010; Wolofsky et al., 2015). Calculations are performed at intervals of 1 h which provide the adequate level of resolution for the simulation of temperature profiles, precipitation history, and wetting/drying cycles (Conciatori et al., 2008, 2010). Computing time for 45 years exposure period is in the order of 2–24 h depending on the performance of the computer.
Experimental Design
TransChlor® allows a probabilistic analysis for up to four concrete properties to account for uncertainties on material properties. The four concrete properties are as follows: (1) the water vapor transport diffusion parameter (DHR), (2) the liquid water capillary suction parameter (DCAP), (3) the chloride ion transport diffusion parameter (DCL), and (4) the carbonation parameter . The four concrete properties are assumed to be mutually independent random variables that are fully characterized by their mean and variance. The two-point Rosenblueth method for calculating moments of a random variable is used to propagate uncertainty in the transport model and to estimate the mean and variance of chloride ion concentrations as a function of time and depth inside a concrete element. Numerical integration methods or Monte Carlo modeling can be used in theory as an alternative, however, these are computationally too intensive for the transport model (Conciatori et al., 2014). Details of the Rosenblueth point estimators method and comparisons with results from Monte Carlo simulations are presented in Conciatori et al. (2014). The Rosenblueth method is used to estimate the mean value of the chloride content and its SD as a function of time and depth into the concrete elements. In this work, only the three main contributors (DHR, DCAP, and DCL) to uncertainty are included in the analysis which requires a total of 23 = 8 simulations.
In the simulations, the lower value is represented by X1 and the upper value by X2. The formulas used to determine the distinct values (X1, X2) and the associated probabilities (F1, F2) are defined as follows (Rosenblueth, 1975; Conciatori et al., 2009):
The distinct values (X1, X2) and the associated probabilities (F1, F2) for a normal and log-normal distribution are shown in Table 2 (Conciatori et al., 2009).
Table 2. Distinct values and associated probabilities for normal and log-normal distribution.
The distinct values and associated probabilities are optimal for the estimation of the moments of the random variables and in particular for the mean value and the variance. Estimates of the initial moment of order n for the chloride ion content at time t and depth d are obtained with the following expressions:
where δj is the point estimate identifier (+, −) for variable j, and Pi is the probability associated with a given combination of transport properties. The average values of DHR, DCL and DCAP, coefficient of variation and distinct values with their associated probabilities are shown in Table 3. The average values and coefficient of variation are determined from data bases for concrete typical at the time of construction of the bridges (Conciatori et al., 2009). Previous studies also indicate the log-normal distribution is appropriate for the distribution of the diffusion parameters as well as for the distribution for the chloride content given the duration of exposure and depth into the concrete (Wolofsky, 2011).
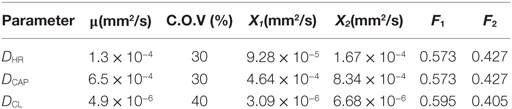
Table 3. Average values, distinct values, and associated probabilities (lognormal).
The results are obtained as a function of depth in increments of 2 mm into the concrete for three types of exposure: mist, splash, and direct. Figures 3 and 4 illustrate simulations results from the TransChlor® model for the eight cases at depths of 26 and 50 mm for direct exposure. The digits in the legend stand for the distinct points (0 or 1 or 2) that are used for each simulation. The first three values, respectively, stand for DHR, DCAP, and DCL. For example, the curve (1,220) represents the lower value 1 for DHR, the higher value 2 for DCAP and DCL, and the value 0 for a deterministic value for . The simulation was performed for a duration of 16,425 days (approximately 45 years) incorporating hourly climate data (air temperature, relative humidity, precipitation, and solar radiation). The depth of 50 mm is selected since it is common for the thickness of the concrete cover for reinforced concrete. The depth of 26 mm is not common and is used to illustrate the increase in deterioration rates when the reinforcement is not properly placed.
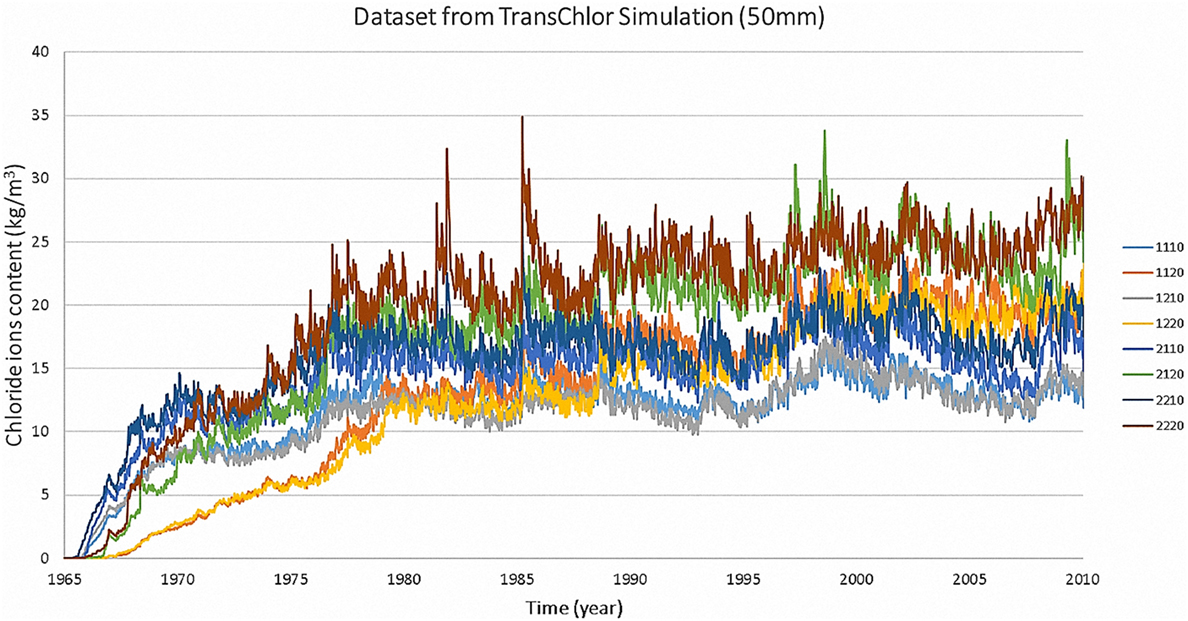
Figure 3. Dataset simulated from TransChlor® for 50 mm depth.
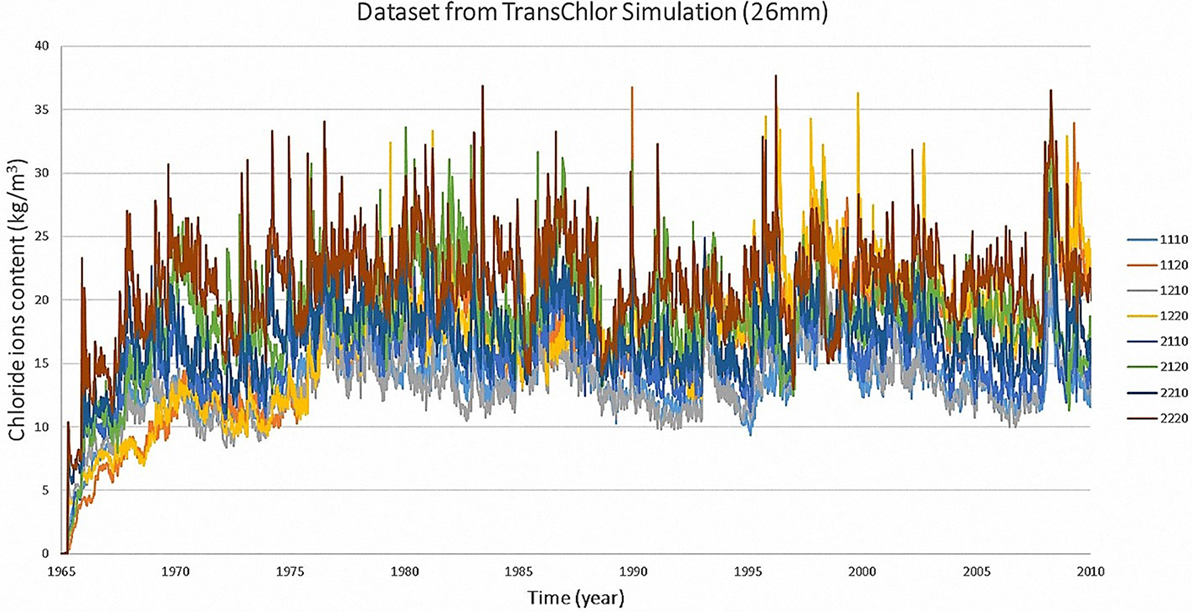
Figure 4. Dataset simulated from TransChlor® for 26 mm depth.
Figures 3 and 4 show that the chloride ion content fluctuates significantly as a function of climatic exposure and concrete properties. However, for modeling the deterioration of concrete structures, it may be sufficient to determine the variability in the annual average level of chloride ions. The average annual total chloride ion content is shown in Figures 5 and 6 at depth of 26 and 50 mm for each of the eight simulations. These indicate that the average annual amount of chloride ions increases and reach a steady state after a few decades of service but can fluctuate significantly due to the variability in annual winter conditions. They also indicate that the level of chloride ions is very dependent on material properties which can vary among a population of structures with similar service life.
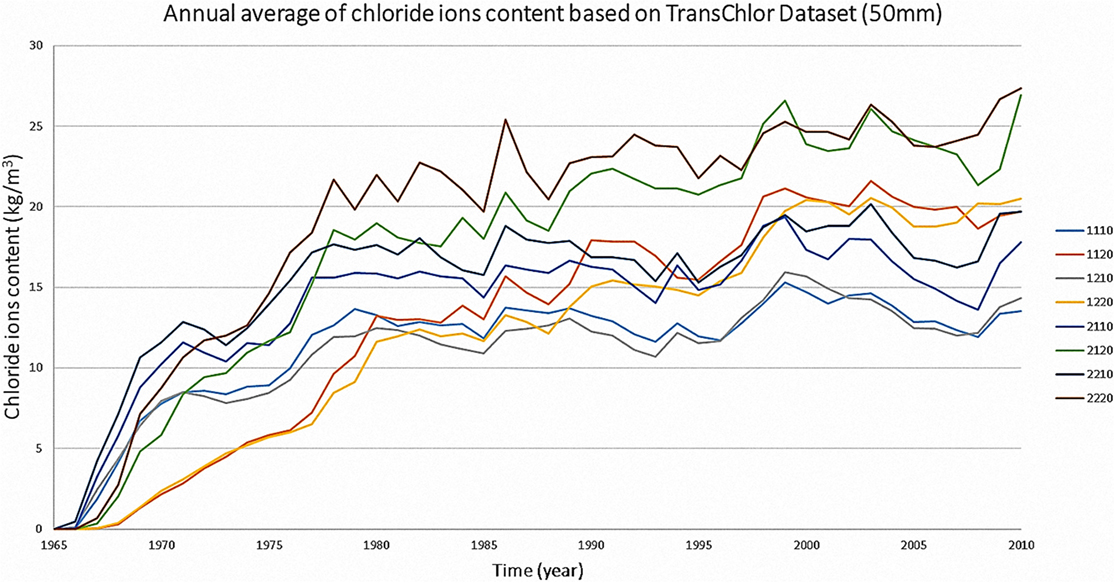
Figure 5. Annual average of chloride ions content based on TransChlor® Dataset for 50 mm depth.
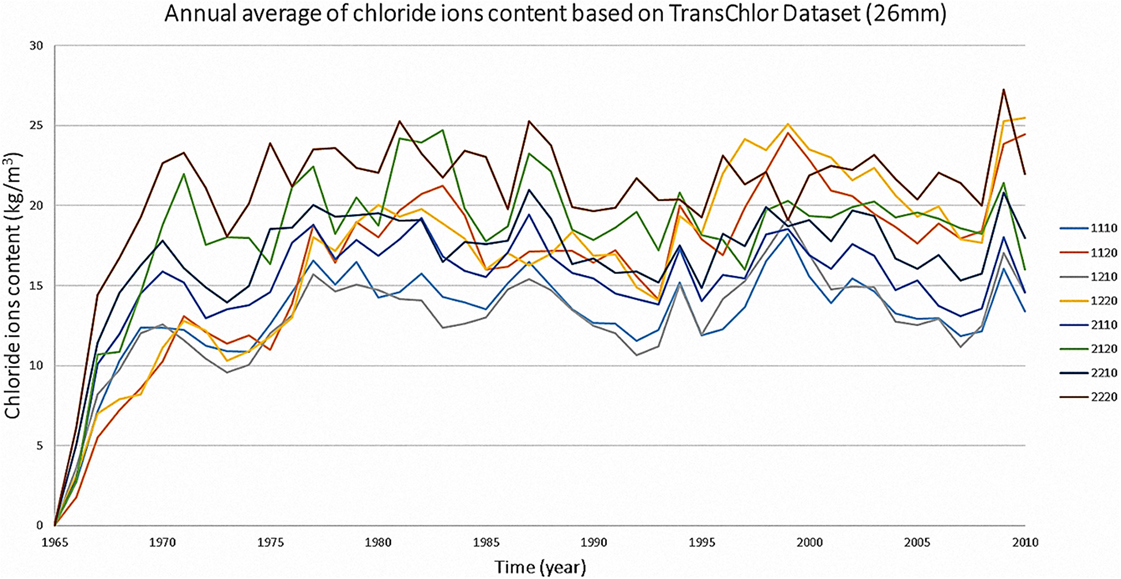
Figure 6. Annual average of chloride ions content based on TransChlor® Dataset for 26 mm depth.
The objective of this work is to use Markov chains to capture the trends and variability observed in chloride ion content for a given location and concrete material properties as predicted by TransChlor®. The Markov model can then be used as a surrogate model to the full finite element model to develop optimal strategies for the maintenance and replacement of bridges. The surrogate model is developed for a given climatic region and is applicable to a set of bridges with varying material properties. The transition probabilities of the Markov process are parametrized by using a logistic regression model where concrete properties are the independent variables.
Surrogate Markov Chain Model
Modeling Chloride Ions Content Prediction with Markov Chains
Markov Chains are adopted to develop prediction models of chloride ions content for reinforced concrete with two concrete cover thicknesses (26 and 50 mm). The probability of being in a given future chloride state is determined only by the current state. This property is represented by a stochastic process (Xt) and a discrete state space as below (Parzen, 1962):
where P is the transition probabilities and i is the step.
Computations with Markov Chains
Given the initial state probabilities vector q(0), the future probability state vector q(t) at the transition periods t can be calculated as the matrix product (Collins, 1975):
where,
In this application, q(0) is defined as [1, 0, 0, 0, 0, 0], which states that for the probability that chloride ions content will be in the first category at time zero is 100%, which corresponds to a new structure.
State probabilities for the next time interval can be derived from Eq. 11:
The expected chloride ion content at time t is determined from the calculated transition probabilities, where, t is the time in years as (Butt et al., 1987):
where Cli is the middle value for state i.
The standard derivation is obtained as
Parametrization of Transition Probabilities
In this study, DCL, DCAP, and DHR were employed to parametrize transition probabilities for the state probabilities of chloride content using a multinomial logit model (Allison, 2012):
where α0 is a constant and α1, α2, and α3 are coefficients, and Pij are transition probabilities from state i to state j given the initial state i. The estimation of the surrogate model is detailed in the following steps:
(1) The range of chloride content is divided into a given number (e.g., 3 or 6) of states (Table 4). Results for the chloride content at a given depth (e.g., 26 mm) are used to obtain transition counts for each period of reference (e.g., 1 year). The counts for the initial state 1 are shown in Table 5.
(2) Obtain the α0, α1, α2, α3 of the Eq. 17 using maximum likelihood estimation.
(3) Predicted values Pij as a function of the diffusion parameters are then obtained as
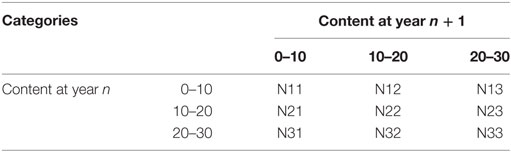
Table 4. Transition counts matrix of the chloride ions content for 26 mm depth.
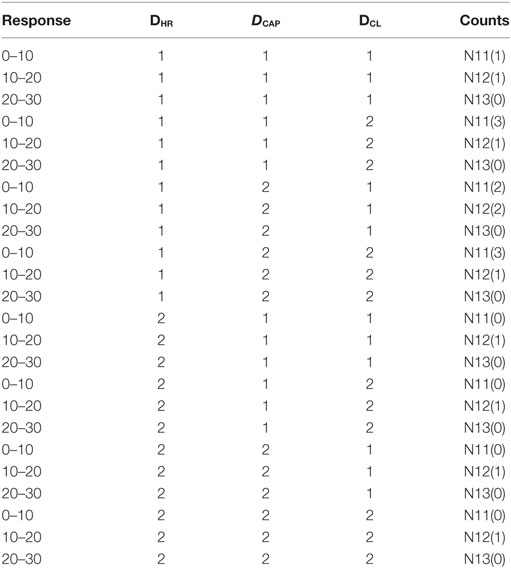
Table 5. Counts for the initial state 1, 26 mm depth.
Table 6 compares the performance of the predicted probabilities for all the cases at 26 mm depth from STATISTICA® and Surrogate Markov chain Model and shows good agreement with the data obtained from the finite element model.
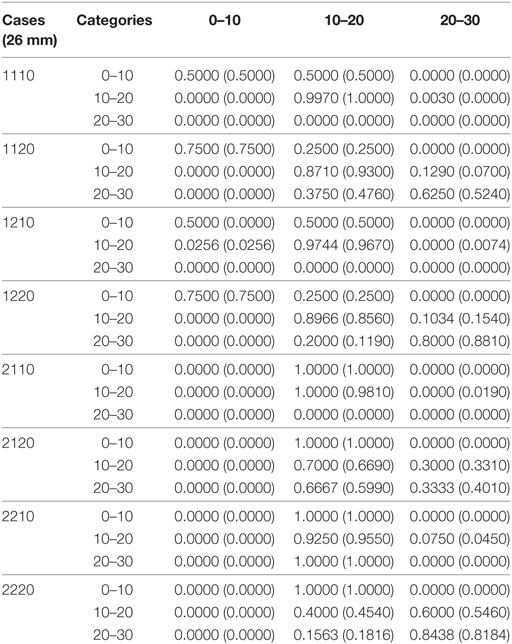
Table 6. Predicted probabilities from STATISTICA® and Surrogate Markov chain model for the cases of 26 mm depth.
Results and Discussions
The transition probabilities from the Markov process are used to predict chloride ions content at various depths as a function of time and are compared to the TransChlor® results. Predictions are obtained at depths of 26 and 50 mm for a period of 45 years. The results show the state probabilities of content of chloride ions as a function of time. The state probabilities are used to obtain the annual average and SD of chloride content as a function of time and compared to the simulated values from TransChlor®. The blue and green lines correspond to the 95% confidence interval for chloride ion content and the yellow line corresponds to the data from the TransChlor® simulation. The results indicate a good agreement between the original and surrogate models.
Figures 7A–D show results at a depth of 50 mm with six states over the range of chloride content from 0 to 30 kg/m3. For the scenarios 2120 and 2220, the average chloride content increases rapidly from the start of the service life to the seventh year and then slows down until the tenth year. Upon completion of the prediction period of 45 years, the probabilities for state q5 (20–25 kg/m3) is approximately 70% for both scenarios. The scenarios 1120 and 1220 exhibit a more gradual increase which stabilizes after the twentieth year of service 50% probability for the 15–20 kg/m3 state. The comparison indicates that the concentrations are very sensitive to values of DHR. Conversely, changes in DCL do not significantly affect the evolution and levels of chloride ion content. The effect of DCAP is the least influential among diffusion parameters. Finally, the expected chloride content is overestimated for some scenarios in the initial portion of the service life, however, the predictions improve over time and a good match is obtained after the initial stage of the service life.
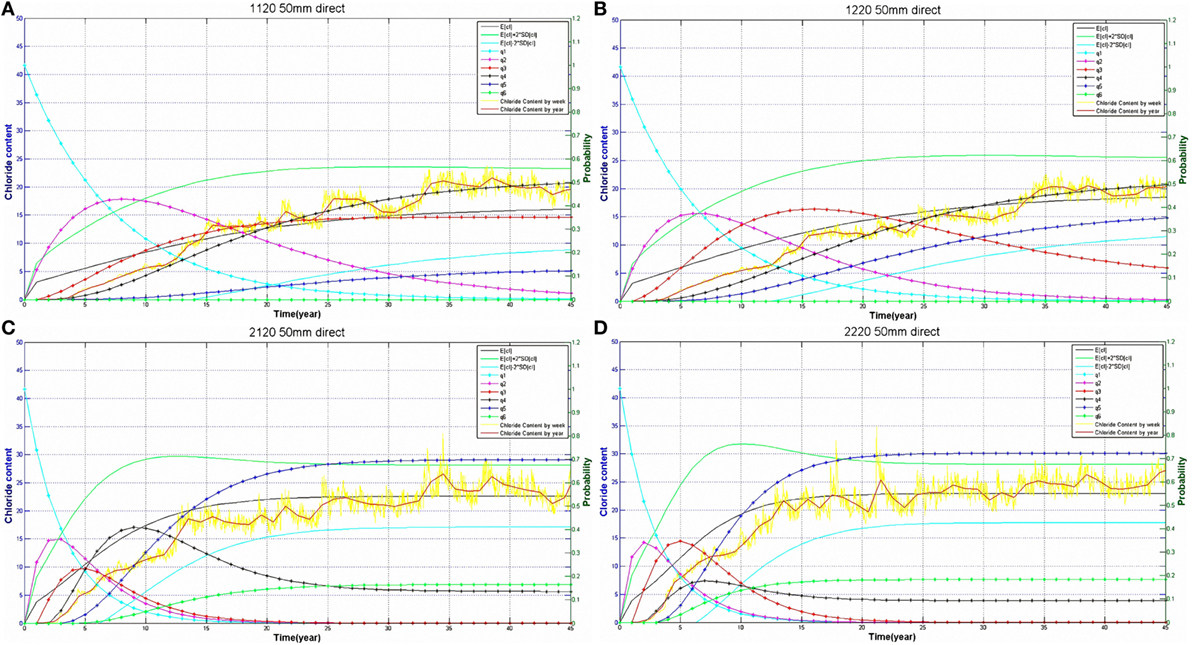
Figure 7. Transition probabilities and expected categories of chloride ions content for cases at 50 mm considering 45 year period. (A) Case 1120, (B) Case 1220, (C) Case 2120, and (D) Case 2220.
Figures 8A–D show results obtained at a depth of 26 mm. In this case, the results are obtained for three states for a range of chloride content from 0 to 30 kg/m3. A smaller number of states are used in this case given that high levels of chloride content are attained earlier in the service life. For the scenarios 2120 and 2220, the chloride ion content increases rapidly during the first 2 years of service, and then reaches a steady state after the third year. Upon completion of the 45-year prediction period, the probability (q2) in the state 10–20 kg/m3 is around 65% for the scenario 2120 and 75% for the scenario 2220. Meanwhile, for scenarios 1120 and 1220, the chloride content increases rapidly in the first year and thereafter maintains a relatively steady rate of increase, which starts to stabilize after the fifteenth year. The results indicate that DHR has most effect on the rate of penetration of chloride ions while DCL has an effect mainly on the long-term maximum level of chloride ions. The predicted values for the average chloride ion content is slightly underestimated for low values of DHR in the early years of the service life, but are well matched in all cases in the latter part of the service life.
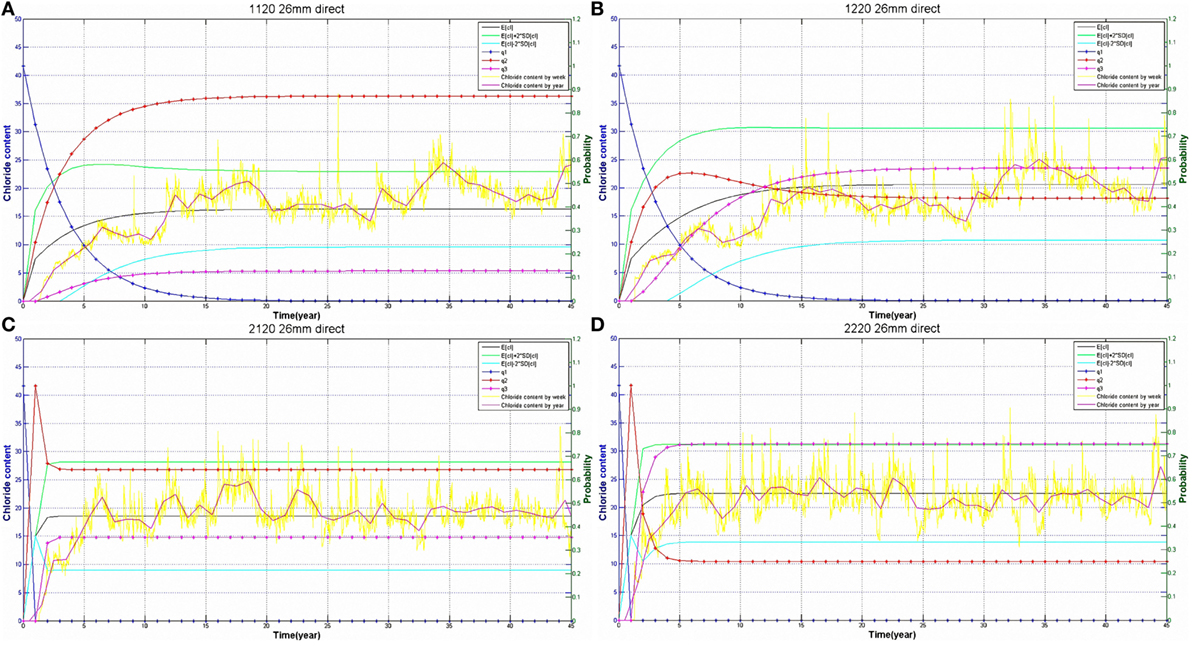
Figure 8. Transition probabilities and expected categories of chloride ions content for cases at 26 mm considering 45 year period. (A) Case 1120, (B) Case 1220, (C) Case 2120, and (D) Case 2220.
Conclusion
Currently, there are significant concerns over the state of bridges in North America due to their advanced state of degradation. Thus, it is important to adopt efficient maintenance strategies to ensure that bridges are safe and in working condition for the longest possible period of time. The main mechanism of deterioration of concrete bridges in Canada is due to the widespread use of de-icing salts and the ingress of chloride ions and their effect on reinforcing steel. This paper presents a new method of forecasting the chloride ions content based on the Markov Chain-based stochastic model. Transition probabilities for this model are obtained for the states defined as increasing levels of chloride ion content, while simulation data from the TransChlor® model is used to estimate the parameters for the surrogate model. A logistic model is used to predict the transition probabilities between each level as a function of concrete properties. This model can then be used for a wide variety of bridges as well as for different climatic regions. This approach is particularly well-suited to the analysis of maintenance and replacement strategies over a large portfolio of structures located in diverse climatic regions. The deterioration models can also be used in conjunction with inspection data when the latter is available over a sufficient long historical period.
This research demonstrates that it is possible to forecast the content of chloride ions in concrete bridges efficiently using Markov Chain models. Future research with this approach can be used to relate stages in the process of deterioration to observations from periodic inspection reports as well as from more detailed surveys on the physical state of structural elements. The model can also be extended to other elements of the bridge besides the slab which are not directly exposed to chloride ions. This can be used to develop maintenance and replacement that encompass all elements of the bridge in terms of timing and opportunity costs.
Author Contributions
YZ: Markov chain model programming, parametrization of transition probabilities, writing the manuscript. LC: guidance for the project and modifications of the manuscript. DC: modeling of chloride ions transport and experimental design.
Conflict of Interest Statement
The authors declare that the research was conducted in the absence of any commercial or financial relationships that could be construed as a potential conflict of interest.
Acknowledgments
The authors acknowledge the financial support by NSERC Discovery Grants and FRQNT Team Grant.
References
Allison, P. D. (2012). Logistic Regression using SAS: Theory and Application. Cary, NC: SAS Institute.
Butt, A. A., Shahin, M. Y., Feighan, K. J., and Carpenter, S. H. (1987). Pavement Performance Prediction Model using the Markov Process. Transportation Research Board.
Caner, A., Yanmaz, A. M., Yakut, A., Avsar, O., and Yilmaz, T. (2008). Service life assessment of existing highway bridges with no planned regular inspections. J. Perform. Constr. Facil. 22, 108–114. doi: 10.1061/(ASCE)0887-3828(2008)22:2(108)
Cesare, M. A., Santamarina, C., Turkstra, C., and Vanmarcke, E. H. (1992). Modeling bridge deterioration with Markov chains. J. Transp. Eng. 118, 820–833. doi:10.1061/(ASCE)0733-947X(1992)118:6(820)
Conciatori, D., Bruhwiler, E., and Morgenthaler, S. (2009). Calculation of reinforced concrete corrosion initiation probabilities using the Rosenblueth method. Int. J. Reliab. Saf. 3, 345–362. doi:10.1504/IJRS.2009.028581
Conciatori, D., Grégoire, É, Samson, É, Marchand, J., and Chouinard, L. (2014). Statistical analysis of concrete transport properties. Mater. Struct. 47, 89–103. doi:10.1617/s11527-013-0047-z
Conciatori, D., Laferrière, F., and Brühwiler, E. (2010). Comprehensive modeling of chloride ion and water ingress into concrete considering thermal and carbonation state for real climate. Cem. Concr. Res. 40, 109–118. doi:10.1016/j.cemconres.2009.08.007
Conciatori, D., Sadouki, H., and Brühwiler, E. (2008). Capillary suction and diffusion model for chloride ingress into concrete. Cem. Concr. Res. 38, 1401–1408. doi:10.1016/j.cemconres.2008.06.006
Crank, J., and Gupta, R. S. (1975). Isotherm migration method in two dimensions. Int. J. Heat Mass Transf. 18, 1101–1107. doi:10.1016/0017-9310(75)90228-8
CSA. (2014). Canadian Highway Bridge Design Code S6-14 CSA Canadian Standards Association. Canada: Canadian Standards Association.
Deb, S. (2012). “Critical chloride content in reinforced concrete,” in The Masterbuilder, 9. Available at: https://www.masterbuilder.co.in/data/edata/Articles/August2012/58.pdf
Estes, A. C., and Frangopol, D. M. (2005). Load rating versus reliability analysis. J. Struct. Eng. 131, 843–847. doi:10.1061/(ASCE)0733-9445(2005)131:5(843)
Jiang, Y., and Sinha, K. C. (1989). Bridge service life prediction model using the Markov chain. Transp. Res. Rec. 1223, 24–30.
Micevski, T., Kuczera, G., and Coombes, P. (2002). Markov model for storm water pipe deterioration. J. Infrastruct. Syst. 8, 49–56. doi:10.1061/(ASCE)1076-0342(2002)8:2(49)
Morcous, G. (2006). Performance prediction of bridge deck systems using Markov chains. J. Perform Constr. Facil. 20, 146–155. doi:10.1061/(ASCE)0887-3828(2006)20:2(146)
NACE. (2012). “Corrosion control plan for bridges,” in The Corrosion Society (A NACE International White Paper). Available at: https://www.nace.org/uploadedFiles/Corrosion_Central/Corrosion_101/White_Papers/CorrosionControlPlanForBridges.pdf
O’Connor, A., Sheils, E., Breysse, D., and Schoefs, F. (2011). Markovian bridge maintenance planning incorporating corrosion initiation and nonlinear deterioration. J. Bridge Eng. 18, 189–199. doi:10.1061/(ASCE)BE.1943-5592.0000342
Parzen, E. (1962). On estimation of a probability density function and mode. Ann. Math. Stat. 33, 1065–1076. doi:10.1214/aoms/1177704472
Rosenblueth, E. (1975). Point estimates for probability moments. Proc. Natl. Acad. Sci. U.S.A. 72, 3812–3814. doi:10.1073/pnas.72.10.3812
Samson, E., and Marchand, J. (2007). Modeling the transport of ions in unsaturated cement-based materials. Comput. Struct. 85, 1740–1756. doi:10.1016/j.compstruc.2007.04.008
Shafei, B., and Alipour, A. (2015). Estimation of corrosion initiation time in reinforced concrete bridge columns: how to incorporate spatial and temporal uncertainties. J. Eng. Mech. 141, 04015037. doi:10.1061/(ASCE)EM.1943-7889.0000861
Sobanjo, J. (1997). A neural network approach to modeling bridge deterioration. Paper Presented at the Computing in Civil Engineering. Philadelphia, PA.
Thomas, O., and Sobanjo, J. (2016). Semi-Markov models for the deterioration of bridge elements. J. Infrastruct. Sys. 22, 04016010. doi:10.1061/(ASCE)IS.1943-555X.0000298
Tokdemir, O. B., Ayvalik, C., and Mohammadi, J. (2000). Prediction of highway bridge performance by artificial neural networks and genetic algorithms. Paper Presented at the Proc., 17th Int. Symp. on Automation and Robotics in Construction (ISARC).
Washington, S. P., Karlaftis, M. G., and Mannering, F. (2010a). Statistical and Econometric Methods for Transportation Data Analysis, 2 Edn, Vol. Part2 (Boca Raton, FL: CRC press), 11&12.
Washington, S. P., Karlaftis, M. G., and Mannering, F. (2010b). Statistical and Econometric Methods for Transportation Data Analysis, 2 Edn, Vol. part2 (Boca Raton, FL: CRC press), 10.
Wolofsky, R. (2011). Corrosion Initiation of Concrete Bridge Elements Exposed to De-icing Salts. Canada: McGill University.
Wolofsky, R., Chouinard, L., Conciatori, D., and Bastien, J. (2015). Updating of chloride ingress models using core data measurements. Int. J. Reliab. Saf. 9, 291–310. doi:10.1504/IJRS.2015.073136
Keywords: concrete bridges, deterioration, Markov chain, transition probabilities, chloride ions content
Citation: Zhang Y, Chouinard LE and Conciatori D (2018) Markov Chain-Based Stochastic Modeling of Chloride Ion Transport in Concrete Bridges. Front. Built Environ. 4:12. doi: 10.3389/fbuil.2018.00012
Received: 01 November 2017; Accepted: 07 February 2018;
Published: 02 March 2018
Edited by:
Maria Nogal, Trinity College, Dublin, IrelandCopyright: © 2018 Zhang, Chouinard and Conciatori. This is an open-access article distributed under the terms of the Creative Commons Attribution License (CC BY). The use, distribution or reproduction in other forums is permitted, provided the original author(s) and the copyright owner are credited and that the original publication in this journal is cited, in accordance with accepted academic practice. No use, distribution or reproduction is permitted which does not comply with these terms.
*Correspondence: Yan Zhang, eWFuLnpoYW5nOUBtYWlsLm1jZ2lsbC5jYQ==