 Michael L. Whiteman1
 Pedro L. Fernández-Cabán1
 Brian M. Phillips1*
 Forrest J. Masters2
 Jennifer A. Bridge2
 Justin R. Davis2
- 1Department of Civil and Environmental Engineering, University of Maryland, College Park, MD, United States
- 2Department of Civil and Coastal Engineering, University of Florida, Gainesville, FL, United States
This paper explores the use of a cyber-physical systems (CPS) “loop-in-the-model” approach to optimally design the envelope and structural system of low-rise buildings subject to wind loads. Both the components and cladding (C&C) and the main wind force resisting system (MWFRS) are considered through multi-objective optimization. The CPS approach combines the physical accuracy of wind tunnel testing and efficiency of numerical optimization algorithms to obtain an optimal design. The approach is autonomous: experiments are executed in a boundary layer wind tunnel (BLWT), sensor feedback is monitored and analyzed by a computer, and optimization algorithms dictate physical changes to the structural model in the BLWT through actuators. To explore a CPS approach to multi-objective optimization, a low-rise building with a parapet wall of variable height is considered. In the BLWT, servo-motors are used to adjust the parapet to a particular height. Parapet walls alter the location of the roof corner vortices, reducing suction loads on the windward facing roof corners and edges, a C&C design load. At the same time, parapet walls increase the surface area of the building, leading to an increase in demand on the MWFRS. A combination of non-stochastic and stochastic optimization algorithms were implemented to minimize the magnitude of suction and positive pressures on the roof of a low-rise building model, followed by stochastic multi-objective optimization to simultaneously minimize the magnitude of suction pressures and base shear. Experiments were conducted at the University of Florida Experimental Facility (UFEF) of the National Science Foundation’s (NSF) Natural Hazard Engineering Research Infrastructure (NHERI) program.
Introduction
Cyber-physical systems (CPS) provide a rich environment for the analysis, design, and optimization of civil infrastructure. In civil engineering, CPSs are rooted in earthquake engineering, where they were used for the performance evaluation of structures under earthquake loads. To reduce costs and demands on experimental resources, structural systems were partitioned into experimental and numerical components. The loop of action and reaction joining the partitions created a CPS now known as hybrid simulation (Hakuno et al., 1969, Shing and Mahin, 1984, and Takahashi and Nakamura, 1987). Hybrid simulation has since expanded into a family of experimental methods including real-time hybrid simulation (Nakashima and Masaoka, 1999), effective force testing (Dimig et al., 1999), geographically distributed hybrid simulation (Stojadinovic et al., 2006), and geographically distributed real-time hybrid simulation (Kim et al., 2012).
Recently, Whiteman et al. (2018) proposed a new application of CPS in civil engineering—the partitioning of the optimization process. The approach was applied to wind engineering through cyberinfrastructure-augmented boundary layer wind tunnel (BLWT) modeling. The goal was to produce optimal designs faster than purely experimental methods and with a higher degree of realism than purely computational methods. The approach is autonomous: experiments are executed in a BLWT, sensor feedback is monitored and analyzed by a computer, and optimization algorithms dictate physical changes to the structural model in the BLWT through actuators. This approach was named “loop-in-the-model” testing because the model undergoes physical change as it approaches the optimal solution. As a proof-of-concept, Whiteman et al. (2018) implemented single-objective optimization using particle swarm optimization (PSO) to minimize roof suction pressures on a low-rise building with a mechatronic parapet.
The present work expands on the proof-of-concept study presented in Whiteman et al. (2018), investigating the appropriateness of different types of optimization algorithms, both stochastic and non-stochastic, for implementation in a CPS framework. Additionally, multi-objective optimization is integrated with consideration of both components and cladding (C&C) and main wind force resisting system (MWFRS). Multi-objective optimization is a step toward bringing architects, owners, engineers, and other stakeholders to the table for the automated design of a building system. For example, architects may target an aesthetically pleasing façade and open floor plan, owners may wish to maximize usable floor space, and engineers need to design a structure that meets strength and serviceability requirements. Figure 1 illustrates how these competing objectives of different stakeholders can be captured by a single mechatronic specimen to automate the design process. The specimen represents a building with a bundled tube structure (Ali and Moon, 2007), reminiscent of the Willis (Sears) Tower in Illinois and Carnegie Hall Tower in New York.
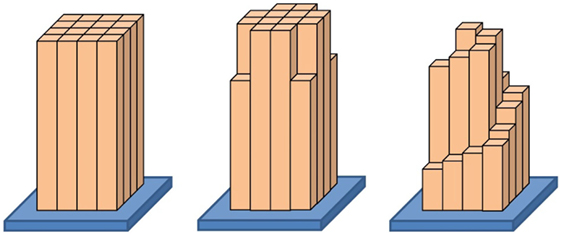
Figure 1. Rigid model with geometric morphing.
The structure selected for evaluation in this study is a low-rise building with a parapet wall of variable height developed in Whiteman et al. (2018). The windward roof edges on low-rise buildings cause a separation of the boundary layer and generate vortex flow with large suction loading that is particularly severe for oblique approaching wind angles. Increasing the parapet height has a significant effect on these wind suction loads because it alters the location of the roof corner vortex, which mitigates extreme corner and edge suction loads, a C&C design load (Kopp et al., 2005a,b; Mans et al., 2005). At the same time, the presence of parapet walls increases the surface area of the building, leading to an increase in demand on the MWFRS. In the BLWT, the parapet height was adjusted using servo-motors to create a particular design that is a “candidate” in the optimization framework. The building envelope was instrumented with pressure taps to measure surface pressures and estimate base shears. The taps were densely spaced on the roof to sufficiently capture the change in roof corner vortex formation.
Two algorithms were implemented to achieve the optimum parapet height: a golden section search (GSS) algorithm and a multi-objective PSO (MO-PSO) algorithm. The GSS algorithm was implemented for different objective functions in two separate studies to (1) minimize the magnitude of suction on the roof and parapet surfaces and (2) minimize the magnitude of both suction and positive pressures on the roof and parapet surfaces. The MO-PSO algorithm was implemented to minimize the magnitude of suction on the roof, while also minimizing the base shear of the structure. The GSS and MO-PSO algorithms were then compared with the single-objective PSO of Whiteman et al. (2018). Experiments were conducted in the BLWT located at the University of Florida Experimental Facility (UFEF) of the National Science Foundation’s (NSF) Natural Hazard Engineering Research Infrastructure (NHERI) program.
This paper consists of eight primary sections. The Section “Introduction” introduces the structure selected for evaluation within the study and highlights the continuation of the work presented in Whiteman et al. (2018). The Section “Background” provides a background regarding the effects of parapets on C&C and MWFRS loads. The Section “Optimization Algorithms” introduces the GSS and PSO optimization algorithms integrated into the CPS framework. The Section also provides a brief background on multi-objective optimization. The Sections “Experiment Setup” and “Optimization Setup” provide details about the physical and cyber components of the experimental setup, respectively. The Sections “Single-Objective Optimization: Peak Pressures” and “Multi-Objective Optimization: Peak Pressure and Base Shear” show the results of the single- and multi-objective optimization cases, respectively. Finally, the Section “Conclusion” presents the implications of the major findings.
Background
The generalized cyber-physical optimization approach is shown in Figure 2 for a predetermined set of evaluation wind angles and problem-specific number of candidate designs and iterations. Loops over all angles, all candidate designs within an iteration, and all iterations are highlighted to clearly illustrate the experimental timeline and evolution of the design.
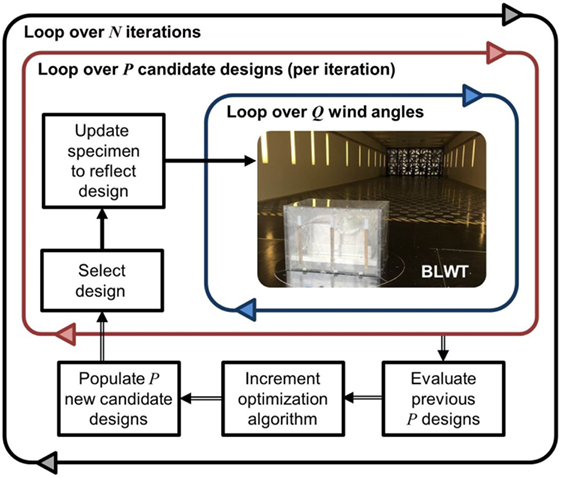
Figure 2. Flowchart of cyber-physical systems framework.
Along-Wind Forces on Low-Rise Buildings with Parapets
Lateral forces in low-rise structures are resisted by lateral structural systems and the supporting foundation. Lateral forces on low-rise structures from wind are primarily dictated by the geometry of the building envelope, wind speed, and angle of approach. Wind load provisions, such as ASCE 7-10, provide guidelines for estimating design wind pressures on low-rise buildings of common geometric shapes (ASCE/SEI 7-10, 2010). These design pressures can then be integrated over the projected area of the building to obtain the design lateral wind forces.
A reduction in horizontal base shear forces is beneficial for designers, since it results in lighter structural members, smaller foundations, and overall less material use. However, exploring a wide range of building geometries can be an arduous process. This search could be automated with optimization routines programmed to find the best aerodynamic shape of the building envelope that will minimize base forces on the structure.
The presence of parapet walls affects the total base shears due to wind loading. An increase in parapet height increases the windward and leeward surface areas and also introduces new surfaces interior to the parapet. ASCE 7-10 accounts for the effects of parapets on the MWFRS by estimating the net horizontal wind pressures for both windward and leeward parapet walls. This net wind pressure is calculated from the velocity pressure evaluated at the top of the parapet and a net pressure coefficient that accounts for both the front and back surfaces. Values of the net pressure coefficients for windward and leeward parapet walls are provided in ASCE 7-10.
Roof Pressures on Low-Rise Buildings with Parapets
Architectural detailing greatly influences the magnitude, direction, and spatio-temporal correlation of pressures over a roof surface. High suctions on leading roof corners and edges are related to strong vortices which occur for oblique wind angles to flat-roofed buildings (Kind, 1988; Pindado and Meseguer, 2003). Parapet walls reduce these high suction loads, and thereby potentially prevent loose roof material from becoming windborne debris and damaging a building’s envelope. Most research concerning parapets has focused on either the characterization of roof pressure distributions for C&C or the effect on the underlying structural members (Stathopoulos et al., 2002; Kopp et al., 2005a,b).
Building codes, such as ASCE 7-10, determine the minimum loads for the C&C design of the roof of a building with a parapet by allowing for a reduction in pressure over specific regions (ASCE/SEI 7-10, 2010); however, thorough research has not been conducted regarding the precise region locations or on the optimal height of a parapet for a given low-rise building. Most research on parapet walls focuses on mitigating local roof loading through the use of alternative parapet geometries (e.g., Kopp et al., 2005a,b) with limited studies on the optimal height or effect of different heights of solid, continuous perimetric parapets. The minimum loads for the C&C design of the parapet itself are based on the height of the parapet (measured from the base of the building) and the pressures on adjacent wall and roof surfaces. The net effect is a positive pressure on the windward surfaces of windward and leeward parapets and a negative pressure on the leeward surfaces of windward and leeward parapets (ASCE/SEI 7-10, 2010).
BLWT Modeling
Traditional trial and error design approaches require extensive iterations and inefficient communication between stakeholders. Ultimately, at most only a few candidate designs are evaluated in a BLWT to determine the design wind loads. The design wind loads are sensitive to the geometry and dynamics of the structure. If only a few designs are evaluated, the final design selected is not likely to be optimal.
The CPS approach integrates experimental testing into the optimization process, producing optimal designs for structures subject to realistically modeled wind loads. The accuracy is achieved through the use of BLWT modeling, the primary tool to characterize the surface pressures on bluff bodies and a standard in wind engineering for decades. In this work, along-wind forces and roof pressures will be determined for each candidate solution directly from the BLWT testing results. The combination of BLWT modeling with numerical optimization algorithms to explore the search space creates an accurate and efficient framework for optimal design in wind engineering. This approach can be applied to design problems with competing objectives from multiple stakeholders to obtain an objectively optimal solution that achieves balance between all parties.
Optimization Algorithms
The loop-in-the-model cyber-physical approach to optimal design can merge any optimization algorithm with physical testing. The most efficient and effective algorithm depends on the problem being studied. Optimization algorithms are typically categorized as either gradient-based or metaheuristic (or gradient-free) methods. Gradient-based and other deterministic methods are non-stochastic algorithms that minimize (or maximize) a pre-defined objective function through an iterative process involving the recalculation of the gradient (i.e., derivatives) of the function or an iterative reduction in the search space. These algorithms exhibit fast convergence, but require specific knowledge of the problem to execute a search and are easily trapped in local minima, where the gradient is zero.
Metaheuristic algorithms are problem-independent stochastic techniques well suited for solving multi-objective and constrained problems without the need for gradient information (Talbi, 2009; Luke, 2013). These algorithms do not require continuity in the problem definition and are generally better suited for finding a global or near-global minimum (or maximum) as they broadly explore candidate solutions within a pre-defined search space to avoid premature or local convergence. At the same time, metaheuristics are stochastic and there is no guarantee that a global optimal solution, or even bounded solution, will be found (Perez and Behdinan, 2007).
This paper explores a non-stochastic search algorithm (GSS) that is efficient for simple problems with one design variable and a unimodal objective function. The paper also considers a stochastic search algorithm (PSO) that is better suited for multi-variate and multi-objective optimization problems with no requirements on the continuity or form of the objective function. The most suitable search algorithm for integration into a cyber-physical optimization framework depends on the complexity of the problem. Ultimately, a user should select the most efficient algorithm (i.e., reducing the total number of BLWT tests) that also confidently achieves the optimal or near optimal solution.
Golden Section Search
Based on a preliminary test matrix, exploring the effects of parapet height and wind angle on roof pressures, the optimal parapet height for minimizing the magnitude of peak roof suction pressure is anticipated to occur at one unique height (i.e., a unimodal problem with no local minima). GSS is a non-stochastic, deterministic optimization technique for finding the extremum of a strictly unimodal function where the sign of the curvature does not change by successively narrowing the search space within which the extremum is known to exist. The GSS algorithm is similar to the bisection method because it iteratively reduces the search space, and it derives its name from the fact that the length of the search space is linearly reduced for each iteration by the golden ratio (Luenberger and Ye, 1984). The GSS is explored herein for its simplicity and quick convergence.
Assume that a function f is unimodal and with no local extrema on the interval [a, b]. The search space is divided into three sections ([a, x1], [x1, x2], and [x2, b]) by adding two intermediate points, x1 and x2, as shown in Figure 3. The function is then evaluated at the two intermediate points, and the results f (x1) and f (x2) are compared. The subinterval of either [a, x1] or [x2, b] can then be discarded such that the minimum (for minimization) is bracketed within the remaining subinterval (Nazareth and Tseng, 2002). The locations of x1 and x2 are chosen so that two conditions are satisfied: x1 and x2 are equidistant from a and b, respectively, and the ratio of lengths of the three intervals, L/L2 = L2/L1, is constant. Based on these two conditions, L2 = φ ≅ 0.618 and L1 = 1−φ ≅ 0.382. As a result, only one new function evaluation is needed every successive iteration for the standard GSS algorithm as one of the previous intermediate points is reused. The two intermediate points are calculated according to the following,
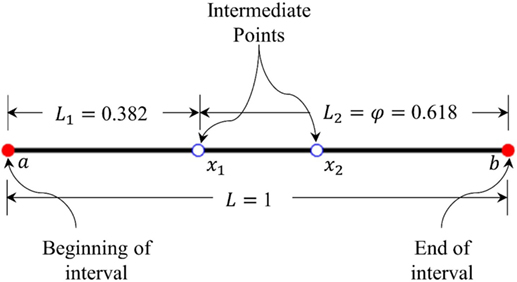
Figure 3. Sections of golden section search for a unit interval.
Boundary layer wind tunnel testing is subject to uncertainty; peak pressures tend to vary from experiment to experiment for the same specimen configuration (e.g., same parapet height and wind angle). To some degree, this uncertainty is mitigated by estimating peak pressures from the data (i.e., using extreme value analysis) rather than directly using instantaneous peak pressures (i.e., simple worst peak method). This paper uses a Fisher-Tippet Type I (Gumbel) extreme value distribution to estimate peak pressures. Despite the application of the Gumbel distribution, variability in the estimate of peak pressures remain (Gavanski et al., 2016) and peaks may be linked to a specimen configuration that are not truly representative of that configuration. To avoid sensitivity to a non-representative test (i.e., an outlier), the standard GSS algorithm is modified such that the previous intermediate point that is typically reused will be retested rather than directly using test results from the previous iteration.
With each iteration, the search space is reduced around the extremum until a pre-defined tolerance for the remaining search space size is met. The tolerance is defined as the precision at the final iteration of the calculated extremum. Based on the linear reduction of the search space by φ for each iteration, the number of required design iterations N for a given tolerance Tol can be predetermined according to the following:
Particle Swarm Optimization
Particle swarm optimization is a population-based metaheuristic algorithm that mimics the social behavior of a population of individuals (swarm) adapting to its environment through the joint discovery and exploration of promising regions. The inspiration for PSO came from genetic algorithms, evolutionary algorithms, and evolution strategies.
Each particle within the swarm has a finite position and velocity within the search space and represents a candidate design. The position corresponds to the values of the different design parameters (e.g., parapet height), and the velocity corresponds to the change in the design parameters between iterations. The dimensions of the search space (and therefore position and velocity) are equal to the number of design parameters. The positions of the particles are often initially randomly or evenly distributed throughout the search space. The swarm of particles iteratively moves throughout the search space seeking the global best solution. At each iteration, the particles’ best costs and swarm’s best cost are updated and are used to determine the next particle positions based on a combination of the inertial, cognitive, and social components of the velocity. This procedure is repeated for a predetermined number of design iterations or until a pre-defined tolerance is obtained.
The process for updating the position of each particle is
where is the position vector of particle i at iteration j + 1, is the corresponding velocity vector of the particle, and Δt is the time step value.
The process for determining the velocity vector of each particle in the swarm depends on the PSO algorithm selected. The most common algorithm used was introduced by Shi and Eberhart as
where r1 and r2 are independent random numbers in the range [0,1], is the best known position of particle i considering iterations one through j, is the best known position of all particles considering iterations one through j, and Δt is the time step value, often a unit time step of one iteration to satisfy dimensional analysis of the position-velocity analogy (Shi and Eberhart, 1998). In Eq. 6, w, c1, and c2 influence the inertial, cognitive, and social components of the particle’s velocity, respectively. The inertia controls the algorithm’s exploration of the search space; a larger inertia enables a more global search because particles place a higher importance on their previous trajectory. The trust parameters indicate how much confidence the current particle has in itself (cognitive, c1) and in the swarm (social, c2), and will draw the particle to the positions corresponding to the respective best costs of these components. To some degree, the selection of the inertia and trust weights is problem dependent. A poor selection of parameters may lead to premature convergence to a locally optimal solution, or a solution that takes an excessive number of iterations to converge. A good selection of parameters can be made through either trial and error or deduction and experience.
Multi-Objective Optimization
Multi-objective optimization is necessary when two or more objectives are in conflict and a compromise between objectives is desired. This conflict is often the case when considering the requirements of multiple stakeholders in engineering design. If there is no single solution that will simultaneously optimize each objective, there instead exists an infinite number of Pareto optimal solutions. A solution is Pareto optimal if any of the objective functions cannot be improved without degrading one or more of the other objective functions. A set of Pareto optimal solutions creates a Pareto front, which illustrates the tradeoffs in simultaneously meeting multiple objectives. To select an optimal solution from the set of Pareto optimal solutions, subjective preference from the user is required; all Pareto optimal solutions are considered equally acceptable until the user preference is applied.
Multi-objective optimization methods can be divided into four classes based on the user’s preference: no-preference, a priori, a posteriori, and interactive (Luque et al., 2009). In no-preference methods, the user does not indicate their preference often defaulting to equal weight, while a priori, a posteriori, and interactive methods utilize preference information before, after, and iteratively while searching for a solution, respectively (Miettinen, 1999). An a priori method is implemented in this study, where equal weight is assigned to the two objectives before initiating the search. These two objectives are normalized to rectify differences in magnitude and units.
Experimental Setup
Model Development
The model selected for this study was a low-rise building with a parapet wall of variable height as developed in Whiteman et al. (2018). The model was 74.30 cm × 49.53 cm (29.25 × 19.50 in.) in plan with a height of 50.8 cm (20 in.). The parapet height was actively controlled by actuating the outer wall of the model using Nanotec linear stepper motors at each corner of the model, while the inner core of the model remained stationary. This created a constant building size with a parapet wall of variable height, up to 11.43 cm (4.5 in.) model-scale. The model is shown in Figure 4, including the outer wall (vertically movable) and inner model (stationary). Urethane tubing and pressure taps were installed on both the outer and inner sides of the parapet wall. A total thickness of the model parapet wall (and thus outer wall) of 2.54 cm (1 in.) was used. Based on the model dimensions and target design of a two-story office building, a 1:18 model-scale was selected.
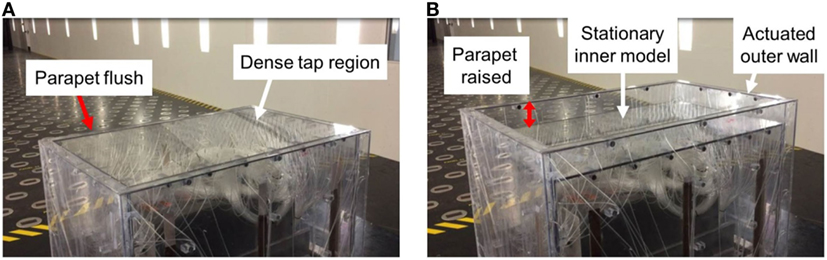
Figure 4. (A) Building model with a flush parapet wall and (B) a raised parapet wall.
Tap Tributary Areas
The pressure measured at each pressure tap was assumed to act over a unique, non-overlapping tributary area on the envelope of the model. Voronoi diagrams derived from Delaunay triangulation were used to calculate the tributary area of each tap (Gierson et al., 2017). This is a reproducible, automated process, important when the envelope shape is changing during optimization. The flattened view of taps and corresponding tributary areas for the model with a parapet height of 11.43 cm (4.50 in.) is illustrated in Figure 5. The approach wind angle is defined as 0° when blowing in the negative y direction in Figure 5, and 90° when blowing in the negative x direction.
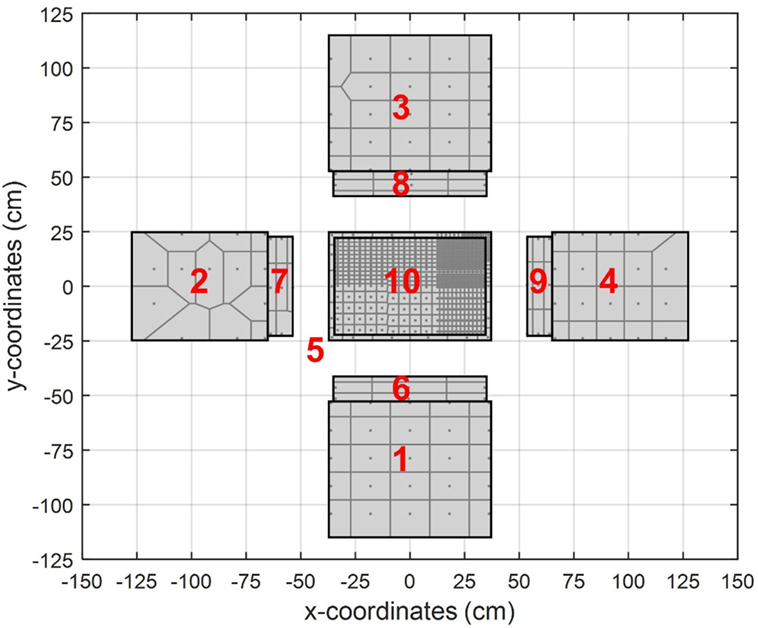
Figure 5. Tap locations, tributary areas, and surface numbers on a flattened representation of the model with a parapet of 11.43 cm.
Surfaces 1 through 4 correspond to the four building walls. Surfaces 6 through 9 are inner parapet surfaces for a parapet height hp > 0. The edges that join the outer parapet surfaces (Surfaces 1–4) and the inner parapet surfaces (Surfaces 6–9) in Figure 5 are physically located at the top of the parapet and separated by the thickness of the parapet. Surfaces 5 and 10 are the top of the parapet wall and the roof, respectively. As the parapet height increased, the tributary areas for both the outer building surface and inner parapet surface increased, while the tributary areas for both the top of the parapet wall and the roof remained constant.
Base Shear Force Calculation
Horizontal base shear forces were calculated for the direction perpendicular to the long building dimension. Synchronous measurements from pressure taps located at the windward, leeward, and parapet walls (Surfaces 1, 3, and 6 and 8 in Figure 5, respectively) were multiplied by the tap tributary areas to obtain local base shear force contributions. The total base shear time history was then obtained from the summation of these forces as follows:
where Bshear(t) is the equivalent full-scale base shear, pi(t) is the recorded pressure time history of tap i, Ai is the tributary area of tap i, n is the total number of taps, λU is the velocity scale, and λL is the length scale (1:18). A full-scale reference mean velocity of 40 m/s was assumed resulting in λU = 3.33 (Uref ~ 12 m/s). The peak base shear was estimated from a Fisher-Tippett Type I (Gumbel) distribution with 50 peaks and a probability of non-exceedance of 78%.
Experimental Configuration
Experiments were conducted in the BLWT located at the UFEF of the NSF’s NHERI program. The BLWT is 6.1 m wide with a 1 m turntable centered along the 6.1 m width and 31.75 m downwind of 8 fans. The fans were kept at a constant 1,050 RPM for all testing, corresponding to a reference height velocity of approximately 12 m/s. The surface pressures on the model building surfaces were measured using Scanivalve ZOC33 (Scanivalve, 2016). The model building installed in the BLWT is shown in Figure 6.
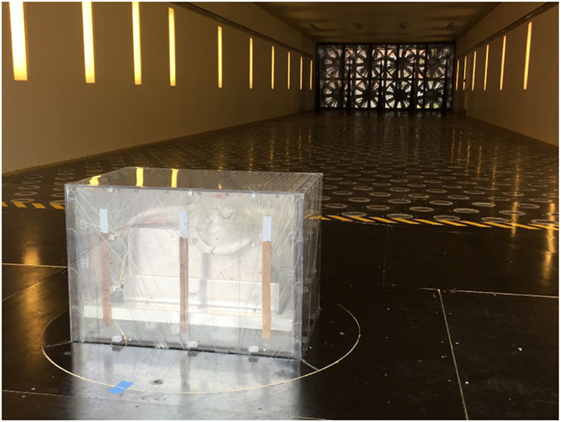
Figure 6. Boundary layer wind tunnel with model low-rise building, upwind view.
Simulation of upwind terrain roughness was performed via the Terraformer, an automated roughness element grid capable of rapidly reconfiguring both the height and orientation of 1,116 roughness elements to achieve specific upwind terrain conditions (Fernández-Cabán and Masters, 2017). For this study, the Terraformer was configured to simulate open terrain for the geometric scale of 1:18. A more detailed description of the simulation of the upwind terrain used throughout this work can be found in Whiteman et al. (2018).
Differential pressures were collected for 120 s and calculated pressure coefficients were referenced to the velocity pressure at the model eave height. The peak maximum and minimum pressure coefficients and were estimated from the time history of each tap pressure using a Fisher-Tippett Type I (Gumbel) distribution with 50 peaks and a probability of non-exceedance of 78% (Cook and Mayne, 1980) as follows:
where is the peak suction of the time history, P0 is the reference (static) pressure, , ρ is the air density, and UH is the mean velocity at parapet height estimated from the mean reference velocity pressure in the freestream (Uref).
Optimization Setup
In this study, three alternative objective functions were considered: (1) minimizing the magnitude of peak suction on the roof, inner parapet walls, and top of the parapet (Surfaces 5–10 in Figure 5), (2) minimizing the magnitude of peak suction and positive pressure on the roof, inner parapet walls, and top of the parapet (Surfaces 5–10 in Figure 5), and (3) minimizing both the magnitude of peak suction on the roof (Surface 10 in Figure 5) and the magnitude of peak base shear (see Base Shear Force Calculation).
As the parapet height increases, the peak suction nominally decreases for the roof surface and top of the parapet wall and increases for the inner parapet wall surfaces. Also, an increase in parapet height increases the peak positive pressure on the roof surface and windward side of the leeward parapet and increases the base shear of the structure. These observations are not comprehensive; however, they include all effects that influenced the optimal design. Critical values were observed for suction, positive pressure, and base shear at approach wind angles of 45, 90, and 0°, respectively. To minimize the number of BLWT runs, based on the objective function each candidate solution was only tested from among the set of angles 0, 45, and 90°. The optimization problem was physically constrained by the model-scale minimum and maximum parapet height of 0 and 11.43 cm (0 and 4.5 in.), respectively. The lower and upper physical bounds of the parapet height were chosen so that the optimal solution was confidently located within the entire search space. The summary of objective functions, surfaces, and approach wind angles considered for this study for both non-stochastic and stochastic algorithms are given in Tables 1 and 2.
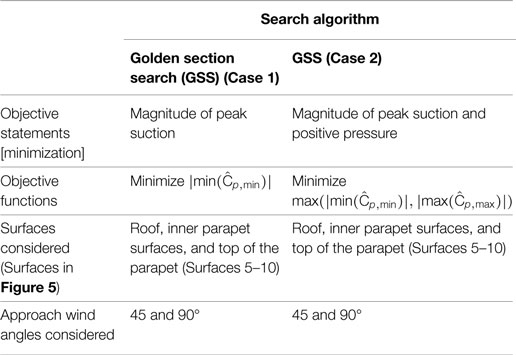
Table 1. Comparison of details of non-stochastic optimization algorithms.
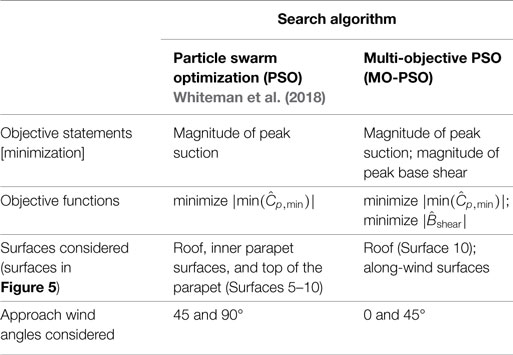
Table 2. Comparison of details of stochastic optimization algorithms.
Single-Objective Optimization: Peak Pressures
Golden Section Search
Single-objective optimization was performed on the model building using GSS integrated into the CPS approach. The model-scale parapet heights were rounded to the nearest 0.0254 cm (0.01 in.), consistent with a full-scale design discretization of 0.457 cm (0.18 in.). A tolerance of 0.00254 cm (0.001 in.) was selected for the GSS algorithm to ensure that the search space converged to a single parapet height. Based on the desired tolerance and Eq. 4, a total of 18 design iterations were performed.
Minimize Peak Suction (Case 1)
Large suction can damage C&C and contribute to windborne debris. Increasing the parapet height will reduce the suction on the roof surface, which is the major benefit of installing parapet walls. At the same time, however, increasing the parapet height will increase the suction on the inner parapet surfaces. This balance creates the design tradeoff explored in Case 1. The objective is selected as a minimization of the maximum magnitude of the peak suction considering the roof, inner parapet surfaces, and the top of the parapet.
Cyber-physical systems optimization was conducted with results summarized in Table 3 and Figure 7. Peak suction values for both GSS intermediate points at each iteration are shown in Table 3. The convergence of the search space toward the optimum height of 7.11 cm (2.80 in.) is shown in Figure 7. The initial domain bounds (iteration 1) were [0, 11.43] cm ([0, 4.50] in.). At iteration 1, the intermediate points produced parapet heights hp of 4.37 cm (1.72 in.) and 7.06 cm (2.78 in.) based on Eqs 1 and 2. The measured of the two intermediate points were 4.71 and 4.24 (Table 3). Since the objective function was to reduce , hp = 7.06 cm (2.78 in.) was a better candidate design than 4.37 cm (1.72 in.). As a result, the domain [0, 4.37] cm was discarded and the domain bounds for the next iteration (iteration 2) became [4.37, 11.43] cm. This procedure was repeated for the maximum number of iterations.

Table 3. Parapet height and for each iteration using golden section search (Case 1).
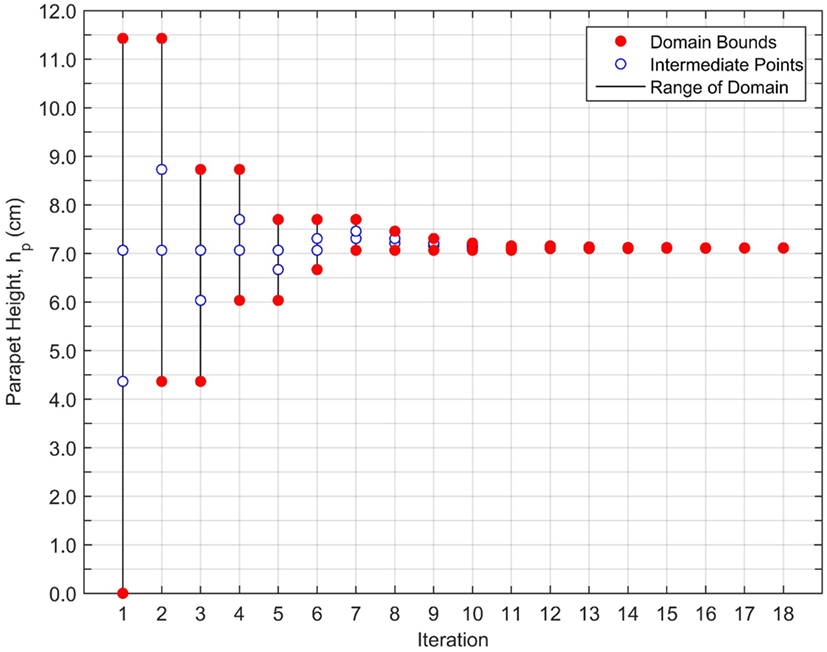
Figure 7. Parapet height iteration history using golden section search (Case 1).
The variability of peak suction due to experimental testing is seen for iterations 12 through 18, as both intermediate points have the same parapet heights for these iterations. Despite being at the same height, the measured for iterations 12 through 18 vary between intermediate points and across iterations. Figures 8 and 9 depict the plot of the values on the envelope of the building for the optimal parapet height at 45 and 90°, respectively. This illustrates the balance in large magnitudes of on the roof and top of the parapet wall (Figure 8) and inner parapet surfaces (Figure 9). Lowering the parapet would increase suction on the roof at 45° while raising the parapet would increase suction on the inner parapet surfaces at 90°. This balance is expected because the suction on the roof, top of the parapet, and inner parapet surface were given equal weight in the objective function. The optimal result corresponds to a full-scale parapet height of 1.28 m (4.20 ft). This parapet height simultaneously minimizes suction on the roof and inner parapet walls. According to the Building Code Requirements for Masonry Structures, the height of structural parapets should not exceed three times their thickness (ACI/ASCE/TMS, 2011). The optimal height found satisfies this limit of 1.37 m (4.50 ft) as applied to the current building.
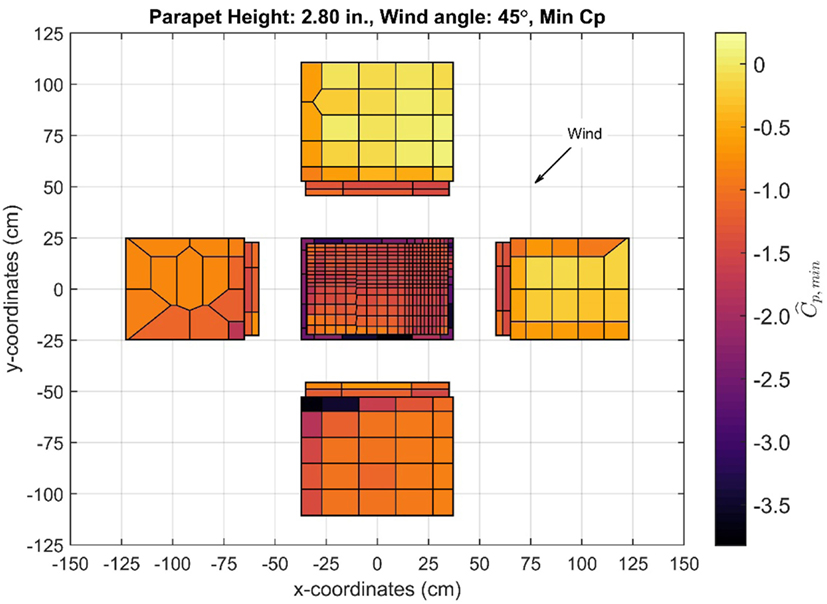
Figure 8. for optimal parapet height, 45° wind angle shown.
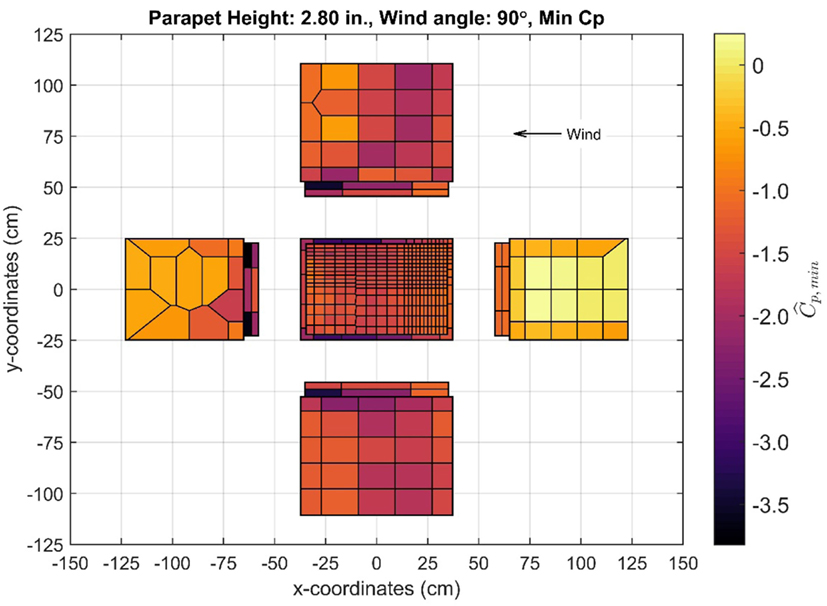
Figure 9. for optimal parapet height, 90° wind angle shown.
Minimize Peak Suction and Positive Pressure (Case 2)
As the parapet height increases, the positive pressure increases for regions of the roof and the windward side of the leeward parapet. Positive pressures on the roof are additive to gravity loads, which can increase the forces on structural members. Positive pressures on the windward side of the leeward parapet wall are additive to the base moment and base shear of the parapet wall and the structure. Formally, the objective of Case 2 is to minimize the maximum magnitude of peak suction and peak positive pressures on the roof, inner parapet surfaces, and top of the parapet. The relative importance of reducing suction versus positive pressure is not considered; they are treated equally.
CPS optimization was conducted with results summarized in Table 4 and Figure 10. The maximum of for both intermediate points at each iteration is shown in Table 4. The convergence of the search space toward the optimum height of 6.88 cm (2.71 in.) is shown in Figure 10. Similar to Case 1, there is variability of the maximum suction due to the experimental testing best seen for iterations 12 through 18. For both angles of 45 and 90°, the peak suction on the surfaces considered is greater in magnitude than the peak positive pressure and, therefore, governs the design. The results for the envelope of peak suction pressures at the optimal parapet height are similar to those of Figures 8 and 9. The optimal height corresponds to a full-scale parapet height of 1.23 m (4.05 ft), which satisfies the limit of 1.37 m (4.50 ft) according to the Building Code Requirements for Masonry Structures as applied to the current building (ACI/ASCE/TMS, 2011).
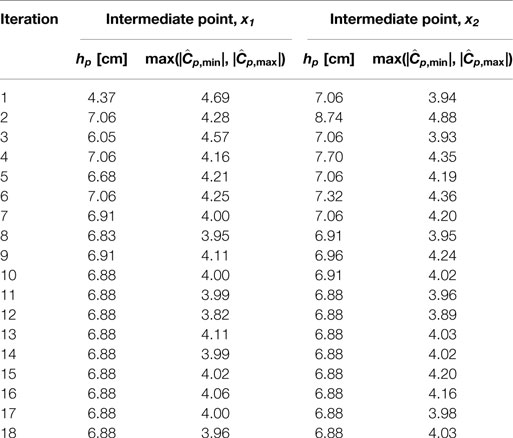
Table 4. Parapet height and for each iteration using golden section search (case 2).
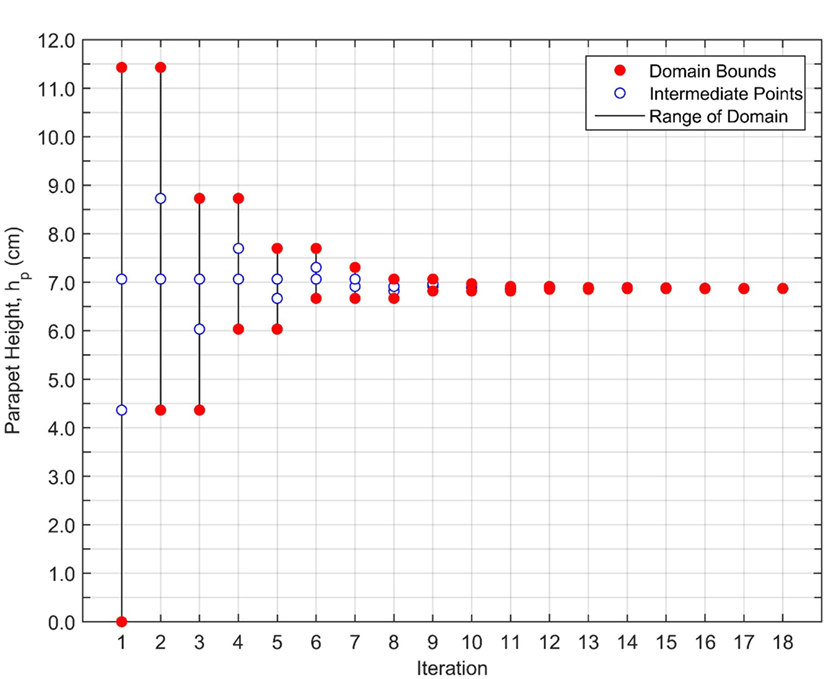
Figure 10. Parapet height iteration history using golden section search (Case 2).
Discussion of Optimization Algorithm Alternatives: GSS versus PSO
The results of the two non-stochastic GSS optimization runs are compared herein to the two stochastic PSO runs reported in Whiteman et al. (2018). Across all four runs, the same phenomenon (peak suction) governed the optimal design, enabling this comparison. The GSS algorithm exhibited faster convergence; 18 iterations with 2 tested parapet heights per iteration were required for the GSS algorithm (total 36 tests). With a relaxation on the final search space size tolerance, the total number of tests could be realistically cut from 36 to 22 (based on Figures 7 and 10). For the PSO algorithm, 13 iterations with 5 tested parapet heights per iteration were required (total 65 tests).
Although the GSS algorithm exhibited faster convergence, there was a higher observed variability with the final optimal values compared to those of the PSO algorithms; optimal heights of 7.11 cm (2.80 in.) and 6.88 cm (2.71 in.) were obtained for the two GSS algorithm optimization runs and 6.83 cm (2.69 in.) and 6.86 cm (2.70 in.) were obtained for the PSO algorithm optimization runs. The difference in optimal solution from run to run is due to the experimental variability in BLWT testing. In the GSS algorithm, although the previous intermediate point which was reused was retested, each test held higher significance in the optimization procedure as it directly affected the search space of the next iteration. The PSO algorithm requires more tested parapet heights per iteration to create the swarm effects and has the same search space for every iteration (i.e., the search space is not iteratively reduced).
Neither the GSS nor PSO algorithm was more difficult to code or implement than the other. There is an observed tradeoff between convergence speed and perceived accuracy (based on repeatability). The type of algorithm which would best be applied to the CPS approach is problem dependent and should be chosen based upon multiple factors, including but not limited to the expectation of local minima, number of design variables, variance in results for repeated tests, and allowable testing time. In particular, the GSS algorithm is not suitable for multiple design variables or a design space with local minima. The PSO algorithm can readily handle optimization problems that are multi-variate, multi-objective, constrained, and with local minima in the solution space. Additionally, PSO is less sensitive to the variability of experimental testing. For its versatility, PSO is selected for the proceeding multi-objective optimization.
Multi-Objective Optimization: Peak Pressure and Base Shear
Multi-objective optimization was performed on the low-rise building using MO-PSO integrated into the CPS. The objective was to determine the optimal parapet height that achieves the best compromise in reducing peak suction on the roof and peak building base shear. The model-scale parapet heights were rounded to the nearest of 0.0254 cm (0.01 in.), consistent with a full-scale design discretization of 0.4572 cm (0.18 in.). Assuming objective functions to both minimize the magnitude of peak suction pressure and minimize the magnitude of peak base shear, the proposed process for determining the cost for each particle at one example iteration is illustrated in Figure 11. Note that 100 particles are used to clearly illustrate the Pareto front. The cost is taken as the normalized distance d of the particle from the intersection of minimums. Particles that are not on the Pareto front are given an arbitrary high cost such that they are ignored, as there is an objectively better solution on the Pareto front. The process is reset at each iteration, only retaining the particle best and global best costs.
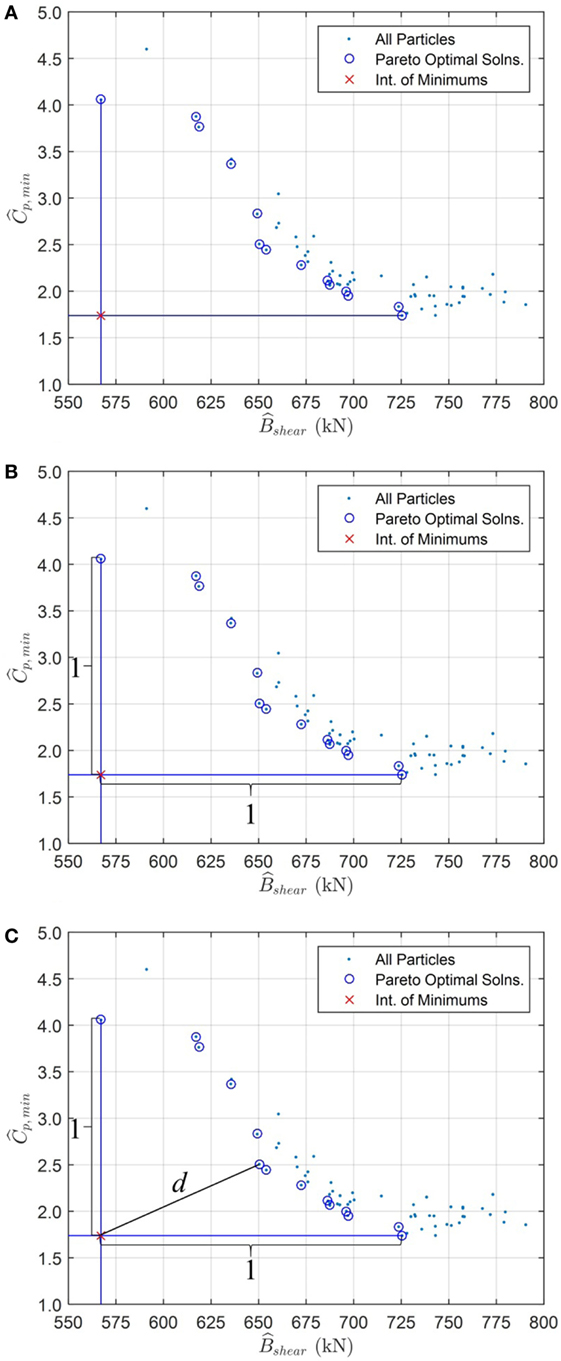
Figure 11. Procedure used for determining particle costs at each iteration. (A) Identify the Pareto front and locate the intersection point of the minimum objective function values. (B) Normalize the distance between the minimum and maximum objective function values. (C) Calculate a particle’s cost as the distance d between the particle and intersection point. Repeat for all particles on the Pareto front.
Multi-Objective PSO
The problem-specific PSO parameters of w, c1, and c2 are all selected as 0.5. These parameter values produced favorable convergence for a simulated (offline) optimization trial using previously recorded data from a preliminary test matrix. Considering the time limits on experimental resources, a balance was needed between sufficient particles to create the PSO swarm effect and sufficient iterations to converge. Additionally, an adequate swarm size was required to create a meaningful Pareto front with multiple Pareto optimal solutions. Based on an estimated 2 min per BLWT run, 1 min to set up the BLWT run, and 2 working days of testing, 15 particles were selected.
The positions of the particles were initially randomly distributed within the pre-defined search space. A total of 10 iterations were conducted for the 15 particles with results summarized in Figure 12. The convergence of the particles toward the optimum height of 4.98 cm (1.96 in.) is shown in Figure 12A. 14 of the 15 particles converged toward the global best cost. The one particle which did not converge is due to the particle being equally attracted to both its personal best cost and the global best cost. The global best cost for each iteration is shown in Figure 12B. Points with both the particle number and the parapet height identified represent an update to the global best cost.
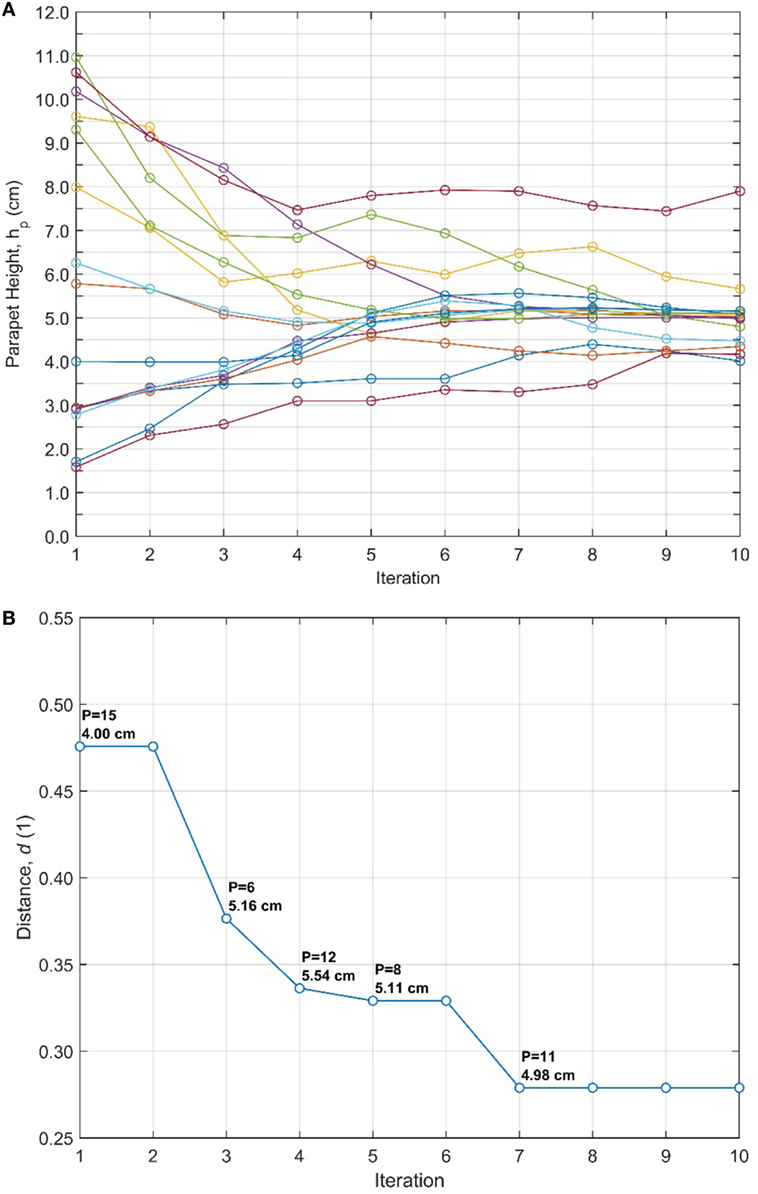
Figure 12. (A) Particle convergence at each iteration and (B) iteration history of global best cost.
Figures 13 and 14 depict the peak suction values on the envelope of the building for the optimal parapet height at 0 and 45°, respectively. For the same height, the maximum peak base shear was 655 kN. Adding the base shear as a design consideration lowered the optimal parapet height in comparison to the single-objective cases due to the tradeoff that is experienced between the decreasing suction on the roof and increasing base shear for an increasing parapet height. Figure 15A illustrates the Pareto front considering all of the candidate designs from all of the iterations for the defined objective functions (magnitude of peak suction and peak base shear), the intersection point of the minimum objective function values, and the solution closest to this intersection point. Figure 15B highlights iteration 7, where the optimal cost is obtained, and shows the corresponding optimal position. The solution obtained by the MO-PSO algorithm at the final iteration (discovered at iteration 7) is identical to the solution considering all evaluated candidate designs over all iterations, indicating successful convergence.
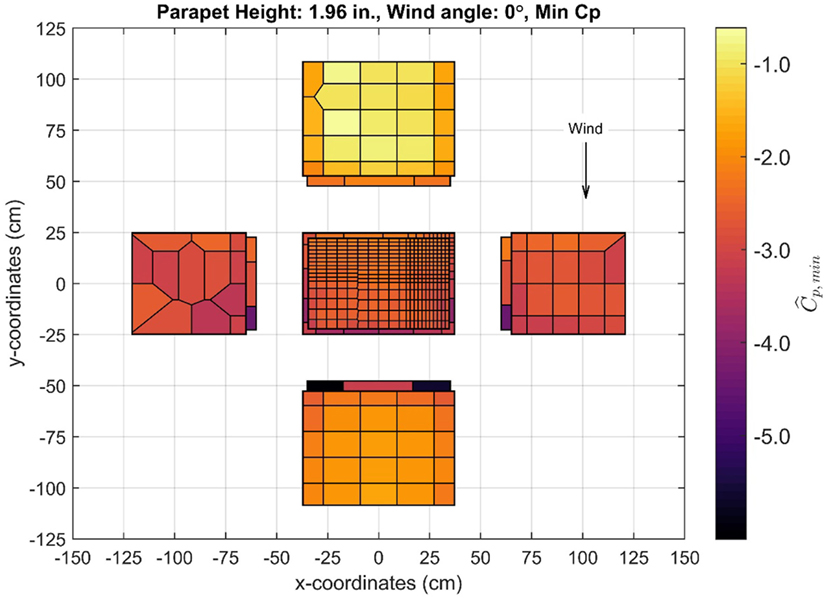
Figure 13. Minimum pressure coefficients for optimal parapet height, 0° wind angle shown.
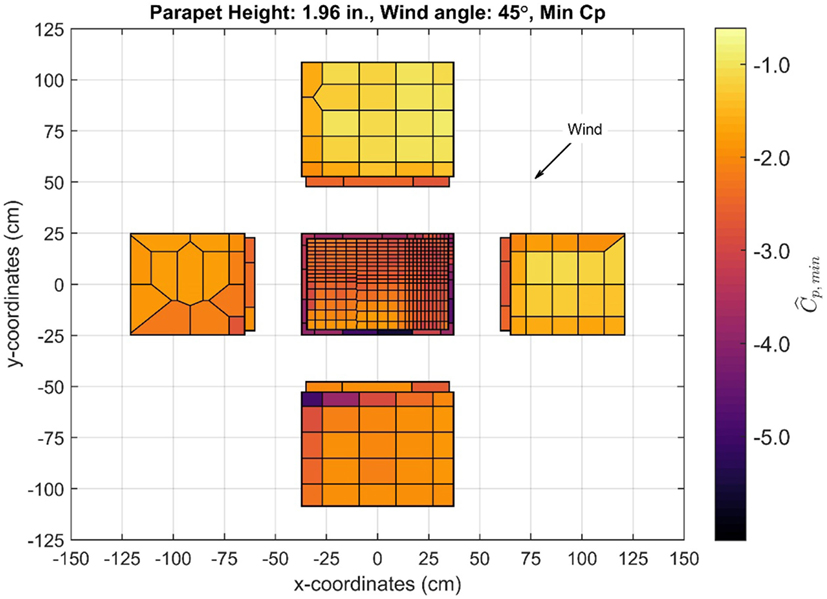
Figure 14. Minimum pressure coefficients for optimal parapet height, 45° wind angle shown.
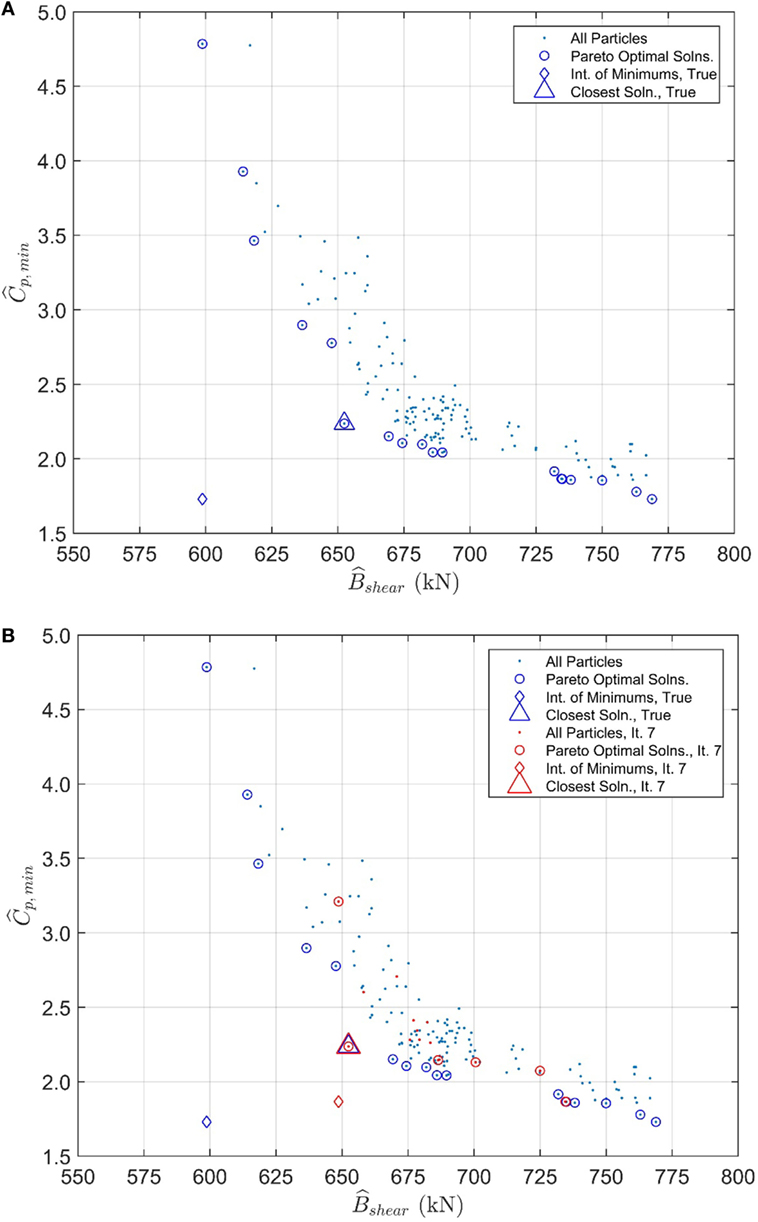
Figure 15. (A) Pareto front curve considering all iterations and (B) highlighting the iteration of global best cost (iteration 7).
The optimal design corresponds to a full-scale parapet height of 0.90 m (2.94 ft) that minimizes peak suction on the roof and inner parapet walls and minimizes the peak base shear of the entire structure. This height satisfies the limit of 1.37 m (4.50 ft) according to the Building Code Requirements for Masonry Structures as applied to the current building (ACI/ASCE/TMS, 2011).
Discussion of Multi-Objective Optimization
In contrast to single-objective optimization, a multi-objective problem formulation requires a user-defined relationship between independent objectives and the use of a Pareto front or another method of ranking candidate designs to obtain the optimal solution. When using a Pareto front, a sufficient population of candidate designs is required for each iteration to create a meaningful Pareto front with multiple Pareto optimal solutions. Therefore, more particles are required as compared to the single-objective case, resulting in more required experimental tests. A multi-objective problem formulation enables the analysis of competing design objectives which cannot be accurately evaluated using single-objective optimization.
Particle swarm optimization and other metaheuristics are well suited for multi-objective optimization. The formulation is problem independent, making it straightforward to include additional objective functions. Additionally, population-based search algorithms, such as PSO, are able to populate a meaningful Pareto front in a single iteration (Zhou et al., 2011). Alternatives, such as gradient-based methods are sensitive to local minima, require continuous design objective functions and are typically more computationally intensive. For the proposed model-in-the-loop approach to optimization, metaheuristic algorithms are better suited to address competing objectives from multiple stakeholders.
Conclusion
This paper explores the use of a CPS “loop-in-the-model” approach to optimally design the envelope and structural system of low-rise buildings subject to wind loads. The CPS approach combines the physical accuracy of wind tunnel testing and efficiency of numerical optimization algorithms to obtain an optimal design. This paper focuses on the application and suitability of non-stochastic, stochastic, and multi-objective optimization algorithms for the CPS approach. The work builds on the proof-of-concept presented in Whiteman et al. (2018)—which employed a stochastic, single-objective optimization algorithm (i.e., PSO)—by applying an efficient non-stochastic, single-objective optimization method (i.e., GSS), and by proposing an approach for multi-objective optimization using CPSs to satisfy multiple stakeholders.
To investigate an efficient algorithm with a fixed convergence rate, the non-stochastic GSS algorithm was applied to minimize peak roof and parapet wall pressures. The GSS-based approach was demonstrated to automatically guide the physical structure to an optimal state based on user-defined objectives and constraints. Based on the objective functions and constraints chosen, optimal parapet heights of 7.11 cm (2.80 in.) model-scale and 1.28 m (4.20 ft) full-scale (Case 1) and 6.88 cm (2.71 in.) model-scale and 1.24 m (4.07 ft) full-scale (Case 2) were found for the low-rise structure studied using the GSS algorithms. These optimal solutions are comparable to those obtained by Whiteman et al. (2018); however, the GSS algorithm reached the solutions with significantly fewer experiments.
Both the C&C and the MWFRS are considered through multi-objective optimization. C&C are significant during extreme windstorms because the failure of a single component can lead to substantial wind and rain intrusion, which can lead to monetary losses or harm to human life. The MWFRS is composed of the primary structural element that ensure structural stability in the transfer of wind loads acting on the entire structure to the foundation. A multi-objective procedure allows for the tradeoff between conflicting objectives to be accurately captured in situations where single-objective procedures would be lacking.
The algorithm selected for multi-objective optimization was PSO; however, the framework is flexible and could be guided by any gradient-based or metaheuristic algorithm. Metaheuristics are applied in this study because they support the straightforward inclusion of additional objective functions and the creation of a meaningful Pareto front from a single iteration. Additionally, metaheuristics enable the discovery of new and non-intuitive designs. The objective functions were chosen as the minimization of peak roof suction and the minimization of the peak building base shear. At each iteration, the Pareto front was used with an a priori method to update the local and global best costs in the PSO algorithm. The optimal parapet height of 4.98 cm (1.96 in.) model-scale and 0.90 m (2.94 ft) full-scale was found for the low-rise structure studied using the MO-PSO algorithm.
The conventional design process for projects requires a lengthy collaboration between designers and commercial wind tunnels to arrive at a cost-effective solution, which may involve the construction of multiple model designs. An instrumented mechatronic model enables the optimal design to be obtained faster than conventional methods without the need to design, create, and financially invest in additional models. The approach can bring together multiple stakeholders to contribute to a unified design with clear balance on competing objectives and a quick turnaround on the corresponding design. Through CPSs, a structural engineer can determine the effects of different architectural or structural features in near real time, creating a more collaborative environment for architects and engineers, a better use of resources, and an objectively optimal design with input from all parties. For example, the multi-objective framework can be applied to tall, aeroelastic models subject to wind loading where architectural decisions are directly tied to structural performance and the usable floor space.
This optimal design is obtained autonomously; candidate designs are physically created and evaluated in a BLWT using a mechatronic model. The numerical analysis of gathered data is used to automatically guide the physical specimen to the optimal state based on user-defined objectives and constraints. The automated design of a structural system under wind loading considering competing objectives is the primary motivation for this study.
Author Contributions
MW and PFC developed the numerical analysis and optimization algorithms used in the CPS approach to optimization. JD and BP developed the cyber infrastructure to link the numerical algorithms with sensors and actuators in the BLWT. MW, PFC, BP, and JD performed the experiments at the UFEF with assistance from lab staff. MW, PFC, and BP drafted the paper with input from the group. FM, JB, and JD provided guidance throughout the research through weekly meetings and collaborated on UFEF development to support the research, in particular with regards to cyber infrastructure.
Conflict of Interest Statement
The authors declare that the research was conducted in the absence of any commercial or financial relationships that could be construed as a potential conflict of interest.
Funding
This material is based upon work supported by the National Science Foundation (NSF) under Grant No. 1636039. Any opinions, findings, and conclusions or recommendations expressed in this material are those of the authors and do not necessarily reflect the views of NSF. The authors also acknowledge the NSF NHERI awardees who contributed to the research results reported within this paper under Grant No. 1520843: Natural Hazards Engineering Research Infrastructure: Experimental Facility with Boundary Layer Wind Tunnel, Wind Load and Dynamic Flow Simulators, and Pressure Loading Actuators (University of Florida) and Grant No. 1520817: Natural Hazards Engineering Research Infrastructure: Cyberinfrastructure (DesignSafe).
References
ACI/ASCE/TMS. (2011). Building Code Requirements and Specification for Masonry Structures: Containing Building Code Requirements for Masonry Structures (TMS 402-11/ACI 530-11/ASCE 5-11), Specification for Mason Structures (TMS 602-11/ACI 530.1-11/ASCE 6-11) and Companion Commentaries/Developed by the Masonry Standards Joint Committee (MSJC). Boulder, Co.: The Masonry Society.
Ali, M. M., and Moon, K. S. (2007). Structural developments in tall buildings: current trends and future prospects. Archit. Sci. Rev. 50, 205–223. doi: 10.3763/asre.2007.5027
ASCE/SEI 7-10. (2010). Minimum Design Loads for Buildings and Other Structures. Reston, VA: American Society of Civil Engineers.
Cook, N. J., and Mayne, J. R. (1980). A refined working approach to the assessment of wind loads for equivalent static design. J. Wind Eng. Ind. Aerodyn. 6, 125–137. doi:10.1016/0167-6105(80)90026-4
Dimig, J., Shield, C., French, C., Bailey, F., and Clark, A. (1999). Effective force testing: a method of seismic simulation for structural testing. J. Struct. Eng. 125, 1028–1037. doi:10.1061/(ASCE)0733-9445(1999)125:9(1028)
Fernández-Cabán, P. L., and Masters, F. J. (2017). Near surface wind longitudinal velocity positively skews with increasing aerodynamic roughness length. J. Wind Eng. Ind. Aerodyn. 169, 94–105. doi:10.1016/j.jweia.2017.06.007
Gavanski, E., Gurley, K. R., and Kopp, G. A. (2016). Uncertainties in the estimation of local peak pressures on low-rise buildings by using the Gumbel distribution fitting approach. J. Struct. Eng. 142, 04016106.
Gierson, M. L., Phillips, B. M., Duthinh, D., and Ayyub, B. M. (2017). Wind-pressure coefficients on low-rise building enclosures using modern wind-tunnel data and Voronoi diagrams. ASCE-ASME J. Risk Uncertainty Eng. Sys. A Civil Eng. 3. doi:10.1061/AJRUA6.0000915
Hakuno, M., Shidawara, M., and Hara, T. (1969). Dynamic destructive test of a cantilever beam controlled by an analog computer. Trans. Japan Soc. Civil Eng. 171, 1–9. (In Japanese).
Kim, S. J., Christenson, R., Phillips, B., and Spencer, B. F. Jr. (2012). “Geographically distributed real-time hybrid simulation of MR dampers for seismic hazard mitigation,” in 20th Analysis and Computation Specialty Conference – Chicago, IL, United States, 382–393.
Kind, R. J. (1988). Worst suctions near edges of flat rooftops with parapets. J. Wind Eng. Ind. Aerodyn. 31, 251–264. doi:10.1016/0167-6105(88)90007-4
Kopp, G. A., Surry, D., and Mans, C. (2005a). Wind effects of parapets on low buildings: Part 2. Structural loads. J. Wind Eng. Ind. Aerodyn. 93, 843–855. doi:10.1016/j.jweia.2005.08.004
Kopp, G. A., Surry, D., and Mans, C. (2005b). Wind effects of parapets on low buildings: Part 4. Mitigation of corner loads with alternative geometries. J. Wind Eng. Ind. Aerodyn. 93, 873–888. doi:10.1016/j.jweia.2005.08.004
Luenberger, D. G., and Ye, Y. (1984). Linear and Nonlinear Programming, Vol. 2. Reading, MA: Addison-wesley.
Luque, M., Miettinen, K., Eskelinen, P., and Ruiz, F. (2009). Incorporating preference information in interactive reference point methods for multiobjective optimization. Omega 37, 450–462. doi:10.1016/j.omega.2007.06.001
Mans, C., Kopp, G. A., and Surry, D. (2005). Wind effects of parapets on low buildings: Part 3. Parapet loads. J. Wind Eng. Ind. Aerodyn. 93, 857–872. doi:10.1016/j.jweia.2005.08.007
Miettinen, K. M. (1999). Nonlinear Multiobjective Optimization. Boston, MA: Kluwer Academic Publishers.
Nakashima, M., and Masaoka, N. (1999). Real-time on-line test for MDOF systems. Earthquake Eng. Struct. Dyn. 28, 393–420. doi:10.1002/(SICI)1096-9845(199904)28:4<393::AID-EQE823>3.0.CO;2-C
Nazareth, L., and Tseng, P. (2002). Gilding the lily: a variant of the Nelder-Mead algorithm based on golden-section search. Comput. Optim. Appl. 22, 133–144. doi:10.1023/A:1014842520519
Perez, R. E., and Behdinan, K. (2007). Particle swarm optimization in structural design. Swarm Intell. Focus on Ant and Part Swarm Optim. 373–377. doi:10.5772/5114
Pindado, S., and Meseguer, J. (2003). Wind tunnel study on the influence of different parapets on the roof pressure distribution of low-rise buildings. J. Wind Eng. Ind. Aerodyn. 91, 1133–1139. doi:10.1016/S0167-6105(03)00055-2
Scanivalve. (2016). ZOC33 Miniature Pressure Scanner. Available at: http://scanivalve.com/products/pressure-measurement/miniature-analog-pressure-scanners/zoc33-miniature-pressure-scanner/ (accessed December 15, 2016).
Shi, Y., and Eberhart, R. (1998). “A modified particle swarm optimizer,” in IEEE International Conference on Evolutionary Computation Proceedings. IEEE World Congress on Computational Intelligence (Cat. No.98TH8360) – Anchorage, AK, United States, 69–73.
Shing, P. B., and Mahin, S. A. (1984). “Pseudodynamic test method for seismic performance evaluation: theory and implementation,” in UCB/EERC-84/01, Earthquake Engineering Research Center. Technical Report. (Berkeley, CA: University of California).
Stathopoulos, T., Saathoff, P., and Du, X. (2002). Wind loads on parapets. J. Wind Eng. Ind. Aerodyn. 90, 503–514. doi:10.1016/S0167-6105(01)00206-9
Stojadinovic, B., Mosqueda, G., and Mahin, S. A. (2006). Event-driven control system for geographically distributed hybrid simulation. J. Struct. Eng. 132, 68–77. doi:10.1061/(ASCE)0733-9445(2006)132:1(68)
Takahashi, K., and Nakamura, M. (1987). Japanese activities on on-line testing. J. Eng. Mech. 113, 1014–1032. doi:10.1061/(ASCE)0733-9399(1987)113:7(1014)
Whiteman, M. L., Phillips, B. M., Fernández-Cabán, P. L., Masters, F. J., Bridge, J. A., and Davis, J. R. (2018). Optimal design of structures using cyber-physical wind tunnel experiments with mechatronic models. J. Wind Eng. Ind. Aerodyn. 172, 441–452. doi:10.1016/j.jweia.2017.11.013
Keywords: cyber-physical systems, mechatronic, optimization, multi-objective optimization, boundary layer wind tunnel, parapet, University of Florida Experimental Facility, Natural Hazard Engineering Research Infrastructure (NHERI)
Citation: Whiteman ML, Fernández-Cabán PL, Phillips BM, Masters FJ, Bridge JA and Davis JR (2018) Multi-Objective Optimal Design of a Building Envelope and Structural System Using Cyber-Physical Modeling in a Wind Tunnel. Front. Built Environ. 4:13. doi: 10.3389/fbuil.2018.00013
Received: 19 December 2017; Accepted: 16 February 2018;
Published: 22 March 2018
Edited by:
Gregory Alan Kopp, University of Western Ontario, CanadaReviewed by:
Mohammadtaghi Moravej, Florida International University, United StatesIlaria Venanzi, University of Perugia, Italy
Copyright: © 2018 Whiteman, Fernández-Cabán, Phillips, Masters, Bridge and Davis. This is an open-access article distributed under the terms of the Creative Commons Attribution License (CC BY). The use, distribution or reproduction in other forums is permitted, provided the original author(s) and the copyright owner are credited and that the original publication in this journal is cited, in accordance with accepted academic practice. No use, distribution or reproduction is permitted which does not comply with these terms.
*Correspondence: Brian M. Phillips, YnBoaWxsaUB1bWQuZWR1