 Yaojun Ge1*
 Jinlin Xia
 Lin Zhao
- 1State Key Laboratory of Disaster Reduction in Civil Engineering, Tongji University, Shanghai, China
- 2Boundary Layer Wind Tunnel Laboratory, Faculty of Engineering, University of Western Ontario, London, ON, Canada
This paper presents an experimental investigation on wind-induced vibrations of a suspension bridge with ultimate main span length, including flutter and buffeting. Since the upper limit of a suspension bridge's main span can reach more than 5,000 m based on strength and weight of steel main cables, a feasible prototype with a span arrangement of 2,000 + 5,000 + 2,000 m has been proposed. In order to improve flutter stability, a twin box girder has been designed with a 40 m slot in center and two 20 m wide decks suspended by four main cables. Its full aeroelastic model was designed and manufactured with the geometrical scale of 1:620, and the wind tunnel testing was carried out under smooth flows and turbulent flows for different angles of attack. A big difference in critical flutter speed was found between the proposed slotted girder and corresponding slot-sealed girder, which verifies the necessity of a widely-slotted (WS) twin box girder for a super-long suspension bridge. Among three angles of attack, the critical flutter speed under smooth flow has the maximum value of 80.9 m/s at −3° and the minimum value of 51.4 m/s at 3°. On-coming turbulence will not only cause buffeting responses but also influence the critical flutter speed in an unfavorable way.
Introduction
Although ancient suspension bridges were built in China long before the Anno Domini, the construction of modern suspension bridges around the world has experienced a considerable development since 1883, when the first modern suspension bridge, Brooklyn Bridge, was built. It took about 48 years for the span length of suspension bridges to grow from 486 m of Brooklyn Bridge to 1,067 m of George Washington Bridge in 1931, as the first bridge with a span length over 1,000 m, and had a great increase factor of 2.2. Though the further increase in the next 50 years to Golden Gate Bridge of 1,280 m, Verrazano Bridge of 1,298 m and Humber Bridge of 1,410 m in 1981 was only 1.3, another factor around 1.4 was realized in Akashi Kaikyo Bridge with a 1,991 m span greater than that of Great Belt Bridge within 17 years in 1998. In the past two decades, there is no further increase of span length, but many long-span suspension bridges have been built over the world. Table 1 shows ten longest span suspension bridges in service.
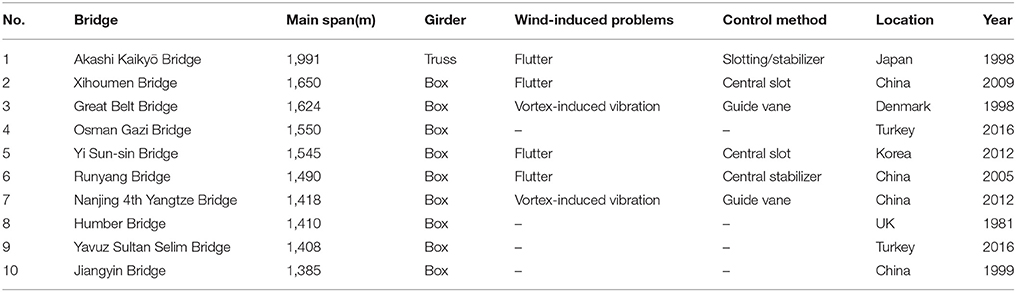
Table 1. Ten longest span suspension bridges in the world.
With the ever-growing span length, suspension bridges are becoming longer, lighter and more flexible, and accordingly results in wind-induced vibrations, in particular flutter (four bridges in Table 1) and vortex-induced vibration (VIV) (two bridges in Table 1). Soon after the infamous incident of Tacoma Narrows Bridge in 1940, there were attempts to examine bridge's wind-induced vibration as something similar to an airfoil flutter. Depending on the participating modes during oscillation, bridge's flutter can be divided into two-degree coupled classical flutter and single-degree torsional flutter (Simiu and Scanlan, 1996). The former implies an aeroelastic phenomenon in which two degrees of freedom, torsional and vertical, couple together in a flow-driven and unstable oscillation, while the later flutter can be associated with systems undergoing strongly separated flows. With a bluff or non-streamlined girder, a suspension bridge can in various instances exhibit this torsional instability. Another ultimate state for long bridges is aerostatic torsional buckling or divergence. This phenomenon is more like a wind-induced static instability. As wind speed increases, the twisting moment increases as well, which requires additional structural resistance. Once structure cannot provide enough reactive moment as expected, it will creates an unstable condition and the bridge will diverge (Simiu and Scanlan, 1996). Torsional divergence was firstly observed on cable-stayed bridges. During the full aeroelastic model testing of a suspension bridge, Hirai et al. (1996) found this instability could also occur under the action of aerostatic wind loads on suspension bridges.
In the view of reliability, wind tunnel testing is the best choice to check the aerodynamics and aeroelastics of long-span bridges. Bridge's wind tunnel testing can mainly be classified into three types according to model's dimension, namely, sectional model testing (Scanlan, 1978), taut strip model testing (Tanaka and Davenport, 1982; Scanlan et al., 1997) and full aeroelastic model testing (Sato et al., 2002).
Figure 1 shows the layout of sectional model testing. A rigid sectional model with high stiffness and a reduced scale is often built to simulate a typical girder section, and is mounted with several springs under wind flow (Scanlan, 1978). Either accelerometers or laser sensors (the red lines in Figure 1) can be used to record displacement signals. With strip assumption, a sectional model testing is a common technique to measure wind-induced responses of a bridge girder on account of its convenience and low-cost. However, this 2D model testing can only simulate a torsional mode and a vertical one. For a suspension bridge with a conventional span and cable system, the result from a sectional model testing is credible since flutter is normally excited by a fundamental torsional mode and a fundamental vertical mode.
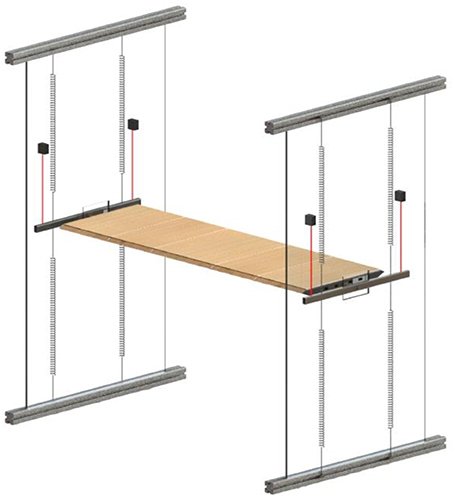
Figure 1. Configuration of a sectional model.
A taut strip model testing shown in Figure 2 is a transition from sectional model testing to full aeroelastic model testing. The first taut strip model was proposed in 1960s in order to consider three dimensional effect but simplify cable system's simulation. A set of sectional segments are suspended by two cables, of which the tension force can provide overall stiffness. This unique way of stiffness simulation makes the model design empiric. In contrast, a full aeroelastic model testing holds the best similarity as its ability for several natural frequencies and modal shapes. Meanwhile, it can also model the interference of pylons, cable system and piers. The disadvantages of high expenses and time cost impede its wider use.
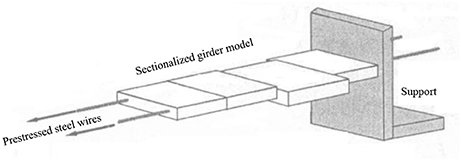
Figure 2. Configuration of a taut strip model.
A suspension bridge's mechanical advantage makes it possible to become the longest bridge type among girder, arch, cable-stayed and suspension bridges. Based on steel main cables, Ge and Xiang (2006, 2008) proposed the ultimate main span of suspension bridges is around 5,000–5,900 m. The sectional model testing (Shao et al., 2011) of a 5,000 m suspension bridge showed the benefit of a central-slotted girder toward flutter performance. As a more comprehensive and precise study in present research, full aeroelastic model testing has been carried out to examine wind-induced vibrations of a suspension bridge with the span arrangement of 2,000 + 5,000 + 2,000 m. The full-bridge aeroelastic model was designed and manufactured with a geometrical scale of 1:620, and wind tunnel testing was finished under smooth flow with different angles of attack and turbulent flow in TJ-3 Boundary Layer Wind Tunnel, which is 15 m wide, 2 m high, and 14 m long.
5,000 m Spanned Suspension Bridge
Span Arrangement
The longest suspension bridge in service is the 1,991 m Akashi-Kaikyo Bridge in Japan since 1998 (Katsuchi et al., 1998), and the longest under construction is the 3,300 m Messina Strait Bridge (Brancaleoni and Diana, 1993) although the construction has been suspended since 2010.
Theoretically, the ultimate span length for a suspension bridge depends upon the strength and weight of main cables which are generally made of high-strength steel wires. By assuming the curve of steel main cables to be parabolic, the span length L can be expressed by the following inequality (Xiang and Ge, 2003),
where n: sag-span ratio of cables; σa: steel cable strength; A: area of steel cables; wc: cable's weight; ws: total loads including dead loads and live loads. Since for a typical suspension bridge, the stiffening girder only sustains the load between two suspenders, its stiffness and mass remain constants for different spans so that the mass of main cable will be dominant for a super-long case. To make things simpler for an ultimate case, the ratio of ws/wc is assumed to be zero and the ultimate span L∞ with steel main cables can be estimated as follows,
Taking as a typical sag-span ratio of 1/10 in Equation (2), if the load ratio of ws/wc is designed between 0.5 and 0.25, the central span can be enlarged up to 5,000 and 6,000 m respectively, considering the material properties of steel cables (Xiang and Ge, 2003). As another primary factor, the side span length is set to be 2,000 m for the matching of cable's area in central span and in side span. Consequently, the span arrangement of present super-long suspension bridge goes to be 2,000 + 5,000 + 2,000 m as shown in Figure 3.
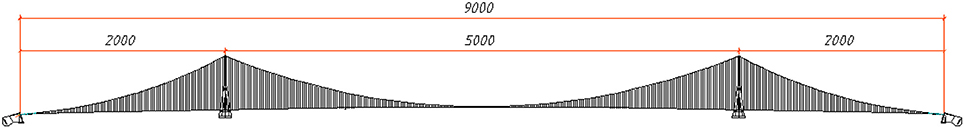
Figure 3. Layout of the investigated bridge (unit: meter).
Cross Section of Stiffening Girder
With the increase of span length, suspension bridges will have less stiffness and lower critical speeds for aerodynamic flutter instability and aerostatic torsional divergence. The analysis (Ogawa et al., 2002) of a 2,500 m-spanned bridge shows that, a twin-box girder can improve flutter performance by raising the critical speed from 80.9 to 98.9 m/s. Another example of Xihoumen Bridge (Lu et al., 2005) indicates the critical flutter speed can increase from 45.8 to 88.4 m/s when a central-slotted twin box girder, instead of a single box one, is employed. It is evident that a suitable slotting-ratio of a cross section will improve the flutter performance.
Based on previous investigations including numerical simulations (Ge and Xiang, 2006, 2008) and a sectional model testing (Shao et al., 2011) for two kinds of deck sections, called widely-slotted (WS) girder with four main cables and narrowly-slotted (NS) girder with vertical and horizontal stabilizers, the WS girder has greater critical flutter speeds than the NS one. Therefore, the WS box girder was chosen for presentinvestigation, and the cross section was simplified as the 40 m central slot and two 20 m wide boxes in both sides as is in Figure 4 (Ge and Xiang, 2006, 2008).

Figure 4. Cross section of stiffening girder (unit: meter).
Area of Main Cable
In order to select an appropriate cable area, the minimum value according to static requirement can be estimated as,
where γ is the linear density of cable and L∞ can be yielded by Equation (2) (Ge and Xiang, 2009).
With a main span of 5,000 m and a sag-span ratio of 1/10, the expected cable area is 9.066 m2 after taking a safety factor of 2.0. If two cables are employed, the diameter of one cable will exceed 2.5 m, which tends to bring significant secondary stress. On the other hand, a two-main-cable design means the transverse span length is around 80 m, which complicates the lateral stress analysis. Accordingly, four main cables have been employed and the area of one cable is 1.872 m2.
Design and Set-up of a Full Model
Dynamic Similarity and Scale Ratio
Dynamic similarity means the balance of dynamic force. As for viscous force and inertial force, the wind tunnel testing must have a same Reynolds Number with real bridges. However, the flow density and gravitational acceleration are unchangeable both in wind tunnel and in real cases, which indicates the similarity of Froude Number and Reynolds Number will contradict with each other. Unlike a circular cylinder whose flow pattern is varying, the separation points of a practical bridge section are fixed at corners so that its Reynolds Number effect is of secondary importance. Froude Number, as the ratio of the flow inertia to the external gravitational field, becomes more decisive than Reynolds Number since the overall stiffness of a suspension bridge is dominated by gravity instead of element's stiffness. Hence, more attentions will be paid toward Froude Number's similarity while Reynolds Number is not strictly modeled.
Nondimensionalization of Navier-Stokes equations shows that for a geometrically similar bodies in different fluid with different magnitude velocities and different size must yield forces of fixed ratio at a geometrically similar point. Hence, the design of an aeroelastic model should first simulate the geometry of full-scale bridge as well as the incoming flow conditions. The geometrical scale ratio is determined by the space of wind tunnel and accessibility of steel wire. For instance, the scale ratio of Xihoumen Bridge was assigned to 1:208 resulting from a 0.5 mm diameter of steel wire (Ge et al., 2003). The total length of present bridge is 9,000 m while the width of wind tunnel is 15 m, so that the geometrical scale ratio must be smaller than 1:600. The only alternative of steel wire is 0.1 mm in diameter. The geometrical scale ratio of present model was consequently determined to be 1:620 and the ratios for other properties could be yielded as Table 2. In particular, when Reynolds Number is not strictly modeled, the scale ratio of wind speed for a cable-stayed bridge is adjustable while unchangeable for a suspension bridge because of Froude Number.
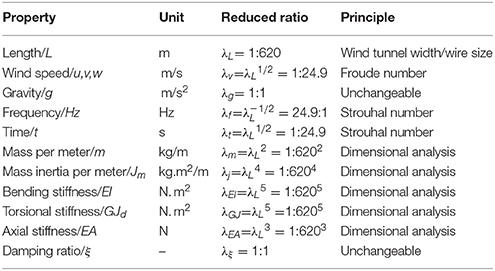
Table 2. Reduced ratios for different properties.
Design of Main Elements
Figure 5 is an overview of a suspension bridge model which consists of stiffening girder, cable system, constraints and pylons. Based on the similarity of structural dynamic characteristics and wind load, the design of each elements can be divided into a stiffness sub-system, an appearance sub-system and a mass sub-system. A suspension bridge's pylon is similar with that of a cable-stayed bridge, which wouldn't been discussed in following parts.
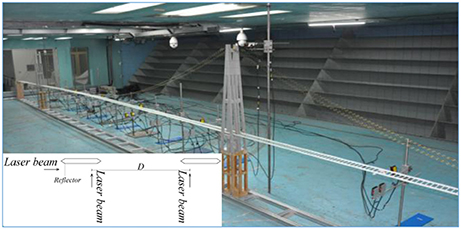
Figure 5. Overview of the full bridge model.
Stiffening Girder
Unlike a cable-stayed bridge's girder which is an axial and bending stress component, the axial stress in a suspension bridge's stiffening girder can be neglected. As a result, it's acceptable to simulate vertical, lateral and torsional stiffness but leave axial stiffnes's dissimilar. The self-consistency of three independent equations requires three feature sizes, which leads U-steel or T-steel to be a practical choice for stiffness simulation. However, for a section like Figure 4, it is better to use two throughout steel bars located at the center of each box and join them transversely. On account of the ultra-small scale ratio, the feature sizes will be smaller than 0.2 mm for a U-steel or T-steel, and the machine precision is challenged. Further trials showed that the stiffness of girder itself is not so dominant for overall stiffness, so that the section of each steel bar was simplified to be a rectangle of 2.1 × 0.4 mm. Aluminum cross bars (2.3 × 0.5 mm) were employed to join two throughout steel bars by small holes and glues (Figure 6).
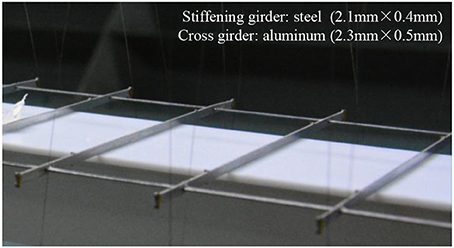
Figure 6. Stiffness system of stiffening girder.
The appearance design requires the accurate simulation of girder's outline. To ensure the throughout steel bars are the only stiffness suppliers, other elements were gapped longitudinally (Figure 7). The section was covered by extreme thin acrylonitrile butadiene styrene (ABS) plates (thickness: 0.2 mm) to get a smooth surface. The filling material between steel girder and ABS cover was selected to be extruded polystyrene foam (XPS), of which the density was around 0.03 g/cm3. The white sheet under the central slot in Figure 7 is an additional support which will be removed later.
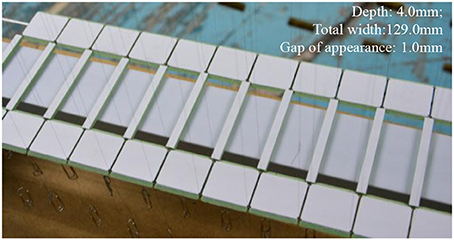
Figure 7. Appearance of stiffening girder.
The mass and the mass moment of inertia provided by stiffness sub-system and appearance sub-system turned out to be smaller than expected. A conventional way to remedy this difference is to place additional mass inside. From a practical view, 4 plumbum wires were inserted into foam symmetrically (Figure 8). The locations and diameters of plumbum wires require a detailed calculation aiming at the simultaneous simulation of mass and mass moment.
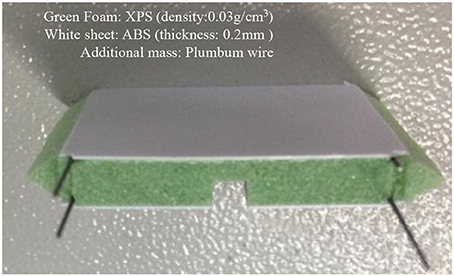
Figure 8. Mass system of stiffening girder.
Cable System
The modeling of cable system, viz., main cable and suspenders, was in a similar way. The diameter of main cable was 0.1 mm as a result of axial stiffnes's similarity. Suspender's size was not a control factor but would be more reasonable to be smaller than that of main cable. As the inaccessibility for a smaller size, same kind of wire was used for suspenders.
Mass moment of inertia can be ignored because of its limited influence. Only drag force's similarity was considered. The insufficient mass and drag force could be modified by additional brass tubes on main cables. For a more accurate design, brass tubes should be placed both on main cables and suspenders. In present situation, all the insufficiency was remedied using the tubes on main cables. Two parameters at each node should be decided, namely brass tube's diameter and length. Assuming the drag coefficient of real cable to be 0.5 and of brass tube to be 1.0, Equations (4) aiming at drag similarity and mass similarity can determine brass tube's configuration.
In Equations (4), Lp and Dp are reference length and diameter of real cable segment, while Lb and Db are those of brass tubes; mp_cable and mp_suspender are the real mass of main cables and suspenders at each node; ρ is density of brass tube; mm_cable and mm_suspender are model mass of main cables and suspenders.
Figure 9 shows the configuration of brass tube and white bar was used during model erection to ensure brass tube's parallelism. The main challenge for present model was the ultra-small scale ratio and massive elements. A diameter of 0.1 mm makes the cable vulnerable to get cracked. It would be a prolonged work to replace a new wire since one wire is connected to more than 400 brass tubes and suspenders. The connection of wires with other elements was a vital topic. The top of Figure 9 is a sketch explaining the method employed: A very small tube was first fixed to main cable by glue and then the top of a suspender was inserted into another larger tube through a hole at bottom. By embedding the smaller tube into the larger one, a joint was finished with some glues. Considering the initial deformation and bending, the steel wires were manually straightened by short time electricity.
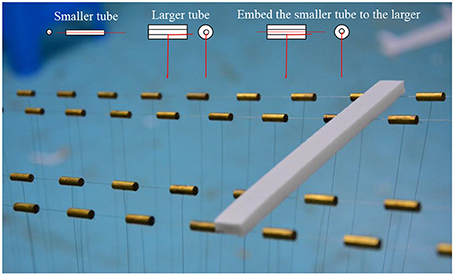
Figure 9. Cable system and joints.
Constraints and Joints
The girder was mainly supported by cable system. Besides, it was connected to pylons with some constraints. A sophisticated design of constraints is decisive to the simulation of dynamic characteristics. Due to model's small size, special holders and support rollers (Figure 10) were designed to couple the displacements of pylon and girder. The holder and support rollers were fixed on girder and pylons respectively. By embedding the roller into the groove of holder, the torsional, vertical, and lateral displacements were coupled while longitudinal degree was free.

Figure 10. Constraints at pylon.
Another important thing was the transition of main cable at the top of pylon and anchor. A bent flared tiny brass tube was mounted at the top to avoid sharp angle (Figure 11). A traditional anchor at end for main cable is based on a clamp, which makes the steel wire suffer from shear force or extruding force. In order to make the tension force adjustable and avoid hurt to main cable, a new anchor was developed (Figure 12). With a repetitive twine on the anchor and additional glue, the steel wire could be fixed by friction.
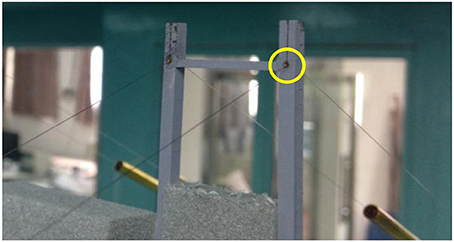
Figure 11. Transition at pylon.
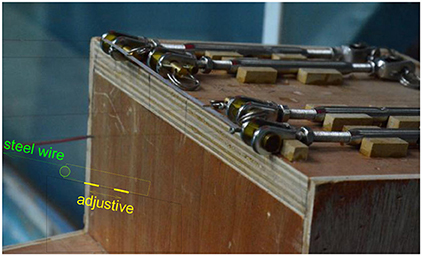
Figure 12. Anchors at end.
Attack Angle's Adjustment
Aerodynamic stability is usually more unfavorable under a non-zero attack angle. It is easy to rotate the model in a sectional model testing. For cable-stayed bridge's full aeroelastic model, a liftable pedestal can realize the changing the attack angle. As a result of gravitational stiffness (Hayashikawa, 1997), only the upstream direction can be changed instead of model's pitch attitude. When slope plates are placed under the model to get an inclined flow, a slop of 3° may not bring an attack angle of 3° exactly. A preliminary study based on computational fluid dynamics (CFD) is advised before the wind tunnel testing.
Figure 13 is an example to determine the size and location of slope where horizontal wind velocity is presented by contour. Wind tunnel's height is 2.0 m and length is 14.0 m. By adjusting the location of slop plates, the attack angle at bridge deck could be guaranteed from ± 3.05 to ± 2.95° (Figure 14). This result has been experimental verified in an empty wind tunnel with slope plates. Things are similar for other attack angles.
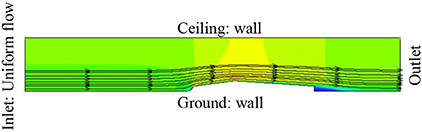
Figure 13. CFD simulation of whole wind tunnel.
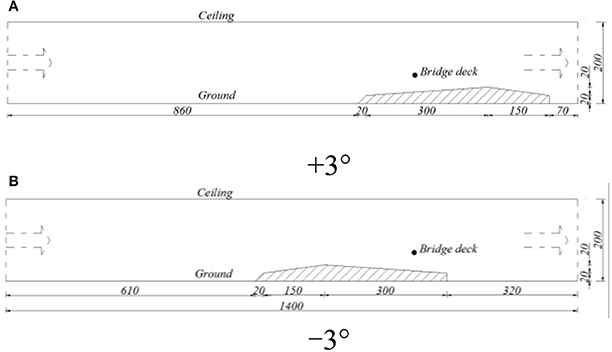
Figure 14. Configuration of slope in wind tunnel (unit: cm). (A) +3°. (B) −3°.
Configurations of Sensors
Both accelerometers and laser sensors can be used for displacement measurement in a sectional model testing. However, the mass of accelerometer is a non-negligible encumbrance for a full aeroelastic model. Laser sensors, as a contactless device, will be more satisfying. When the number of laser sensors is limited, it is a tough work to test the free-vibration features since the difficulty in judging movement's symmetry. The data at mid-span can only recognize symmetric modes. A correct identification of both symmetric and anti-symmetric modes requires the synchronous recording at different span-wise locations. An adequate observation points can also realize the measurement of vibration shapes excited by wind load.
Considering the specificity of present model, it would be worthwhile to record the displacements at different span-wise locations for further analysis of modal participation during oscillation. The total number of observation points in main span was nine with an equal space interval and in each side span, one observation point was set at middle (Figure 15). The displacement at the top of pylon was also recorded by two orthogonal sensors.
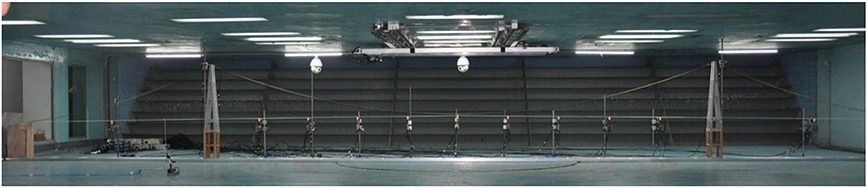
Figure 15. Setting of laser sensors.
The measurement of girder's torsional, vertical and lateral movement requires three sensors at one observation point. The setting of laser sensors at a certain location can be seen from Figure 5: two laser beams were installed vertically, which can realize vertical displacement's and twist angle's testing. The recording of lateral displacement needs an additional reflector while the XPS cover of girder could act this role for vertical laser beams. The HL-G112-S-J laser sensors used have a resolution of 8 μm.
Wind Tunnel Testing and Result
Case List
Bridge's wind-induced response can be classified into stabilized oscillation and aerodynamic instability based on phenomenon. The former oscillation involves turbulence-induced buffeting and VIV. Since these kind of oscillations will bring about some fatigue problems but no overturn, it holds a secondary importance. Meanwhile, a 1:620 scale ratio for VIV investigation is not convictive as VIV is a result of vortex shedding and Reynolds effect is predominant. Therefore, VIV will not be discussed in present research. Both torsional divergence and flutter can cause the collapse of overall structure. Since their analyzing methods are quite different with each other, it is helpful to figure out whether the ultimate state of a super-long suspension bridge is controlled by torsional divergence or flutter.
When all the elements, including 4 main cables, more than 1,700 suspenders and cross bars, were jointed with each other, the additional supports was be removed (Figure 15). The first step of a wind tunnel testing is the identification of free-vibration characteristics like natural frequencies and damping ratios. After confirming the structural dynamics, the wind-induced responses both in uniform flows and turbulence were recorded. The combination of turbulence generators and slope plates was hard to guarantee the wind profile and turbulence intensity simultaneously, so that only the intensity at deck height was simulated in present case.
Since the mechanism of Tacoma Bridge's collapse is normally regarded to be flutter of antisymmetric modes (Billah and Scanlan, 1991), it became an engineering recognition to make the anti-symmetric torsional frequency higher than a symmetric one. Some previous researches show the anti-symmetric torsional frequency tends to be lower than symmetric one when the main span exceeds 2,000 m. Located at mid-span, a central buckle (Wang et al., 2006) can provide additional constraint and raise anti-symmetric frequencies. As a comparison, a central buckle has been set as Figure 16 and the natural frequencies with or without a central buckle have been recorded.
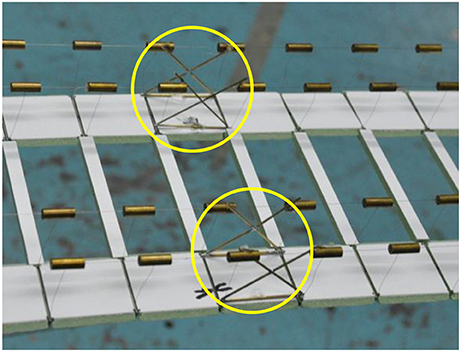
Figure 16. Central buckle.
Table 3 is a list of cases that have been tested. In order to prove the necessity of a central-slotted section, the critical flutter wind speed when slot was sealed using tape has also been recorded.
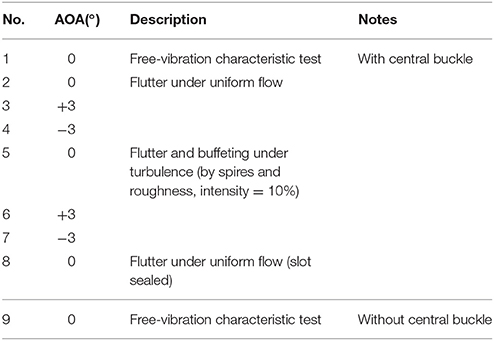
Table 3. Case list for wind tunnel test.
Free-Vibration Characteristics
Different types of excitation can be used for free-vibration testing, namely manual excitation, low wind excitation and environmental stochastic excitation (Natke, 1982). The small wind ratio (1:24.9) in present case means a low wind speed would add non-negligible load on the real bridge. Therefore, the model was excited manually at different span-wise points. Displacement signals after short-time impulse were recorded simultaneously at observation points. After analyzing the amplitude spectrums and phase spectrums, the modal shapes for predominant frequencies can be calculated. Table 4 is the modal shapes for the structure with a central buckle. The damping ratio remains 0.5–1.0% for different modes and is hard to get changed for a full aeroelastic model.
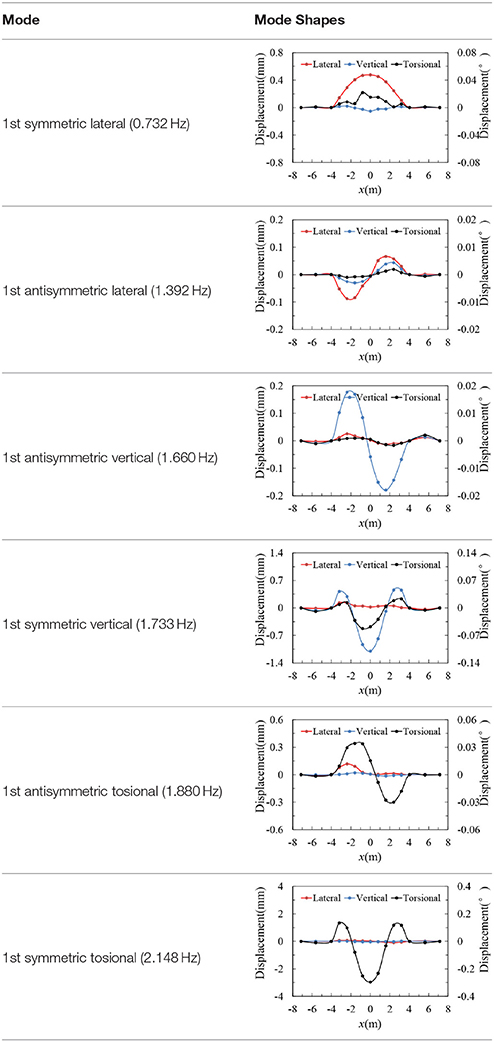
Table 4. Free-vibration characteristic with central buckle.
In Table 5, AS or S abbreviates for anti-symmetric or symmetric modes; T, V, L means torsional, vertical, and lateral components. The comparison shows a central buckle could make the anti-symmetric frequencies higher with little influence on symmetric modes. However, for present super-long bridge, the central buckle is not strong enough to postpone the anti-symmetric torsional mode after symmetric torsional mode. The comparison with finite element model presents a deviation <8%. It is a gratifying result considering the numerous elements and details in present case.
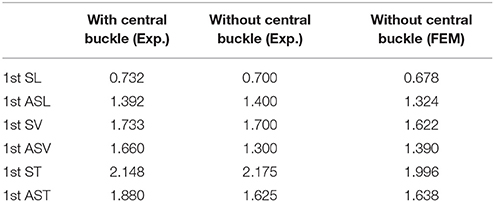
Table 5. Comparison of frequencies (Hz).
Turbulence and Buffeting
For a passive controlled wind tunnel like TJ-3, spires and roughness are usually used to simulate wind profile and turbulence intensity (Irwin, 1981). A series of mobile spires (Figure 17) were fabricated with adjustable height and projected area. Four different turbulence intensities were generated to show the relationship between intensity and dynamic response.
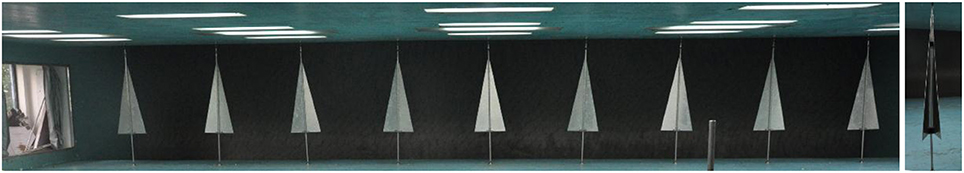
Figure 17. Mobile spires for turbulence flow.
According to the Davenports' theory (Davenport, 1964), the peak response under random excitations can be expressed as the sum of time average and fluctuating response , as,
where g is the peak factor. The mean responses, variances and peak values at mid-span under different turbulence intensities are going to be compared respectively. The attack angle remains zero for present part.
Mean Response by Turbulence
In Figure 18, a similar mean displacement was observed with different intensities since mean response is caused by static wind load. Lateral displacements were much larger than the vertical ones. The maximum lateral displacement almost reached 1/400 of span length when experimental wind velocity was around 2 m/s. In a suspension bridge's central span, suspenders can provide vertical constraints to stiffness girder while girder's lateral displacement can only be influenced by constraints at pylons. With the increasing of span length, the lateral mean displacement tends to be more prominent than vertical ones. It shows the benefit of a wide-slotted section in Figure 4 toward static deformation since this section is laterally stronger than a single box girder with a same effective width.
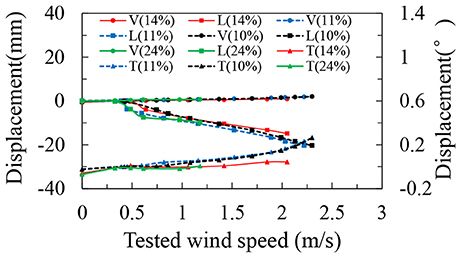
Figure 18. Mean responses at mid-span.
Dynamic Buffeting Response
Standard variance is an important statistical character relating to oscillation amplitude. Unlike the previous mean displacements, the dynamic response is a directly result of turbulence intensity. As Figure 19 shows, a higher intensity will enlarge the dynamic response while a similar fluctuation (in blue and black) leads to same structural response. For dynamic component, the difference between lateral and vertical response was not as distinct as Figure 18.
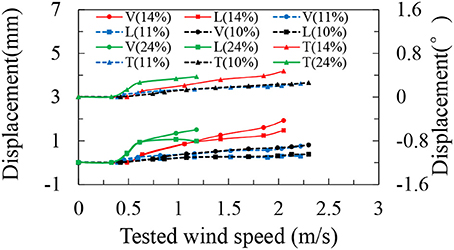
Figure 19. R.M.S. responses under different turbulence intensities.
Peak Responses
Peak responses, as the superposition of mean and dynamic components, are employed for structural design in wind code. The distribution of maximum value (Davenport, 1964) shows the peak response of most structures to gusts lies in the range 3.5–4.5 standard deviations of the response in excess of the mean response. Taking a factor of 3.5, the peak responses for different intensities can be seen from Figure 20. The lateral peak responses at mid-span is around 1/600 of span length (gray dashed line) under 1 m/s wind speed which refers to 24.9 m/s in real world, while the vertical peak response is quite small. It indicates the serviceability design of a 5,000 m-spanned bridge considering wind load is not a control factor. Since the lateral peak response is mainly contributed by mean component, its variation between different turbulence intensities is minor. Turbulence intensity plays a more important role for torsional and vertical peak values.
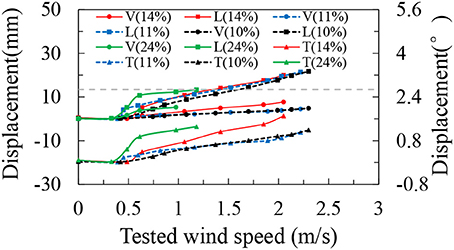
Figure 20. Peak responses under different turbulence intensities.
Aerodynamic Instability
Overview of Critical Velocity
With the increasing of wind speed, the oscillation tends to be violent. Considering the case list in Table 3, no torsional divergence has been observed, which indicates for a 5,000 m-spanned bridge, flutter analysis is more important than aerostatic divergence. Table 6 shows the critical flutter wind velocities for different attack angles and flow conditions. When upstream was zero degree, the critical flutter velocity was 69.2 m/s with a central-slotted girder but dropped to 31.9 m/s if the slot was sealed. An increase of critical flutter velocity more than 100% proves the benefit of a central slot toward dynamic stability. A 10%-intensity turbulence seems to be harmful to aerodynamic stability, which is different with Lin's standpoint (Bucher and Lin, 1990).
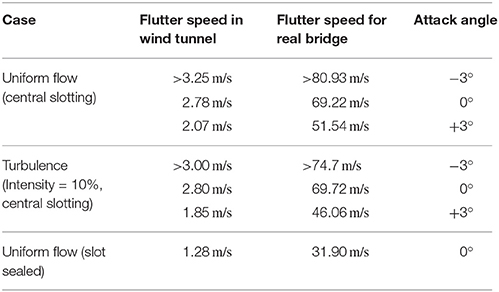
Table 6. Critical flutter wind speed (with central buckle).
Gravitational Stiffness and Attack Angle Effect
Since the bridge section in Figure 4 is symmetric, the critical wind speed for 3° ought to be the same with that of −3° if the stiffness system is also symmetric vs. attack angle. However, the result in Table 6 presents a deviation around 30 m/s. A reasonable explanation is the losing of gravitational stiffness. Figure 21 is an exaggerated schematic for a case of positive attack angle. The losing of strain in cable system caused by mean wind load will offset gravitational stiffness and then weaken flutter resistance. As a result, the model presented a better stability under negative attack angle but a deteriorated flutter performance under a positive attack flow.
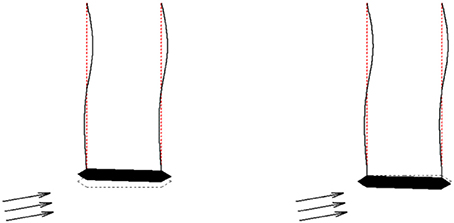
Figure 21. Losing of gravitational stiffness.
A comparison of mean displacement under smooth flow can verify the above assumption from a side view since the losing of gravitational stiffness tends to enlarge mean response. In Figure 22, the mean responses at mid-span are plotted which are similar with those at quarter-span. Their increasing is more rapid for a 3° than 0°. In particular, when testing wind velocity was 2 m/s, the twist angle under 3° was almost 25% larger than that for 0°. Therefore, the schematic in Figure 21 seems to be the reason of critical wind speed's deviation: an inclined upstream flow enlarges model's static deformation, loosen the tension force in cable system and finally bring forward aerodynamic instability. As this phenomenon is likely to happen in real bridge but hardly to get reappeared through sectional model testing, a 2D sectional model testing without cable system's simulation is risky for long-span bridges.
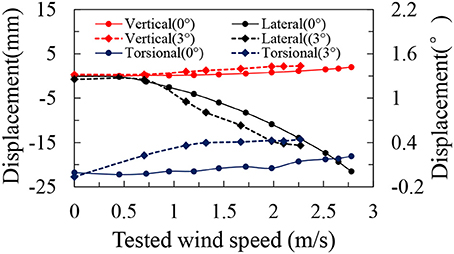
Figure 22. Mean responses under uniform flow at mid-span.
Discussion of Flutter Shape
Figure 23 shows the increasing of displacement's RMS values vs. uniform wind speed, where 1/2 means mid-span and 1/4 accounts for quarter-span. At the build-up of flutter, the displacements at quarter-span increase more rapidly than those at mid-span. Since an anti-symmetric model presents a minor contribution at mid-span, the flutter of a 5,000 m-spanned bridge is excited by anti-symmetric modes rather than symmetric ones. In part 4.2, although a central buckle can raise anti-symmetric frequency to some extent, 1st anti-symmetric torsional mode occurs earlier than symmetric one. To improve the flutter resistance of a 5,000 m-spanned bridge, more effort is expected to provide additional stiffness for anti-symmetric modes.
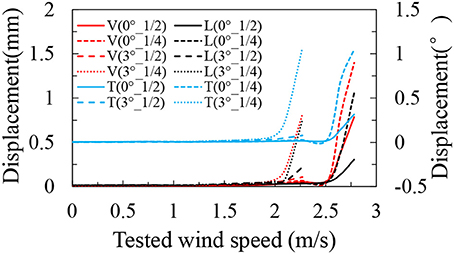
Figure 23. RMS of displacements under uniform flow.
A presentation of modal shapes during flutter as Figure 24 is more visualized to understand the participation of structural modes. Almost no displacement along three directions can be observed at mid-span which accords with the data in Figure 23 and demonstrates anti-symmetric mode's contribution toward flutter. Since anti-symmetric lateral and vertical modes also participated during flutter, the aerodynamic instability of a 5,000 m-spanned bridge is classical flutter excited by modal coupling effect. Figure 24 refers to the build-up of flutter when system's total damping was naught and vibrations were of constant amplitudes. A comparison of vibration amplitude shows the flutter under 3° was more violent, which may also be related to gravitational stiffness losing for a positive attack angle.
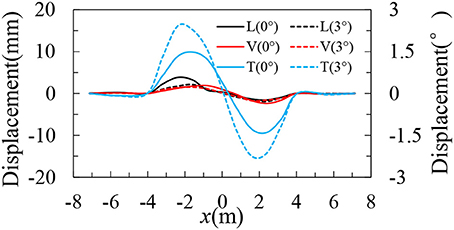
Figure 24. Flutter shapes under uniform flow.
Conclusions
In present paper, the full aeroelastic model of a 5,000 m-spanned suspension bridge has been designed, followed by the wind tunnel testing focusing on aerodynamic instability and turbulence-induced buffeting. The main experimental results can be concluded as follows:
(1) Aerostatic torsional divergence hasn't been observed during all tested cases. The ultimate state of a 5,000 m-spanned bridge is determined by flutter with the participation of anti-symmetric modes. Compared with a sealed section, the central-slotted girder can raise the critical flutter speed from 31.9 to 69.2 m/s under uniform flow when attack angle is zero. The section with a 40 m slot presents better flutter performance compared with a single-box girder.
(2) The critical flutter speed for a positive attack angle is much lower than that of a negative angle. It is deduced to be the result of gravitational stiffness' losing. A positive attack angle tends to enlarge the mean response under smooth flows, loosen the tension force and reduce the overall stiffness. Full aeroelastic model testing is recommended especially for super-long suspension bridges since this stiffness losing can't be modeled by a sectional model testing.
(3) For a 5,000 m-spanned bridge, the lateral buffeting response is much larger than vertical response since girder's lateral displacement can only be constrained at pylons or piers while suspenders can provide vertical constrains to stiffening girder. A central-slotted girder section with more lateral stiffness, is not only beneficial for aerodynamic stability but also for serviceability design.
(4) The flutter performance under a 10%-intensity turbulence is deteriorated compared with smooth flows, which is different with previous researches based on a relative short-span bridge. Rather than considering turbulence as a favorable factor, more attentions should be paid toward the interaction of turbulence and aerodynamic instability.
Author Contributions
The wind tunnel test in the paper was finished by JX and LZ under the supervision of YG and SZ. The data analysis was mainly finished by YG and JX. Four authors all participated in the writing of manuscript and review.
Conflict of Interest Statement
The authors declare that the research was conducted in the absence of any commercial or financial relationships that could be construed as a potential conflict of interest.
Acknowledgments
The authors gratefully acknowledge the support for the research work jointly provided by the National Key Basic Research Program of China (973 Program) (No. 2013CB036300), the National Science Foundations of China (No. 51078276 and 91215302).
References
Billah, K. Y., and Scanlan, R. H. (1991). Resonance, Tacoma Narrows Bridge failure, and undergraduate physics textbooks. Am. J. Phys. 59, 118–124. doi: 10.1119/1.16590
Brancaleoni, F., and Diana, G. (1993). The aerodynamic design of the Messina Straits Bridge. J. Wind Eng. Industr. Aerod. 48, 395–409. doi: 10.1016/0167-6105(93)90148-H
Bucher, C. G., and Lin, Y. K. (1990). Effects of wind turbulence on motion stability of long-span bridges. J. Wind Eng. Industr. Aerod. 36, 1355–1364. doi: 10.1016/0167-6105(90)90131-U
Davenport, A. G. (1964). Note on the distribution of the largest value of a random function with application to gust loading. Proc. Inst. Civil Eng. 28, 187–196. doi: 10.1680/iicep.1964.10112
Ge, Y. J., and Xiang, H. F. (2006). Tomorrow's challenge in bridge span length. IABSE Symposium Report, 42–49.
Ge, Y. J., and Xiang, H. F. (2008). “Bluff body aerodynamics application in challenging bridge span length,” in Proceedings of 6th International Colloquium on Bluff Bodies Aerodynamics and Applications (Milano), 20–24.
Ge, Y. J., and Xiang, H. F. (2009). “Aerodynamic stabilization for box-girder suspension bridges with super-long span,” in Proceedings of the 5th European and African Conference Wind Engineering (Florence).
Ge, Y. J., Yang, Y. X., Cao, F. C., and Zhao, L. (2003). Study of Aerodynamic Performance and Vibration Control of Xihoumen Bridge. Technical Report. WT200320.
Hayashikawa, T. (1997). Torsional vibration analysis of suspension bridges with gravitational stiffness. J. Sound Vibrat. 204, 117–129. doi: 10.1006/jsvi.1997.0948
Hirai, A., Okauchi, I., Ito, M., and Miyata, T. (1996). “Studies on the critical wind velocity for suspension bridges,” in Proceedings of International Research Seminar on Wind Effects on Building and Structures (Toronto, ON: University of Toronto Press), 81–103.
Irwin, H. P. A. H. (1981). The design of spires for wind simulation. J. Wind Eng. Indust. Aerod. 7, 361–366. doi: 10.1016/0167-6105(81)90058-1
Katsuchi, H., Jones, N. P., Scanlan, R. H., and Akiyama, H. (1998). Multi-mode flutter and buffeting analysis of the Akashi-Kaikyo Bridge. J. Wind Eng. Indust. Aerod. 77–78, 431–441. doi: 10.1016/S0167-6105(98)00162-7
Lu, G. C., Zhang, H. F., Yang, Y. X., and Ge, Y. J. (2005). Cross section aerodynamic optimization of steel box girder in Xihoumen Suspension Bridge Preliminary Design. J. Southwest Jiaotong Univ. 40, 473–477. doi: 10.3969/j.issn.0258-2724.2005.04.009
Natke, H. G. (ed.). (1982). “Identification of vibrating structures: an introduction,” in Identification of Vibrating Structures (Vienna: Springer), 1–14.
Ogawa, K., Shimodoi, H., and Oryu, T. (2002). Aerodynamic characteristics of a 2-box girder section adaptable for a super-long span suspension bridge. J. Wind Eng. Indust. Aerod. 90, 2033–2043. doi: 10.1016/S0167-6105(02)00319-7
Sato, H., Hirahara, N., Fumoto, K., Hirano, S., and Kusuhara, S. (2002). Full aeroelastic model test of a super long-span bridge with slotted box girder. J. Wind Eng. Ind. Aerod. 90, 2023–2032. doi: 10.1016/S0167-6105(02)00318-5
Scanlan, R. H. (1978). The action of flexible bridges under wind, I: flutter theory. J. Sound Vib. 60, 187–199. doi: 10.1016/S0022-460X(78)80028-5
Scanlan, R. H., Jones, N. P., and Lorendeaux, O. (1997). Comparison of taut-strip and section-model-based approaches in long-span bridge aerodynamics. J. Wind Eng. Indust. Aerod. 72, 275–287. doi: 10.1016/S0167-6105(97)00250-X
Shao, Y. H., Ge, Y. J., Ke, S. T., and Yang, Y. X. (2011). Wind tunnel test on the aerodynamic stability of super-long span suspension bridge with a main span of 5000. J. Exp. Fluid Mech. 25, 38–44. doi: 10.3969/j.issn.1672-9897.2011.06.008
Simiu, E., and Scanlan, R. H. (1996). Wind Effects on Structures: Fundamentals and Application to Design. New York, NY: John Willey and Sons Inc, 243.
Tanaka, H., and Davenport, A. G. (1982). Response of taut strip models to turbulent wind. J. Eng. Mech. Divis. 108, 33–49.
Wang, H., Li, A. Q., Yang, Y. D., and Li, J. H. (2006). Influence of central buckle on dynamic behavior of long-span suspension bridge. Zhongguo Gonglu Xuebao 19, 49–53. doi: 10.3321/j.issn:1001-7372.2006.06.010
Keywords: suspension bridge, full aeroelastic model, wind tunnel testing, flutter, buffeting
Citation: Ge Y, Xia J, Zhao L and Zhao S (2018) Full Aeroelastic Model Testing for Examining Wind-Induced Vibration of a 5,000 m Spanned Suspension Bridge. Front. Built Environ. 4:20. doi: 10.3389/fbuil.2018.00020
Received: 11 December 2017; Accepted: 19 March 2018;
Published: 18 April 2018.
Edited by:
Brian M. Phillips, University of Maryland, College Park, United StatesReviewed by:
Wenyong Ma, Shijiazhuang Tiedao University, ChinaSwamy Selvi Rajan, CSIR-Structural Engineering Research Centre, India
Hao Wang, Southeast University, China
Copyright © 2018 Ge, Xia, Zhao and Zhao. This is an open-access article distributed under the terms of the Creative Commons Attribution License (CC BY). The use, distribution or reproduction in other forums is permitted, provided the original author(s) and the copyright owner are credited and that the original publication in this journal is cited, in accordance with accepted academic practice. No use, distribution or reproduction is permitted which does not comply with these terms.
*Correspondence: Yaojun Ge, eWFvanVuZ2VAdG9uZ2ppLmVkdS5jbg==