 Esfand Burman
 Judit Kimpian2
 Dejan Mumovic
- 1Institute for Environmental Design and Engineering, The Bartlett School of Environment, Energy and Resources, University College London (UCL), London, United Kingdom
- 2AHR Global Architects, London, United Kingdom
Building performance evaluations (BPE) of five secondary schools and academies constructed under the Building Schools for the Future (BSF) programme in England found that CO2 emissions associated with operational energy performance in all these buildings is higher than the median of the secondary schools. Whilst the new regulatory requirements for building fabric performance have led to some improvements in heating energy when compared against good practice and typical benchmarks, there is still significant discrepancy between heating energy use and the design expectations. Electricity use in these buildings is also 37–191% more than the median school and significantly worse than the design expectations. These results point to the importance of post-occupancy building fine-tuning and measurement and verification of performance in-use with respect to design projections to narrow the performance gap. It is also necessary to set out clear operational performance targets and protect energy efficiency measures from value engineering throughout building procurement and in operation to achieve good level of performance. Finally, it is suggested to adopt a holistic view of energy, environmental quality, and educational performance to have a better understanding of schools' performance and potential conflicts between energy efficiency measures and indoor environmental quality (IEQ).
Introduction
Buildings constitute 35% of the global final energy consumption which contributes to the anthropogenic CO2 emissions that cause climate change (IEA, 2013). Therefore, improving energy efficiency of new and existing building stock is an indispensable component of climate change policy across the globe. Non-domestic buildings account for 17% of energy consumption and 12% of greenhouse gas emissions in the UK (DBEIS, 2016), and the education sector accounts for 11% of final energy use of non-domestic sector (DBEIS, 2017). There are approximately 25,000 primary and secondary schools in England and Wales with a gross floor area of 60,000,000 m2 and a replacement value of £130 billion (Dasgupta et al., 2012). The annual expenditure on the school estate is almost £7 billion. The annual spend on energy consumption in 2009 was £553 million and rising every year (James, 2011). Ten million pupils spend almost 30% of their life in schools in the UK and, therefore, schools are the second most important indoor environment after children's homes (DCSF, 2007). Consequently, in addition to its significance in climate change mitigation and adaptation strategies, the condition of the school estate has serious implications for health and well-being of the nation.
Launched in 2003 to renew all English secondary schools, the Building Schools for the Future (BSF) programme was the most ambitious building construction programme instigated by the UK Government in the last decade. It was the most expensive departmental capital programme with a total budget of £55 billion. However, the programme was scrapped in 2010 following the economic austerity imposed by the new government to reduce the national budget deficit and the complaints about the added value of the BSF (James, 2011). In total, 559 secondary schools were replaced or significantly renovated under the BSF programme, less than one fifth of the English secondary schools (CIBSE, 2015a). This constitutes a sizable portion of the current school estate. The BSF programme was effectively the third major school building programme in the UK following the Victorian and post-war construction projects in the education sector (Williams et al., 2015).
Most BSF schools were constructed after the inception of the European Directive for Energy Performance of Buildings (EBPD) in the UK. The projects were well funded by a flagship programme that had the aspiration to bring educational transformation (James, 2011). The completed buildings are therefore representative of the state of the art offered by the UK construction industry at the time, and are strong candidates to evaluate the effect of the new energy regulations. It has also been pointed out that broadly speaking schools have similar activity and objective systems and as such are a suitable building category for benchmarking (Pegg, 2007).
The fieldwork of this study was originally instigated by the Innovate UK Building Performance Evaluation (BPE) programme (Palmer et al., 2016). This paper aims to build on the previous work carried out in this field by the PROBE team (Bordass et al., 2001a), Carbon Trust Low Carbon Building Programme (Carbon Trust, 2011), and more specifically post-occupancy evaluation work carried out in schools (Pegg, 2007). The key objectives are to compare the operational energy and indoor environmental quality (IEQ) in new school buildings with design intents few years after completion, identify the root causes of any performance gap, and review the educational performance of these buildings in the context of the BSF aspirations to enhance the quality of education through building new schools.
Background
The term “performance gap” in buildings usually refers to underperformance in actual building operation against design expectations. While the performance gap may cover various aspects of a building's performance, it is widely used to refer to discrepancies between the actual and projected energy consumption or CO2 emissions associated with energy use.
Following the Latham (1994) report, commissioned by the UK government to investigate the root causes for poor quality offered by the construction industry, the PROBE research programme reviewed actual performance of 20 exemplar and award-winning buildings in the industry over the period 1995–2002. It was found that energy was often poorly specified in project brief and design criteria. Furthermore, there was very little connection between the values assumed in design estimations and energy models and actual values found in the completed buildings. Actual energy use of most buildings was higher than the expectations and almost twice the design estimates (Bordass et al., 2001b).
The evidence from other countries reinforces the findings of PROBE. Two-to-one discrepancy between actual and predicted energy performance in offices was identified in the US by Norford et al. (1994). A study carried out on 121 LEED certified buildings revealed that the measured performance of these buildings displayed a large degree of scatter, with half the projects deviating more than 25% from design projections (Turner and Frankel, 2008). A review of 18 buildings subjected to LEED Canada certification also found that, in total, the design stage models used for LEED certification underestimated total measured energy performance by 36% (Samuelson et al., 2014).
A study in Australia found generally poor or no correlation between design scores and the operational performance benchmarks used in the Australian Building Greenhouse Rating (ABGR) scheme (Bannister, 2003). Further investigation uncovered examples of poor controls design, construction and commissioning issues along with problems related to building maintenance and operation (Bannister, 2009).
The BPEs carried out after the implementation of the EPBD in the EU show the challenges of meeting ever-increasingly stringent energy regulations in practice. Post-occupancy evaluations of five new-build city academies found that four of them use more energy than the median building stock (Pegg, 2007). The Low Carbon Building Programme supported by Carbon Trust in the UK reviewed 28 buildings in a variety of sectors including retail, education, offices and mixed use residential buildings, and found energy performances of 75% of these buildings were worse than expected due to shortcomings in construction practices, control strategies, commissioning, building fine-tuning after handover, user training, building maintenance and management (Carbon Trust, 2011). A large research and demonstration programme in Germany covered buildings with passive cooling measures and set out operational performances for building services. The measured performance of 22 buildings covered by this programme revealed various problems in system operation in many cases that are indicative of the problems in the wider building stock (Voss et al., 2007). Skill shortage in European construction sector is generally perceived to be a major challenge for implementing new energy regulations (BPIE, 2011).
Various potential causes of the energy performance gap have been reviewed in a recent article in Frontiers in Mechanical Engineering by van Dronkelaar et al. (2016).
The performance gap can also manifest itself in IEQ. The PROBE occupant surveys pointed to issues associated with thermal comfort, acoustics, perceived control, and the gap between building performance and user expectations (Leaman and Bordass, 2001). While dissatisfaction with IEQ may have various causes, potential conflicts between energy efficiency requirements and IEQ performance are of great interest in the context of new Building Regulations (Shrubsole et al., 2014). An example of these conflicts is the overheating issues uncovered in highly insulated and airtight new buildings (Larsen et al., 2012; Fabbri and Tronchin, 2015; Maivel et al., 2015). Another example is poor ventilation. Post-occupancy evaluations of nine new-build schools during heating season found that classrooms were often inadequately ventilated which can affect the indoor air quality (Mumovic et al., 2009). IEQ performance can also affect productivity of building occupants. Investigations into the effects of classroom temperature and air quality on pupils' performance in Nordic countries and England found that temperatures higher than 20–22°C in summer and CO2 concentrations higher than 1,000 ppm for prolonged periods can reduce pupils' cognitive performance by as much as 30% (Wargocki and Wyon, 2013). A holistic view of building performance is therefore required to consider the intricate relation between energy, IEQ, and productivity and identify potential performance gaps.
Methods
BPE was first formulated by Preiser and Schramm (1997) as an integrative framework to investigate a building's procurement process and operation. Whilst post-occupancy evaluation is an integral part of a BPE study, other components such as design and construction review are also essential to identify improvement opportunities and provide feedback to construction teams. This feedback can be used to improve the building's performance and inform future projects (Preiser and Vischer, 2005).
A BPE study is about evaluating the performance of one or more buildings and therefore is conducted using the Case Study approach. The scope of a routine BPE study means the number of cases are often limited as a result of resource constraints and this makes statistical generalization difficult. It is therefore important to avoid treating a number of case studies as a statistical sample and instead try to elicit analytic generalizations that can inform decision making process (Yin, 2014).
The case studies presented in this paper comprise secondary schools and academies all constructed under the BSF programme. These buildings represent the climatic conditions and skillset available in three regions of England (London, North West, and North East), and different procurements methods used in the construction sector (Traditional and Design and Build). The lessons learned from the BPE studies of these schools can therefore be indicative of the potential improvement opportunities among the buildings constructed in this wave of school building in England.
This paper takes a system view of the case studies within a BPE framework. Energy is taken as an input to the environmental system of a building while thermal comfort and indoor air quality are among the key outputs of this system that are essential for health and productivity of the building occupants (Markus et al., 1972). It would therefore be helpful to assess these input and outputs along with objective metrics that can be indicative of educational attainment. The following subsections review the methods used to evaluate the performance of the case studies in this study.
Energy Performance
The operational energy performance of the case studies was established through long-term monitoring of the energy use associated with all fuels and the sub-metered energy end-uses.
In addition to utility bills and the available data from the Building Management Systems (BMS), energy use of all meters and sub-meters were collated in regular monthly site visits. The annual energy performance of the case studies is reported in this paper. The annual performance was established after the early stages of post-occupancy and the defects liability period, and when all schools had occupancy levels close to their nominal capacity. The reported performances in all cases reflect the steady mode of operation at least 3 years after building completion.
CIBSE TM39 (2009) protocol was used to reconcile the sub-metered data with the mains energy. CIBSE TM22 (2006a) protocol was also used to estimate the miscellaneous loads that were not directly metered. The measured performances of these buildings were subsequently compared against the industry benchmarks. The heating components of fossil-thermal use in the case studies were weather-corrected for benchmarking purpose based on the actual heating degree-days over the baseline temperature of 15.5°C during the measurement period and the UK average heating degree-days reported in CIBSE TM46 (i.e., 2,021 degree-days over the same baseline temperature).
Good practice energy benchmarks in the UK are often defined based on the 25th percentile of the existing datasets, while typical benchmarks represent the median building stock. It is reasonable to expect new buildings that are supposed to comply with the latest energy regulations to perform better than good practice benchmarks (CIBSE, 2012). In this study, the 25th and 50th percentiles of the energy data available for secondary schools in the Display Energy Certificate (DEC) database for England and Wales were used as good practice and typical benchmarks respectively (Hong et al., 2014). The benchmarks set out in CIBSE TM46 that underpins the DEC scheme and the Energy Consumption Guide for schools (ECG073) that represents typical benchmarks defined based on older datasets are also reported (CIBSE, 2008), (BRECSU, 1996).
Where energy performances were converted to carbon dioxide emissions to benchmark the total carbon dioxide emissions associated with operational energy use, the conversion factors set out by CIBSE TM46 (2008) were used. The CO2 emissions' conversion factor used for biomass, gas, and electricity are 0.025, 0.19, and 0.55 kg CO2/kWh respectively.
Finally, the half-hourly electricity data sourced from energy suppliers of these buildings were also analyzed to review the performance trends and operational issues.
Thermal Comfort and Indoor Air Quality
Thermal comfort conditions and CO2 concentrations, as proxy for indoor air quality, are presented in this paper to explore the interrelations between the environmental strategies adopted, the energy performance, and the indoor conditions.
Measurements of thermal comfort conditions were recorded by data loggers every 10 min at the seated head height away from any local heat source and direct sunlight in representative locations of the classrooms, typically on teacher's desk (measurement uncertainty: ± 0.35°C for temperature, ± 5% for RH).
A non-dispersive infrared CO2 sensor was located at the seated head height away from local heat sources with its base on the teacher desk. Measurements were taken every minute in typical weekly blocks during heating season when occupants are less likely to use operable windows and therefore the risk of poor indoor air quality is high (measurement uncertainty: ±3% of reading ±50 ppm).
Measurement and sampling of thermal comfort and air quality parameters followed the guidelines set out in BS EN ISO 7726 (BSI, 2001) and BS EN 15251 (BSI, 2007).
The monitoring results for thermal comfort conditions and air quality in typical weeks during heating season are reported for three classrooms per school to meet the standard sampling requirements. BS EN 15251 requires monitoring of minimum 5–10% of the zones representatively chosen in a building.
All case studies were constructed in accordance with the overheating criteria defined by the 2006 edition of BB101 (DfES., 2006). The threshold temperatures defined by this Building Bulletin and the lower temperature of 25°C that is often deemed to be the threshold temperature for thermal comfort (CIBSE, 2015b) were used to identify the number of hours indoor operative temperatures exceeded these threshold temperatures. In total, 41 classrooms were monitored in these schools (Burman, 2016). The maximum number of exceedance hours for each temperature threshold per school is presented in this paper.
CIBSE Test Reference Years (TRY) dataset were used in BB101 (2006) to assess the risk of overheating at design stage. The TRY data offer a statistical representation of past weather conditions and have been derived for 14 locations in the UK (Levermore and Parkinson, 2006). Actual weather data for London, where two case studies are located and the average outdoor temperatures were higher than other locations covered by this study, are compared against the TRY data for London to give context to the overheating analysis with reference to BB101 (2006) weather conditions.
Building Use Studies (BUS)
Building Use Studies (BUS) are designed to seek occupants' feedback about their building. The questionnaire for non-domestic buildings covers various aspects of the IEQ in addition to general questions about building design, work space conditions, and the impact of building on occupants' health and behavior (Cohen et al., 2001), (Leaman and Bordass, 2007). One of the strengths of the BUS survey is its existing dataset that enables benchmarking the performance of a building against other buildings in the dataset. Scores based on the average response to each question are compared against the benchmarks derived from the last 50 buildings in the BUS dataset.
BUS surveys were carried out among teaching and admin staff in the case studies after 3-6 years of building handover and occupancy. Therefore, the results represent the views expressed by occupants after several years of operation and are reflective of long-term and steady performance. Based on previous experience, the authors approached building occupants with the questionnaire in paper format rather than the online version to ensure high response rate. Most buildings had a response rate above 70% and the minimum response rate was 64%.
The results of comfort variables of BUS survey are presented in this paper to demonstrate the perceived IEQ in the buildings and help put the measurements of thermal comfort conditions and air quality in a wider context that represents the whole building and the longitudinal performance rather than measurements in typical weeks or one season only.
Educational Performance
Educational transformation was an aspiration of the BSF programme which funded several construction projects in deprived areas or where school buildings were not in good condition and required renewal or deep renovation (James, 2011). Therefore, an assessment of the educational performance of the BSF buildings few years after completion should be an integral part of BPE. The potential links between the monitored and self-reported environmental conditions and educational performance are also of interest.
The metrics often used for analysis of the educational performance of secondary schools are as follows (Rintala and Griggs, 2009; Williams et al., 2015):
Level 2 Attainment
Percentage of pupils that achieved 5+ GCSEs1 at grade “C” or higher
Level 1 Attainment
Percentage of pupils that achieved 5+GCSEs at grade “G” or higher
Total Absenteeism
Percentage of half days missed by students per year; this includes authorized and unauthorized absence.
The educational performance records available from the Department for Education, before the recent changes to curriculum and exams, were compared against the educational performance reported for these schools before erection of the new buildings. The data points used for post-construction belong to the academic year 2013–2014. However, the records for Level 2 attainment and total absenteeism have also been reviewed for academic year 2015–2016 to check if there has been any major change in the long-term performance of these schools.
Review of Case Studies
Table 1 provides key background information about the buildings covered by this study.
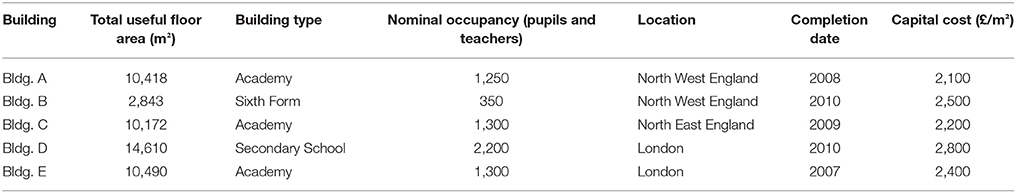
Table 1. Background information about the case studies.
All buildings, except Building A, were completed following the Design and Build procurement route which means the main contractors were involved from the outset and employed designers and other members of the construction teams to deliver the projects. Building A followed a Traditional procurement route; the main contractor was novated at tender stage after detailed designed had been completed by designers.
All buildings follow England and Wales school calendar which covers 39 weeks per year. School A and School B had regular night schools during monitoring period which meant 2-3 classrooms in each school were occupied between 18:00 and 21:00 for 2 days per week during academic terms. School D had also a night school between 18:00 and 22:00 on Wednesdays during academic terms that involved 2 classrooms. There were no other structured programmes for out-of-hours use of the buildings.
Table 2 identifies various Heating, Ventilation, and Air Conditioning (HVAC) systems installed in these buildings. Spatial distribution of these systems has been extracted from the as-built engineering drawings.
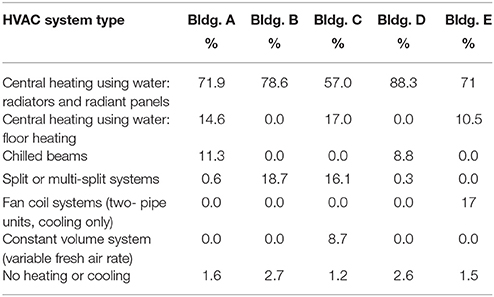
Table 2. HVAC system type (% of total useful floor area).
Split or multi-split systems reported in Table 2 include Variable Refrigerant Flow (VRF) systems installed to provide heating and cooling to ICT enhanced classrooms and split systems used for the cooling of server rooms and data hub rooms. The chilled beams installed in Building A and Building D are served by Ground Sourced Heat Pumps (GSHP). In both buildings, the GSHP provides both heating and cooling. The heating is supplemented by gas-fired condensing boilers. The design intent was to meet around 40% of heating demand in Building A and most of the heating demand in Building D using the GSHP system (to serve chilled beams and radiators). The other low carbon system installed in the case studies, in addition to GSHP, is the biomass boiler installed in Building C which was designed to provide most of heating to the building supplemented by gas-fired condensing boilers only if the building's heating demand exceeds the maximum capacity of the biomass boiler.
Table 3 defines the ventilation strategy used in these buildings.
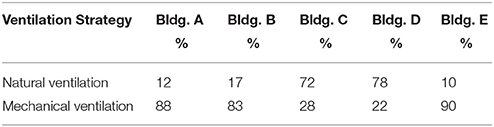
Table 3. Ventilation strategy (% of total useful floor area).
The buildings that predominantly utilize natural ventilation (Buildings C and D) have advanced features to facilitate cross or stack ventilation if required. Most classrooms in Building C have manually operable booster extract fans to enhance ventilation when required, although the default mode of operation is natural ventilation. Single-sided natural ventilation to Building D is provided by manually operable windows, while motorized vents on the opposite side of the classrooms were designed to respond to temperature or CO2 concentration levels via the control signal received from the BMS and therefore can provide cross or stack ventilation.
Mechanical ventilation systems installed in the case studies provide fresh air to the buildings, utilize heat recovery systems, and all have inverters installed on supply and extract fans that could potentially be used for demand-controlled ventilation.
Table 4 provides the asset ratings of these buildings which represent the Energy Performance Certificates (EPCs) issued on completion, and, where applicable, the rating achieved under the BREEAM sustainability scheme. The EPC scheme rates the as-built energy efficiency of a building, calculated under standardized operating conditions, on a A-G scale. Band A (0–25) represents most energy efficient buildings, while band G (over 150) represents least energy efficient buildings.
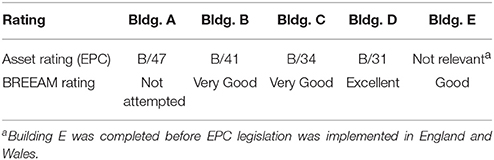
Table 4. Asset ratings and BREEAM ratings of the case studies.
Results
Energy Performance
Fossil-Thermal Energy Use (Natural Gas and Biomass)
Figure 1 compares the annual fossil-thermal performance of the case studies against the operational benchmarks.
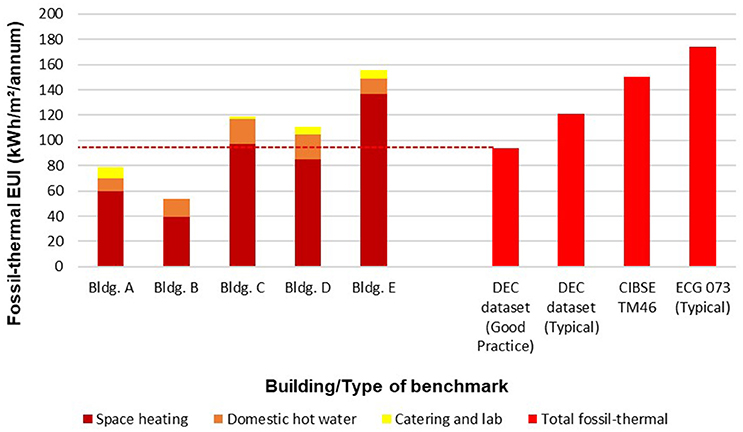
Figure 1. Annual fossil-thermal performance of the case studies against the benchmarks for secondary schools.
Buildings A and B perform better than the good practice benchmark derived from the DEC dataset by 16 and 43% respectively. The performances of Building C and D fall between good practice and typical benchmarks derived from the DEC dataset. The worst-case study is Building E with a total fossil-thermal performance which is 29% worse than the typical benchmark derived from the DEC dataset and 4% worse than the TM46 benchmark which was meant to represent the median existing stock, but has not been updated since 2008.
Buildings A and B with mechanical ventilation strategy and effective heat recovery perform significantly better than naturally ventilated buildings C and D in terms of heating energy. However, Building E which also utilizes mechanical ventilation does not follow this pattern due to poor control of heating and mechanical ventilation systems outside normal occupancy hours. This issue will be further explored in the analysis of half-hourly electricity data.
Electricity Use
Figure 2 compares the annual electricity use of the case studies against the operational benchmarks for secondary schools. The energy end-uses presented in this graph follow CIBSE TM22 classification. “Auxiliary” refers to energy used by fans, pumps, and control systems. “ICT equipment” covers energy use of server rooms and data hub rooms that are centralized and located in a dedicated room. Personal computers, laptops, phones, projectors, printers and other plug loads are covered by “small power.” Other terms used for energy end-uses in Figure 2 are self-explanatory.
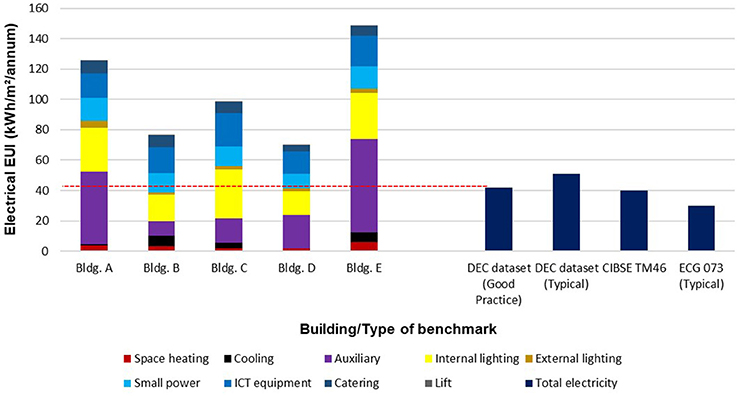
Figure 2. Annual electricity use of the case studies against the benchmarks.
Electricity use of all case studies is worse than all benchmarks. The best performers are Building B and Building D with very close total electricity use although Building B is mechanically ventilated whilst Building D is predominantly naturally ventilated. Electricity use of these two buildings is around 35% higher than the typical benchmark derived from the DEC dataset and 73% higher than the TM46 benchmark.
The natural ventilation strategy in Building D can explain its better performance than mechanically ventilated buildings. Its performance was also better than Building C with the same ventilation strategy due to better lighting control. Demand-controlled ventilation in Building B, on the other hand, proved effective in reducing electrical load compared to Buildings A and E where there was no effective demand-controlled ventilation.
It should also be noted that occupant density in Building D is 17–25% higher than other buildings (Table 1). Therefore, electrical energy performance of this building is even better compared against other cases covered by this study if occupant density is taken into account in addition to floor area. Procurement and management of ICT equipment and small power loads in this building were notably better than other buildings.
CO2 Emissions
Figure 3 shows the cumulative frequency of the CO2 emissions associated with total operational energy use for 1,045 secondary schools in England and Wales based on the work carried out by Hong et al. (2014), and identifies the case studies on the graph.
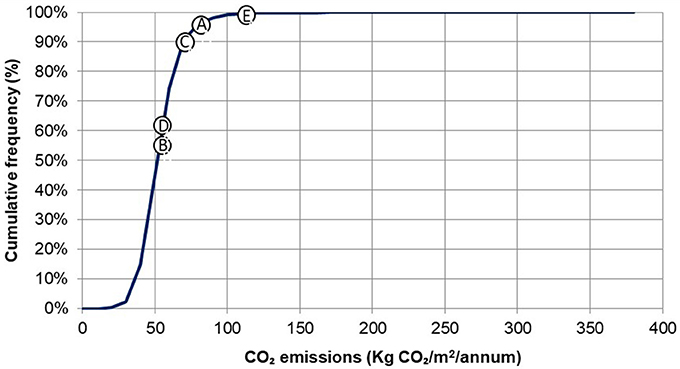
Figure 3. Cumulative frequency of the CO2 emissions for secondary schools from the DEC dataset.
Total operational energy performance of all case studies is worse than the typical benchmark (50th percentile). This is indicative of the challenges involved in achieving low-carbon buildings in practice despite the improvements in energy efficiency requirements and regulations over the recent years. The major root causes for this underperformance that were identified during the BPEs will be reviewed in the Discussion section.
Half-Hourly Electricity Data
As the carbon intensity of the national electricity grid in the UK is currently much higher than natural gas (CIBSE, 2008), the CO2 emissions are mainly driven by electricity use. Half-hourly electrical demand data can provide insights into the performance trends and operational issues experienced in these buildings. Figures 4, 5 show the annual average electrical demand curves during weekdays and weekends respectively.
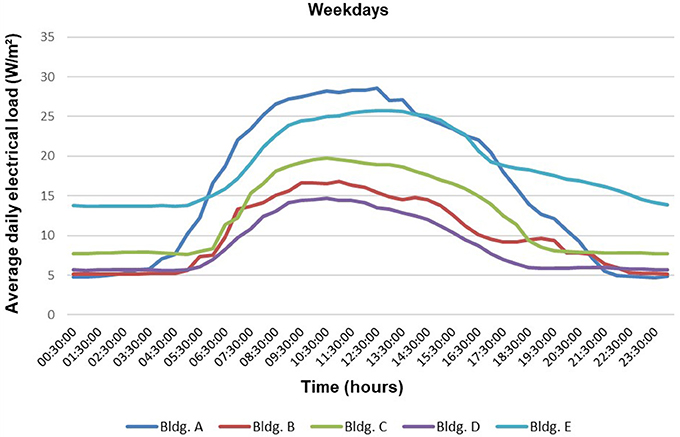
Figure 4. Annual average electrical demand curves for the case studies: Monday-Friday.
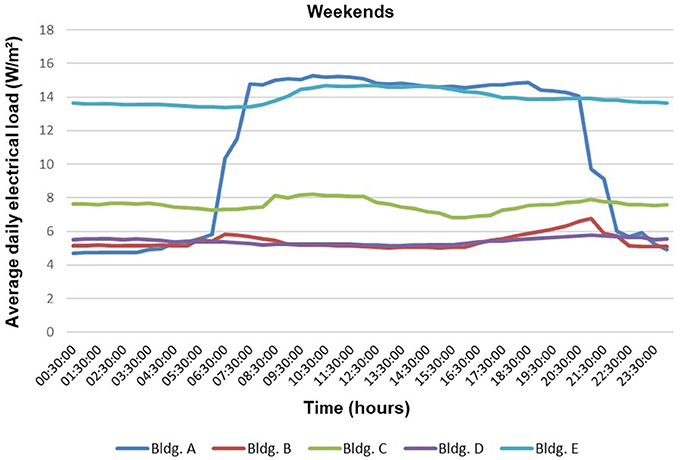
Figure 5. Annual average electrical demand curves for the case studies: weekends.
The baseloads, the shoulder hours that indicate the rate at which electrical demand raises from base to peak, and the peak loads provide a useful snapshot of buildings' operation. The baseload determines the continuous electrical demand of a building and therefore must be kept to a minimum that is essential for building operation. Buildings A and B have a reasonably low baseload demand at around 5 W/m2. The baseload demands in Buildings C and D are a bit higher at around 6–8 W/m2 partly due to higher installed capacity in server room and data hub rooms and partly due to the wasteful out-of-hours operation of lighting and small power in Building C and auxiliary pumps in Building D that were not effectively controlled. The baseload electrical demand of Building E is around 60% of its peak load which is excessive and indicative of serious operational problems in this Building.
Purge mechanical ventilation and night time cooling were part of the design strategy for Building E to mitigate the risk of overheating in summer using the building's thermal mass. According to the BMS, six main air handling units (AHU) with total installed capacity of 44 kW were programmed to provide night-time ventilation. However, the utility bills and electrical demand records do not show such a step change between summer and winter operation. Site inspections confirmed that the AHUs were fully operational throughout the year.
Figure 5 also shows the persistent high baseload in Building E which is indicative of serious shortcomings in its control strategy. This Figure reveals a step change in daytime electrical demand for Building A. The constant nature of the load shows it is a plantroom load. Site inspections found that heating and mechanical ventilation systems in this building were default to ON over the weekends when there was no real demand for these building services.
Figure 6 illustrates the annual percentage of electrical energy use in different time periods in the case studies during one full year.
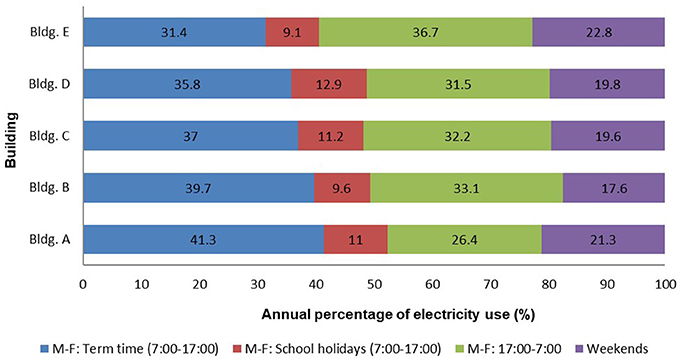
Figure 6. Distribution of electricity use in different time periods during a year.
It is notable that in all buildings only around 30–40% of total electricity is used in the normal occupancy hours during term time. The allowance for occupancy hours (7:00–17:00) includes the core teaching hours plus the time required for preparation and tutorials and in most cases supportive activities such as cleaning the classrooms. Term time refers to the normal schools' calendar in England and Wales. Some extracurricular activities often take place during school holidays. Some office spaces are also in use during this time. However, even after taking into account the electricity use during school holidays, electricity use over normal occupancy hours in most cases is still less than 50% of total electricity with a maximum of 52% in Building A. This means that typically more than half the total electricity use of the case studies is consumed when the buildings are not occupied except for occasional extracurricular activities and events that often do not use much space and do not require much electrical power. Although some electrical loads are expected beyond occupancy hours such as the loads associated with server rooms, external lights, and security systems, the optimal electricity use of a normal school when it is not occupied is expected to be lower than 50% of the total electricity as there is no real demand for most energy end-uses. Energy audits in all buildings revealed improvement opportunities to significantly reduce the electrical demand beyond normal occupancy hours.
Thermal Comfort and Indoor Air Quality
Table 5 reports the statistics related to the indoor air quality in heating season, the ventilation rates inferred from CO2 concentrations following the method described in CIBSE AM 10 (2005) when the classroom conditions were close to steady-state, operative temperatures, Relative Humidity (RH), and the Percentage People Dissatisfied (PPD) index that is derived from the measurements of temperatures, relative humidity, and air speed. The activity and clothing levels assumed for PPD calculations were 1.4 met and 1.0 clo in accordance with the CIBSE recommendation for teaching spaces (CIBSE, 2015b).
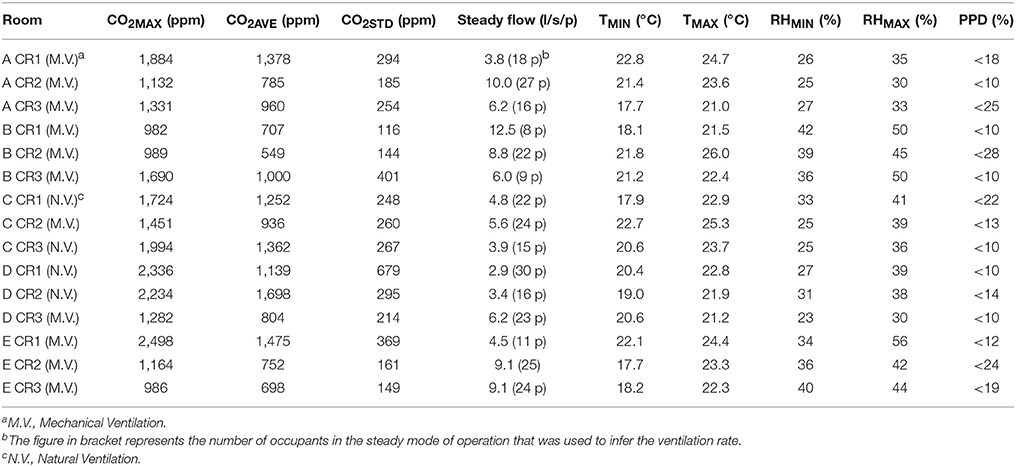
Table 5. Indoor air quality and thermal comfort in the classrooms during heating season.
All classrooms met the BB101 (2006) average daily CO2 limit of 1,500 ppm except a naturally ventilated classroom in Building D where the manually operable windows were often closed to prevent draft in winter (D/CR2). The maximum CO2 concentration however occurred in a mechanically ventilated zone where the respective Air Handling Unit (AHU) was not operational due to a prolonged maintenance issue and the small window installed for the classroom was not capable to compensate for the failure of the AHU (E/CR1).
It is notable that the 19–21°C temperature range and other comfort criteria recommended by CIBSE for designing teaching spaces are defined to achieve a PPD level not greater than 5% in heating season. However, the PPD calculations assume RH level of 50% and air speed of 0.15 m/s (CIBSE, 2015b). RH levels in all buildings were often lower than the 40–70% comfort range recommended by CIBSE. RH levels below 40% are not unusual during heating season in the UK buildings that often do not use humidification (CIBSE, 2015b). Low humidity levels make people more sensitive to odors and may affect their perception of indoor air quality (Fang et al., 1998). The minimum RH level recorded was 25%. Relative humidity levels below 25% are associated with increasing discomfort and dryness of skin that can lead to irritation. Low relative humidity also increases static electricity that can cause discomfort (Nathanson, 1995). The air speeds, partly driven by natural ventilation, were also frequently higher than 0.15 m/s. Therefore, achieving the design PPD levels could be challenging in practice given the current control strategies adopted for schools in the UK. The monitoring results included in Table 5 indicate that a slightly relaxed target of maximum 10% PPD is more realistic. Several classrooms experienced maximum PPD levels higher than 10% which is indicative of the performance gap in thermal comfort.
Table 6 reports the maximum exceedance hours observed over thermal comfort and overheating threshold temperatures during a typical summer. Figure 7 compares the maximum daily temperatures measured in London, a location more prone to overheating than other case study locations, during the measurement period with the TRY dataset which was prescribed as the reference weather data for overheating analysis in BB101 (2006). The measured outdoor temperatures are relatively close to TRY temperatures, although the absolute maximum air temperature in TRY dataset is around 1°C higher than the actual temperatures. The maximum allowable number of exceedance hours over the temperature threshold of 28°C in BB101 (2006) is 120 h. Given the margin all buildings have compared to this allowance, it can be concluded that all buildings meet the design overheating criteria in practice. However, it should be noted that BB101 (2006) criteria were somewhat lenient compared to other criteria used for overheating analysis which are often based on Design Summer Years (DSY). DSY weather data are more representative of extreme temperatures (CIBSE, 2013). Furthermore, the outdoor temperatures during the summertime monitoring period were moderate and are not necessarily representative of hot weather. It is therefore important to put the overheating analysis in the context of BUS survey which specifically asks for thermal comfort conditions during summer. Building occupants had experienced at least three summers before completing the BUS questionnaire.
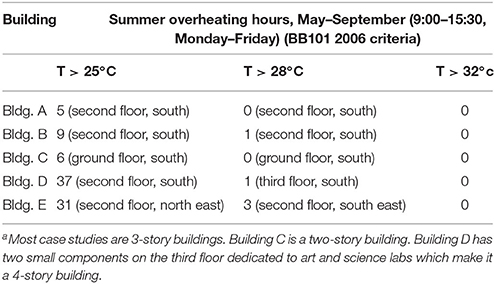
Table 6. Maximum overheating exceedance hours observed in the case studiesa.
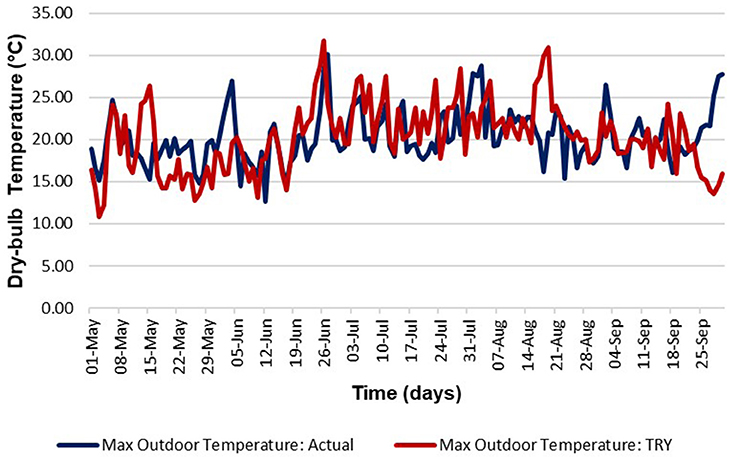
Figure 7. Maximum daily temperatures during the measurement period against TRY data for London (reference dataset for BB101 overheating analysis).
Building Use Studies (BUS)
Table 7 includes basic information about total number of teaching and support staff present on the day of survey and the respondents in each building.
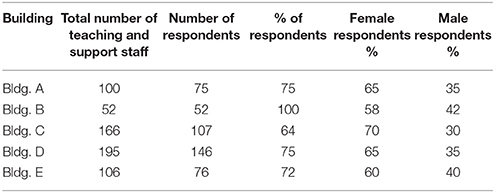
Table 7. BUS respondents' profile.
Figure 8 shows the outcomes of the BUS survey for IEQ and comfort variables. The scores presented on the graph are consistent with the 7-scale system used in BUS with 1 showing the lowest degree of satisfaction and 7 the highest.
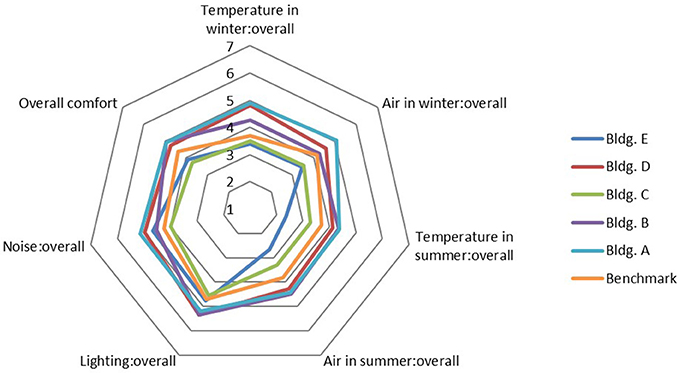
Figure 8. BUS survey results for IEQ and comfort variables.
Buildings A, B, and D show relatively high scores for IEQ and overall satisfaction, while Building C and Building E show significant shortcomings in perceived performance compared to both the mid-point scale of the survey and the mean benchmarks. It is notable that Building C has lower overall satisfaction score, although its scores for IEQ variables are generally higher than Building E. The complexity of building layout and the noise and disruption caused by the open-plan design philosophy adopted for this building were cited by the occupants as the main issues in BUS commentary section. There were negative comments about open-plan educational spaces in other buildings as well. It appears that where the open-plan space is clearly separated from other zones teachers are more content with the space than where the spaces are interconnected such as an open-plan teaching space exposed to a corridor or circulation space as is the case in School C. In School E, the major cause of the negative feedback was the IEQ performance with scores for temperature and air in summer being lower than both the survey mid-point scale and the mean benchmarks. There were significant shortcomings associated with the buildings services control strategy in this building which meant the BMS had to be recommissioned few years after building completion. This points to the problems in building procurement process that may result in an operational performance significantly worse than the design intent and cause dissatisfaction among building occupants.
Scores for temperature and air in summer are generally lower than the scores for other variables although only two buildings (C and E) fall short of the survey mid-point scale and mean benchmarks. The number of negative feedbacks about temperatures and air quality in the BUS commentary section were generally lower than 10% of total number of respondents in each building except for Building E where 20% of teachers and admin staff complained about thermal comfort conditions both in heating season and summer. 17% of total respondents in this building also complained about the size of operable windows and lack of fresh air which is indicative of the operational problems associated with AHUs and users' preference for natural ventilation.
Educational Performance
Figure 9 shows the attainment and absenteeism records for the new buildings 3-6 years post-occupancy against the performances achieved in the previous buildings in the same locations. As Building B is dedicated to Sixth Form education only (last year of secondary education in the UK), its academic records were not consistent with the other buildings and were therefore not included in this comparison. Level 2 attainment and total absenteeism records for the schools included in Figure 2 were also checked for the academic year 2015-2016 and apart from School D which experienced a dip in Level 2 attainment to 52%, other attainment and absenteeism records are within ±5% and ±1% of the values reported in Figure 9 respectively.
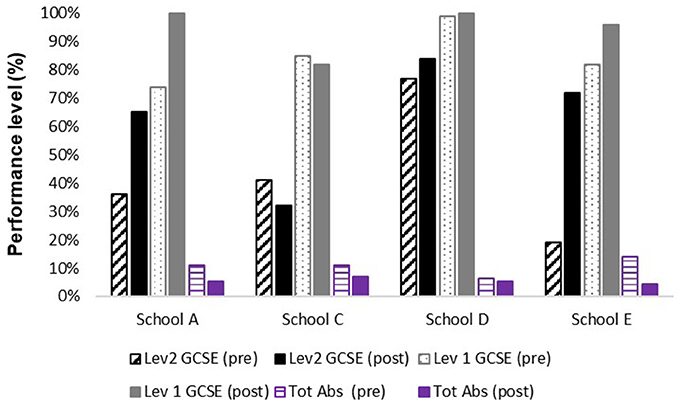
Figure 9. Educational performances of the case studies against performances achieved in the previous buildings.
All schools experienced significant improvements in all performance metrics except School C that has experienced a decline in both Level 2 and Level 1 attainment, although the level of absenteeism in this school has improved similar to the other schools. It is remarkable that School E has achieved the strongest improvement in Level 2 attainment and absenteeism despite poor environmental performance. School C, on the other hand, has not been able to overcome the poor level of user satisfaction expressed in the BUS survey. This may be indicative of the significance of factors other than the built environment in pupils' attainment. One of the ambitions of the BSF programme was to achieve educational transformation by providing inspirational buildings for pupils and teachers. The results achieved in these case studies demonstrate that where such transformation has occurred, it has been less related to tangible aspects of the building and more related to the human related factors such as the change in management structure and pedagogical practices in case of school E where the old community school transformed to a sponsor led academy. These factors seem to have overcome the major environmental issues uncovered in this building both by the technical measurements and user satisfaction survey. Where such successful transition did not occur (e.g., School C), the academic performance deteriorated despite the significant capital investment in procuring a new and iconic building for the community.
Discussion
The BPEs identified significant gaps between measured performance of new educational buildings and the expectations. All case studies experienced several procurement issues at various stages of construction projects that had knock-on effects on performance in-use. An overarching finding was that designers, in their endeavors to meet the stringent regulatory targets, specified various measures that had not been subject to thorough risk assessment from operational point of view. This problem was often compounded by value engineering process in which critical measures that could have provided redundancy modes for environmental systems and thereby improve system resilience were taken out from the schemes to save resources.
The commissioning process in all buildings was very basic and did not address energy efficiency. For example, the commissioning records show Specific Fan Powers (SFPs) of all central mechanical ventilation systems installed in the case studies were worse than the design intent and the maximum permissible SFPs set out by the Building Regulations. However, this was not identified and addressed at the commissioning stage and post-handover. Furthermore, seasonal commissioning did not take place for any building. Seasonal commissioning had only been planned for Building D at the early stages of design and was subsequently taken out of the procurement process as a result of value-engineering. There was also no systematic attempt to fine-tune buildings and optimize performance in the early stages of post-occupancy.
Consequently, these buildings were left to users who did not have in-depth training, the experience, or the adequate resources to manage them in accordance with the design intents. In some cases, it was even difficult for users to figure out the design intent. The contractors had prepared the Operation and Maintenance manuals and building logbooks. The logbooks had been prepared using the template proposed in CIBSE TM31 (2006b). However, none of these logbooks contained information about energy end-use estimates. The templates for total energy use and individual end-uses were often left blank and this made it difficult to define robust baselines for building performance. Critical aspects of energy strategies were also not accurately explained in building documentation. For example, the Operation and Maintenance manual for Building A states:
“Central gas fired modular boilers are provided to meet the heating demand of the building. The remainder of the heating requirements is provided from the ground source heating and cooling system.”
This statement implies that the gas-fired boilers are the primary heating system, whereas, the original design intent was to operate the ground source heat pumps (specified as a low carbon system) as the lead system supplemented by boilers only when necessary.
This method of building procurement, with serious shortcomings in design, construction and handover, will inevitably lead to operational issues that are more pronounced in complex and large buildings.
Other recurring themes that were key drivers of the performance in the case studies are as follows:
• A tendency to open-plan design in new schools which apart from potential pedagogical issues, stemming from noise and distraction, poses challenges in controlling the building services where the zones are not fully occupied. This was a common theme in all case studies. Lack of a well-defined control strategy with fine resolution led to wasteful use of energy especially during out-of-hours activities.
• Optimum space-time utilization is key in optimizing energy performance is educational buildings. The authors have observed a surge in using most secondary schools, converted to academy in the UK over the recent years, outside normal school occupancy hours. New academies have more autonomy in running their buildings and opportunities to generate revenue by renting out their premises in the evenings, weekends or during academic breaks. It is important to take this trend into account in designing responsive building services control strategies and ensure building users are aware of the implications. Facility managers in the case studies were not aware of the HVAC and lighting zoning arrangements and how these could be controlled to respond to real demand by isolating the unoccupied zones.
• There has also been an increase in the number of educational buildings that utilize mechanical ventilation over the past few years (Pegg, 2007; Godoy-Shimizu et al., 2011). The environmental strategy for three case studies were based on mechanical ventilation whilst several zones in the other case studies were also served by mechanical ventilation. This trend is driven by multiple factors such as increasing ICT equipment, external noise levels in congested areas that make natural ventilation not viable, and concerns about future climate change and high ambient temperatures. It is important to ensure these systems are energy efficient in practice. The SFPs of the main AHUs in all case studies were higher than design intent and regulatory limits at the commissioning stage and in operation. Although fan inverters were installed on all supply and extract fans, in most buildings these systems had only been used to balance the system at the commissioning stage and only one building had an effective demand-controlled ventilation (Building B). The fact that this building was the best performing building in terms of energy performance demonstrates the significance of optimizing energy use of mechanical systems in achieving a good level of performance.
• Risk assessment and failure mode analysis of mechanical systems is another important factor that is often lacking in the design process. School E is an example where failure of mechanical ventilation led to high CO2 concentration and poor air quality in some zones. This phenomenon has also been observed in other case studies in regular energy audits. Given the budgetary constraints and under resourced facility management teams in most schools, it is important to make sure building resilience is protected by having reasonably sized operable windows in case mechanical ventilation fails. It is also important to clearly communicate the life-cycle implications of having mechanical ventilation to schools to ensure they would be able to allocate adequate resources for system maintenance.
• Identification of key energy efficiency measures and protecting these measures from value engineering is key to achieve good performance. A review of the procurement process of the buildings revealed that several key measures had been compromised as a result of value engineering. For example, seasonal commissioning of the advanced naturally ventilated system in Building D was not implemented meaning the motorized vents were only responsive to CO2 levels and not temperatures, the two-port valves designed to hydraulically isolate unoccupied zones had not been effectively commissioned and were leaking after handover, etc.
• All Low or Zero Carbon (LZC) systems installed in the case studies performed worse than expected. The operation of GSHP systems in Buildings A and D was compromised as the heating flow temperatures were raised to offset the effect of drafts and undersized heating terminals which meant the backup gas-fired boilers took over to provide the required temperatures. The biomass boiler in Building C was only used for few weeks before switching to gas boilers as a result of various technical issues, fuel cost, and perceived issues around de-ashing and maintenance of the system. A holistic view to building performance, well-defined control interface between LZC system and the supplementary or backup systems, and active engagement of building managers in selection and operation of the systems are crucial to ensure these systems bring the expected environmental benefits.
• The relation between building user satisfaction and energy performance is not straightforward. User satisfaction can be viewed as the desired output of a building's total environmental system whereas energy is a system input. BUS are focused on system outputs. However, where people are not satisfied with the level of comfort, there are often problems related to building services that may have also compromised energy performance. Poor BUS comfort index in Building E was entirely consistent with the poor level of energy performance. A good comfort index however may be indicative of a relatively good energy performance (e.g., Building B) or be achieved at the expense of an overall poor energy performance (e.g., Building A). The structured feedback received from BUS questionnaire point to the key problem areas in a building that could inform building performance diagnostics. BUS and similar building use surveys are therefore a fast track route for building diagnostics that could be especially helpful for shorter term post-occupancy evaluations in the industry.
• The message emerging from comparing the academic performance of pupils in the case studies against BPEs is building physics is only part of a wider context that affects pupils' performance. However, it is important to note that while these findings question the educational transformation aspired by ambitious school building programmes, evidence shows that IEQ of classrooms affects pupils' health and thermal comfort (Wargocki and Wyon, 2006; Norbäck and Nordström, 2008) and poor environmental quality can have negative impact on pupils' performance (Shaughnessy et al., 2006; Coley et al., 2007; Bakó-Biró et al., 2012; Wargocki and Wyon, 2013). It is therefore important to provide and maintain good level of IEQ for the health and well-being of pupils. It is also crucial to ensure energy efficiency measures do not compromise IEQ as empirical evidence points to potential unintended consequences of energy conservation policies and regulations (Institute of Medicine of the National Academies, 2011; Shrubsole et al., 2014). On a broader level, it is necessary to identify and acknowledge the significance of other factors that affect pupils' performance such as school management, pedagogical practices, and motivational factors. This finding is consistent with a large scale longitudinal study carried out on the BSF schools and has important implications for the procurement of future school buildings (Williams, 2017).
Conclusions
BPEs of five educational buildings constructed over the period 2007–2010 in England under the BSF programme found that the CO2 emissions associated with operational energy performances of all these buildings fall short of design intents and the 50th percentile of the schools building stock derived from DEC data. Fossil-thermal energy use of three buildings was higher than the 25th percentile of the existing schools which represents good practice benchmark and one building performed worse than the 50th percentile which represents typical benchmark. Electricity performances of these buildings were 37–191% higher than the typical benchmark and 66–254% higher than the good practice benchmark. This has important implications for energy efficiency policy and points to the necessity of closing the gap between operational performance and design intents to ensure the environmental benefits expected from new buildings are achieved.
Building procurement issues and operational problems can severely compromise energy performance. These problems can also bring unintended consequences for indoor air quality, thermal comfort and other environmental performance metrics that are integral parts of the wider building and socio-economic context of new schools designed to achieve high educational performance.
The overarching conclusion is that a building will not achieve its full performance potential unless building designers and contractors are engaged in a concerted action post-occupancy to optimize the building and its systems and provide effective training to the occupants. Reasonably detailed frameworks and key performance indicators are required to determine the extent of post-occupancy activities and evaluate their success with objective metrics. Appropriate incentives and policy measures are also required to integrate post-occupancy building performance optimization and much needed feedback arising from it into the building procurement processes. Measurement and Verification of performance in-use defined in frameworks such as the Soft Landings (BSRIA, 2009), the International Performance Measurement and Verification Protocol (EVO, 2012), the framework developed in the context of the EPBD (Burman et al., 2014), and the Energy Commitment Agreement protocol under the Australian NABERS system (Cohen et al., 2016) might help narrow the performance gap.
Three key process improvements for building procurement are identified based on the performance evaluations of the case studies presented in this paper that could be used within an appropriate measurement and verification framework to narrow the performance gap:
• Set out clear design objectives and develop robust performance models as baselines for performance along with appropriate operational benchmarks
• Identify key energy efficiency measures and protect them from value engineering throughout building procurement and in operation
• Adopt a holistic view to total energy, environmental performance, and productivity
The feedback received from post-occupancy evaluations of BSF schools led the UK Education Funding Agency to set stringent operational targets for the contractors responsible to deliver the new wave of school buildings in the UK, namely, the Priority School Building Programme (PSBP) (EFA, 2014). For future work, it is suggested that performance evaluations of PSBP buildings will be important to review the effectiveness of the building procurement framework adopted by the EFA and identify the improvement opportunities.
Author Contributions
EB carried out the building performance evaluations as part of his Engineering Doctorate (EngD) programme and wrote the manuscript. JK was Esfand's industrial supervisor during the EngD, and was involved in building performance evaluations. She also provided comments and insights for this manuscript. DM was Esfand's academic supervisor during the EngD, reviewed the content of this manuscript, and provided comments.
Conflict of Interest Statement
JK was employed by AHR Global Architects. The other authors declare that the research was conducted in the absence of any commercial or financial relationships that could be construed as a potential conflict of interest.
Acknowledgments
This paper is based on an Engineering Doctorate (EngD) dissertation (Burman, 2016). It represents the only medium this content has been appeared and its publications is in line with the lead author's university policy. The full version of the dissertation is available via the following source: http://discovery.ucl.ac.uk/1482161/. The EngD programme was funded by the Engineering and Physical Sciences Research Council (EPSRC) of the UK (Grant Code: EP/G037698/1). Writing of this paper was also supported by the Total Performance of Low Carbon Buildings in China and the UK (TOP) project (Grant Code: EP/N009703/1). Innovate UK funded the post-occupancy studies carried out as part of the Building Performance Evaluation programme (Project Reference Numbers: 1798-16365 and 1281-16183).
Footnotes
1. ^ GCSE: The General Certificate of Secondary Education.
References
Bakó-Biró, Z., Clements-Croome, D. J., Kochhar, N., Awbia, H. B., and Williams, M. J. (2012). Ventilation rates in schools and pupils' performance. Build. Environ. 48, 215–223. doi: 10.1016/j.buildenv.2011.08.018
Bannister, P. (2003). Lies, Damned Lies and Simulations: Use and Abuse of Simulation in the Marketplace. Sydney, NSW: University of Sydney: IBPSA Australasia Seminar.
Bannister, P. (2009). Why Good Buildings Go Bad While Some are Just Born that Way. Ecolibrium. Available online at: https://www.airah.org.au/Content_Files/EcoLibrium/2009/February09/2009-02-01.pdf
Bordass, B., Cohen, R., Standeven, M., and Leaman, A. (2001b). Assessing building performance in use 3: energy performance of the Probe buildings. Build. Res. Inform. 29, 114–128. doi: 10.1080/09613210010008036
Bordass, B., Leaman, A., and Ruyssevelt, P. (2001a). Assessing building performance in use 5: conclusions and implication. Build. Res. Inform. 29, 144–157. doi: 10.1080/09613210010008054
Burman, E. (2016). Assessing the Operational Performance of Educational Buildings Against Design Expectations – A Case Study Approach, Engineering Doctorate Dissertation. London: University College London (UCL).
Burman, E., Mumovic, D., and Kimpian, J. (2014). Towards measurement and verification of energy performance under the framework of the European directive for energy performance of buildings. Energy 77, 153–163. doi: 10.1016/j.energy.2014.05.102
BSI (2007). BS EN 15251:2007, Indoor Environmental Input Parameters for Design and Assessment of Energy Performance of Buildings Addressing Indoor Air Quality, Thermal Environment, Lighting and Acoustics. London: BSI.
BSI (2001). BS EN ISO 7726, Ergonomics of the Thermal Environment - Instruments for Measuring Physical Quantities. London: BSI.
BSRIA (2009). The Soft Landings Framework for Better Briefing, Design, Handover and Building Performance In-Use, BSRIABG 4/2009. Bracknell: Building Services Research and Information Association (BSRIA).
BPIE (2011). Europe's Buildings Under the Microscope, A Country-by-Country Review of the Energy Performance of Buildings. Brussels: Building Performance Institute Europe (BPIE).
CIBSE (2015a). Integrated School Design, TM57. London: The Chartered Institution of Building Services Engineers (CIBSE).
CIBSE (2015b). Guide A: Environmental Design. London: The Chartered Institution of Building Services Engineers (CIBSE).
CIBSE (2005). CIBSEAM10, Natural Ventilation in Non-Domestic Buildings. London: The Chartered Institution of Building Services Engineers (CIBSE).
CIBSE (2006a). Energy Assessment and Reporting Method, CIBSETM22. London: The Chartered Institution of Building Services Engineers (CIBSE).
CIBSE (2006b). TM31 Building Log Book Toolkit. London: The Chartered Institution of Building Services Engineers (CIBSE).
CIBSE (2008). Energy Benchmarks, CIBSETM46. London: The Chartered Institution of Building Services Engineers.
CIBSE (2009). TM39: Building Energy Metering. London: The Chartered Institution of Building Services Engineers (CIBSE).
CIBSE (2012). Energy Efficiency in Buildings, CIBSEGuide, F. London: The Chartered Institution of Building Services Engineers.
CIBSE (2013). CIBSETM52, The limits of Thermal Comfort: Avoiding Overheating in European Buildings. London: The Chartered Institution of Building Services Engineers (CIBSE).
Carbon Trust (2011). Closing the Gap - Lessons Learned on Realising the Potential of Low Carbon Building Design. London: Carbon Trust.
Cohen, R., Bordass, B., and Bannister, P. (2016). Design for Performance: The Ingredients Needed to Implement an Energy Performance Guarantee - Proven in Australia, can They Work Elsewhere? Frankfurt: Improving Energy Efficiency in Commercial Buildings and Smart Communities Conference.
Cohen, R., Standeven, M., Bordass, B., and Leaman, A. (2001). Assessing building performance in use 1: the Probe process. Build. Res. Inform. 29, 85–102. doi: 10.1080/09613210010008018
Coley, D. A., Greaves, R., and Saxby, B. K. (2007). The effect of low ventilation rates on the cognitive function of a primary school class. Int. J. Ventilation. 6, 107–112. doi: 10.1080/14733315.2007.11683770
Dasgupta, A., Prodromou, A., and Mumovic, D. (2012). Operational versus designed performance of low carbon schools in England: Bridging a credibility gap. HVAC&R Res. 18, 37–50. doi: 10.1080/10789669.2011.614318
DfES. (2006). Building Bulletin 101, Ventilation of School Buildings. London: Department for Education and Skills. The Stationary Office.
DBEIS (2016). Heat in Buildings, The Future of Heat: Non-domestic Buildings. London: Department for Business, Energy and Industrial Strategy.
DBEIS (2017). Energy Consumption in the UK. London: Department for Business, Energy and Industrial Strategy.
DCSF (2007). The Children's Plan, Chapter 4: Leadership and Collaboration. London: Department for Children Schools and Families (DCSF).
EVO (2012). International Performance Measurement and Verification Protocol, Concepts and Options for Determining Energy and Water Savings, Vol 1. Washington, DC: Efficiency Valuation Organisation (EVO).
Fabbri, K., and Tronchin, L. (2015). Indoor environmental quality in low energy buildings. Energy Proc. 78, 2778–2783. doi: 10.1016/j.egypro.2015.11.625
Fang, L., Clausen, G., and Fanger, P. O. (1998). Impact of temperature and humidity on perception of indoor air quality. Indoor Air 8, 80–90. doi: 10.1111/j.1600-0668.1998.t01-2-00003.x
Godoy-Shimizu, D., Armitage, P., Steemers, K., and Chenvidyakarn, T. (2011). Using display energy certificates to quantify schools' energy consumption. Build. Res. Inform. 39, 535–552. doi: 10.1080/09613218.2011.628457
Hong, S.-M., Paterson, G., Burman, E., Steadman, P., and Mumovic, D. (2014). A comparative study of benchmarking approaches for non-domestic buildings: Part 1 - Top-down approach. Int. J. Sustainable Built Environ. 2, 119–130. doi: 10.1016/j.ijsbe.2014.04.001
IEA (2013). Energy Policies of IEACountries, 2013 Review: Sweden. Paris: International Energy Agency (IEA).
Institute of Medicine of the National Academies (2011). Climate Change, the Indoor Environment, and Health. Washington, DC: The National Academies Press.
Larsen, T. S., Daniels, O., and Jensen, R. L. (2012). Evaluation of the Indoor Environment in 8 Danish Passive Houses. Trondheim: Passivhus Nordern.
Latham, M. (1994). Constructing the Team, Final Report of the First Government/Industry Review of Procurement and Contractual Agreement in the UK Construction Industry. London: HMSO.
Leaman, A., and Bordass, B. (2001). Assessing building performance in use 4: the Probe occupant surveys and their implications. Build. Res. Inform. 29, 129–143. doi: 10.1080/09613210010008045
Leaman, A., and Bordass, B. (2007). Are users more tolerant of ‘green' buildings?. Build. Res. Inform. 35, 662–673. doi: 10.1080/09613210701529518
Levermore, G. J., and Parkinson, J. B. (2006). Analyses and algorithms for new test reference years and design summer years for the UK. Build.Serv. Eng. Res. Technol. 27, 311–325. doi: 10.1177/0143624406071037
Maivel, M., Kurnitski, J., and Kalamees, T. (2015). Field survey of overheating problems in Estonian apartment buildings. Architec. Sci. Rev. 58, 1–10. doi: 10.1080/00038628.2014.970610
Markus, T. A., Whyman, P., Whitton, D., Maver, T., Canter, D., et al. (1972). Building Performance. London: Applied Science.
Mumovic, D., Palmer, J., Davies, M., Orme, M., Ridley, I., Oreszczyn, T., et al. (2009). Winter indoor air quality thermal comfort and acoustic performance of newly built secondary schools in England. Build. Environ. 44, 1466–1477. doi: 10.1016/j.buildenv.2008.06.014
Nathanson, T. (1995). Indoor Air Quality in Office Buildings: A Technical Guide. Ottawa, ON: Minister of Supply and Services Canada.
Norbäck, D., and Nordström, K. (2008). Sick building syndrome in relation to air exchange rate, CO2, room temperature and relative air humidity in university computer classrooms: an experimental study. Int. Arch. Occup. Environ. Health, 82, 21–30. doi: 10.1007/s00420-008-0301-9
Norford, L. K., Socolow, R. H., Hsieh, E. S., and Spadaro, G. V. (1994). Two-to-one discrepancy between measured and predicted performance of a ‘low-energy' office building: insights from a reconciliation based on the DOE-2 model. Energy Build. 21, 121–131. doi: 10.1016/0378-7788(94)90005-1
Palmer, J., Terry, N., and Armitage, P. (2016). Building Performance Evaluation Programme. Swindon: Innovate
Pegg, I. (2007). Assessing the Role of Post-occupancy Evaluation in the Design Environment - A Case Study Approach. London: Brunel University: EngD Environmental Technology Dissertation.
Preiser, W., and Schramm, U. (1997). Building Performance Evaluation. In: Time-Saver Standards for Architectural Data. s.l.:McGraw-Hill.
Preiser, W., and Vischer, J. C. (2005). Assessing Building Performance. Oxford: Butterworth Heinemann.
Rintala, K., and Griggs, R. (2009). PFI in school building – does it influence educational outcomes? s.l.: KPMG (RRD-129963).
Samuelson, H. W., Ghorayshi, A., and Reinhart, C. F. (2014). “Post-occupancy evaluation and partial-calibration of 18 design-phase energy models,” Proceedings ASHRAE/IBPSA-USA Building Simulation Conference (Atlanta), 168–176.
Shaughnessy, R. J., Haverinen-Shaughnessy, U., Nevalainen, A., and Moschandreas, D. (2006). A preliminary study on the association between ventilation rates in classrooms and student performance. Indoor Air 16, 465–468. doi: 10.1111/j.1600-0668.2006.00440.x
Shrubsole, C., Macmillan, A., Davies, M., and May, N. (2014). 100 Unintended consequences of policies to improve the energy efficiency of the UK housing stock. Indoor Built Environ. 23, 340–352. doi: 10.1177/1420326X14524586
Turner, C., and Frankel, M. (2008). Energy Performance of LEED for New Construction Buildings. Vancouver, BC: New Building Institute (NBI).
van Dronkelaar, C., Dowson, M., Burman, E., Spataru, C., and Mumovic, D. (2016). A review of the energy performance gap and its underlying causes in non-domestic buildings. Front. Mech. Eng. 1:17. doi: 10.3389/fmech.2015.00017
Voss, K., Herkel, S., Pfafferott, J., Löhnert, G., and Wagner, A. (2007). Energy efficient office buildings with passive cooling – Results and experiences from a research and demonstration programme. Solar Energy 81, 424–434. doi: 10.1016/j.solener.2006.04.008
Wargocki, P., and Wyon, D. P. (2006). Effects of HVAC on student performance. ASHRAE J. 2006, 23–28.
Wargocki, P., and Wyon, D. P. (2013). Providing better thermal and air quality conditions in school classrooms would be cost-effective. Build. Environ. 59, 581–589. doi: 10.1016/j.buildenv.2012.10.007
Williams, J. J. (2017). A socio-technical method to assess the holistic impact of new buildings on English secondary schools from the perspective of the students, London: Engineering Doctorate Dissertation, University College London (UCL).
Williams, J. J., Hong, S. M., Mumovic, D., and Taylor, I. (2015). Using a unified school database to understand the effect of new school buildings on school performance in England. Intell. Build. Int. 7, 83–100. doi: 10.1080/17508975.2014.931834
Keywords: building performance evaluations, schools, energy performance, thermal comfort, indoor air quality
Citation: Burman E, Kimpian J and Mumovic D (2018) Building Schools for the Future: Lessons Learned From Performance Evaluations of Five Secondary Schools and Academies in England. Front. Built Environ. 4:22. doi: 10.3389/fbuil.2018.00022
Received: 31 December 2017; Accepted: 26 March 2018;
Published: 19 April 2018.
Edited by:
Hasim Altan, University of Sharjah, United Arab EmiratesReviewed by:
Bassam Abu-Hijleh, British University in Dubai, United Arab EmiratesChao-Heng Tseng, National Taipei University of Technology, Taiwan
Copyright © 2018 Burman, Kimpian and Mumovic. This is an open-access article distributed under the terms of the Creative Commons Attribution License (CC BY). The use, distribution or reproduction in other forums is permitted, provided the original author(s) and the copyright owner are credited and that the original publication in this journal is cited, in accordance with accepted academic practice. No use, distribution or reproduction is permitted which does not comply with these terms.
*Correspondence: Esfand Burman, ZXNmYW5kLmJ1cm1hbkB1Y2wuYWMudWs=