 Harriette Stone
 Valentina Putrino
 Dina D'Ayala
- 1Urban Sustainability and Resilience, Civil, Environmental and Geomatic Engineering, University College London, London, United Kingdom
- 2EPICentre, Civil, Environmental and Geomatic Engineering, University College London, London, United Kingdom
The unique perspectives and viewpoints offered by omnidirectional camera technology has the potential to help improve the outcomes of technical post-earthquake reconnaissance missions. Omnidirectional imagery can be used to virtually “walk through” damaged streets post hoc with a 360°, immersive view. A common reconnaissance mission aim is to accurately collect damage data; however, there are time challenges for surveyors in the field. The manuscript explores the potential for using omnidirectional imagery to improve damage surveying, firstly by comparing results from damage surveys completed in the field with results obtained using omnidirectional images collected during a mission and surveyed by an experienced engineer virtually and secondly by comparing damage assessment obtained through omnidirectional imagery collected on the ground with the EU Copernicus damage assessment maps. The omnidirectional imagery data was collected during two separate Earthquake Engineering Field Investigation Team post-earthquake reconnaissance missions, namely the area affected by the 2016, 7.8 Muisne Earthquake in Ecuador and the area struck by the 2016, 6.2 Amatrice earthquake in Italy. Notwithstanding the diverse geographic scale, terrain and urban context of the two reconnaissance missions, the results consistently show significant capabilities for this technology in the identification of construction typologies, number of stories, aggregated “low” and “high” damage grades, and failure modes. The work highlights potential issues with correct identification of disaggregated lower damage grades (e.g., European Macroseismic Scale (EMS-98) damage grades 0–3). Challenges identified in the virtual survey process included poor image quality, insufficient photo sphere captures, and obstructions such as trees, walls or vehicles. The omnidirectional imagery represents a substantial improvement in damage assessment accuracy in respect to satellite imagery, especially for lower damage grades, while it is an essential tool for comprehensive surveys in reduced access zones with high levels of damage.
Introduction
Post-earthquake engineering reconnaissance missions play an important role in learning about the performance of structures and infrastructure under seismic loading, the social impacts of disasters, disaster management processes, and the science of seismic events (EERI, 2004). Technical missions are organized by national or international organizations such as the Earthquake Engineering Field Investigation Team (EEFIT) (e.g., Rossetto et al., 2014a) or the Earthquake Engineering Research Institute (EERI) (EERI, 2004). They bring together multidisciplinary teams to deploy to the affected areas after damaging earthquakes.
In-situ structural observations offer an important contribution to the understanding of how structures behaved during seismic shaking, and may include records of the mechanisms of structural failure and the scale and extent of damage to structures at a global and component level, including observations of undamaged structures (Greene et al., 2004; Spence, 2014). However, the extent of observations is often limited, confined to street level and constrained by the short period of time that a team is in the field. Particularly limited is the collection of damage statistics—important for understanding the overall effects of the earthquake, and for the development and validation of fragility and vulnerability functions (Rossetto et al., 2014b)—as the collection of unbiased and representative data during a reconnaissance mission is challenging (Novelli and D'Ayala, 2015) due to restricted schedules that lead to surveys of small and unrepresentative samples.
Imaging technology is being increasingly employed as data gathering or data enriching tool as it enhances mission capabilities and ensures the safer deployment of engineers to affected regions (Bardet and Liu, 2010; Dong et al., 2011). Of particular interest to this study is the use of omnidirectional (OD) imagery, a spherical photograph providing a 360° view around the photo location.
Chains of omnidirectional images can be collected using affordable and portable OD cameras and the development of online platforms to host these images means that photo chains can be viewed easily, in a manner similar to the one used for instance by Google Street View (2018)1 to provide an immersive “walk through” of a landscape. Their use in various fields of academic research is constantly increasing. Using virtual surveying techniques and algorithms, OD photo chains have been used in: urban search and rescue (Zhang et al., 2006); data collection of built environment characteristics affecting health-related behaviors (Wilson et al., 2012); damage data collection of flood affected buildings (Diakakis et al., 2017) identification of land use types (Zhang et al., 2017); classification of environmental indicators (Clarke et al., 2010); studies on the extent of tree cover (Berland and Lange, 2017); determination of cycling (Badland et al., 2010), car, or pedestrian safety (Yin et al., 2015); surveys of neighborhood crime (Rundle et al., 2011; Mooney et al., 2014; He et al., 2017) or health indicators (Odgers et al., 2012); and assessment of seismic vulnerability of structures (Pittore and Wieland, 2013; Stone et al., 2017).
The academic literature reports many benefits with the use of this technology. Firstly, the cost of virtual surveys over street surveys is significantly less (Badland et al., 2010; Clarke et al., 2010; Rundle et al., 2011; Odgers et al., 2012; Less et al, 2015; Berland and Lange, 2017; He et al., 2017). Secondly, the remoteness of the surveyor is cited as a key benefit in studies that may have an element of danger, hazard or other challenge in the field (for example inclement weather) (Rundle et al., 2011; Berland and Lange, 2017; He et al., 2017). Previous studies report the accuracy of virtual surveys to be good when compared to street surveys (Yin et al., 2015; Berland and Lange, 2017), which is promising, although this surely depends on the types of data collected. Challenges are also highlighted in previous studies, including the lesser level of smaller or intricate details available (Badland et al., 2010; Clarke et al., 2010; Curtis et al., 2010), gaps in the chains of OD images (Rundle et al., 2011; Guo, 2013; Mooney et al., 2014; Vanwolleghem et al., 2014), and levels of virtual surveyor bias (Mooney et al., 2014), although this is a challenge for street survey data too.
Chains of OD images may be used to improve statistical structural damage data by increasing sample sizes and allowing robust sampling techniques to be used across an earthquake affected area, however, the uncertainties associated with the validity of information inferred using this remote method, as well as the challenges with collecting detailed data, need to be investigated.
This study tests the capabilities of this technology in enhancing the outcomes of post-earthquake reconnaissance missions, by comparing it to traditional Rapid Visual Survey (RVS) data collection and to damage data obtained through satellite imagery. Results from in-field testing during two case studies, the 2016 Muisne earthquake in Ecuador and the 2016 Amatrice earthquake in Italy, are presented and the benefits and challenges of using omnidirectional cameras in this context are discussed. While the focus of this study is on building performance, these technologies also have the potential to investigate geological, seismological, and socio-economic impacts in post-disaster contexts.
Methodology
The methodology comprises the comparison of building and damage data observed through OD imagery with the ones obtained via diverse methods in two different studies completed in different post-earthquake contexts. The first took place following the Muisne, Ecuador earthquake in 2016 and focuses on comparing damage data from a series of rapid visual surveys (RVS) conducted in the field, to those conducted virtually along the same routes using chains of OD images. The second was completed following the Central Italy earthquakes in 2016. This study first calibrates the use of OD imagery with RVS data and subsequently compares virtual surveys using OD imagery to the damage data reported from satellite imagery. Both studies use the same camera equipment, a Ricoh Theta S, and visualize the imagery using the Mapillary platform (Mapillary, 2018)2 In both cases, the following characteristic were assessed: construction typologies, number of stories and level of damage. The correct attribution of the first two parameters allow classification of buildings in general typologies of exposure as defined in the most common seismic classification systems such as HAZUS (Applied Technology Council, 2010), EMS-98 (Grünthal, 1998), and GEM taxonomy (Brzev et al., 2013). These provide a first direct correlation between typologies and their relative seismic vulnerability and hence their expected level of damage in a destructive event. For the damage classification the EMS-98 damage scale (Grünthal, 1998) has been used in this study, as this is the reference scale for much of the EEFIT past reconnaissance work and for European official damage assessment. Greater detail about the two case studies is provided in the following subsections.
The context of the two EEFIT missions in which the OD camera was used to collect and analyze damage data, differed in the characteristics of the earthquake, the local topography, the urban context, the types of buildings in the affected area and the scale of damage caused. Hence, the analysis of both cases brings complementarity to the assessment of the effectiveness of the OD camera deployment in a wide range of conditions.
The first case study uses data collected during the 24 May−7 June 2016 EEFIT mission in Ecuador following the 2016 Muisne earthquake. A magnitude 7.8 earthquake struck Ecuador's central coast (see Figure 1) on the 16th of April 2016 at 18.58 local time, causing 700 fatalities, 30,000 injuries and widespread damage to the coastal region. The earthquake was registered at a depth of 19.2 km, with reported maximum Modified Mercalli Scale of VIII (USGS, 2016a) and peak ground acceleration of 1.55 g (Insituto Geofisíco, 2016). The most prevalent building typologies in the affected region are reinforced concrete (RC) frame construction with unreinforced block or brick masonry infill walls and buildings of timber and/or bamboo construction, including vernacular structural typologies such as bahareque (Franco et al., 2017). For further details of the event and the EEFIT mission's findings, please refer to Franco et al. (2017).
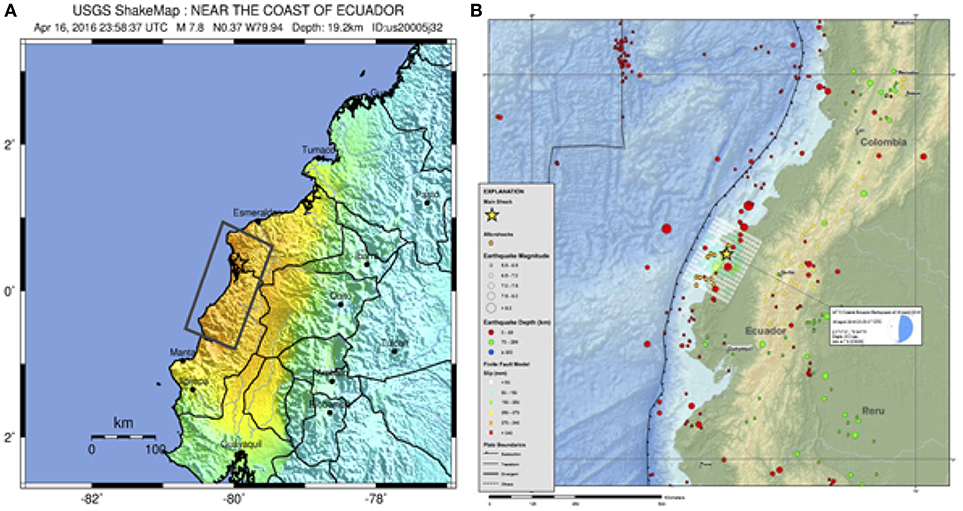
Figure 1. (A) ShakeMap and (B) Regional Seismicity event characterization of the Muisne Earthquake 2016 (USGS, 2016a).
The second case study uses data collected during the 4 October−16 October 2016 EEFIT mission to Central Italy following the 2016 Amatrice earthquake. At 3.36 am local time, on 24th August 2016 a Mw 6.2 earthquake struck the central part of the Italian peninsula, with epicenter in the Apennines range, near the village of Accumoli, causing 295 fatalities, 388 injuries and leaving more than 2,000 people homeless. According to the USGS ShakeMap (see Figure 2), the event was attributed an epicentral MCS (Mercalli–Cancani–Sieberg) intensity of IX (USGS, 2016b). The worst affected region had a radius of 20 km around the epicenter, including a number of mountain towns and small villages across the regions of Umbria, Lazio and Marche. The building stock of these urban centers mainly consists of historic rubble masonry structures, with a modest proportion of reinforced concrete (RC) buildings. The performance of the former was very poor and collapses were widespread. This event was the first in a sequence of three major earthquakes within 6 months; the data presented herein was collected just before the second main shock. For further details of the event or the EEFIT reconnaissance mission, please refer to EEFIT (2018).
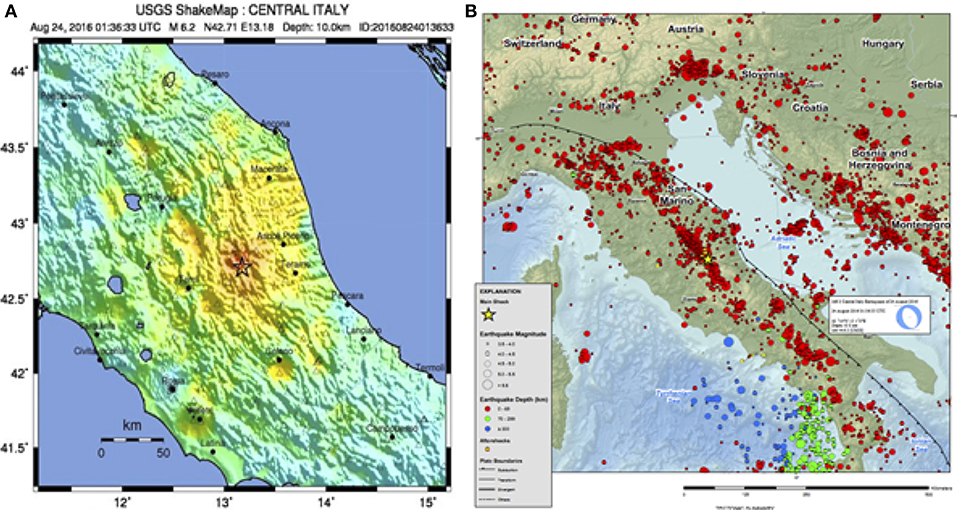
Figure 2. (A) ShakeMap and (B) Regional Seismicity event characterization of the Amatrice Earthquake 2016 (USGS, 2016b).
Case Study 1: Comparing Virtual Damage Survey Data With Street Survey
The study focused on determining whether virtual damage surveys conducted using OD imagery were comparable to rapid visual surveys completed on the ground. The method used comprised of two data gathering exercises and a direct comparison between resulting datasets. First, RVS took place along routes in three affected towns: Pedernales, Manta, and Portoviejo covering over 500 buildings. The survey collected data on the number of stories, construction typology (either RC, timber/bamboo, or other), and European Macrosesimic scale (EMS-98) damage grade (Grünthal, 1998) for each building. At the same time as the surveys were taking place, chains of omnidirectional images were taken along the same routes, on foot, at approximately twelve-meter intervals. The OD images were later uploaded to the Mapillary online platform (Mapillary, 2018)3 and a virtual surveyor was tasked with collecting the same information for the same routes.
Virtual damage surveying involves remote users “walking through” the streets on a computer or using virtual reality headsets, and assessing levels of damage much in the same way that engineers complete street surveys in the field. The virtual surveyor was an experienced engineer who had never visited Ecuador. They were given a briefing on the main construction typologies found on the mission and the EMS-98 damage grade system. Calibration exercises were completed on two buildings, where the author and the virtual surveyor discussed the results each would record, discussing the reasons for the decisions until agreement was made. The virtual surveyor worked for 30 h surveying all of the buildings. They were interviewed at the end of the exercise to understand the main challenges faced during the process.
Case Study 2: Comparing Virtual Damage Survey Data With Satellite Imagery Damage Data
The work in Italy focused on the ability of OD imagery to provide an enhanced understanding of damage with respect to the damage maps provided by the European Copernicus Emergency Management Service (Copernicus EMS, 2016). Copernicus EMS provides timely geospatial information derived from remote satellite sensing and completed by available in situ open data sources for emergency response to a wide range of natural damaging events. According to the legend provided, both buildings and transportation routes are assessed on a scale of four damage grades, from negligible to collapse.
Very narrow lanes, built on steep slopes and often inaccessible due to the presence of debris and rubbles obstructing the road, characterize the historic urban settlements visited during the Central Italy mission. Site conditions were considered unsafe by the Civil Protection and “red zones” (i.e., zones with very limited or no access) were established in most of the town visited: in Amatrice and Pescara del Tronto, the team was escorted by fire fighters and only allowed to walk through, keeping a secure distance from collapsing buildings. OD imagery was collected during the walk through, but there was no chance to fill in RVS forms. In Accumoli and Arquata del Tronto, the safety conditions allowed for RVS forms and OD data gathering. Hence, first a calibration exercise was completed comparing about 70 street surveys with results from virtual surveys using OD imagery in these two towns. The next step compared damage grades determined by satellite imagery and those determined through virtual survey using OD imagery collected during the walk-through: 300 buildings were compared building-by-building in the four towns.
Independence between the RVS and the OD virtual survey was ensured by separating the two tasks among the team members, however the “virtual surveyor” had walked through the real sites, while collecting the imagery, hence having sufficient knowledge of typologies and damage scoring procedures. Total independence of assessment was instead assured between the OD imagery and the Copernicus EMS maps.
Results and Discussion
Comparing Street Surveys With Virtual Surveys Using Omnidirectional Imagery
With regard to the Ecuador EEFIT mission, the comparison of surveyed proportions of different construction types (broadly categorized as either timber, reinforced concrete (RC), other or unknown) are presented in Figure 3 for the three towns of Pedernales, Portoviejo and Manta, as well as an aggregated result. The OD imagery survey results consistently report more unknowns, due to the difficulty in identifying construction types. This is particularly present for the lesser damaged buildings where cladding and finishes are more likely to remain intact.
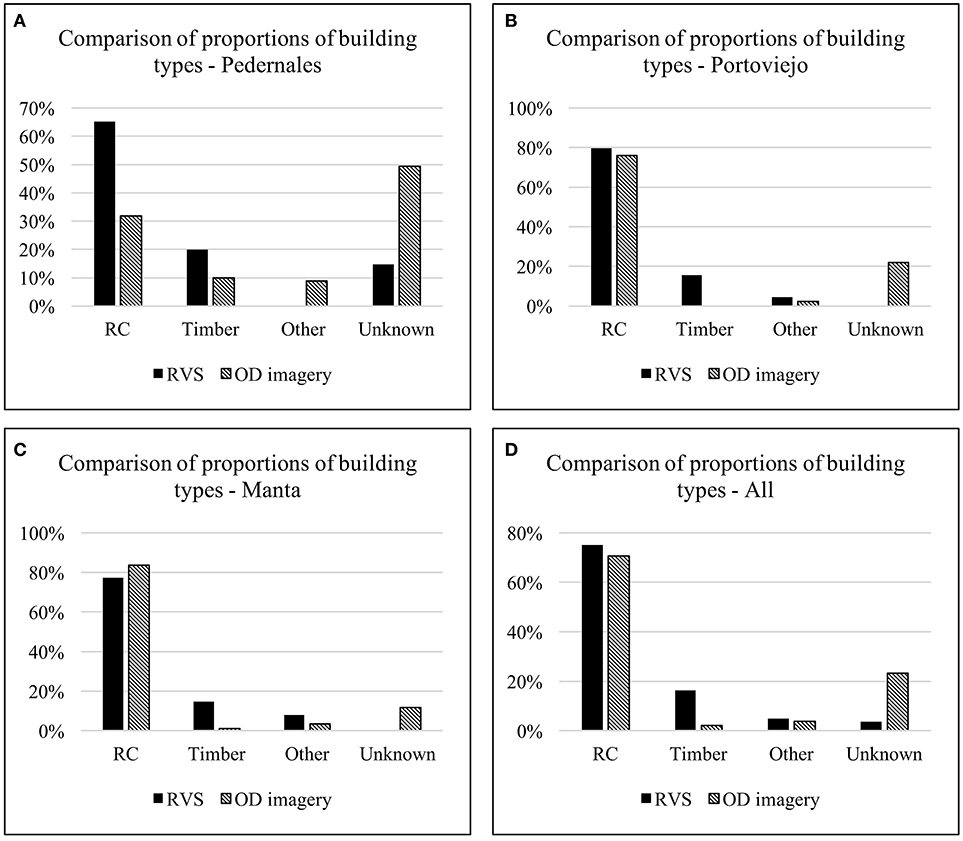
Figure 3. Comparisons of proportions of building types identified for (A) Pedernales, (B) Portoviejo, (C) Manta, and (D) Overall.
For Portoviejo and Manta, the proportions of each construction type are comparable whereas in Pedernales the number of unknowns is much larger. This is likely to be due to the vast number of demolished buildings, for which ground surveys had a better chance of ascertaining the number and construction type of the removed building through remaining foundations or the local knowledge of assistants or people on the street. Nonetheless, this also presents difficulties as field observations collected in this manner may be biased. In Manta, timber buildings were not identified accurately in the OD imagery survey, probably due to a fashion for obscuring timber elements with facades or finishes, to give the appearance of RC structure. On the ground, this practice was more obvious as surveyors could view the columns more closely, or see timber structure on the underside of overhangs potentially not visible on the nearest photo spheres.
The results for the number of stories are given in Figure 4. Generally, the results compare well, however, there are clear issues with unknown heights of demolished buildings in the OD imagery survey, which were correctly captured by the ground surveyors, especially in Manta where most demolished buildings could be viewed prior to the earthquake in Google Street View (N.B. this back-checking was used in the ground survey results only due to methodological limitations).
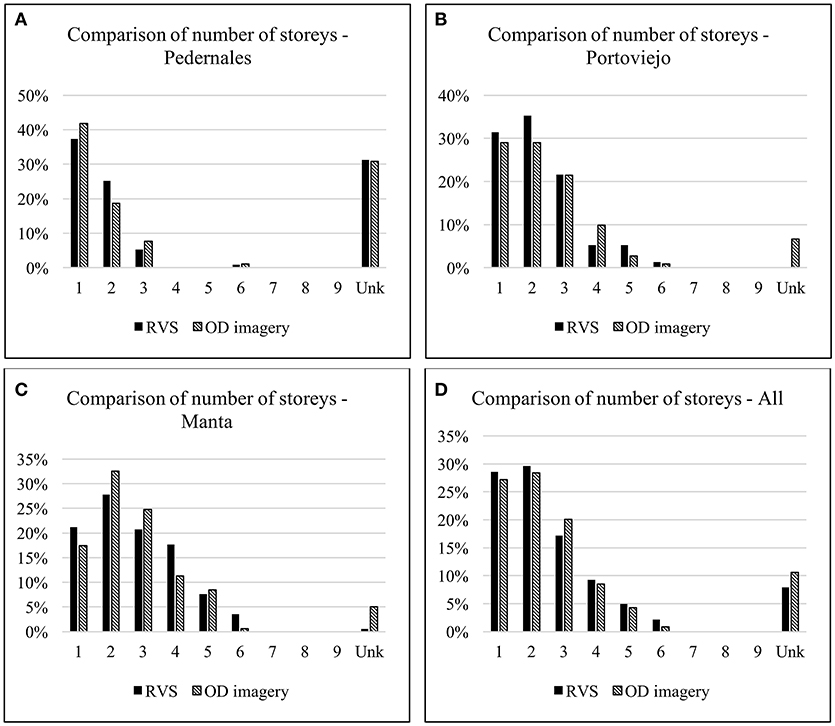
Figure 4. Comparisons of proportions of number of stories identified for (A) Pedernales, (B) Portoviejo, (C) Manta, and (D) Overall.
In addition, the virtual surveyor reported that any additional story with light metal roof structure constructed on top of an RC frame were ignored unless masonry walls had been raised up to the new roof level, whereas in the ground survey all stories, regardless of material, were recorded. This discrepancy could be overcome with appropriate calibration exercises between ground and virtual surveyors. Moreover, in the RVS, the number of stories recorded was the maximum for each individual structure, and sometimes buildings had extra floors but set back away from the road. In some circumstances, the highest story may not be visible or clear in the nearest photos spheres leading to additional discrepancies.
The final comparison between survey results is between recorded EMS-98 damage grades. These are the most difficult data to collect and is likely to attract a significant proportion of surveyor bias and error. It can be particularly challenging to assign the lower damage grades as it is difficult to visually capture both the structural and non-structural damage criteria (Grünthal, 1998). Additionally, clues of light damage may not always be observed in RVS or in relatively low-resolution photo spheres. The results in Figures 5, 6 show that it was difficult to identify the lower damage grades accurately in the virtual survey, in line with comments from the virtual surveyor who cited poor image quality and stretches of street with photo spheres spaced too far apart (hence no good view of certain buildings) as major issues.
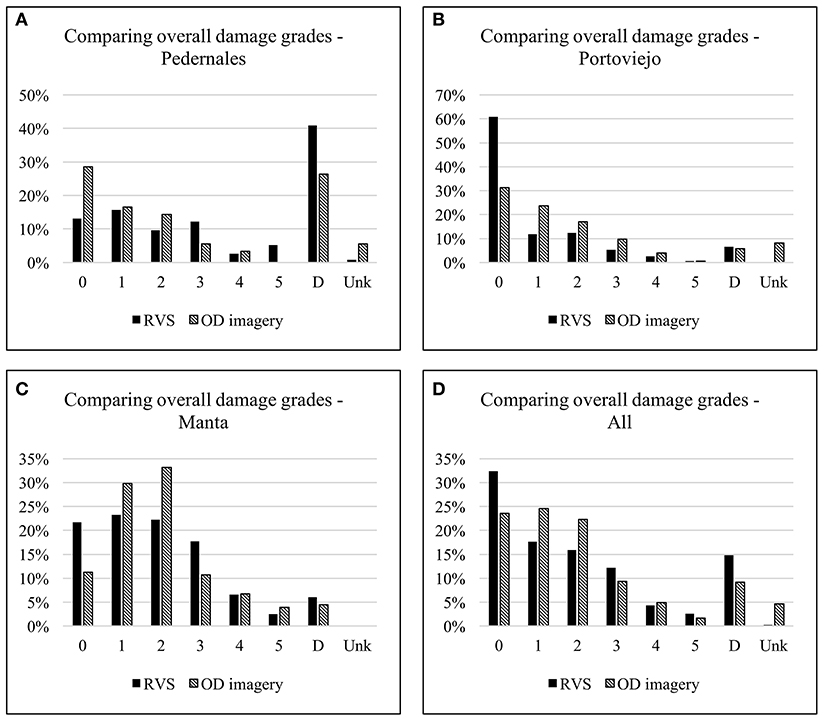
Figure 5. Comparisons of proportions of overall EMS-98 damage grades identified for (A) Pedernales, (B) Portoviejo, (C) Manta, and (D) Overall (D denotes demolished buildings, and Unk denotes Unknown).
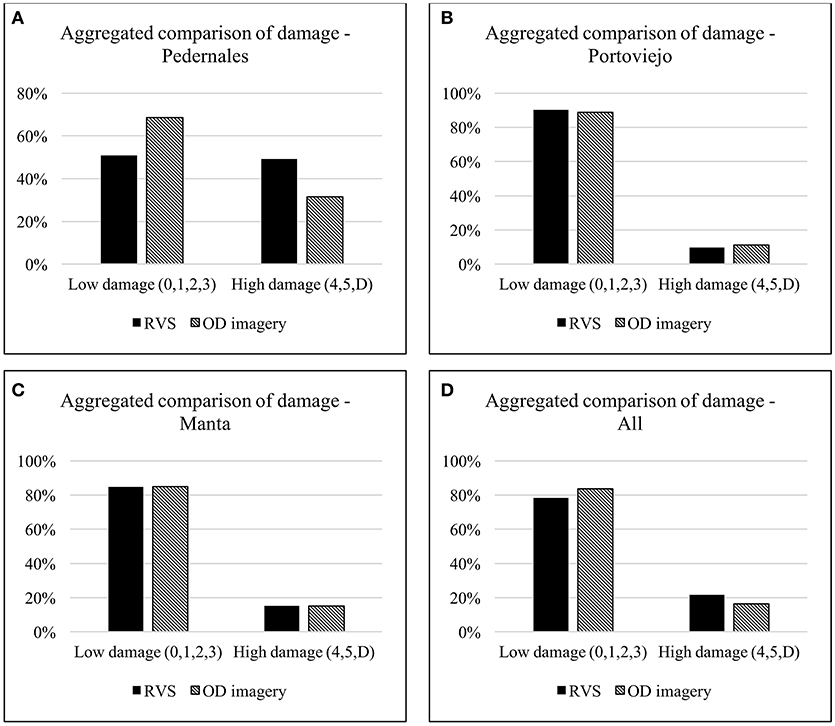
Figure 6. Comparisons of proportions of aggregated EMS-98 damage grades identified for (A) Pedernales, (B) Portoviejo, (C) Manta, and (D) Overall (D denotes demolished buildings).
When the damage grades are aggregated into “Low” and “High” damage, corresponding to EMS-98 damage grades 0–3, and 4–5 respectively, the results compare well (see Figure 6). In Pedernales, however, differences appear due to the high number of demolished structures. The lack of available information on how many demolished buildings were found in an empty block, where all buildings had been removed, penalized the virtual surveyor, while the ground surveyors had the advantage of observing the bases of columns or details in the ground to identify separate buildings, or employ the knowledge of locals present in the field. Again, poor image quality or the lack of regular photo spheres close enough to each other were cited as constraints to reliable assessment by the virtual surveyor. Additionally, buildings were often obscured by objects such as trees, walls or vehicles, making judgements difficult for a virtual surveyor, whereas ground surveyors can often exclude these obstructions by finding an alternative view point.
This finding highlights a potential need for a new damage scale that may be used for virtual surveying, aggregating little or no damage together, but still distinguishing it from significant damage and partial or total collapse, in line with building tagging practices, for safe access and demolition (Applied Technology Council, 2005). This would remain helpful from a disaster response point of view, but would lose some detail when developing fragility functions (Rossetto et al., 2014b). Significance of the economic losses associated with the lower damage grades when compared to the higher damage grades is an open issue in seismic risk assessment, as it is highly dependent on the building stock and magnitude of the seismic event considered (Martins et al., 2014).
Overall, the differences between RVS and virtual (using OD imagery) survey results are reported in Table 1, indicating the degree of variation between the two datasets.
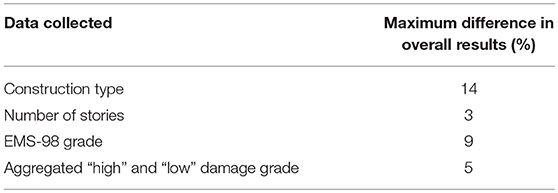
Table 1. Maximum differences between virtual and ground survey results for all buildings.
Comparing Virtual Surveys Using Satellite Imagery and Omnidirectional Imagery
The comparison of RVS and OD based post-earthquake survey data discussed in the previous section has shown some of the inherent limitations of the OD technology, namely the image quality and the extent of overlap of the photosphere. This notwithstanding, according to Table 1, damage statistic comparison leads to a maximum difference of 9%. In this section, the difference in damage distribution obtained with OD data and data from the satellite-imagery based Copernicus EMS platform is investigated for the case of the Central Italy EEFIT mission. Firstly, the OD data is validated with the available RVS data.
Figure 7 shows the distribution of building types obtained with RVS and OD imagery for the two towns of Arquata del Tronto and Accumoli. The proportion of buildings attributed to each of the two typologies [load bearing masonry and reinforced concrete frames (RC)] shows very good correlation. This is due to the fairly homogenous building stock of these towns and the clear difference in appearance of the two typologies. The attribution to typologies becomes less straightforward if, within the masonry class, the attempt is made to determine different types of fabric, i.e., rubble stonework or brickwork, as they are often plastered, or to identify the presence of strengthening or retrofitting devices.
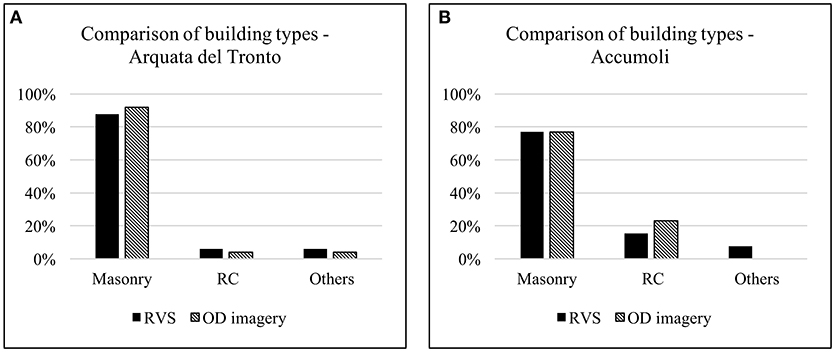
Figure 7. Comparisons of building types identified by means of Rapid Visual Survey (RVS) forms and OD imagery for (A) Arquata del Tronto, and (B) Accumoli.
Figure 8 shows the results for the proportion of buildings with different number of stories for each town. Buildings have been categorized as “unknown” if they had collapsed, while the category “others” includes buildings classified in the RVS as buildings with vertical addition. Discrepancy in this class results from the difficulty in distinguishing such additions from the other stories using the OD imagery.
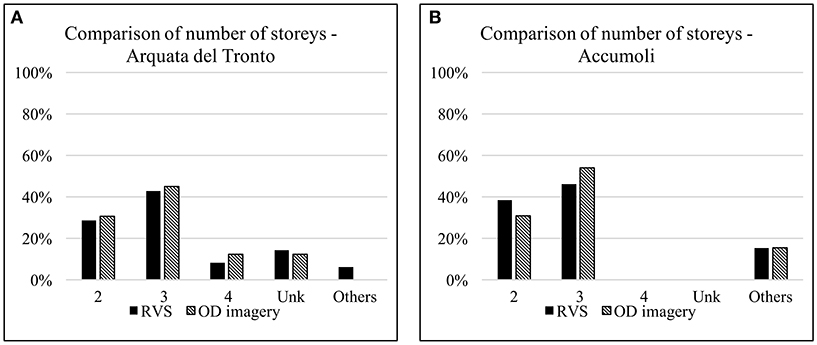
Figure 8. Comparisons of number of stories between Rapid Visual Survey (RVS) forms and OD imagery for (A) Arquata del Tronto, and (B) Accumoli.
As a final step of validation of the OD based survey with the RVS survey, damage data is compared. Given the homogeneity of the building stock together with the difference in damage level distribution at each of the four sites, and conversely the relatively modest number of RVS forms completed, the comparison of damage distribution between RVS and OD data is carried out over the whole data set of 100 RVS forms. The EMS-98 damage scale is used, where level D1 and D2 are compounded in the category light damage.
Table 2 shows that the differences in damage level attribution are in line with the differences identified in the Ecuador survey over a significantly larger dataset. These values can be attributed to surveyor bias rather than the specific limitations of the technology.
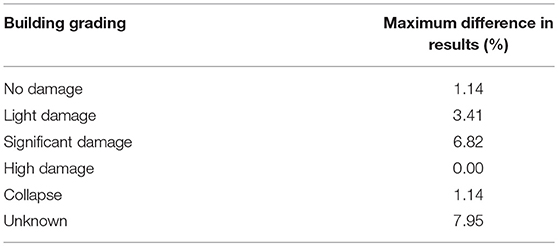
Table 2. Maximum differences between RVS and OD imagery proportions for building damage.
The use of high resolution satellite imagery for seismic damage detection has steadily increased in the past two decades (Yamazaki et al., 2004; Tong et al., 2012; Hancilar et al., 2013), especially since resolution, frequency and extent of globe surface coverage have increased, while costs have reduced, to the extent that imagery is in some cases open source. Damage detection is usually carried out through changes in pixilation and pictometry (Saito et al., 2010), in the immediate aftermath of the strong motion, at large territorial scale to inform emergency management decisions (Voigt et al., 2007). Moreover, several studies are available in literature investigating the use of satellite imagery for detecting structural damage (Dell'Acqua and Gamba, 2012). Oblique imagery has been identified as a more useful data source that provides multi-perspective information, overcoming the constraints of aerial nadir views, however its use is currently limited by costs, availability, and extent of coverage (Vetrivel et al., 2015).
Figure 9 shows the comparison between damage data obtained from aerial-imagery based maps and the OD imagery collected on site. A total dataset of 300 buildings were surveyed across the four towns, matching the buildings mapped by Copernicus EMS with the walk-through itineraries covered during the ground survey. The recorded damage grades for OD and Copernicus EMS are comparable, with the “highly damaged” grade in the OD survey corresponding to “moderately damaged” and “highly damaged” as graded by Copernicus EMS.
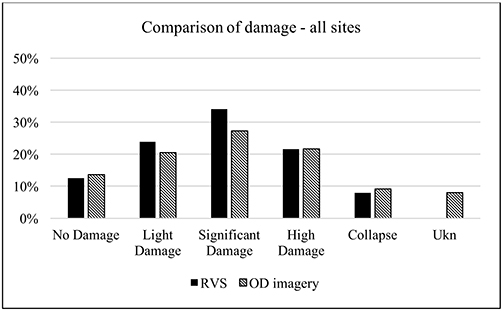
Figure 9. Comparison of building damage identified by Rapid Visual Survey (RVS) and OD imagery for all sites in Central Italy 2016 earthquake.
Generally, as expected the largest discrepancy in damage states occurs for the lower levels of damage, whereby the aerial survey records no-damage vis a vis significant proportions of light or significant damage observed through virtual OD survey. Less obvious is the case of underestimated collapses in the town of Amatrice (Figure 10A) and Pescara del Tronto (Figure 10B). In the case of Amatrice the misclassification is between high damage including partial collapse and collapse. Figure 11, showing the itinerary of the OD survey in Pescara del Tronto and the overlaying of the two mapping exercises, highlights how in cases of extensive collapse and poor access, the aerial mapping still produces the greatest coverage, whereas the southeastern end of the town, which suffered a landslide and was inaccessible by road. Inaccuracies in classification among damage levels in this case appear to be random, perhaps attributable in some case to the small size of the building stock, meaning that only very few pixels cover one particular building, making the attribution of damage highly uncertain.
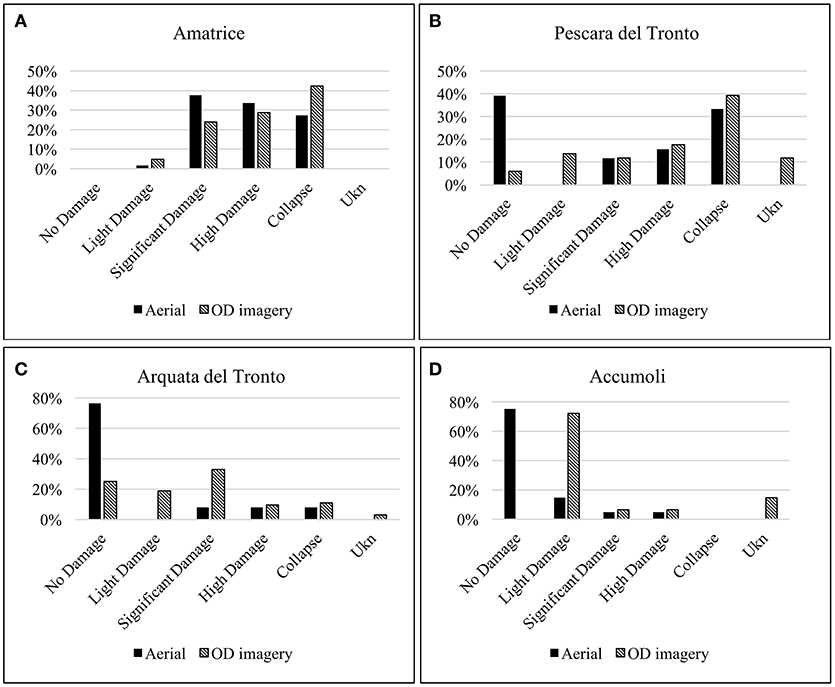
Figure 10. Comparisons of damage distribution identified by means of Copernicus maps (Aerial) and Ground field investigation (OD imagery) for (A) Amatrice, (B) Pescara del Tronto, (C) Arquata del Tronto, and (D) Accumoli.
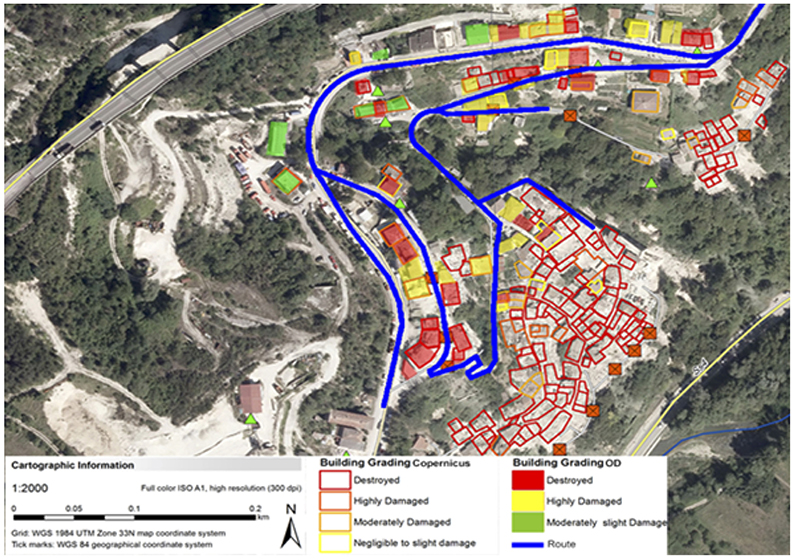
Figure 11. Correlation between Copernicus aerial map and ground survey (OD imagery) -Pescara Del Tronto. Copyright: 2016 Copernicus Emergency Management Service.
The case of Arquata del Tronto (Figure 10C) is instead significant to demonstrate the extent of structural damage underestimation that affects the use of satellite images when capturing lower damage grades. At the time of the assessment, the damage conditions of Arquata del Tronto were moderate. Besides few exceptions of complete collapse, correctly detected from the aerial view, most of the other buildings were affected by considerable structural damage, although no partial or total collapse had been taken place. This particular damage condition is difficult to detect from aerial view, as it mainly involves cracks in walls, but easy to ascertain through OD as the structural damage is clearly visible in the photosphere. Finally, the comparison in Figure 10D refers to Accumoli, which at the time of the assessment had very moderate damage. None of the buildings mapped by Copernicus EMS is classified as collapsed and this information was proven correct when compared to the OD imagery. However, there was a considerable extent of mismatch in terms of lower damage grades detected between the aerial view and the ground survey. The majority of the buildings mapped as negligibly damaged was instead affected by moderate damage, proving that a more detailed assessment can be obtained from the ground survey when the damage extent is less widespread. Moreover, Copernicus EMS assigned high damage to a number of buildings with significant roof damage, which could not be detected from the OD photo, given the very small ratio of street width to building height in the town and no significant visible damage on the facades.
A representative example of this mismatch can be observed in Figures 12A,B. The building marked in blue in Figure 12A is classified as undamaged by the aerial survey, whereas the picture taken with the OD camera taken on site demonstrates the real condition of the building which, although no damage was visible from above, there was extensively damage to the structural walls. Similarly, Figure 12C shows a portion of the aerial map of Accumoli, where a residential building, marked in blue, is classified as moderately damaged, whereas Figure 12D shows partial collapse of the façade although the roof is undamaged.
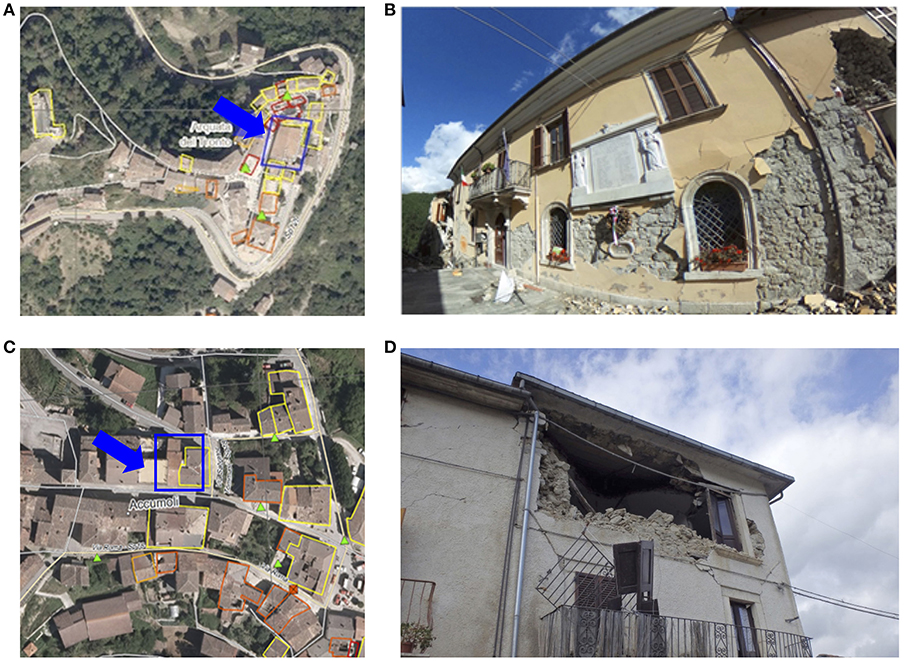
Figure 12. Arquata del Tronto (A) aerial view of the City Hall Building from Copernicus; (B) photographic record. Accumoli (C) aerial view of residential building from Copernicus; (D) photographic record. Copyright: 2016 Copernicus Emergency Management Service.
Table 3 shows the maximum differences between the two sets of damage distribution for the total sample of 300 buildings, where positive values indicate overestimate of the damage class by the aerial survey in respect to the OD. Although by coincidence, the difference in significant damage amounts to 0% overall, in Arquata del Tronto this damage level is underestimated by 25%, while in Amatrice is overestimated by 13%. The best agreement between the two surveys is for the class of high damage, which has a difference of 1% overall, and with a maximum of 5% overestimation in Amatrice. The greatest difference at town level are in Accumoli and Arquata del Tronto, between buildings classified as undamaged, while they suffered minor or light damage. Such mismatch, globally up to 32%, reaches 75% in Accumoli.
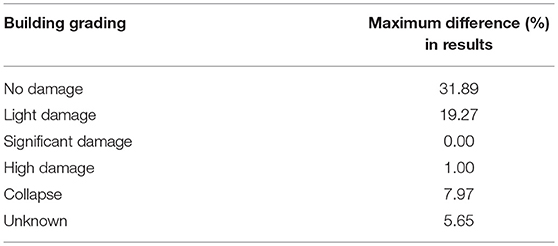
Table 3. Maximum differences between aerial and OD imagery proportions for building damage.
Conclusions
The use of omnidirectional imagery has several shortcomings which have been exposed in the field and post-mission analysis. These include poor image quality, the lack of photos close enough to each other, and objects obscuring the view. The quality of the image could be improved with the use of more advanced (and expensive) cameras (the model used for this experiment was the cheapest available on the market). The lack of photos or the need for additional viewpoints could be improved by decreasing the distance between images. This will increase the data storage burden of devices in the field but will increase the abilities of the virtual surveyors to observe buildings and make the required judgements. The optimal distance between images is reportedly between 10 and 12 m, however on more obstructed streets (e.g., tree-lined), this could be reduced to allow more chance of useful images to be taken. Ideally, this distance should consider the size of the building units, and as such on the Central Italy 2016 Earthquake mission photos were taken as frequently as every 6 m to improve coverage.
Despite these challenges, the comparative results here show a strong link between RVS surveys and virtual OD imagery surveys. When quantity of data is important, virtual surveys could offer an effective and safer option. With advances in online tools, such as Mapillary and Humanitarian Open Street Map, “citizen engineers” and volunteers could analyze large amounts of data to rapidly provide a qualitative assessment of damage levels to different types of buildings post-earthquake. There are other agencies or organizations that would be able to use the collected images in their post-disaster response too. Large amounts of resources are mobilized post-disaster to assess the needs on the ground and these images may help to direct these assessments to the worst hit areas. In addition, groups using the GRADE (Global rApid post-disaster Damage Estimate) (Gunusekera et al., 2018) methodology would benefit significantly from OD imagery soon after a disaster, as it would enable faster and more accurate estimations of damage and loss when time and accuracy are critical.
OD imagery proved to be very useful in integrating information provided by aerial maps (i.e., Copernicus EMS maps) which tend to capture accurately well the higher damage levels while proving to be coarser in capturing more modest damage grades. This is due to the technical limitations of the satellite optical radius, the distance and the atmospheric conditions at the time of the image capturing, which are all influencing factors affecting the level of accuracy of the output.
When consideration is given to the reasons in support of the use of satellite images, (i.e., to aid the emergency activity of search and rescue in the aftermath of a natural disaster) then the already achieved level of information provided can be considered sufficiently detailed. When, on the other hand, the main aim is to carry out damage assessment of buildings, the level of information provided by satellite imagery proves not to be sufficient thus requiring further enhancement. Ground investigation methods such as rapid visual survey forms are among the most common approaches used, since they do not require specific technical requirements nor experts to be trained beforehand. However, OD imagery proves to be the fastest and often only method to gather data when safety conditions on site are very strict. These cameras can be mounted on poles and brought around to capture images while authorized personnel (i.e., Civil Protection or Army) is active on site in the immediate aftermath of disasters. Such evidence can provide real time information required for subsequent authorized teams, i.e. tagging teams or teams assessing buildings for reconnaissance, to carry out damage assessment to buildings and infrastructures for research and knowledge transfer purposes.
Author Contributions
HS designed, conducted and analyzed the case study in Ecuador. VP and DD designed, conducted and analyzed the case study in Italy. All authors contributed to the drafting of the manuscript.
Funding
Funding for this research was provided from: EPSRC Centre for Doctoral Training Grant No. EP/G037698/1, and the 2016 EEFIT Reconnaissance Mission to Amatrice, Italy Earthquake Research Grant, NERC /P01660X.
Conflict of Interest Statement
The authors declare that the research was conducted in the absence of any commercial or financial relationships that could be construed as a potential conflict of interest.
Acknowledgments
The work employs data collected on the EEFIT Ecuador 2016 mission formed of Guillermo Franco (Lead), HS (Deputy Lead), Jorge Lopez, Fiona Hughes, Bayes Ahmed, Sebastian Kaminski, and Nina Jirouskova. The ground surveyors were Jorge Lopez, Sebastian Kaminski, HS, and Guillermo Franco. The virtual surveyor was Camilo De La Barra Bustamente. The EEFIT mission to Ecuador received enormous and generous support: for a complete list of acknowledgments see (Franco et al., 2017). The EEFIT mission to Central Italy was led by DD, and the team was subdivided into four groups, looking at different aspects of the earthquake aftermath. The sub-team looking at the structural damage to residential and cultural buildings and infrastructures (road and bridges) was formed of Paolo Perugini, Andrea Totaro and VP (the co-author), who also collected the OD imagery required for the relating part of this study. The RVS data was collected by all members of the mission. The complete list of acknowledgments for the Central Italy EEFIT mission is reported in the final report (see EEFIT, 2018).
Footnotes
1. ^Available online at: https://mapstreetview.com/
2. ^Available online at: https://www.mapillary.com/.
3. ^Available online at: https://www.mapillary.com/
References
Applied Technology Council (2005). Field Manual Post-Earthquake Safety Evaluation of Buildings (ATC-20-1). Redwood City, CA: Applied Technology Council.
Applied Technology Council (2010). HAZUS–MH MR5 Technical and User Manual. Washington, DC, Federal Emergency Management Agency.
Badland, H. M., Opit, S., Witten, K., Kearns, R. A., and Mavoa, S. (2010). Can virtual streetscape audits reliably replace physical streetscape audits? J. Urban Health. 87, 1007–1016. doi: 10.1007/s11524-010-9505-x
Bardet, J. P., and Liu, F. (2010). Towards virtual earthquakes: using post-earthquake reconnaissance information. Online Information Rev. 34, 59–74. doi: 10.1108/14684521011024128
Berland, A., and Lange, D. A. (2017). Google street view shows promise for virtual street tree surveys. Urban Forest. Urban Green. 21, 11–15. doi: 10.1016/j.ufug.2016.11.006
Brzev, S., Scawthorn, C., Charleson, A., and Jaiswal, K. (2013). GEM Building Taxonomy Version 2.0. Pavia, Global Earthquake Model.
Clarke, P., Ailshire, J., Melendez, R., Bader, M., and Morenoff, J. (2010). Using Google Earth to conduct a neighborhood audit: reliability of a virtual audit instrument. Health Place 16, 1224–1229. doi: 10.1016/j.healthplace.2010.08.007
Copernicus EMS (2016). Directorate Space, Security and Migration, European Commission Joint Research Centre (EC JRC) Available online at: http://emergency.copernicus.eu/ (Accessed August 30, 2016).
Curtis, A., Duval-diop, D., and Novak, J. (2010). Identifying spatial patterns of recovery and abandonment in the post-katrina holy cross neighborhood of new orleans. Cartogr. Geogr. Information Sci. 37, 45–56. doi: 10.1559/152304010790588043
Dell'Acqua, F., and Gamba, P. (2012). Remote sensing and earthquake damage assessment: experiences, limits and perspectives. Proc. IEEE 100, 2876–2890. doi: 10.1109/jproc.2012.2196404
Diakakis, M., Deligiannakis, G., Pallikarakis, A., and Skordoulis, M. (2017). Identifying elements that affect the probability of buildings to suffer flooding in urban areas using Google Street View. A case study from Athens metropolitan area in Greece. Int. J. Disaster Risk Reduction 22, 1–9. doi: 10.1016/j.ijdrr.2017.02.002
Dong, Y., Li, Q., Dou, A., and Wang, X. (2011). Extracting damages caused by the 2008 Ms 8.0 Wenchuan earthquake from SAR remote sensing data. J. Asian Earth Sci. 40, 907–914. doi: 10.1016/j.jseaes.2010.07.009
EERI (2004). Learning from Earthquakes Program: A Brief Synopsis of Major Contributions. Oakland, CA: EERI.
Franco, G., Stone, H., Ahmed, B., Chian, S. C., Hughes, F., Jirouskova, N., et al. (2017). “The April 16 2016 M w 7. 8 muisne earthquake in ecuador–preliminary observations from the EEFIT Reconnaissance Mission of May 24-June 7,” in Proceedings of 16th World Conference on Earthquake Engineering (Santiago).
Greene, M., Grossi, P., Tubbesing, S. K., Basoz, N., and Love, R. J. (2004). “Learning from earthquakes: new directions and initiatives,” in Proceedings of 13th World Conference on Earthquake Engineering (Vancouver, BC).
Grünthal, G. (1998). European Macroseismic Scale 1998. Luxembourg, Centre Europèen de Géodynamique et de Séismologie.
Gunusekera, R., Daniell, J., Pomonis, A., Donoso Arias, R. A., Ishizawa, O., and Stone, H. (2018). Methodology Note on the Global rApid post-disaster Damage Estimation (GRADE) approach. Washington, DC: Global Facility for Disaster Reduction and Recovery.
Guo, Z. (2013). Residential street parking and car ownership. J. Am. Planning Assoc. 79, 32–48. doi: 10.1080/01944363.2013.790100
Hancilar, U., Taucer, F., and Corbane, C. (2013). Empirical fragility functions based on remote sensing and field data after the 12 January 2010 Haiti earthquake. Earthquake Spectra 29, 1275–1310. doi: 10.1193/121711EQS308M
He, L., Páez, A., and Liu, D (2017). Built environment and violent crime: an environmental audit approach using google street view. Computers Environ. Urban Syst. 66, 83–96. doi: 10.1016/j.compenvurbsys.2017.08.001
Insituto Geofisíco (2016). Terremoto 16 de Abril 2016. Available online at www.igepn.edu.ec/eq20160416-informes-noticias
Less, E. L., McKee, P., Toomey, T., Nelson, T., Erickson, D., Xiong, S., et al. (2015). Matching study areas using Google Street View: a new application for an emerging technology. Eval. Program Plann. 53, 72–79. doi: 10.1016/j.evalprogplan.2015.08.002
Martins, L., Silva, V., Marques, M., Crowley, H., and Delgado, R. (2014). “Evaluation of analytical fragility and damage-to-loss models for reinforced concrete buildings,” in Proceedings Second European Conference on Earthquake Engineering and Seismology, (Istanbul).
Mooney, S. J., Cade, M. D. M., Lovasi, G. S., Neckerman, K. M., Teitler, J. O., and Rundle, A. G. (2014). Validity of an ecometric neighborhood physical disorder measure constructed bu virtual street audit. Am. J. Epidemiol. 180, 626–635. doi: 10.1093/aje/kwu180
Novelli, V. I., and D'Ayala, D. (2015). LOG-IDEAH: LOGic trees for identification of damage due to earthquakes for architectural heritage. Bull. Earthquake Eng. 13, 153–176. doi: 10.1007/s10518-014-9622-0
Odgers, C. L., Caspi, A., Bates, C. J., Sampson, R. J., and Moffitt, T. E. (2012). Systematic social observation of children's neighbourhoods using Google Street View: a reliable and cost-effective method. J. Child Psychol. Psychiatry 53, 1009–1017. doi: 10.1111/j.1469-7610.2012.02565.x
Pittore, M., and Wieland, M. (2013). Toward a rapid probabilistic seismic vulnerability assessment using satellite and ground-based remote sensing. 68, 115–145. doi: 10.1007/s11069-012-0475-z
Rossetto, T., D'Ayala, D., Gori, F., Persio, R., Jan, J., Novelli, V., et al. (2014a). The value of multiple earthquake missions: the EEFIT L'Aquila earthquake experience. Bull. Earthquake Eng. 12, 277–305. doi: 10.1007/s10518-014-9588-y
Rossetto, T., D'Ayala, D., Ioannou, I., and Meslem, A. (2014b). “Evaluation of existing fragility curves,” in SYNER-G: Typology Definition and Fragility Functions for Physical Elements at Seismic Risk, eds K. Pitilakis, H. Crowley, and A. M. Kaynia (Dordrecht: Springer), 47–93. doi: 10.1007/978-94-007-7872-6_3
Rundle, A. G., Bader, M. D., Richards, C. A., Neckerman, K. M., and Teitler, J. O. (2011). Using google street view to audit neighborhood environments. Am. J. Prevent. Med. 40, 94–100. doi: 10.1016%2Fj.amepre.2010.09.034
Saito, K., Spence, R., Booth, E., Madabhushi, G., Eguchi, R., and Gill, S. (2010). “Damage assessment of Port au Prince using pictometry,” in Proceedings of the Eighth International Conference on Remote Sensing for Disaster Response (Tokyo).
Spence, R. (2014). “The full-scale laboratory: the practice of post-earthquake reconnaissance missions and their contributions to earthquake engineering,” in Perspectives on European Earthquake Engineering and Seismology, ed A. Ansal (Cham: Springer), 1–52. doi: 10.1007/978-3-319-07118-3_1
Stone, H., D'Ayala, D., and Wilkinson, S. (2017). The Use of Emerging Technology in Post-disaster Reconnaissance Missions. London: EEFIT.
Tong, X. H., Hong, Z. H, Liu, S. J., Zhang, X., Xie, H., Li, Z. Y., et al. (2012). Building-damage detection using pre-and post-seismic high-resolution satellite stereo imagery: a case study of the May 2008 Wenchuan earthquake. ISPRS J. Photogramm. Remote Sens. 68, 13–27. doi: 10.1016/j.isprsjprs.2011.12.004
USGS (2016a). Summary of the M7.8 Muisne Event. Reston, VA: USGS. Available online at https://earthquake.usgs.gov/earthquakes/eventpage/us20005j32#executive
USGS (2016b). Summary of the M 6.2 Norcia Event. Reston, VA: USGS. Available online at https://earthquake.usgs.gov/earthquakes/eventpage/us10006g7d#executive
Vanwolleghem, G., Van Dyck, D., Sucheyne, F., De Bourdeaudhuij, I., and Cardon, G. (2014). Assessing the environmental characteristics of cycling routes to schools: a study on the reliability and validity of a Google Street View-based audit. Int. J. Health Geogr. 13:1. doi: 10.1186/1476-072X-13-19
Vetrivel, A., Gerke, M., Kerle, N., and Vosselman, G. (2015). Identification of damage in buildings based on gaps in 3D point clouds from very high resolution oblique airborne images. ISPRS J. Photogr. Remote Sens. 105, 61–78. doi: 10.1016/j.isprsjprs.2015.03.016
Voigt, S., Kemper, T., Riedlinger, T., Kiefl, R., Scholte, K., and Mehl, H. (2007). Satellite image analysis for disaster and crisis-management support. IEEE Trans. Geosci. Remote Sens. 45, 1520–1528. doi: 10.1109/TGRS.2007.895830
Wilson, J. S., Kelly, C. M., Schootman, M., Baker, E. A., Banerjee, A., Clennin, M., et al. (2012). Assessing the built environment using omnidirectional imagery. Am. J. Prev. Med. 42, 193–199. doi: 10.1016/j.amepre.2011.09.029
Yamazaki, F., Kouchi, K., Kohiyama, M., Mueaoka, N., and Matsuoka, M. (2004). “Earthquake damage detection using high-resolution satellite images,” in International Geoscience Remote Sensing Symposium (Anchorage, AK), 2280–2283.
Yin, L., Cheng, Q., Wang, Z., and Shao, Z. (2015). ‘Big data’ for pedestrian volume : exploring the use of Google Street View images for pedestrian counts. Appl. Geogr. 63, 337–345. doi: 10.1016/j.apgeog.2015.07.010
Zhang, H., Wang, W., Deng, Z., Zong, G., and Zhang, J. (2006). A novel reconfigurable robot for urban search and rescue. Int. J. Adv. Robotic Syst. 3, 359–366. doi: 10.5772/5719
Keywords: earthquake, reconnaissance, omnidirectional imagery, damage, data collection
Citation: Stone H, Putrino V and D'Ayala D (2018) Earthquake Damage Data Collection Using Omnidirectional Imagery. Front. Built Environ. 4:51. doi: 10.3389/fbuil.2018.00051
Received: 27 June 2018; Accepted: 04 September 2018;
Published: 24 September 2018.
Edited by:
Charles Krishna Huyck, ImageCat, United StatesReviewed by:
Michele Palermo, Università degli Studi di Bologna, ItalyLuigi Di Sarno, University of Sannio, Italy
Copyright © 2018 Stone, Putrino and D'Ayala. This is an open-access article distributed under the terms of the Creative Commons Attribution License (CC BY). The use, distribution or reproduction in other forums is permitted, provided the original author(s) and the copyright owner(s) are credited and that the original publication in this journal is cited, in accordance with accepted academic practice. No use, distribution or reproduction is permitted which does not comply with these terms.
*Correspondence: Harriette Stone, aGFycmlldHRlLnN0b25lLjEzQHVjbC5hYy51aw==