 Parisa Rostami
 Mojtaba Mahsuli
- Center for Infrastructural Sustainability and Resilience Research, Department of Civil Engineering, Sharif University of Technology, Tehran, Iran
Placement of steel plate shear walls (SPSW) in the building cores around the elevators and stairs necessitates door-type openings in these systems. Because of large dimensions of door openings, the energy dissipation capacity drops significantly and thus, the probability of out-of-plane buckling under lateral load increases. Accordingly, introducing stiffeners around the opening increases the amount of dissipated energy and improves the performance of the SPSW system. This paper evaluates the seismic risk of SPSW systems with different arrangements of stiffeners around the door opening. Risk, in this context, denotes the probability of failure times the cost of failure of a given SPSW. The probability of failure is computed through a finite element reliability analysis in which material properties, element geometries, and the lateral force are random variables. The failure event is described by a limit-state function as the exceedance of the drift ratio of the SPSW from a prescribed threshold. The drift ratio is computed by subjecting the finite element model to non-linear static analysis in ABAQUS. The reliability analysis is conducted for a variety of single-story SPSW models having door opening with different arrangements of stiffeners and also for a typical SPSW model without opening as a base model. Next, decision analysis is employed to identify the optimal arrangement, i.e., the one that is associated with the minimum risk. Finally, the effect of risk aversion on the optimal decision is studied by introducing risk-averse utility functions with different degrees of risk aversion.
Introduction
A typical steel plate shear wall (SPSW) consists of an unstiffened thin infill plate connected to vertical and horizontal boundary frame members, i.e., columns and beams, respectively. The lateral load is transferred through the infill plate by the principal tension stresses, as shown in Figure 1A. The infill plate is allowed to buckle in shear and consequently forms a diagonal tension field during an earthquake. Previous studies, both experimentally and numerically, have shown that this system exhibits a high ductility and hysteretic energy dissipation capacity compared with conventional braced frames and concrete shear walls (Caccese et al., 1993; Elgaaly et al., 1993; Berman and Bruneau, 2003). Another advantage of SPSWs is the ability to provide openings in the infill plate, which may be required for architectural purposes. Roberts and Sabouri-Ghomi (1992) conducted the first study on SPSW systems with opening. They performed a series of cyclic quasi-static testing on unstiffened SPSWs with a circular opening located at the center of the plate. All the SPSWs tested exhibited stable S-shaped hysteresis loops and adequate ductility. They showed that the strength and stiffness of a perforated SPSW can be approximated conservatively by applying a linear reduction factor to the strength and stiffness of a similar unperforated SPSW. Daftari and Deylami (2000) studied the effect of plate thickness, opening height to width ratio, and the areal percentage of the opening for more than 50 different SPSWs with a central rectangular opening. They determined the optimum aspect ratio for the opening. Paik (2008) obtained a closed-form empirical formula for predicting the ultimate shear strength of steel plates with central circular opening under shear loading by the regression analysis. Pellegrino et al. (2009) investigated the influence of the dimension, position, shape (circular or rectangular), and orientation of a hole with respect to the panel slenderness and aspect ratio in steel plates with one perforation subjected to shear loading. Valizadeh et al. (2012) experimentally evaluated the effects of opening dimensions and slenderness factors of plates on the seismic behavior of SPSWs with a circular opening at the center of the panel. Sabouri-Ghomi et al. (2012) studied the behavior of both stiffened and unstiffened SPSWs with a single rectangular opening with different sizes and locations through a non-linear finite element analysis. Hosseinzadeh and Tehranizadeh (2012) studied the non-linear behavior of SPSWs with fully-stiffened large rectangular openings used as windows or doors. Alavi and Nateghi (2013) experimentally investigated the seismic behavior of SPSWs with a central perforation along with diagonal stiffeners. Bhowmick (2014) developed a shear strength equation for unstiffened perforated SPSWs with a circular perforation at the center. They assessed the proposed equation by analyzing a series of single-story perforated SPSWs with different aspect ratios and different perforation diameters. Sabouri-Ghomi et al. (2015) experimentally studied the structural behavior of stiffened SPSWs with two rectangular openings and with different separations subjected to cyclic loads. Also, they determined the shear stiffness and ultimate shear strength of the SPSWs theoretically through the plate-frame interaction model.
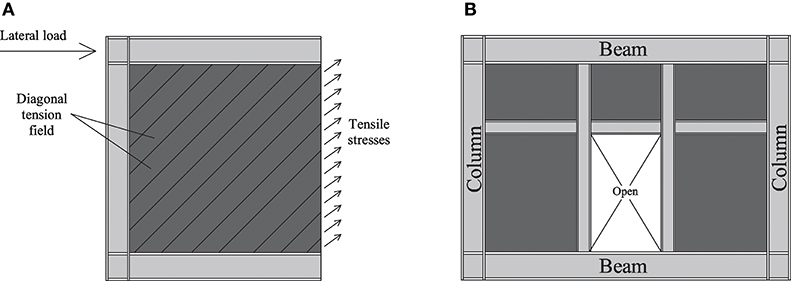
Figure 1. (A) Diagonal tension field of a typical SPSW, (B) Fully-stiffened SPSW with door opening.
Placement of SPSWs in the building cores around the elevators and stairs necessitates door-type openings. Furthermore, because of large dimensions of door openings, the energy dissipation capacity drops significantly and thus, the probability of out-of-plane buckling under lateral load increases. Accordingly, introducing stiffeners around the opening increases the amount of dissipated energy and improves the performance of the SPSW system, as recommended by AISC Design Guide 20 (AISC, 2007).
However, construction of those SPSWs in which the vertical and horizontal stiffeners continue to boundary elements, as shown in Figure 1B, is significantly costly. The underlying reasons are the need for more steel and significantly more cutting and welding for connections, which requires further material, labor, and quality control. As shown later in the paper, based on Iran's Cost Catalog (Planning Budget Organization, 2016), the cost will increase by 15%. The extra stiffeners also elongate the construction process and entails workmanship difficulties and defects. The present paper is the first to evaluate the seismic risk of SPSW systems with different arrangements of stiffeners around the door opening. Risk, in this context, denotes the probability of failure times the cost of failure of a given SPSW. The probability of failure is computed through a finite element reliability analysis (Ghanem and Spanos, 1991; Der Kiureghian and Zhang, 1999; Haldar and Mahadevan, 2000; Imai and Frangopol, 2000; Sudret and Der Kiureghian, 2002; Haukaas and Der Kiureghian, 2007) in which material properties, element geometries, and the lateral force are random variables. The failure event is described by a limit-state function as the exceedance of the drift ratio of the SPSW from a prescribed threshold. The drift ratio is computed through a finite element model under non-linear static analysis in ABAQUS (Karlsson and Sorensen, 2013). The reliability analysis is carried out for a variety of single-story SPSW models that include door openings with different arrangements of stiffeners and also for a typical SPSW model that lacks the door opening as a base model. Then, the risk-optimal arrangement is identified through decision analysis. Finally, risk-averse utility functions are introduced to study the effect of risk aversion on the optimal decision.
Probabilistic Models
Models Geometry
The single-story SPSW considered in this research, is part of a symmetrical office building located in Tehran, Iran. The floor plan of the building and the considered SPSW is shown in Figure 2A. The roof dead and live loads are assumed 0.5 and 0.15 ton/m2, respectively. Also, Figure 2B illustrates the base SPSW model, i.e., the one without opening. The height and bay width of this model are assumed 4 and 6 m, respectively. Frames other than those containing SPSWs are gravity frames and therefore, SPSWs carry the entire lateral load. Also, gravity loads are not carried by beams of the considered SPSW and transmitted by transverse beams to beam-column connections. The structure is designed for a very high seismic zone with a site-specific earthquake acceleration of 0.35 g according to the Iranian Seismic Code (BHRC, 2014).
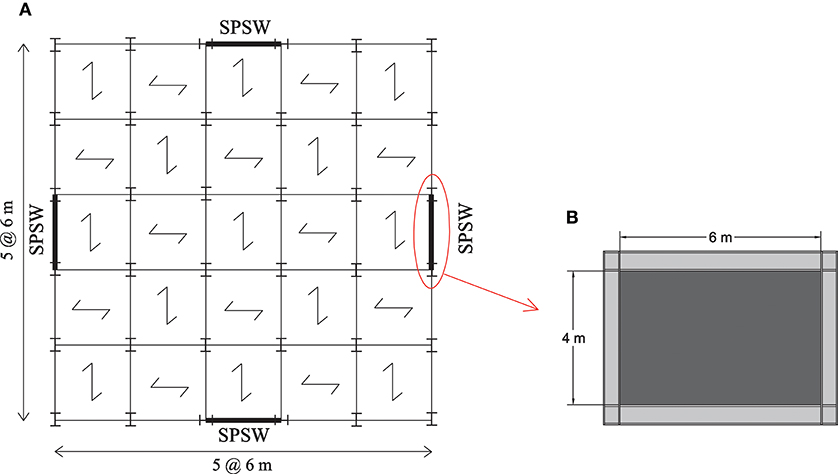
Figure 2. (A) Building floor plan and placement of the considered SPSW, (B) Base SPSW model.
The SPSW is designed based on the recommendations of AISC Seismic Provisions (ANSI/AISC 341-16, 2016) and AISC Design Guide 20 (AISC, 2007), which presents a capacity design method for SPSWs with solid infill plates. The section for boundary beams is selected to carry the forces due to the yielding of the infill plate, and the section for the columns is selected to carry the forces developed in the yielded infill plate and the plastic hinges at the ends of the top beam. Also, in order to ensure inelastic beam action at the anticipated points and to reduce the bending moment demand to columns, the beam-column connection details include reduced beam sections (RBS) at both ends. Thus, the “weak beam-strong column” criterion is guaranteed. The RBS dimensions are designed in accordance with AISC 358-16 (ANSI/AISC 358-16, 2016). The sections of beams, columns, and stiffeners for the SPSWs are W360X287, W310X202, and W310X28.3, respectively.
The door-type opening is conventionally introduced at the mid-span, as shown in Figure 3. The horizontal and vertical dimensions of the door opening are assumed 1.5 and 2.5 m, respectively. Figure 3 shows the six considered arrangements of stiffeners around the opening. Arrangement 1 is the recommendation of AISC Design Guide 20 (AISC, 2007). In the other arrangements, all different combinations of the proposed vertical and horizontal stiffeners are considered. It will be shown later in the paper that the code arrangement is the most conservative one amongst all, and will only be optimal if the designer is extremely risk averse. For this reason, arrangements that are more conservative than this arrangement, i.e., the ones which have more stiffeners, are not included in the analysis.
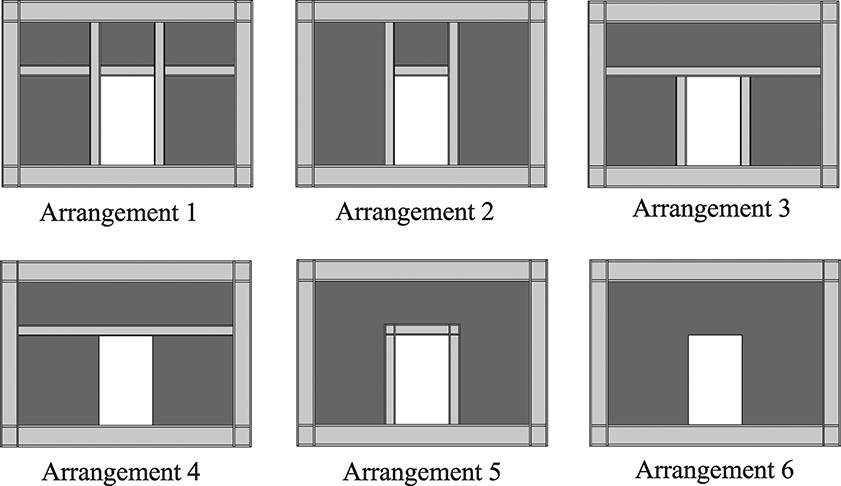
Figure 3. Different arrangements of stiffeners around the door opening.
Material Properties
Two different steels are considered for the infill plate and the members. The mechanical properties of these steel materials are adopted from ASTM A370-05 (2005), as shown in Table 1. The yield stress of the infill plate is lower than that of the members and therefore, the yielding of the infill plate occurs first. The elastic modulus and the Poisson's ratio are assumed 200 GPa and 0.3, respectively. The von Mises theory governs the yielding of the steel in this paper.
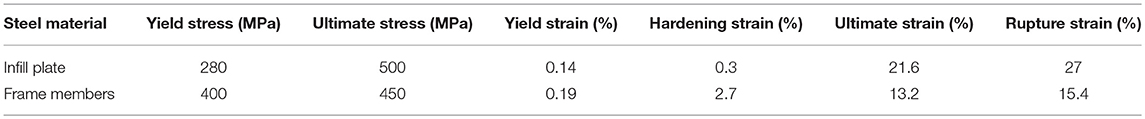
Table 1. Mechanical properties of steel materials.
Uncertainties
This paper accounts for the uncertainties in the materials properties, geometry, and lateral seismic force. The uncertainty in the material properties is described by the following four random variables: yield and ultimate strength of the steel used in the infill plate, denoted by fy, plate and fu, plate, respectively, and yield and ultimate strength of the steel used in frame members, denoted by fy, frame and fu, frame, respectively. The only source of uncertainty in the geometry of the system is assumed in the infill plate thickness. Indeed, the uncertainty in the dimensions of the members are comparatively small and are hence, disregarded, i.e., the dimensions are assumed as design variables. Finally, the uncertainty in the lateral seismic force exerted on the system is described by another random variable. In summary, the six above-mentioned random variables are employed in the subsequent reliability analysis of the system. The probability distribution of these random variables are adopted from the Probabilistic Model Code by the Joint Committee on Structural Safety (JCSS, 2000), as tabulated in Table 2. In addition, a correlation coefficient of 0.8 is considered between the yield and ultimate strengths of the infill plate and between those of the frame members.
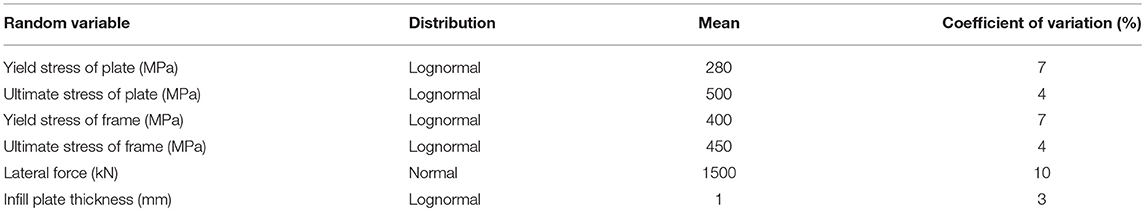
Table 2. Statistical properties of random variables.
Finite Element Model
The SPSWs are modeled by finite elements and are subjected to a non-linear static analysis procedure using ABAQUS (Karlsson and Sorensen, 2013). All frame members and infill plate are modeled using a general-purpose four-node doubly-curved shell element with reduced integration, dubbed the S4R element in ABAQUS. The infill plate is assumed connected directly to the frame members. All connections are assumed rigid, including the beam-column connections, plate connections to frame members, and stiffener connections to the frame and the infill plate. To model the fixed supports at column bases, the bottom nodes of both columns are fully restrained. In addition, beam webs are restrained against out-of-plane movements due to the presence of the concrete slab at the floors. Lateral load is applied as lateral displacement to the exterior face of the beam-column connections and is gradually increased from zero to a drift ratio of ~2.5% according to ASCE 7-16 (2016).
Real infill plates are not flat due to fabrication and erection tolerances. To capture this fact, the first buckling mode of the infill plate is applied as an initial imperfection to the models, which helps initiate the buckling in the infill plate. This approach of introducing imperfection in SPSWs has been employed in several past studies; see, for instance, Bhowmick (2014), Bhowmick et al. (2014), and Hosseinzadeh and Tehranizadeh (2012). Therefore, in order to extract the first buckling mode, an eigenvalue buckling analysis is conducted on the SPSW models with a flat infill plate before the pushover analysis. The pushover analysis accounts for both geometrical and material non-linearities of the SPSW system. Plastic behavior is introduced through the isotropic hardening, which is adequate for the incremental pushover analyses. Figure 4 depicts the von Mises stress distribution of the base SPSW model with the mean realizations of random variables at a load that corresponds to yielding of the infill plate. This figure clearly shows the formation of diagonal tension field that resists the lateral load.
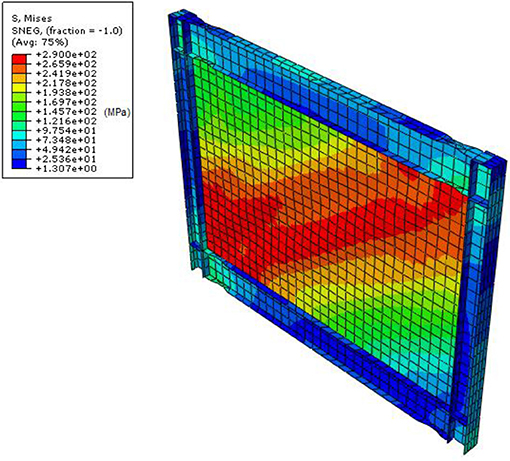
Figure 4. Von Mises stress distribution of the base model at yielding of the infill plate.
Validation
The reliability analyses carried out in this study employ incremental pushover analyses. Hence, it is sufficient to validate the numerical pushover curve obtained from the finite element model developed in ABAQUS. For this purpose, the resulting pushover curve is compared in Figure 5 against the envelope of the hysteresis diagram from an experimental study by Lubell et al. (2000) on a laboratory specimen identical to the one modeled here. In other words, Figure 5 demonstrates the shear force vs. lateral displacement obtained from the pushover analysis on the finite element model together with the hysteresis curves from the experimental study. The results indicate a satisfactory agreement between the envelope of the experimental hysteresis curves and the numerical pushover curve from the developed finite element model.
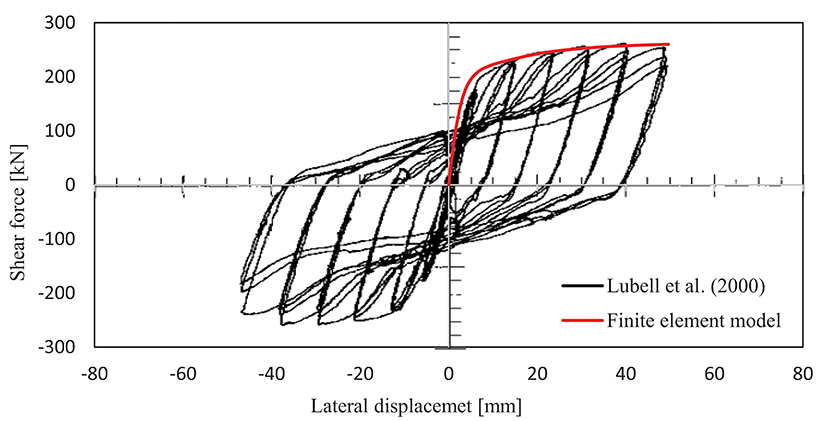
Figure 5. Comparison of the pushover analysis with experimental results.
Reliability Analysis
Limit-State Function
In this study, the SPSW is deemed to have failed if the damage incurred requires the replacement of the entire SPSW. The damage state of SPSW that prompts for its replacement is termed “vertical boundary elements (VBE) repair” by Baldvins et al. (2012), and entails VBE local buckling or fracture. In turn, Zhang and Zirakian (2015) showed that the onset of this damage state occurs at a drift ratio of 1.5%. In summary, the literature indicates that the drift ratio of 1.5% is associated with the replacement of the entire SPSW. As such, this drift ratio is employed here as the failure threshold. This leads to the following limit-state function:
where Δ is the drift ratio of SPSW, and x is the vector of random variables, i.e., x = {fy, plate, fu, plate, fy, frame, fu, frame, t, P}T. A reliability analysis with this limit-state function leads to the probability that g takes on negative values, i.e., the drift ratio exceeds 1.5%. It is noted that a structural designer can employ a more rigorous mechanical analysis than the one presented in this paper, e.g., a cyclic analysis to compute the drift ratio in which the hysteresis behavior of the SPSW is accounted for. In this case, the designer is faced with the problem of decision making under uncertainty, for which the proposed framework provides an optimal answer.
Analysis Method
Each of the seven SPSW models are subjected to reliability analysis using Rt, a computer program for reliability and optimization analysis (Mahsuli and Haukaas, 2013). Rt is freely downloadable at http://rtx.civil.sharif.edu. Rt is capable of interfacing with several finite element analysis programs, including ABAQUS. Monte Carlo sampling (Nowak and Collins, 2013) is employed as the reliability analysis algorithm. As previously mentioned, structural reliability methods compute the probability that the limit-state function takes on negative values, i.e., pf = P(g ≤ 0). These methods compute pf by numerically evaluating the following multifold integral:
where f x(x) = joint PDF of random variables x and the number of integrals equals the number of variables in x. The integration is carried out on the region in the x-space for which g(x) ≤ 0. In Monte Carlo sampling, the multifold integral of Equation (2) is computed by introducing an indicator function, ψ(x), as follows:
where ψ(x) = step function that equals unity when g(x) ≤ 0 and zero otherwise. It follows that pf is the expectation of ψ(x) with respect to distribution f x(x); hence
where K = number of samples and xk = vector of the realizations of x in the kth sample.
As shown in Figure 6, in each sample of the analysis, Rt generates a set of random realizations for random variables x. These realizations serve as input to the finite element model in ABAQUS. Rt executes the model in ABAQUS using these realizations, which in turn conducts non-linear static analysis and computes the resulting drift ratio. Rt then receives back the computed drift ratio of the SPSW, Δ(x), to compute the limit-state function. Using Δ(x), the limit-state function g(x) of Equation (1) and the indicator function ψ(x) are computed. The probability of exceedance, pf, is subsequently updated according to Equation (4). In accordance with this equation, pf equals the number of samples in which Δ(x) has exceeded 1.5% divided by the total number of samples. Random generation of samples continues until a sufficiently accurate estimate of pf is obtained. The coefficient of variation (CoV) of pf is a measure of the precision of the computed probability. According to Equation (4), pf is the mean of the realizations of ψ(x). The variance of this mean is given by
This leads to the following CoV for the computed pf:
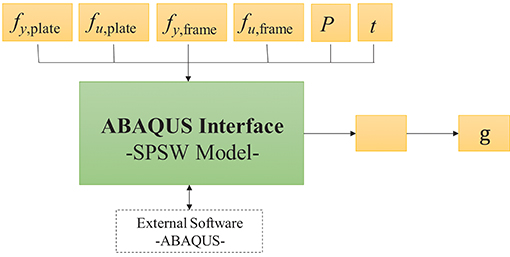
Figure 6. Flow of information between Rt and ABAQUS.
When conducting a sampling analysis, a target CoV of usually below 2% is specified, which directly affects the number of required samples, K, to achieve the desirable precision (Ditlevsen and Madsen, 1996).
Monte Carlo sampling is a straight-forward approach that yields the entire probability distribution of the drift ratio. This is owing to the fact that the resulting Δ(x) from each random sample enters a multitude of limit-state functions with different thresholds instead of 1.5%. Hence, the exceedance probabilities are computed at many thresholds at the end of a single analysis, which results in the entire complementary cumulative distribution function (CCDF) of the drift ratio. The CCDF associated with a drift ratio of 1.5% is the probability of failure for the limit-state function in Equation (1).
Results
Figure 7 presents the exceedance probability curves for the drift ratios of the seven SPSWs considered in this study. The vertical red line designates the probability that the drift ratio exceeds 1.5% for each SPSW. Figure 7 shows that Arrangement 1, i.e., fully-stiffened SPSW with door opening exhibits superior performance compared to the base model that entails no opening. This observation holds true even for Arrangement 2, 3, and 5 in which horizontal and/or vertical stiffeners do not continue to the boundary elements. This indicates that the performance gain due to stiffening the infill plate in these arrangements exceeds the loss of performance due to the presence of the opening. As expected, Arrangement 6, i.e., the unstiffened SPSW, exhibits the poorest performance amongst all variants. Table 3 ranks the variants from the best performance to the poorest one. It also presents the resulting means and CoV of the drift ratio as well as the probability of failure for each of the seven models. Figure 8 shows one set of capacity response curves for SPSW models that are produced using the mean values of random variables. This figure confirms the ranking of the models in terms of elastic stiffness and shear strength presented in Table 3.

Figure 7. Exceedance probability curves of the drift ratio for all models.
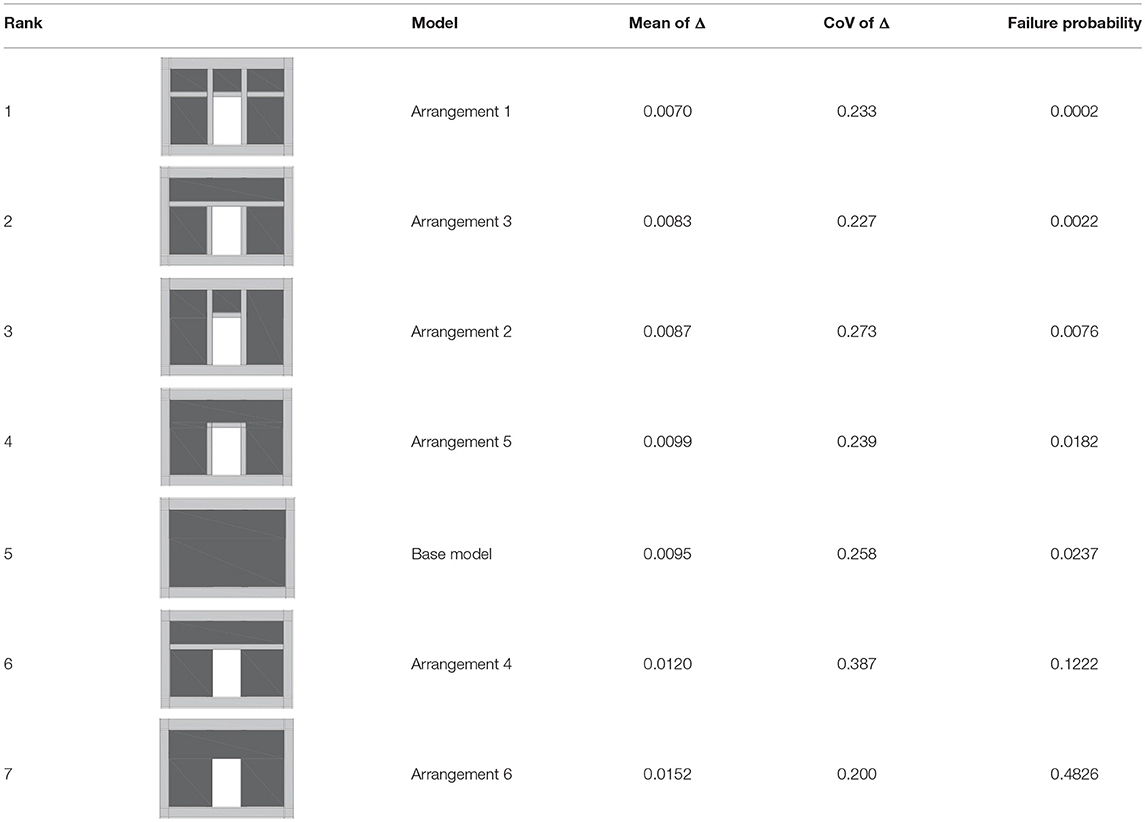
Table 3. Ranking the models based on performance in descending order.
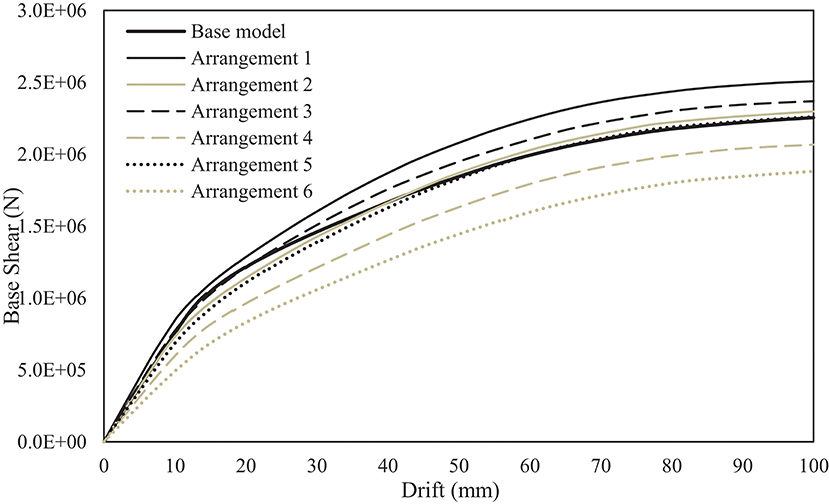
Figure 8. One set of capacity response curves for SPSW models.
Decision Analysis
This section presents a decision analysis that identifies the “best” arrangement of stiffeners based on risk. For a “risk-neutral” decision maker, the best decision is the one that minimizes the total expected cost (Bernoulli, 1954). In the following, first the decision analysis based on the theory of expected cost is presented and subsequently, the framework is extended to account for risk aversion by introducing utility functions.
The problem under consideration is a discrete decision-making problem, because the decision space consists of discrete actions, i.e., the choice should be made amongst the alternative arrangements of stiffeners. Hence, the concept of decision tree is employed. Figure 9 presents the decision tree. The square-shaped “decision fork” appears on the left from which the six actions that the decision maker faces originate, i.e., six different arrangements of stiffeners. Note that the base model, though not considered as one of the competing actions, is also shown in the tree as a reference. Each action may lead to two uncertain outcomes that originate from the circle-shaped “chance fork”: failure or safety. The cost information appears next. If the SPSW remains safe, the ensuing cost is merely the cost of construction of the SPSW. If it fails on the contrary, the cost includes the cost of construction plus the cost of failure. The cost of construction of each alternative is calculated by considering the weight of the steel, length of welding, and required workmanship for fabricating the SPSW. For this purpose, $0.5/kg for steel, $3.3/m for welding, and $4/m2 for fabrication are considered according to Iran's Cost Catalog (Planning Budget Organization, 2016). Repairing a failed SPSW entails replacing both the infill plate and the flange and web of VBE elements (FEMA 352, 2000; Baldvins et al., 2012). Hence, the cost of failure includes the cost of removing the said elements and replacing new ones, and is here estimated at 1.25 times the cost of construction.
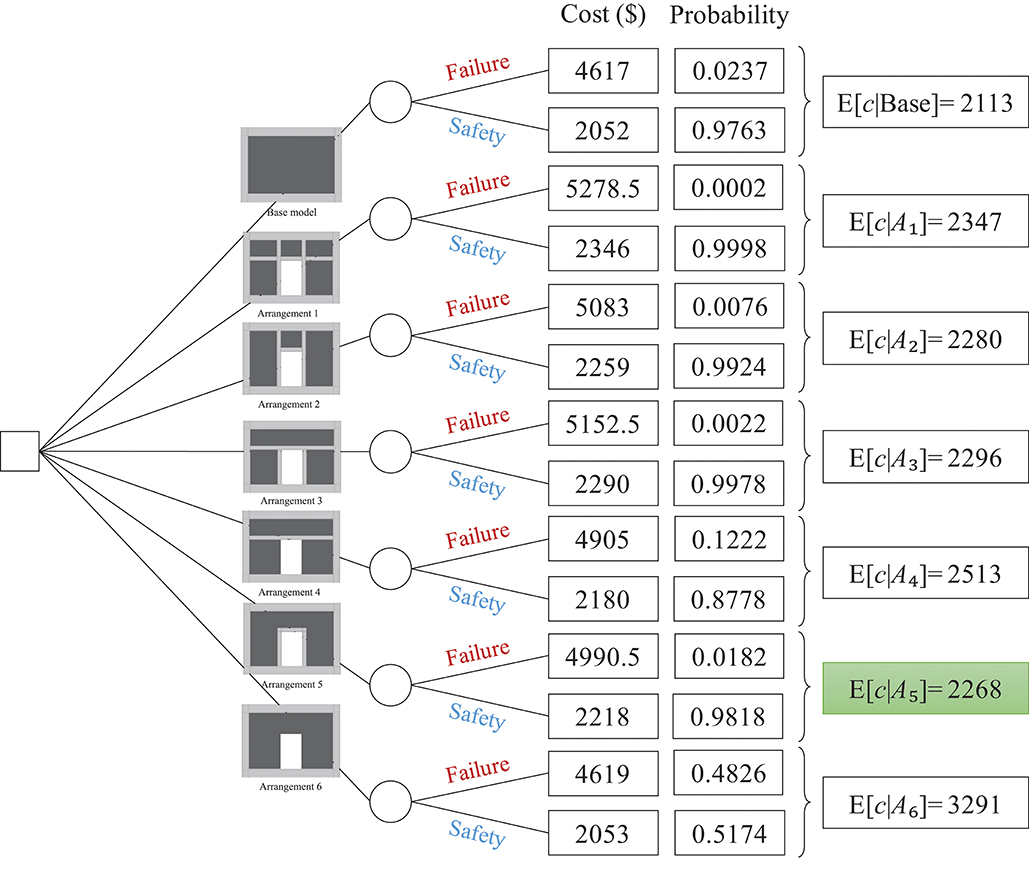
Figure 9. Decision tree.
The probabilities of each outcome appear in the next column. The probability of failure was computed in the previous section and the probability of safety is the complement of that. Finally, the risk measure, here, the expected cost, is computed for each action. According to Figure 9, the action with the minimum expected cost is to choose Arrangement 5, which introduces stiffeners only around the opening. As anticipated, the expected cost for the base model is even lower than Arrangement 5, but that is not one of the actions considered in the decision making. The highest expected cost corresponds to Arrangement 6 that lacks any stiffeners. This leads to a very high probability of failure at 48% and hence, the expected cost of failure far outweighs the savings due to a lower construction cost.
Attention is now turned to another attitude toward risk, which is prevalent in seismic design (Mahsuli and Haukaas, Forthcoming 2019). A risk-averse decision maker tries avoid large costs, which can be catastrophic. In the risk-neutral decision analysis presented above, only the direct costs of failure, i.e., the costs incurred to replace the damaged components, are taken into account. Mahsuli and Haukaas (Forthcoming 2019) showed that for a large portfolio of real-world buildings, the current design is optimal from an expected cost viewpoint only if the decision analysis accounts for the indirect costs of failure 8 times larger than the direct costs of failure. Such indirect costs are associated with casualties, business interruption, relocation, and so forth. Mahsuli and Haukaas (Forthcoming 2019) employed several risk-averse utility functions to build the indirect costs into the decision analysis. A group of such utility functions are the moments of cost in the form of
where u is the utility, c is the cost, L is the lowest cost amongst all branches of the decision tree, H is the highest one, and n is a parameter that controls the attitude toward risk. Equation (7) returns a utility of 0 for the highest cost, H, and a utility of 1 for the lowest cost, L. For n < 1, the resulting utilities represent a risk-seeking attitude toward risk. For n = 1, the function introduces a linear relationship between the utility and the cost and hence, represents a risk-neutral attitude with the same results as presented previously. For n > 1, the utility function represents a risk-averse attitude by giving larger weights to higher costs and thus, increasing their impact in computing the expected utility. The larger the value of n, the more risk averse the decision maker is. One can establish a decision maker's utility function through the concept of the “basic reference lottery ticket question” (Jordaan, 2005). Here, to study the impact of risk aversion on the optimal arrangement of stiffeners in SPSWs, the following three utility functions are considered:
Equation (8) represents a risk-neutral utility function while Equations (9, 10) respectively represent moderate and extreme degrees of risk aversion. Table 4 presents the expected utilities for all arrangements together with that of the base model. The optimal decision based on each utility function, i.e., the arrangement with the maximum expected utility is highlighted. Figure 10 visualizes the results in the form of a bar chart that presents the expected utility for all variants. The results show that the risk-optimal arrangement is sensitive to the attitude of the decision maker toward risk. It was shown earlier that a risk-neutral decision maker should opt for Arrangement 5 in which introduces stiffeners only around the opening. This is expectedly the same result obtained from using the linear utility function of Equation (8). When using the risk-averse utility function of Equation (9), the optimum decision is to choose Arrangement 3, in which in addition to the stiffeners in Arrangement 5, stiffeners are introduced along a horizontal line at the full length of the SPSW above the door opening. In fact, the extra strength from these stiffeners leads to a lower probability of failure and hence, a lower chance that high failure costs are incurred in the future. This utility function may be ideal for a building whose failure leads to high indirect costs, such as a school building. For the very risk-averse utility function of Equation (10), the optimal decision is to choose Arrangement 1, which comprises the highest amount of stiffeners amongst all alternatives. This utility function may be ideal for buildings whose failure dramatically increases the indirect costs, such as a hospital. Figure 11 sorts the arrangements based on the expected utility in descending order. Noteworthy is the fact that the ranking for the very risk-averse utility function of Equation (10) is identical to that presented previously in section Results based on the probability of failure. In fact, u3 entails such a high degree of risk aversion that the determining factor in the optimal decision is essentially the probability of failure. Another observation in Figure 11 is that Arrangements 4 and 6 appear as the least favorable choices according to all three risk measures as they lack or include little stiffening of the SPSW and hence, entail a high chance of failure.
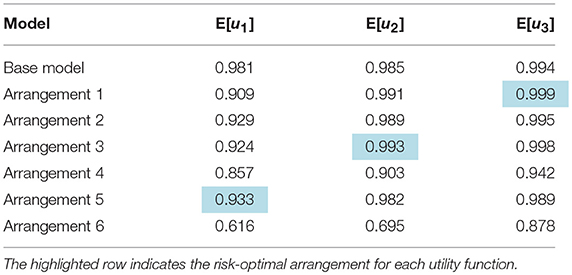
Table 4. Decision analysis results based on expected utility theory.
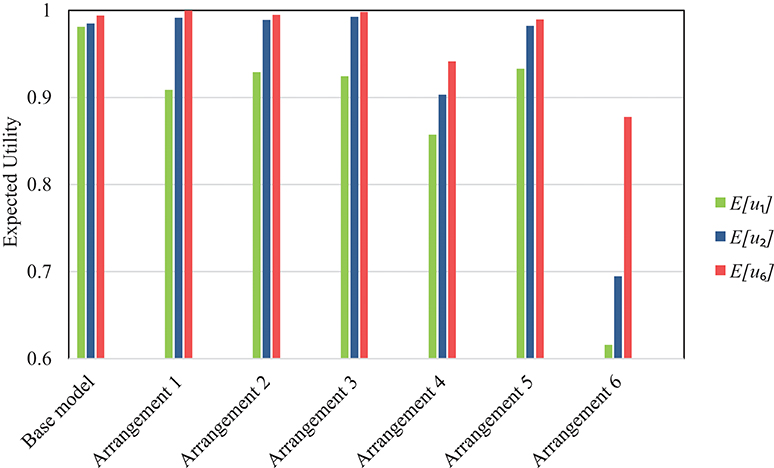
Figure 10. Bar chart of the expected utility for SPSW models.
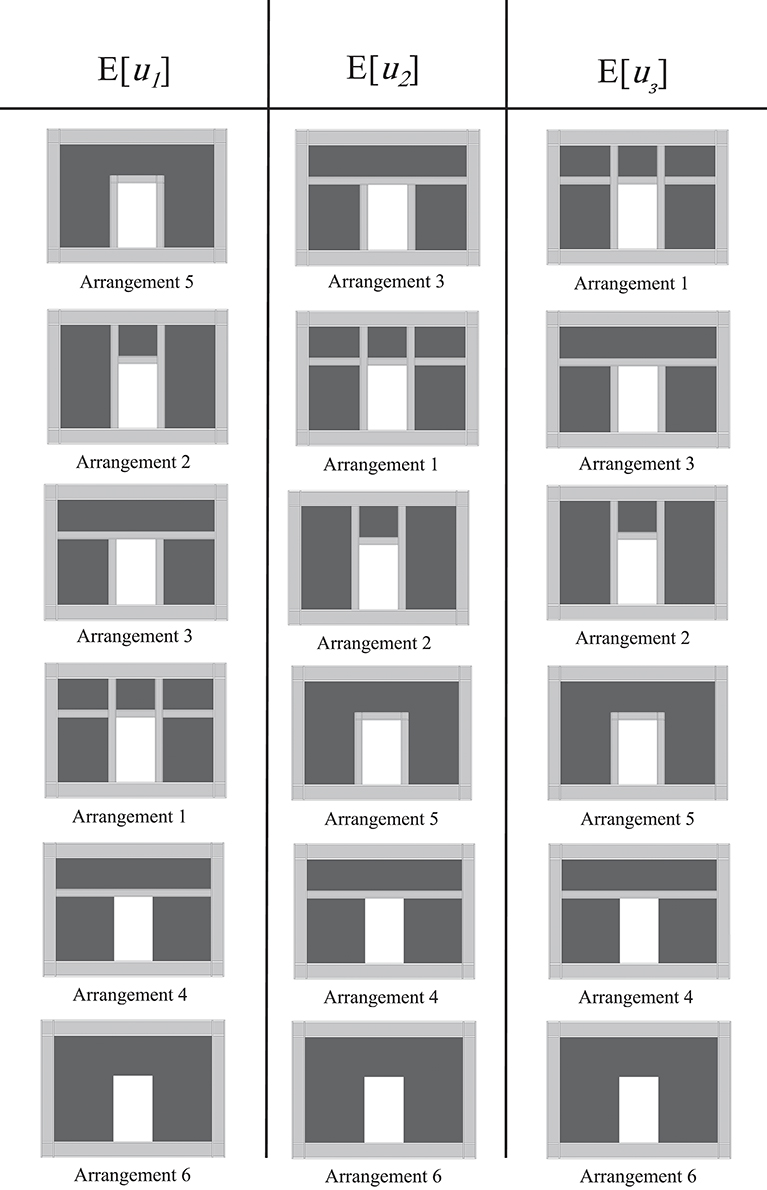
Figure 11. Ranking the models based on expected utility in descending order.
Conclusion
This paper presents a risk-based procedure to identify the optimal arrangement of stiffeners in SPSW systems with door opening. To this end, first a mechanical finite element model of such systems is developed and validated with existing experimental studies. Next, a set of six alternative arrangements of the stiffeners are designed and modeled with finite elements. Next, prevailing uncertainties in the models are characterized by random variables and the failure of the systems is described by limit-state functions. Thereafter, reliability analyses are conducted to compute the probability of failure of each model. The seismic risk to each alternative is then evaluated by computing the expected cost, including the cost of construction and the expected cost of failure. Finally, the optimal arrangement of stiffeners for a risk-neutral decision maker is identified as the one with the minimum risk, i.e., the minimum expected cost. To introduce the risk-averse attitude that is central in seismic design, risk-averse utility functions are then introduced with varying degrees of risk aversion. Such utility functions are applicable in seismic design of structures whose failure lead to high indirect losses, such as schools, or catastrophic consequences, such as hospitals. It is observed that, as the risk aversion intensifies, the optimal design shifts to those models that include more stiffeners. The presented procedure is immediately applicable on risk-optimal design and decision making for other structural components and systems.
Author Contributions
PR formulated the problem, conducted the analyses, and drafted the paper. MM supervised the research and revised the paper.
Conflict of Interest Statement
The authors declare that the research was conducted in the absence of any commercial or financial relationships that could be construed as a potential conflict of interest.
Acknowledgments
Grant No. 96013800 from Iran National Science Foundation (INSF) is gratefully acknowledged.
References
AISC, (2007). Design Guide 20: Steel Plate Shear Walls. Chicago, IL: American Institute of Steel Construction.
Alavi, E., and Nateghi, F. (2013). Experimental study on diagonally stiffened steel plate shear walls with central perforation. J. Constr. Steel Res. 89, 9–20. doi: 10.1016/j.jcsr.2013.06.005
ANSI/AISC 341-16, (2016). Seismic Provisions for Structural Steel Buildings. Chicago, IL: American Institute of Steel Construction.
ANSI/AISC 358-16, (2016). Prequalified Connections for Special and Intermediate Steel Moment Frames for Seismic Applications. Chicago, IL: American Institute of Steel Construction.
ASCE 7-16, (2016). Minimum Design Loads and Associated Criteria for Buildings and Other Structures. Reston, VA: American Society of Civil Engineers.
ASTM A370-05, (2005). Standard Test Methods and Definitions for Mechanical Testing of Steel Products. ASTM International.
Baldvins, N. M., Berman, J. W., Lowes, L. N., Janes, T. M., and Low, N. A. (2012). Fragility functions for steel plate shear walls. Earthq. Spectr. 28, 405–426. doi: 10.1193/1.4000003
Berman, J., and Bruneau, M. (2003). Plastic analysis and design of steel plate shear walls. J. Struct. Eng. 129, 1448–1456. doi: 10.1061/(ASCE)0733-9445(2003)129:11(1448)
Bernoulli, D. (1954). Exposition of a new theory on the measurement of risk. Econometrica 22, 23–26. doi: 10.2307/1909829
Bhowmick, A. K. (2014). Seismic behavior of steel plate shear walls with centrally placed circular perforations. Thin Walled Struct. 75, 30–42. doi: 10.1016/J.TWS.2013.09.027
Bhowmick, A. K., Grondin, G. Y., and Driver, R. G. (2014). Nonlinear seismic analysis of perforated steel plate shear walls. J. Constr. Steel Res. 94, 103–113. doi: 10.1016/j.jcsr.2013.11.006
BHRC, (2014). Iranian Code of Practice For Seismic Resistant Design of Buildings. Tehran: Building and Housing Research Center.
Caccese, V., Elgaaly, M., and Chen, R. (1993). Experimental study of thin steel-plate shear walls under cyclic load. J. Struct. Eng. 119, 573–587. doi: 10.1061/(ASCE)0733-9445(1993)119:2(573)
Daftari, H., and Deylami, A. (2000). “Non-linear behavior of steel plate shear wall with large rectangular opening,” in Proceedings of the 12th World Conference on Earthquake Engineering (Auckland), 1–7.
Der Kiureghian, A., and Zhang, Y. (1999). Space-variant finite element reliability analysis. Comput. Methods Appl. Mech. Eng. 168, 173–183. doi: 10.1016/S0045-7825(98)00139-X
Elgaaly, M., Caccese, V., and Du, C. (1993). Postbuckling behavior of steel-plate shear walls under cyclic loads. J. Struct. Eng. 119, 588–605. doi: 10.1061/(ASCE)0733-9445(1993)119:2(588)
FEMA 352, (2000). Recommended Post- Earthquake Evaluation and Repair Criteria for Welded Steel Moment-Frame Buildings. Washington, DC: Building Seismic Safety Council for the Federal Emergency Management Agency.
Ghanem, R. G., and Spanos, P. D. (1991). Spectral stochastic finite-element formulation for reliability analysis. J. Eng. Mech. 117, 2351–2372. doi: 10.1061/(ASCE)0733-9399(1991)117:10(2351)
Haldar, A., and Mahadevan, S. (2000). Reliability Assessment using Stochastic Finite Element Analysis. New York, NY; Chichester: John Wiley & Sons.
Haukaas, T., and Der Kiureghian, A. (2007). Methods and object-oriented software for FE reliability and sensitivity analysis with application to a bridge structure. J. Comput. Civ. Eng. 21, 151–163. doi: 10.1061/(ASCE)0887-3801(2007)21:3(151)
Hosseinzadeh, S. A. A., and Tehranizadeh, M. (2012). Introduction of stiffened large rectangular openings in steel plate shear walls. J. Constr. Steel Res. 77, 180–192. doi: 10.1016/j.jcsr.2012.05.010
Imai, K., and Frangopol, D. M. (2000). Geometrically nonlinear finite element reliability analysis of structural systems. I: theory. Comput. Struct. 77, 677–691. doi: 10.1016/S0045-7949(00)00010-9
Karlsson, H., and Sorensen (2013). ABAQUS/Standard User's Manual, Version 6.13. Rhode Island, RI: HKS Inc.
Lubell, A. S., Prion, H. G. L., Ventura, C. E., and Rezai, M. (2000). Unstiffened steel plate shear wall performance under cyclic loading. J. Struct. Eng. 126, 453–460. doi: 10.1061/(ASCE)0733-9445(2000)126:4(453)
Mahsuli, M., and Haukaas, T. (2013). Computer program for multimodel reliability and optimization analysis. J. Comput. Civil Eng. 27, 87–98. doi: 10.1061/(ASCE)CP.1943-5487.0000204
Mahsuli, M., and Haukaas, T. (Forthcoming 2019). Risk minimization for a portfolio of buildings considering risk aversion. ASCE J. Struct. Eng. doi: 10.1061/(ASCE)ST.1943-541X.0002250
Nowak, A. S., and Collins, K. R. (2013). Reliability of Structures, 2nd Edn (Boca Raton, FL;New York, NY: CRC Press/Taylor & Francis Group).
Paik, J. K. (2008). Ultimate strength of perforated steel plates under combined biaxial compression and edge shear loads. Thin Walled Struct. 46, 207–213. doi: 10.1016/J.TWS.2007.07.010
Pellegrino, C., Maiorana, E., and Modena, C. (2009). Linear and non-linear behaviour of steel plates with circular and rectangular holes under shear loading. Thin Walled Struct. 47, 607–616. doi: 10.1016/J.TWS.2008.11.001
Roberts, T. M., and Sabouri-Ghomi, S. (1992). Hysteretic characteristics of unstiffened perforated steel plate shear panels. Thin Walled Struct. 14, 139–151. doi: 10.1016/0263-8231(92)90047-Z
Sabouri-Ghomi, S., Ahouri, E., Sajadi, R., Alavi, M., Roufegarinejad, A., and Bradford, M. A. (2012). Stiffness and strength degradation of steel shear walls having an arbitrarily-located opening. J. Constr. Steel Res. 79, 91–100. doi: 10.1016/J.JCSR.2012.07.017
Sabouri-Ghomi, S., Mamazizi, S., and Alavi, M. (2015). An investigation into linear and nonlinear behavior of stiffened steel plate shear panels with two openings. Adv. Struct. Eng. 18, 687–700. doi: 10.1260/1369-4332.18.5.687
Sudret, B., and Der Kiureghian, A. (2002). Comparison of finite element reliability methods. Probabil. Eng. Mech. 17, 337–348. doi: 10.1016/S0266-8920(02)00031-0
Valizadeh, H., Sheidaii, M., and Showkati, H. (2012). Experimental investigation on cyclic behavior of perforated steel plate shear walls. J. Constr. Steel Res. 70, 308–316. doi: 10.1016/J.JCSR.2011.09.016
Keywords: steel plate shear wall, door opening, stiffener, probabilistic model, reliability analysis, decision analysis
Citation: Rostami P and Mahsuli M (2018) Risk-Optimal Arrangement of Stiffeners in Steel Plate Shear Walls With Door Opening Front. Built Environ. 4:59. doi: 10.3389/fbuil.2018.00059
Received: 07 August 2018; Accepted: 04 October 2018;
Published: 31 October 2018.
Edited by:
Solomon Tesfamariam, University of British Columbia, CanadaReviewed by:
Emanuele Brunesi, Fondazione Eucentre, ItalyBehzad Shekastehband, Urmia University of Technology, Iran
Copyright © 2018 Rostami and Mahsuli. This is an open-access article distributed under the terms of the Creative Commons Attribution License (CC BY). The use, distribution or reproduction in other forums is permitted, provided the original author(s) and the copyright owner(s) are credited and that the original publication in this journal is cited, in accordance with accepted academic practice. No use, distribution or reproduction is permitted which does not comply with these terms.
*Correspondence: Mojtaba Mahsuli, bWFoc3VsaUBzaGFyaWYuZWR1