 Rachel N. Kovar
 Tanya M. Brown-Giammanco
 Franklin T. Lombardo
- 1University of Illinois at Urbana-Champaign, Urbana, IL, United States
- 2Insurance Institute for Business and Home Safety, Richburg, SC, United States
Garage doors or roll-up doors on residential and commercial structures are vulnerable components that are often damaged in windstorms. Failures of these large openings can lead to internal pressurization, which can cause additional structural damage to roofs and walls. This study utilized high spatial resolution oblique remote-sensing data to assess the condition of garage doors and roof structure damage on residential structures following two tornadoes and one hurricane. The performance of the garage doors was evaluated to determine any dependence on the size of the door and orientation to the wind, as well as estimated wind speed. The study found higher failure rates of garage doors in the hurricane event than the tornadoes, but roof structural damage was more common following a garage door failure in a tornado. Additionally, roof structural damage was uncommon for buildings where the garage door remained intact, regardless of event type.
Introduction
Garage doors or roll-up doors on residential and commercial structures are often damaged in hurricanes, tornadoes, and high wind events, due to debris impacts or wind pressure (Dao et al., 2014; Graettinger et al., 2014; Wadsworth, 2014). Observations have indicated these doors fail by (1) suction pressure or positive pressure with damages to the doors themselves, (2) weak tracks, or (3) inadequate attachment of the tracks to the building (FEMA, 2005). Failures of these large openings often leads to additional structural damage to roofs and walls due to internal pressurization (Cushman, 2017). Options for strengthened doors are available through high-wind pressure ratings. Opening protection can also be used to protect against debris impacts. Guidance is also available for reinforcing garage doors by utilizing wind retrofit hardware (FEMA, 2011). Because garage and roll-up doors are such a vulnerable component in high wind events, building resiliency programs such as the IBHS FORTIFIED Home™ and FORTIFIED Commercial™ programs require the use of pressure-rated or protected doors (IBHS, 2012, 2015a,b, 2017a,b) for certain tiers within the programs.
Damage assessments following hurricanes and tornadoes have typically been conducted on the ground, where individual components, such as garage doors, can be inspected to determine cause of failure. As technology has improved leading to better spatial resolution and more availability of data, remote-sensing data have been used with increasing frequency for post-event damage assessments to supplement or replace traditional ground damage surveys (Womble et al., 2005, 2006; Brown et al., 2012; Luo et al., 2014). Remote-sensing data allow for rapid assessment of damage over a large area in a short time period. Remote-sensing data are typically available within a few days of the event, often more quickly than investigators can reach the site for a ground survey, thus capturing perishable damage data before cleanup begins.
Damage assessments using remote sensing data have typically been used in a fairly broad context. Assessments have been used for emergency-response decision-making (Womble et al., 2016); investigation of overall damage swaths to determine path widths or lengths; identification of areas for further ground-survey investigation (Marshall and McDonald, 1982; Phan and Simiu, 1999); and overall structural performance of individual buildings to determine damage severity and event ratings (Brown et al., 2012; Luo et al., 2014).
The launch of high-resolution satellites beginning in the late 1990's allowed for remote-sensing damage assessments to be expanded, by providing orthogonal imagery data, which allow for roof damage to be assessed, but not wall surfaces. In 2005, Pictometry, Inc. revolutionized the use of remote-sensing data by collecting vertical and 4-directional oblique data with 15 cm spatial resolution following Hurricane Katrina (Womble et al., 2016). Pictometry, now part of EagleView, has consistently collected these datasets following major damaging events in the U.S. since that time, and newer datasets are easier to integrate through geolocation.
With increasing availability of remote-sensing data, Womble et al. (2006, 2016) developed a “Tiered Remote-Sensing Reconnaissance System” to describe different purposes of remote-sensing assessments and the type of datasets needed (Figure 1). The study presented here fits into Womble's Tier 3 assessment, as it investigated the performance of a specific building component—garage doors—and associated roof damage. High spatial resolution, 4-directional oblique, post-event Pictometry data such as that shown in Figure 2, were employed to allow for observation of the wall and roof structures of homes.
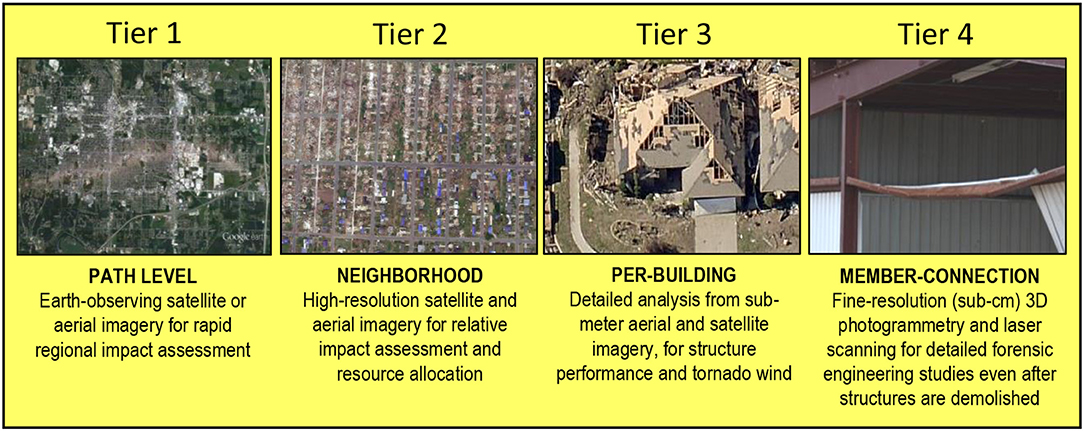
Figure 1. Tiered Remote-Sensing Reconnaissance System reproduced with permission from Womble et al. (2016).
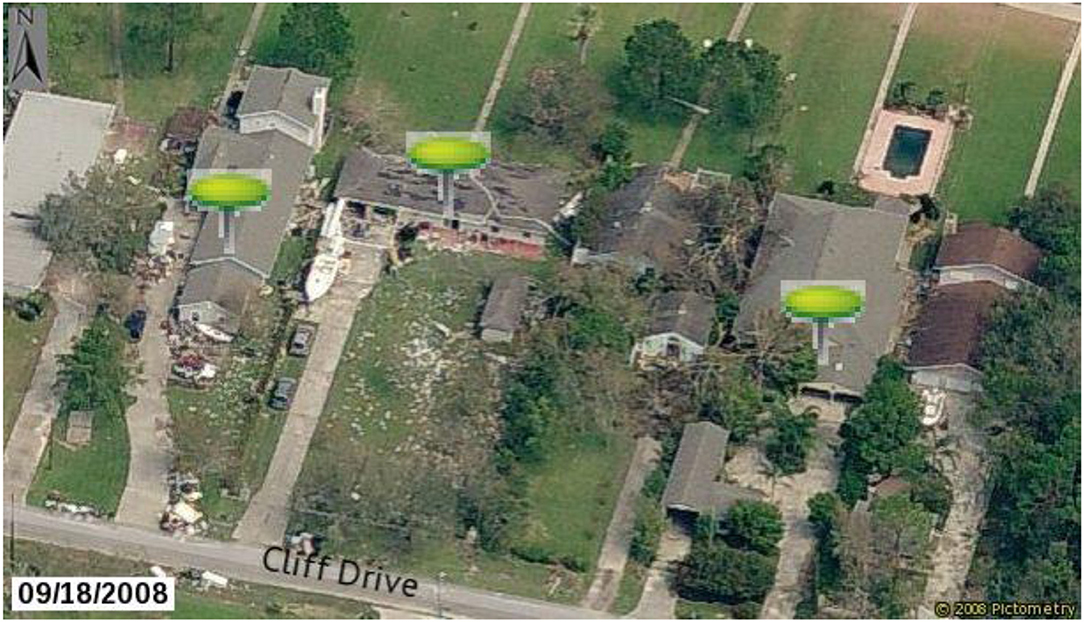
Figure 2. Example oblique Pictometry image shows the condition of roofs and walls for one elevation. Data from additional viewpoint angles can be used to assess damage to the other three elevations of each building. Image resolution and quality reduced for publication. Pin icons denote houses that were included in the dataset. Varying colors of pins were for internal organization purposes only. Image courtesy of Eagleview Technologies, Inc.
It should be noted that remote-sensing data play a vital role in preserving damage data, such that analyses of historical events, such as that done in this study, can be conducted many years later. Several studies have been conducted on these events shortly after they occurred, but many more topics could be investigated using the high-quality preserved remote-sensing data.
Rates of garage door and roof damage for typical wood-frame residential structures in two tornado events and one hurricane were determined using post-storm aerial data from Pictometry. For the purposes of this paper, “roof structure damage” refers to structural damage to trusses or decking, not the roof cover. In this instance, this definition is appropriate, given the internal pressure admitted by damaged garage doors will exert forces on the interior roof structure, and not the external roof cover. The Pictometry data are described in the next section. The wind speed and direction estimation procedures are discussed in Section Methodology. In Section Damage Analysis, damage rates are compared across events and wind speed zones, and for various characteristics of the garage doors. The extent of damages to the roof above the garages is also evaluated. These data can be used to evaluate vulnerability of garage doors in various wind storms, wind speed zones, and storm-relative orientations, and identify the potential need for mitigation.
Data
Remote Sensing
Pictometry data were obtained following the Joplin, Missouri (MO) tornado in 2011, the Moore, Oklahoma (OK) tornado in 2013, and Hurricane Ike in 2008 which made landfall in Texas (TX). The dataset included 4-directional (north, south, east, west) oblique data captured at 40–45 degrees from horizontal. The data are in the visible spectrum with three spectral bands of blue, green, and red. The data have a ground sample distance (GSD) of 20–30 cm, which represents the distance between pixel centers.
Wind Speed and Direction Estimation
Joplin, Missouri (2011)
The EF-5 rated Joplin, MO tornado occurred on May 22, 2011, and left its mark as the deadliest U.S. tornado in the official record. As a result, many research teams studied the impacts that the tornado left behind (Prevatt et al., 2012; Kuligowski et al., 2014). As part of these studies, wind speed (and subsequent wind direction) over time was estimated using a tornado-vortex model conditioned to tree-fall patterns throughout Joplin (Kuligowski et al., 2014; Lombardo et al., 2015). Time histories of wind speed and wind direction were created at various grid points over Joplin and the peak wind speed, assumed to be representative of a 3-s gust, is used in this study. Wind directions around the time of the peak wind speed generated from the model are also used when considering garage door orientation in later sections However, it is acknowledged that garage doors may have failed before the time of the peak wind speed and failure could be associated with a different wind direction, but in the absence of detailed wind speed time histories, this represents the best data available.
Moore, Oklahoma (2013)
The 2013 Moore, OK tornado occurred on May 20. The tornado traveled 23 km, with a damage path width of up to 1.7 km. The tornado killed 24 people and injured over 200 others. The maximum estimated 3-s peak wind speed was over 89 m/s. This value was derived from a National Weather Service damage assessment that utilizes the EF-Scale (WSEC, 2006) to estimate the maximum wind speed from the highest damage level, EF5 (Burgess et al., 2014).
The gridded wind speed values for the structures evaluated from this event were interpolated from the National Weather Service's Damage Assessment Toolkit and Damage Survey Viewer (Camp et al., 2014, 2017) data for the Moore tornado. The toolkit allows for georeferenced data to be collected regarding the damage, or lack thereof, to individual buildings and objects defined in the EF-Scale. The building damage state was then translated to an EF-Scale rating at that location, which provided a range of wind speed estimates. Over 700 individual damage states were obtained for the Moore tornado and geospatial contours of EF-Scale ratings were created from these individual damage states. The wind speeds evaluated for this study were those estimated at the individual homes. The wind direction during peak wind was determined by first considering the path of the tornado itself, based on a preliminary tornado track. The assumed counter-clockwise rotation of the tornado was used to gain perspective on the general direction of the wind at a given location. The debris from the tornado was also used to determine the final estimated direction of the peak wind, which is referenced in later sections regarding orientations.
Hurricane Ike (2008)
Hurricane Ike developed on September 1, 2008, and reached a peak intensity of Category 4 on the Saffir-Simpson Scale. It made an initial landfall on September 8 in Cuba as a Category 4 hurricane with 1-min sustained wind speeds of 59 m/s. The second landfall occurred near Galveston, TX on September 13 as a Category 2 hurricane with estimated 1-min sustained wind speeds of 49 m/s (National Hurricane Center, 2014). This wind speed estimate was based on flight-level SFMR winds, Doppler radar velocities from the Houston radar, and wind speed measurements from a WeatherFlow and Texas Tech University Hurricane Research Team anemometer (Berg, 2009).
The gridded wind speed data for Hurricane Ike used in this study were obtained from RMS's H*Wind product (Powell et al., 1998). This product assimilates wind speed values from aircraft reconnaissance, land, marine, and space observations to create a composite gridded wind speed analysis, where all measurements are standardized for height (10 m), exposure (open terrain), and averaging time, to create 1-min sustained, or peak 3-s gust wind speed contours. The 3-s gust data contours were used to assign wind speed values for the individual structures evaluated in this study. The direction of the hurricane track was determined by the European Center for Medium-Range Weather Forecasts global model, EMXI (Berg, 2009). The wind directions were estimated based on storm motion and tangential flow around the center. Debris scattering was also used to estimate wind direction if available.
Methodology
While significant improvements have been made in the spatial resolution and availability of remote-sensing data, rapid automation of damage detection has not yet been achieved. Damage analysis continues to require some manual, human interpretation of images. To select homes for inclusion in this study, the wind speed datasets described in the previous sections were overlaid on post-event Pictometry datasets. The Pictometry data were then visually assessed to select “partially-damaged” homes for inclusion in the study; homes that were fully destroyed were not included, as it would be impossible to determine details about garage door presence and damages. The Pictometry data were then used to determine for individual homes: presence and type of garage doors; damage severity to garage doors; and damage severity to the roof above the garage. The location of each home, as well as the direction the garage door faced were also recorded.
The specific causes of damage to the garage and roof were noted (e.g., wind-induced pressure, debris, treefall). After determining the likely causes of damage, the percentage of damage to garage doors and to the roof structure were estimated. The percentage of structural damage to the roof (e.g., <25%, 25–50%) was estimated by the amount of structural wooden trusses that were damaged or missing as well as the percentage of roof decking damage. It should be noted that it was not possible to assess the resistance of garage doors in this study. It may be possible that some garage doors in Hurricane Ike had higher design pressure resistance, but it is impossible to know without a detailed on-site inspection of each door.
Using these parameters along with orientation of the garage doors with respect to the tornado's path and wind speed, the factors leading to the various failures were deduced.
Damage Analysis
Overview
Table 1 shows the total number of homes analyzed in Joplin, Moore, and Hurricane Ike, the number of homes with garage doors and associated damage, as well as those with roof structure damage with or without garage door damage. The data show that homes were more likely to have damage to the roof structure if there was garage door damage. Although there were cases where homes suffered roof structural damage without garage door damage, they were minimal. When all three events were combined, less than 10% of the homes had roof structure damage without a garage door failure, compared to approximately 60% of homes that had roof structure damage and garage door damage. Figure 3 provides an illustrative look at the damage overview for each of the three events in the form of Venn diagrams. An interesting observation from both Table 1 and Figure 3 is that an overwhelming percentage (~94%) of homes that suffered some sort of roof structure damage also suffered garage door damage [423/(423 + 29)]. The following sub-sections will investigate various factors that may have contributed to the damage levels observed.
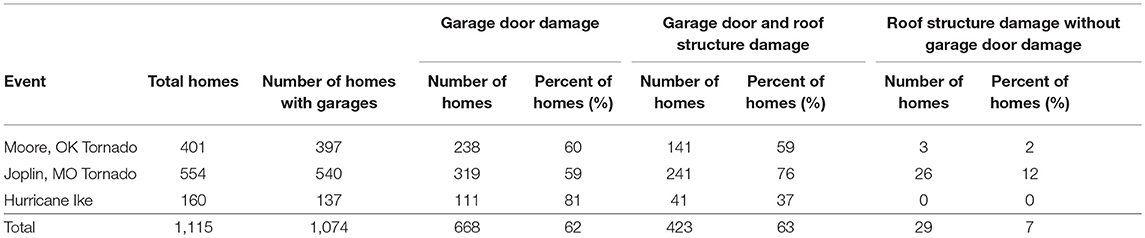
Table 1. Damage rates for the three events evaluated.
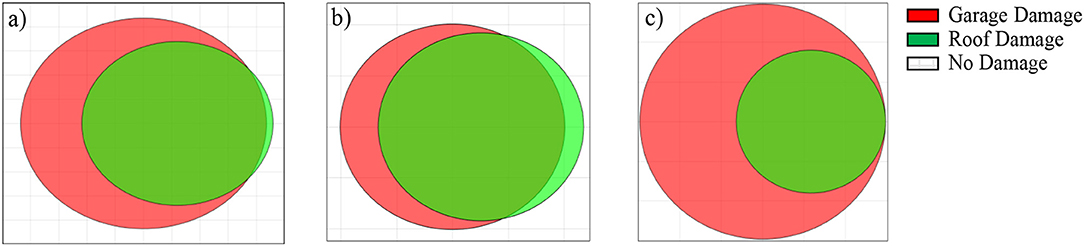
Figure 3. Example of garage door and roof structure damage Venn diagrams in (a) Moore, OK (N = 397), (b) Joplin, MO (N = 540), and (c) Hurricane Ike (N = 137).
Wind Speed
The data were grouped into wind speed bins (provided a wind speed was available; if unavailable, the data was excluded from analyses dealing with wind speed). The total number of homes, and garage door damage information in each wind speed bin are shown in Table 2. These data, as well as that given in Figure 4, illustrate that homes in Hurricane Ike more frequently suffered garage door damage at lower wind speeds, than either the Joplin tornado or the Moore tornado. The stair-step like behavior of the Moore, OK garage door damage is likely due to the wind speed estimates derived from the EF-Scale, whereas the Joplin tornado and Hurricane Ike are based on modeled data. It is hypothesized that this difference in percentage at lower wind speeds could be caused by a much longer duration of damaging winds in a hurricane compared to a tornado or potentially in combination with a longer duration with an unfavorable wind direction with respect to garage door orientation. Orientation effects will be touched upon later.
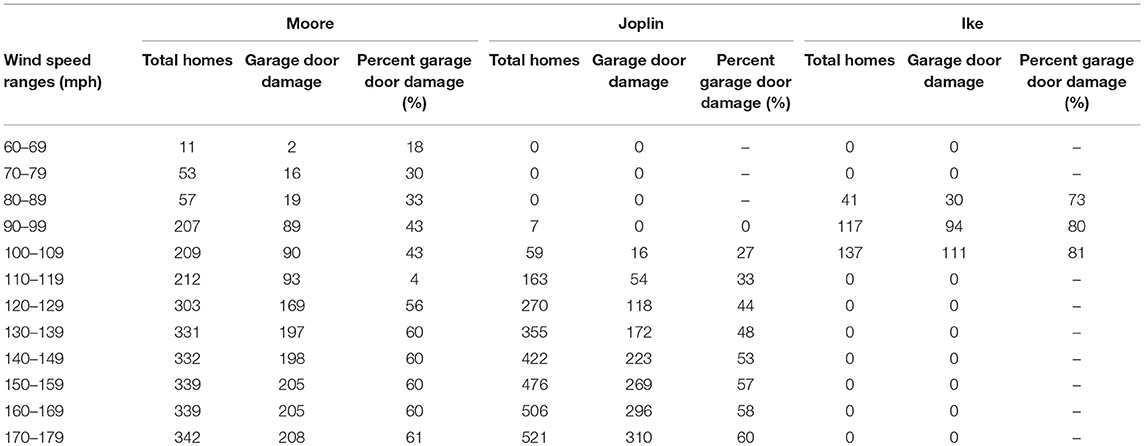
Table 2. Cumulative garage door damage by wind speed.
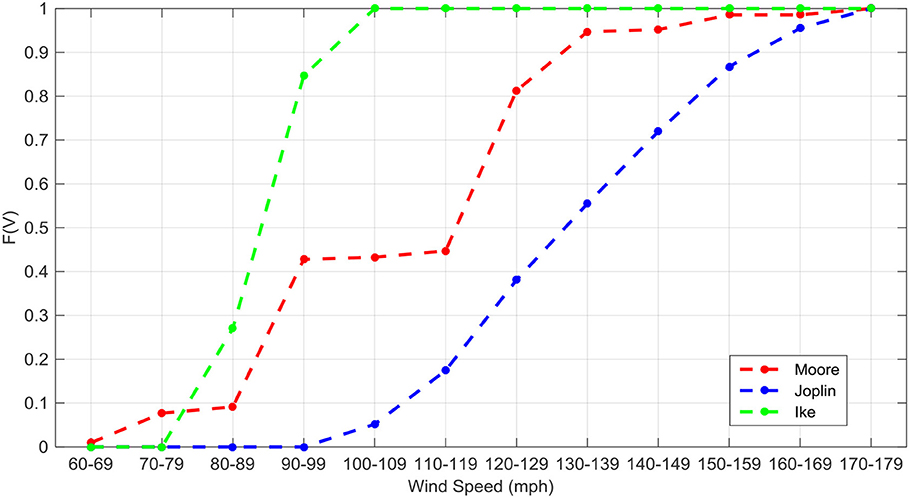
Figure 4. Normalized cumulative percentage, F(V), of damaged homes by wind speed range.
To obtain a relatively large sample, and to avoid higher wind speeds where garage door damage was difficult to ascertain due to overall damage levels, the homes that fell within the wind speed range of 90–109 mph were analyzed further for all three events to allow for better comparison between event types. In Table 3, the percentages of failure within these ranges are shown. The data collected within the 90–109 mph peak 3-s gust zones show that more homes were likely to have suffered some sort of garage door damage within this wind speed range in a hurricane, than in a tornado. The percentage of garage doors damaged in Hurricane Ike almost doubles that found in the Moore, OK tornado, and almost triples that found in the Joplin, MO tornado.
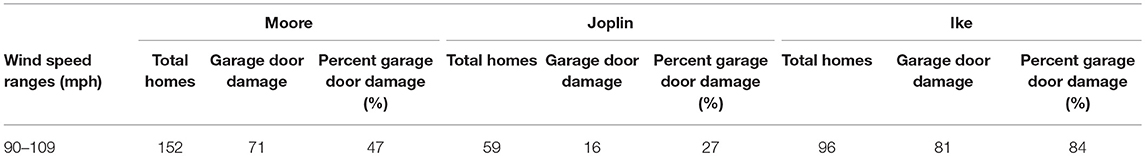
Table 3. Garage door damage frequency in 90–109 mph wind speed range.
However, what is not shown is the extent of the garage door and/or roof structure damage that is likely to occur in each event type. Figures 5–8 provide illustrative examples of varying damage severity levels observed for garage doors and roof structural damage. Minimal garage door damage, less than 25%, included homes that had minor displacements of the garage door, small breakages, or no damage. The homes labeled between 25 and 75% garage door damage included doors that were partially removed from their framework, categorized by how much of the door was still intact. Homes within the over 75% damage category had suffered full garage door losses, where the door was completely removed from the home. While garage doors were more likely to be damaged in the 90–109 mph wind speed range in Hurricane Ike, the severity of the damage that occurred was fairly consistent across event types. Table 4 shows that in all cases, the majority of garage door damages were complete or nearly complete failures, which means that if a garage door is damaged at all, it is likely to fail completely.
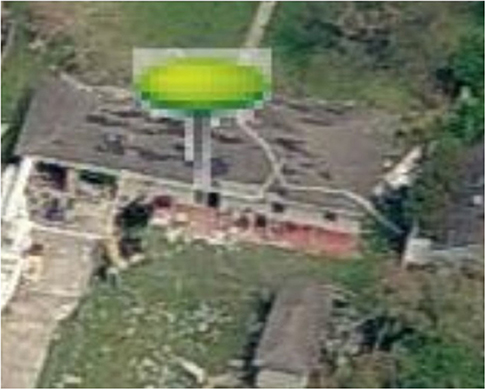
Figure 5. Example of 75–100% Garage Door Damage, 0–25% Roof Structural Damage. Image resolution and quality reduced for publication. Image courtesy of Eagleview Technologies, Inc.
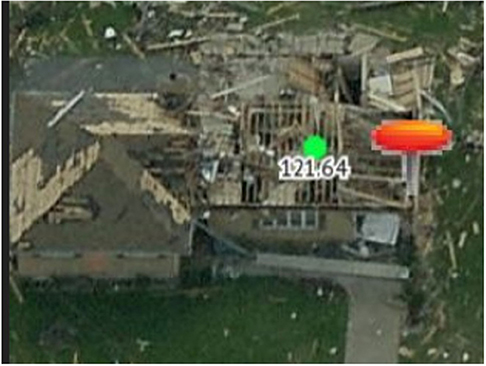
Figure 6. Example of 75–100% Garage Door Damage, 50–75% Roof Structural Damage. Image resolution and quality reduced for publication. Image courtesy of Eagleview Technologies, Inc.
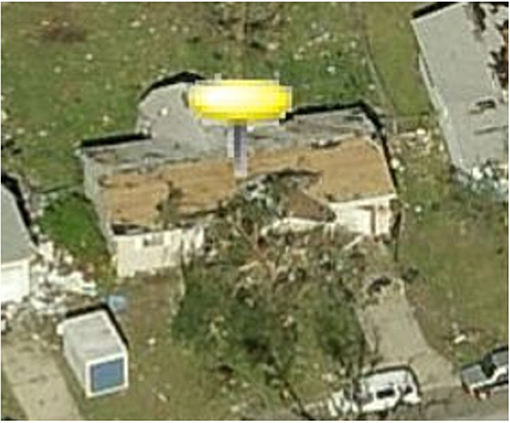
Figure 7. Example of 50–75% Garage Door Damage, <25% Roof Structural Damage. Image resolution and quality reduced for publication. Image courtesy of Eagleview Technologies, Inc.
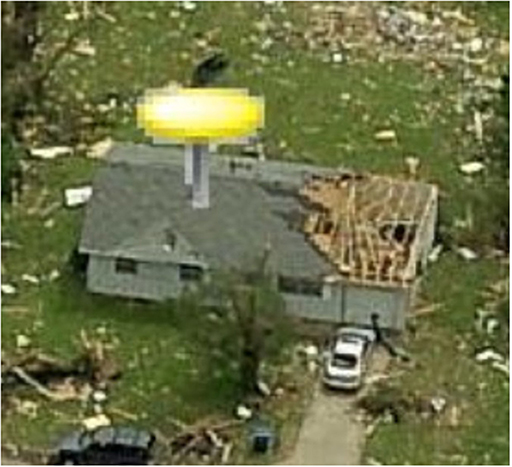
Figure 8. Example of <25% Garage Door Damage, 25–50% Roof Structural Damage. Image resolution and quality reduced for publication. Image courtesy of Eagleview Technologies, Inc.
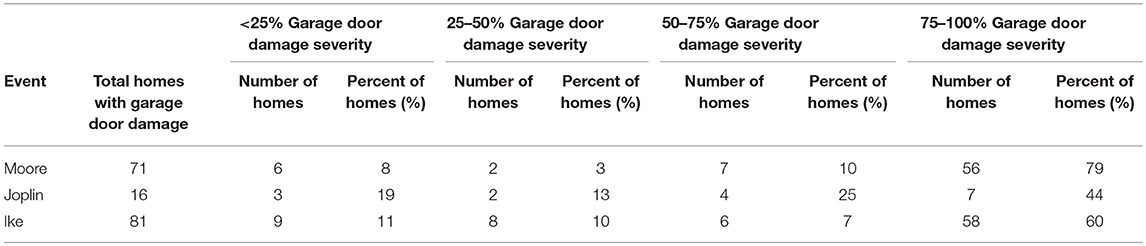
Table 4. Garage door damage (damaged garages only) severity in 90–109 mph wind speeds.
Of the homes that suffered a garage door failure in the 90–109 mph wind speed range, most of them did not suffer severe corresponding roof structure damage, as shown in Table 5. The data show that in a tornado, when the garage door is damaged, there is a higher likelihood of suffering severe structural damage than for structures with garage door damage in a hurricane.
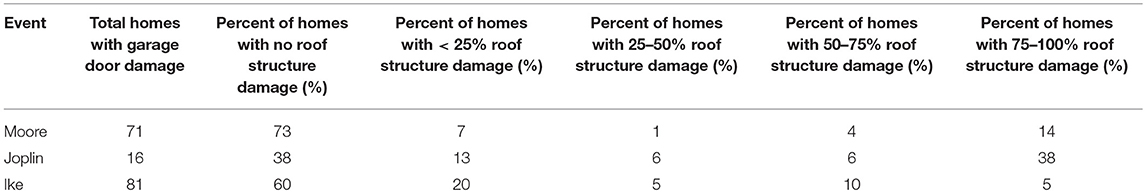
Table 5. Roof structure damage severity in 90–109 mph wind speed range.
Figures 9–11 illustrate examples of the differences between the resulting damage in the three events in the same wind speed range. Damage in Hurricane Ike (Figure 9) in this wind speed zone is less severe; none of the homes shown in this example have suffered any roof structure damage, and only one indicates shingle damage. In the Joplin event (Figure 10), there is a significant increase in the amount of debris found near the homes, as well as a noticeably larger amount of roof structure damage than the other two events, with more structural damage and large areas of shingle loss. In the Moore, OK event (Figure 11), at these wind speeds the roof structure damage does not appear to be as severe as the Joplin case, but there is still more damage than observed in Hurricane Ike.
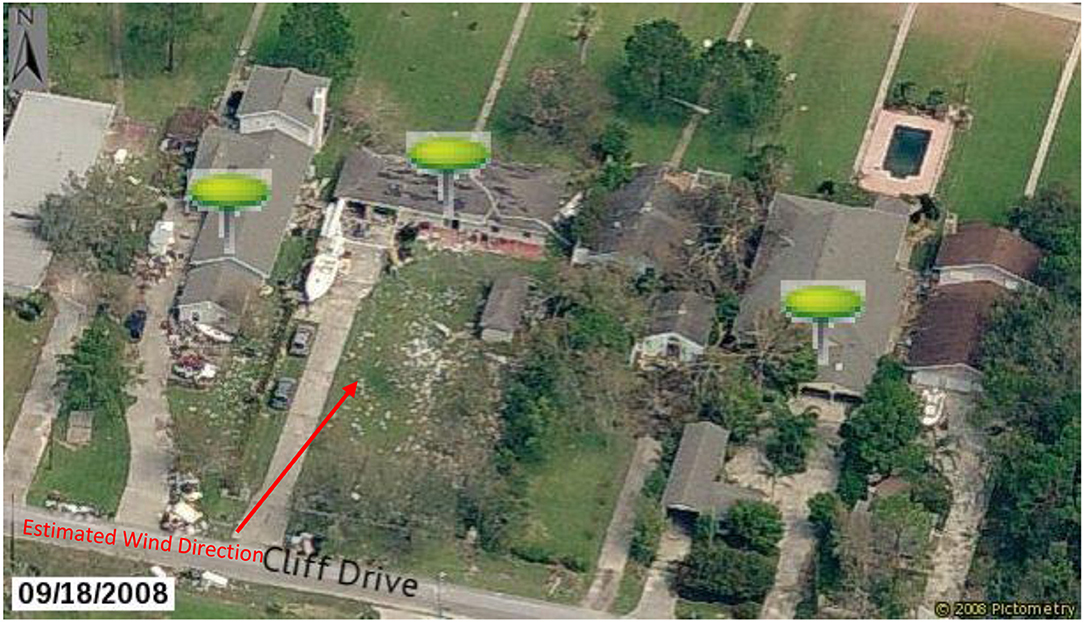
Figure 9. Hurricane Ike Damage in Wind Range Between 90 and 109 mph. Image resolution and quality reduced for publication. Image courtesy of Eagleview Technologies, Inc.
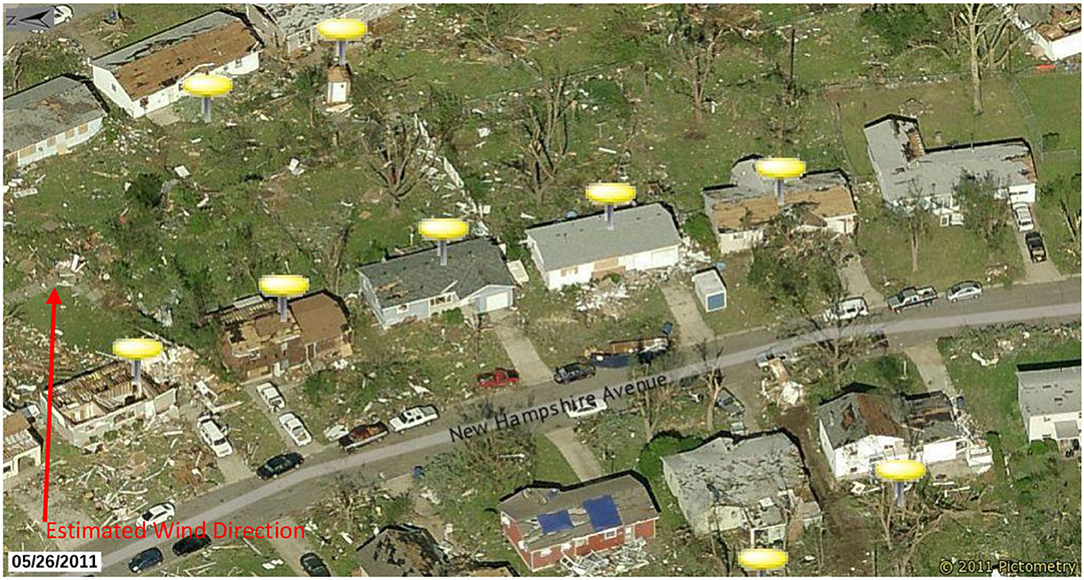
Figure 10. Joplin, MO Tornado Damage at Windspeeds between 90 and 109 mph. Image resolution and quality reduced for publication. Image courtesy of Eagleview Technologies, Inc.
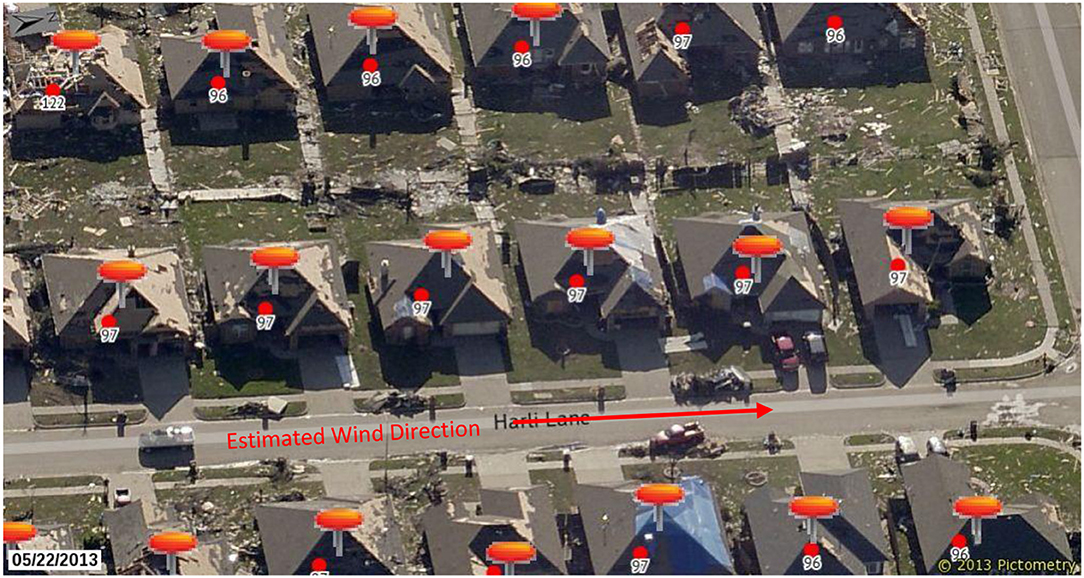
Figure 11. Moore, OK Tornado Damage at Windspeeds Between 90 and 109 mph. Image resolution and quality reduced for publication. Image courtesy of Eagleview Technologies, Inc.
Orientation
While there are many factors that affect garage door damage, one of the most prominent was the orientation of the home and garage door relative to the wind. Marshall and McDonald (1982) and Marshall (2002) found that houses with garage doors facing the wind were typically more severely damaged than those where garage doors faced away from the wind, for the Grand Island, NE 1980 and Moore, OK 1999 tornadoes, respectively. In the current study, the direction that the garage door was facing relative to the path of the storm and subsequent wind field affected the damage as well. Figure 12 provides an example of homes that were facing north and south that appear to have more damage than the homes that were facing west in this particular neighborhood in Joplin. In this location, the wind direction was estimated to be from the south-southwest, as indicated per debris and treefall patterns. Homes that had garage doors nearly perpendicular to the direction of the wind were more affected than those whose garage doors were facing parallel to the wind or were located on the leeward side of the house.
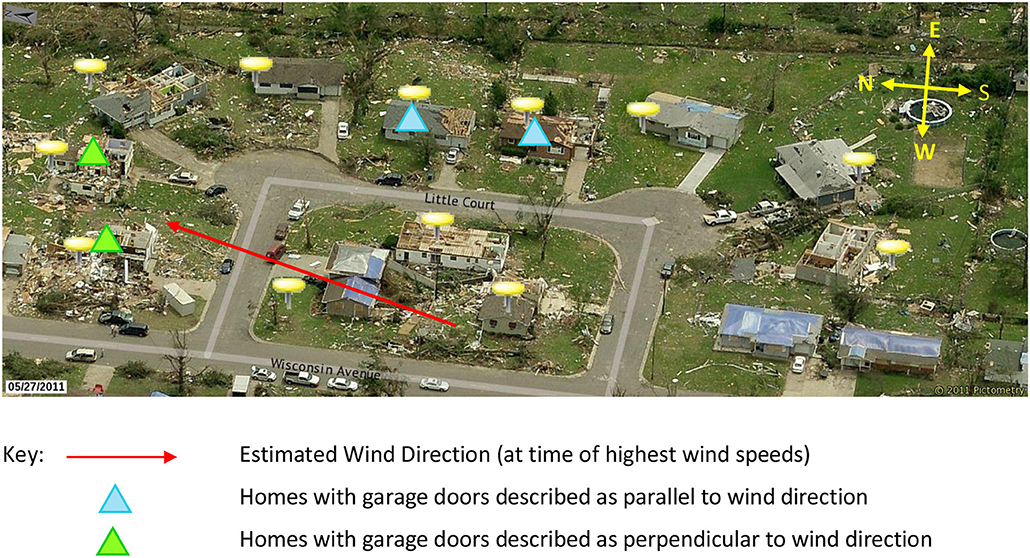
Figure 12. Joplin, MO Home Damage at Various Orientations. Image resolution and quality reduced for publication. Image courtesy of Eagleview Technologies, Inc.
In another case in Joplin, shown in Figure 13, the street was of considerable length and continued into a cul-de-sac with a single home with its front face perpendicular to the street orientation. Significant damage occurred to this home (and a home on the cul-de-sac immediately adjacent) with the wind direction estimated to be from the south. Minimal damage was observed for the homes with their front faces parallel to the wind direction (and street).
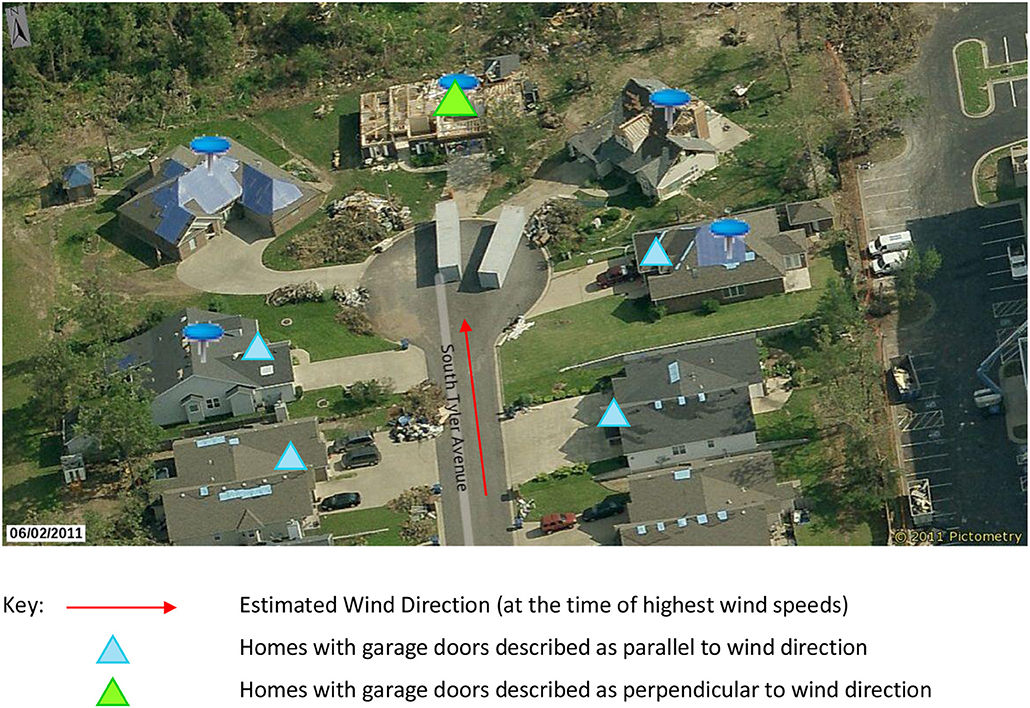
Figure 13. Joplin, MO Cul-de-Sac Damage. Image resolution and quality reduced for publication. Image courtesy of Eagleview Technologies, Inc.
Examples such as these illustrate that the orientation of the neighborhood homes and streets with respect to wind direction likely play a role in the severity of damage that a home will experience. Data from remote-sensing platforms will most certainly assist in a more rigorous determination of the likelihood of damage as a function of orientation.
Garage Door Type
Three types of garage door systems were analyzed within the 90–109 mph wind range, to determine how the size of the garage door affected the susceptibility of damage. As can be seen in Table 6 in the case of Hurricane Ike, the percentage of garage door failures remained relatively consistent, regardless of the garage door size. The table also shows that regardless of the type of garage door, Hurricane Ike had a higher percentage of failures in this wind speed range for all garage door types. The Moore tornado data included mostly two car-one door garages, thus the data for the other two types is not used in comparison. For Joplin, the percentage of failures is highest for the one car garage.
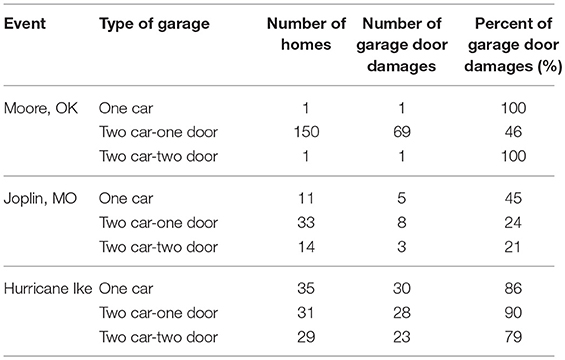
Table 6. Garage door failure analysis in 90–109 mph wind speeds.
The roof structure damage for all failed garage doors was also investigated by garage door type, shown in Table 7. The purpose of this table is to illustrate the likelihood that a home is going to suffer structural failure, given that it has a specific type of garage door that has already failed. Due to the uneven distribution of data within Moore, OK and Joplin, the one car and two car-two door data cannot be utilized for this analysis. Discarding these data and looking at the remaining data, it can be seen that in the case of Hurricane Ike two car-one door homes were the homes that were most susceptible to roof structure damage if the garage door had failed.
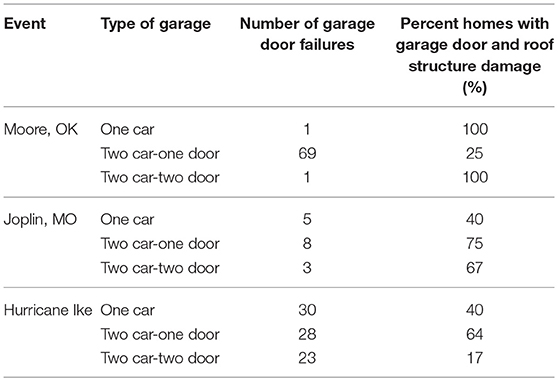
Table 7. Roof structure damage in failed garage doors by type (90–109 mph).
Conclusions
Remote-sensing data proved useful in analyzing the damage caused by hurricanes and tornadoes. Specifically, the use of high spatial resolution, oblique data were invaluable in allowing for the assessment of garage doors and associated roof structural failures in the Joplin, MO and Moore, OK (2013) tornadoes as well as Hurricane Ike. Some of the key findings of this study include:
• Roof structural damage did not frequently occur in the absence of a garage door failure, for any of the events. Less than 10% of homes had roof structural damage if the garage door remained intact.
• About 60% of homes had roof structure damage if the garage door was damaged, meaning structural damage to the roof was more frequent if the garage door failed.
• Garage door failure rates in the same wind speed range were higher for homes evaluated from Hurricane Ike compared to the two tornado events, and were likely the result of duration effects.
• If a garage door failure occurred, it was more likely to result in associated roof structural damage for the tornado events, than for the hurricane.
• Garage doors that were oriented perpendicular to the direction of the wind were more likely to fail, than those parallel to the wind or on the leeward side of the house. More research is needed to better understand this relationship.
• Garage door failure rates in Hurricane Ike were consistent regardless of door size/type (79–80% failed). Garage door failure rates in the Joplin tornado were highest for single-car garages. The majority of garage doors (all but two) in Moore were double-car doors, thus comparisons for garage door types cannot be made for this event.
• Damaged two car, one door garages (in Ike) were significantly more likely to have corresponding roof structure damage than other garage door types. A similar observation was noted in Joplin, but the sample size was too small to make definitive conclusions.
This study highlights the vulnerability associated with garage doors in wind storms—if they fail, the consequences can include significant additional structural damages. The finding of more frequent damage to one car garage doors is consistent with a recent investigation of damage following Hurricane Harvey (Brown-Giammanco et al., 2018) and warrants further research to determine causes. There are more resilient garage door options available, or bracing kits can be installed to reduce the chances for wind damage. Stronger or enhanced garage door systems are not typically widely available outside of hurricane-prone regions. However, although garage door damage was more likely to occur in the hurricane than the tornadoes in this study, the additional structural damages that occurred in the tornado events were much more severe than the hurricane event.
Author Contributions
RK: Initial data analysis and interpretation and first paper draft. TB-G: Data procurer, study initiator, secondary data analysis, and interpretation. FL: Secondary data analysis and interpretation, re-writing.
Conflict of Interest Statement
TB-G was employed by the Insurance Institute for Business and Home Safety.
The remaining authors declare that the research was conducted in the absence of any commercial or financial relationships that could be construed as a potential conflict of interest.
Acknowledgments
The authors wish to thank Pictometry and EagleView Technologies for providing access to remote-sensing datasets; RMS for providing access to H*Wind wind speed data for Hurricane Ike; and the IBHS membership who provide funding for research projects such as this one. This work was supported by NOAA NA16OAR45902 (VORTEX-SE).
References
Berg, R. (2009). Tropical Cyclone Report: Hurricane Ike (AL092008) 1-14 September 2008. National Hurricane Center Report, 55. Available online at: https://www.nhc.noaa.gov/data/tcr/AL092008_Ike.pdf
Brown, T. M., Liang, D., and Womble, J. A. (2012). Predicting ground-based damage states from windstorms using remote-sensing imagery. Wind Struct. 15, 369–383. doi: 10.12989/was.2012.15.5.369
Brown-Giammanco, T. M., Giammanco, I. M., and Pogorzelski, H. (2018). Hurricane Harvey Wind Damage Investigation, 36. Available online at: https://disastersafety.org/wp-content/uploads/2018/07/Hurricane-Harvey-Damage-Investigation_IBHS.pdf
Burgess, D., Ortega, K., Stumpf, G., Garfield, G., Karstens, C., Meyer, T., et al. (2014). 20 May 2013 Moore, Oklahoma, tornado: damage survey and analysis. Weather Forecast. 29, 1229–1237. doi: 10.1175/WAF-D-14-00039.1
Camp, J. P., Kirkwood, P., LaDue, J. G., Schultz, L. A., and Parikh, N. (2017). “National Weather service damage assessment toolkit: transitioning to operations,” in Fifth Symposium on Building a Weather-Ready Nation: Enhancing Our Nation's Readiness, Responsiveness, and Resilience to High Impact Weather Events (Seattle, WA: American Meteor Society) 9.1. Available online at: https://ams.confex.com/ams/97Annual/webprogram/Paper312451.html
Camp, J. P., Rothfusz, L. P., Anderson, A., Speheger, D., Ortega, K. L., and Smith, B. R. (2014). “Assessing the Moore, Oklahoma (2013) tornado using the National Weather Service Damage Assessment Toolkit,” in Special Symposium on Severe Local Storms: The Current State of the Science and Understanding Impacts (Atlanta, GA: American Meteor Society), 830. Available online at: https://ams.confex.com/ams/94Annual/webprogram/Paper233734.html
Dao, T. N., Graettinger, A. J., Alfano, C., Gupta, R., Haan, F. L., Prevatt, D., et al. (2014). “Failure progression analysis of observed residential structural damage within a tornado wind field,” in ASCE Structures Congress 2014 (Boston, MA: American Society Civil Engineering), 1448–1459. doi: 10.1061/9780784413357.128
FEMA (2005). Mitigation Assessment Team Report: Hurricane Charley in Florida. Federal Emergency Management Agency Reports. 488, 318. Available online at: https://www.fema.gov/media-library-data/20130726-1445-20490-6387/fema488.pdf
FEMA (2011). Reinforce or Replace Garage Doors. Federal Emergency Management Agency Reports, 4. Available online at: https://www.fema.gov/media-library-data/20130726-1627-20490-7154/how2016_garage_doors_final3_8_11.pdf
Graettinger, A. J., Ramseyer, C. C. E., Freyne, S., Prevatt, D. O., Myers, L., Dao, T., et al. (2014). Tornado Damage Assessment in the Aftermath of the May 20th 2013 Moore Oklahoma Tornado. Technical Report to National Science Foundation, 133.
IBHS (2012). FORTIFIED HomeTM Hurricane Standards, 121. Available online at: https://disastersafety.org/wp-content/uploads/FORTIFIED-Home-Hurricane-Standards-2012.pdf
IBHS (2015a). FORTIFIED HomeTM High Wind Standards, 115. Available online at: http://disastersafety.org/wp-content/uploads/2015/07/FORTIFIED-Home-High-Wind-Standards-2015.pdf
IBHS (2015b). FORTIFIED HomeTM High Wind & Hail Standards, 118. Available online at: http://disastersafety.org/wp-content/uploads/2015/10/FORTIFIED-Home-High-Wind-Hail-Standards-2015.pdf
IBHS (2017a). FORTIFIED CommercialTM High Wind & Hail Standards, 32. Available online at: http://disastersafety.org/wp-content/uploads/2016/04/Fortified_Commercial_High_Wind_Hail_Standards.pdf
IBHS (2017b). FORTIFIED CommercialTM Hurricane Standards, 34. Available online at: http://disastersafety.org/wp-content/uploads/2016/04/Fortified_Commercial_Hurricane_Standards.pdf
Kuligowski, E. D., Lombardo, F. T., Phan, L. T., Levitan, M. L., and Jorgensen, D. P. (2014). Technical Investigation of the May 22, 2011, Tornado in Joplin, Missouri. National Institute of Standards and Technology, 428.
Lombardo, F. T., Roueche, D. B., and Prevatt, D. O. (2015). Comparison of two methods of near-surface wind speed estimation in the 22 May, 2011 Joplin, Missouri Tornado. J. Wind Eng. Industr. Aerodyn. 138, 87–97. doi: 10.1016/j.jweia.2014.12.007
Luo, J., Liang, D., Kafali, C., Li, R., and Brown, T. M. (2014). Enhanced remote-sensing scale for wind damage assessment. Wind Struct.19, 321–327. doi: 10.12989/was.2014.19.3.321
Marshall, T. P. (2002). Tornado damage survey at Moore, Oklahoma. Weather Forecast. 17, 582–598. doi: 10.1175/1520-0434(2002)017<0582:TDSAMO>2.0.CO;2
Marshall, T. P., and McDonald, J. R. (1982). “An engineering analysis of the grand island tornadoes,” in Preprints, 12th Conference on Severe Local Storms, (San Antonio, TX: American Meteor Society), 293–296.
National Hurricane Center (2014). Tropical Cyclone Report Hurricane Ike (AL092008). Available online at: https://www.nhc.noaa.gov/data/tcr/AL092008_Ike.pdf
Phan, L. T., and Simiu, E. (1999). “Fujita tornado intensity scale: a reassessment from structural engineering perspective,” in Wind and Seismic Effects. Proceedings, 31st U.S./Japan Natural Resources Development Program (UJNR) Joint Meeting, Technical Memorandum of PWRI 3653, 71–78. Available online at: https://www.nist.gov/publications/fujita-tornado-intensity-scale-reassessment-structural-engineering-perspective
Powell, M. D., Houston, S. H., Amat, L. R., and Morisseu-Leroy, N. (1998). The HRD real-time hurricane wind analysis system. J. Wind Eng. Ind. Aerodyn. 77–78, 53–64. doi: 10.1016/S0167-6105(98)00131-7
Prevatt, D. O., Coulbourne, W., Graettinger, A. J., Pei, S., Gupta, R., and Grau, D. (2012). Joplin, Missouri, Tornado of May 22, 2011: Structural Damage Survey and Case for Tornado-resilient Building Codes. ASCE Publications.
Wadsworth, T. (2014). First-Ever Building Code Requires Tornado-Resistant Garage Doors. Door + Access Systems, Summer 2014, 30–35. Available online at: www.dasma.com/articles/feature/TornadoDoors_Sum2014.pdf
Womble, J. A., Adams, B. J., and Mehta, K. C. (2005). “Windstorm damage surveys using high-resolution satellite images,” in Proceedings of 10th Americas Conference on Wind Engineering (Baton Rouge, LA).
Womble, J. A., Ghosh, S., Friedland, C. J., and Adams, B. J. (2006). Hurricane Katrina—Advanced Damage Detection: Integrating Remote-Sensing Images with VIEWS Field Reconnaissance. MCEER Reports 06-SP02, University at Buffalo, 154 pp. Available online at: http://mceer.buffalo.edu/pdf/report/06-SP02.pdf
Womble, J. A., Wood, R. L., Eguchi, R. T., Ghosh, S., and Mohammadi, M. E. (2016). Current methods and future advances for rapid, remote-sensing-based wind damage assessment, in Proceedings, Resilient Infrastructure (London; Canada). Available online at: https://ir.lib.uwo.ca/cgi/viewcontent.cgi?article=1060&context=csce2016
Keywords: damage, wind, hurricane, tornado, garage
Citation: Kovar RN, Brown-Giammanco TM and Lombardo FT (2018) Leveraging Remote-Sensing Data to Assess Garage Door Damage and Associated Roof Damage. Front. Built Environ. 4:61. doi: 10.3389/fbuil.2018.00061
Received: 28 June 2018; Accepted: 10 October 2018;
Published: 30 October 2018.
Edited by:
Matthew Mason, The University of Queensland, AustraliaReviewed by:
J. Arn Womble, West Texas A&M University, United StatesMohammadtaghi Moravej, Florida International University, United States
Copyright © 2018 Kovar, Brown-Giammanco and Lombardo. This is an open-access article distributed under the terms of the Creative Commons Attribution License (CC BY). The use, distribution or reproduction in other forums is permitted, provided the original author(s) and the copyright owner(s) are credited and that the original publication in this journal is cited, in accordance with accepted academic practice. No use, distribution or reproduction is permitted which does not comply with these terms.
*Correspondence: Tanya M. Brown-Giammanco, dGJyb3duQGliaHMub3Jn