 Matthew Yarnold
 Thomas Golecki
 Jeffrey Weidner
- 1Zachry Department of Civil Engineering, Texas A&M University, College Station, TX, United States
- 2Pennoni Associates, Intelligent Infrastructure Systems, Philadelphia, PA, United States
- 3Department of Civil Engineering, The University of Texas at El Paso, El Paso, TX, United States
The continual increase of truck weights on our transportation system is a growing concern among bridge engineers. The load carrying capacity of the structures within the system must withstand this ever-growing demand. For multi-girder steel bridges, the load carrying capacity is heavily influenced by the presence of composite action between the girders and the concrete deck slab. While detailing to ensure reliable composite action is typically included in new designs, for many existing structures, the owner may not fully know the level of composite action. This may be due to administrative issues like insufficient original construction drawings or mechanical issues like breakdown of the shear transfer components. Even in situations where composite action was not intended there exists some partial interaction due to chemical bond and friction. Clearly understanding the presence and reliability of composite action in multi-girder structures is key to managing these structures effectively. This paper explores how load testing has been utilized to identify the level of composite action for existing bridges. The challenges associated with field identification of composite action are presented. In addition, three case studies of truck load testing are discussed. The first case utilized uncontrolled ambient truck measurements of an instrumented structure to field determine the composite behavior. The second and third cases perform a controlled load test with variations in truck weights and positions. Overall, the paper illustrates the advantages and disadvantages of truck load testing for identification of composite action and provides recommendations for future studies.
Introduction
Bridge load testing is a valuable method engineers utilize for the evaluation of existing structures. Typically, load testing is implemented when analytical rating methods indicate insufficient vertical load capacity. There are two general forms of bridge load testing. The first is diagnostic testing. Diagnostic testing includes the measurement of load effects in bridge members and compares these results with an analytical model (AASHTO, 2018). The tests allow for model calibration and more accurate structural analysis (typically through load ratings). Proof testing is the second form of load testing. In this case, loads that exceed the desired operational load level are applied to the bridge and observations are made to determine if the bridge carries these loads without damage. Loads are applied in increments and the bridge is monitored to provide an early warning of possible distress or non-linear behavior (AASHTO, 2018).
Substantial research has been performed on bridge load testing that specifically address composite action. National Cooperative Highway Research Program (NCHRP) funded a study (Report 306) to correlate bridge load capacity estimates with test data (Burdette and Goodpasture, 1988). A section of the project was dedicated to unintended composite action in beam and slab bridges. Eleven comprehensive experimental studies were compiled that included laboratory and field tests to ultimate capacity. The results indicated that the bond between the beam and deck slab was the most important factor in determining whether a bridge built non-composite could be counted on to act composite. Even though this bond was shown to be very effective in transmitting horizontal shear, the reliability was questioned. It also concluded that the degree of composite action is difficult to quantify and should be regarded as a ‘bonus'.
NCHRP 12-28(13)A was another large study on non-destructive load testing (Lichtenstein, 1993). The study indicated that without mechanical shear connection, some composite action exists between the beams and deck slab due to friction and chemical bond. Similar to the prior NCHRP study, it found that chemical bond had significantly more of an effect on composite behavior compared to friction. They indicate that, except for a field test, there is no practical way to ascertain if bond exists and that if the “top flange of a girder is partially embedded in the deck slab, the bond resistance is very effective in promoting the composite action.” Bakht and Jaeger (1992) found exception to this during their ultimate load test where the top flanges were partially embedded and no mechanical connection to the deck was provided. In their test, the composite action that existed at service loads broke down at loads approaching failure and did not achieve the ultimate strength of the fully composite section. NCHRP 12-28(13)A presents recommended bond strengths for bridges not load tested. In addition, an analytical method is provided for calculating proof load levels from the results of diagnostic testing.
Chajes et al. (1997) performed experimental diagnostic load testing on a steel girder bridge that was designed as non-composite. Five factors were presented for consideration of unintended composite action in a load rating. This include the current condition, past traffic history, future traffic, structural redundancy and potential for future non-destructive testing. In the bridge they studied, composite action was recommended for the final rating with a higher frequency of inspections to be performed that examine the deck-girder interface.
Jauregui et al. (2000) evaluated two non-composite steel girder bridges through testing to failure. Partial composite action was not only measured through girder strains, but horizontal girder-slab differential displacements. Partial composite action was observed with more composite action present in the exterior girders due to the larger curb and railing. Heavier load had no significant impact on the load distribution and partial composite action of the girder. The transverse load position of the test trucks had a larger impact on the composite behavior.
Work by Barker et al. (1999) for the Missouri Department of Transportation aimed to quantify field test behavior for rating steel girder bridges. The study indicates that unintended composite action may not be reliable during the bridge's service life. As a result, an approach is presented for removal of measured composite action for load rating purposes. Other more recent studies have also evaluated unintended composite action through diagnostic load testing such as Breña et al. (2013), James and Yarnold (2017), and Sigurdardottir and Glisic (2013).
The presented study aims to further the state-of-knowledge with regard to field identification of composite action of steel girder bridges using load testing. An emphasis was placed on quantifying the variability of neutral axis locations and the resulting level of composite action between the beams and deck slab. This research was conducted through three case studies that includes three bridges, designed non-composite, composite, and composite only in the positive moment regions, respectively. Conclusions and recommendations are provided from these three case studies along with review of substantial prior research.
Influence of Composite Behavior
Truck load testing has repeatedly shown to provide information that can significantly increase the understanding of a structures live load behavior. For a conventional steel girder bridge, there are several areas of uncertainty where a load test can provide refined information. This includes:
• lateral load distribution
• span continuity
• boundary condition stiffness
• dynamic amplification (impact factor)
• section dimensions
• composite behavior
The focus of this paper is the composite behavior between the girders and concrete deck slab. For structures where composite action is in question, load testing can provide valuable information. Two general situations are confronted in a live load test of a girder bridge. The first is a bridge where the girders were not mechanically connected to the deck slab. The intention of the designer is to produce non-composite behavior where the girders and slab act independently, as shown in Figure 1C. However, in reality there is some form of partial composite action due to the chemical bond and friction between the girders and deck. The partial composite and full composite strain distributions are illustrated in Figures 1A,B, respectively. The second situation is a bridge where mechanical connection of the girders to the deck slab was originally provided. Nevertheless, the concrete deck slab may be degraded or there may be fatigue issues of the shear studs. In this case, a fully composite strain distribution may have been assumed, but in reality slip is occurring producing a partially composite situation.
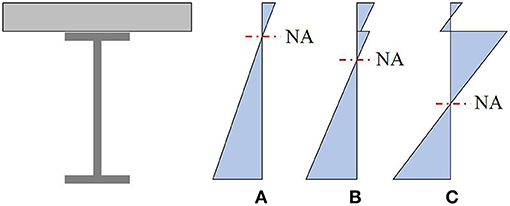
Figure 1. Strain distribution for (A) full-composite, (B) partial-composite, and (C) non-composite behavior.
Identifying the level of composite action can substantially influence the assessment of vertical load capacity of a bridge (typically expressed through load ratings), fatigue life estimate or serviceability checks. Most load tests on assumed non-composite bridges have concluded the structure was composite to some degree, which can increase the load rating (e.g., Chajes et al., 1997; Breña et al., 2013; James and Yarnold, 2017). As stated earlier, the reliability of this composite action at ultimate strength is questionable (Bakht and Jaeger, 1992; Barker, 2001). Therefore, bridge owners differ in their willingness to accept full or partial composite action for ultimate strength without quantifiable interface shear strength for bridges with unknown connection details.
To further illustrate the impact of composite action between the steel girders and concrete deck slab, a sensitivity study was conducted by the authors to determine the ultimate (plastic) moment capacity of a section as a function of varying levels of composite action. The horizontal shear transferred between the girders and slab (V') was varied for the girder geometry shown later in each case study, denoted here as CS1, CS2, and CS3. Each case study has different girder dimensions, girder spacing and deck slab thickness. They cover a wide range of configurations. Overall, the purpose of the sensitivity study is to illustrate the relative increase in flexural capacity for different levels of composite action. The specific results for each case study are provided in section Case Studies.
The sensitivity study was performed by setting an interface shear force between non-composite, zero interface shear, and fully composite, when interface shear matches the minimum of the steel or concrete strength. In practice this level of composite behavior is determined by the relative stiffness of the interface. This ratio (V'/V) can be considered the level or percentage of composite action. The ultimate strength is then computed as follows. Because the steel section is considered to be at yield stress throughout the cross section, and the net axial force is assumed to be zero, the interface shear is essentially the net axial force in the deck. A neutral axis location can then be found which balances the tension and compression. Finally, the depth of the compression region is determined by assuming a rectangular stress block at 0.85f'c through a thickness necessary to produce a net compression value equal to the assumed interface shear. This stress distribution is then used to determine the resulting flexural moment, i.e., partially composite capacity (M) of the section.
Figure 2 illustrates the relative results, where Mfc is the fully composite flexural capacity, V is the fully composite shear force, the minimum of AsFy and 0.85f'c bets where As is the steel cross-sectional area and Fy is the steel yield stress f'c is concrete strength, ts is slab thickness and be is the effective deck width. In Case Study 1, the composite section is governed by the steel section, meaning it has a relatively thick deck. The other two case studies are governed by the slab. Because of this, the change in strength from non-composite to fully composite is more significant for the Case Study 1 cross section. The flexural capacity is roughly 100% greater for the fully composite vs. the non-composite condition in CS1 and roughly 50% greater for CS2 and CS3. Overall, the non-linear relationship shown in Figure 2 indicates that even a relatively small amount of shear transfer can provide a significant increase in moment capacity, especially for cross sections with thicker decks.
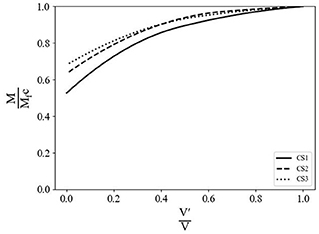
Figure 2. Change in moment capacity vs strength of shear interface.
Challenges for Field Identification of Composite Action
Measurement of composite action through field instrumentation is more challenging than one might expect. The conventional approach is to measure the longitudinal strain response at multiple positions along the height of a girder cross-section. These measurements are then utilized to identify the neutral axis. It can be observed in Figure 1 that the neutral axis changes with the composite nature of the system. The increase in composite action causes the neutral axis to move up the cross-section, resulting in a more efficient section. Some studies have measured the relative slip between the girders and deck to identify composite action. However, this has achieved only limited success. The main challenges associated with identifying the neutral axis and resulting level of composite action are listed below followed by a brief discussion of each. Recommendations for dealing with these challenges are included at the end of the paper.
• environmental conditions
• material properties
• geometry
• test setup
Environmental Conditions
Typically, a load test is conducted over a short period in time. As the duration of measurements increase, the level of uncertainty increases due to varying environmental conditions. These conditions can naturally change the behavior. For example, the stiffness of an asphalt wearing surface varies with temperature change. In addition, moisture and humidity can cause corrosion that further restrains bearings producing additional axial force effects.
Material Properties
The material properties of concrete and steel can vary from the original design drawings. These properties may have a significant impact on the composite action, both in stiffness and strength. The strength of the concrete is of importance as it affects the plastic neutral axis and total moment capacity of the section. Concrete strength is understood to vary with time resulting in a challenge to predict. The stiffness of the material is also of interest, as it will affect the elastic neutral axis location. In addition, calculation of the transformed section properties using the modular ratio will vary. However, material properties should have minimal impact on the variability of composite action over a short timeframe.
Geometry
Many aspects of the geometry are a challenge. The uncertainty will vary based on the quality of plans available. For field identifying composite action, the deck and girder dimensions are critical. This partly relates back to environmental conditions and if the dimensions have changed over time. Steel girders can have corrosion-induced section loss with breakdown of the paint system. The deck thickness could be different than the plans due to the initial construction, rehabilitations or wear on the top surface from traffic. In addition, the haunch thickness might not be stated on drawings and typically varies in the field, as well as at changes in girder geometry such as cover plates. This is a critical dimension as it determines the “moment arm” between the girder and the deck, and therefore effects both stiffness and strength of the composite section. Additionally, steel sections embedded into the deck can be considered to have a negative haunch. Care should be taken when using traditional capacity equations with these sections as the geometry may make these inapplicable.
The overall geometry of the bridge system adds further aspects to consider. Curved, skewed or even straight bridges in some cases can produce out-of-plane bending or torsion in the girders that must be considered. Another geometric aspect that complicates field testing is the barriers. This and any other elements cast on the deck (sidewalk, median, etc.) can heavily influence the results.
Test Setup
Selection of the local strain gauge locations in each girder cross-section is a major decision for the load test. The literature shows a variety of arrangements. Overall, the design of an instrumentation system needs to consider both composite and non-composite behaviors as a possibility. Placement of a gauge near the neutral axis can produce minimal response. In this situation, it is difficult to confirm the gauge functionality and confirm results with a poor signal-to-noise ratio.
The global spatial resolution needed to identify composite action is another difficult question when designing the instrumentation. The number of cross-sections along a given girder and/or number of girders to instrument can significantly vary based on the objectives of the load test, type of structure and the resources of the project.
Load magnitude is also something that should be considered for evaluating composite action. At higher load levels the response can be non-linear (Lichtenstein, 1993), increasing the complexity for data interpretation. However, the AASHTO Manual for Bridge Evaluation does not recommend conducting load tests outside the linear elastic range (AASHTO, 2018). In addition, the load position can have an impact on composite action and should be considered (Jauregui et al., 2000). The effective slab width can vary with different load levels due to the transverse spread of the load.
Other challenges for testing can be sensor noise and sensor orientation errors. The gauge resolution varies based on the manufacturer and model selected. The greater the resolution the more difficult it will be to identify reliable strain profiles. The orientation of the sensor can be an issue in harsh environments. If care is not taken to align the sensors parallel to the longitudinal axis of the girders, then this must be accounted for in the future data interpretation.
Case Studies
Presented below are three case studies demonstrating different methods for identification of composite action and the resulting variability of the level of composite action observed. Case Study I illustrates a load test that utilized ambient traffic data to evaluate composite action where no mechanical connection was provided between the girders and deck slab. Case Study II presents a controlled proof load test for a structure designed with shear studs. Finally, Case Study III also conducted the evaluation through a controlled load test, but shear studs are only provided for the positive moment region of the two span continuous girders.
Case Study I
Background and Motivation
The first case study structure is a three span highway bridge, located in Tennessee, USA. The two lane rural bridge, constructed in 1975, spans a total of 40 m (131 ft) and includes eight steel girders, spaced at approximately 1.0 m (40.3 in), with no skew. Figure 3 shows a typical section of the structure along with the girder numbers.
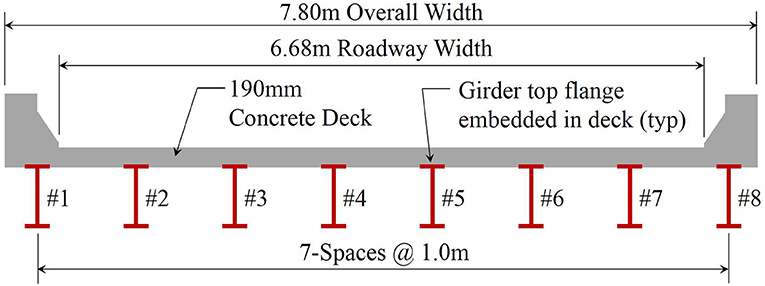
Figure 3. Case Study I bridge typical section.
The motivation to use this structure as a test bed is primarily due to the uncertain composite action present between the steel girders and concrete deck slab. No mechanical connectors (e.g., shear studs) are shown on the design drawings. However, the top flange of the girders is embedded within the deck slab. The owner preferred to consider the bridge as composite, prior to field testing.
Approach
The approach to identify the level of composite action was to instrument two girders (#2 and #4) with the configuration shown in Figure 4. Then measurements were recorded during ambient traffic (uncontrolled) for 10 days with a trigger threshold of 20 με in either girder. Note that ambient temperature changes induce variations in strain so the trigger threshold was based off a moving average. In the post-processing phase, a zeroing algorithm was implemented so only the relative strain measurements were used for each truck event.
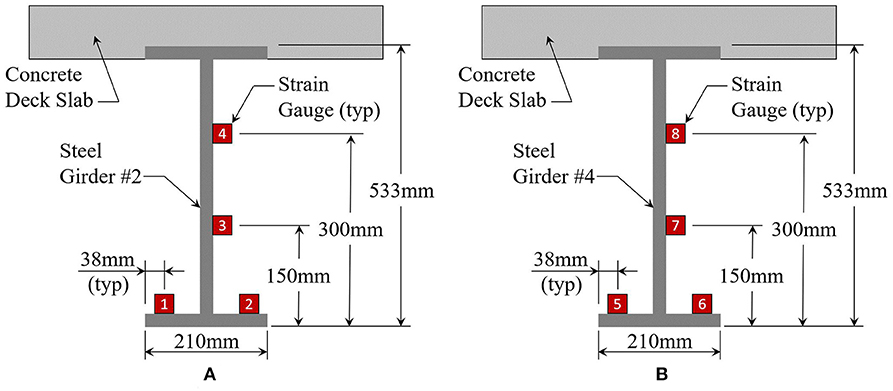
Figure 4. Strain gauge setup for (A) Girder #2 and (B) Girder #4.
Vibrating wire (VW) strain gauges (SG) were utilized for this study (Geokon Model 4000), which has a resolution of 1.0 με. Figure 5 shows a photo of one instrumented girder. Campbell Scientific data acquisition equipment was used (CR3000) with dynamic vibrating wire analyzers (CDM-VW305). This allowed for a sampling rate of 50 Hz, which was more than sufficient for the relatively slow vehicle speeds. Power was provided through a 90-watt solar panel that charged a 12-volt battery.
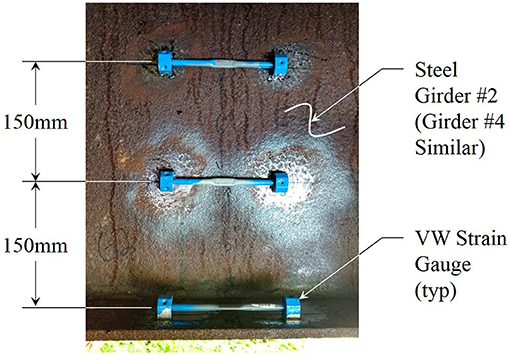
Figure 5. Strain gauge setup photo at Girder #2.
Results
The Case Study I Bridge exhibited composite behavior under ambient loading. This was determined from over 150 recorded truck events (each response >20 με) over the 10 days of measurements. The largest response was 104 με in strain gauge #5 (SG5). Figure 6 shows the time history plot from this data set (unfiltered). This plot illustrates the quality of data recorded. In addition, the paired response from SG1/SG2 and SG5/SG6 indicates minimal out-of-plane bending was induced.
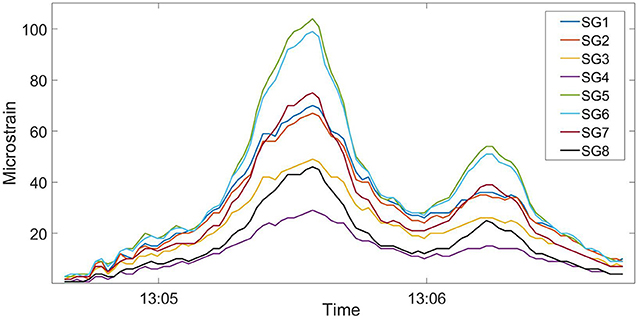
Figure 6. Time history from the largest truck event.
The conventional approach for identification of the neutral axis using ambient truck traffic is to plot the strain gauge profiles during a significant truck event. Then these lines are projected to find the vertical axis intercept. Figure 7 represents measurements from the average of SG5 and SG6 along with SG7 and SG8 over different time intervals during the largest truck events. The height of the girder is 533 mm (21 in) so the neutral axis is clearly in the deck slab indicating composite behavior despite having no shear studs. This would be the common conclusion drawn for most load tests. However, the results from a single truck event are deceiving and do not illustrate the variability of the field identified neutral axis.
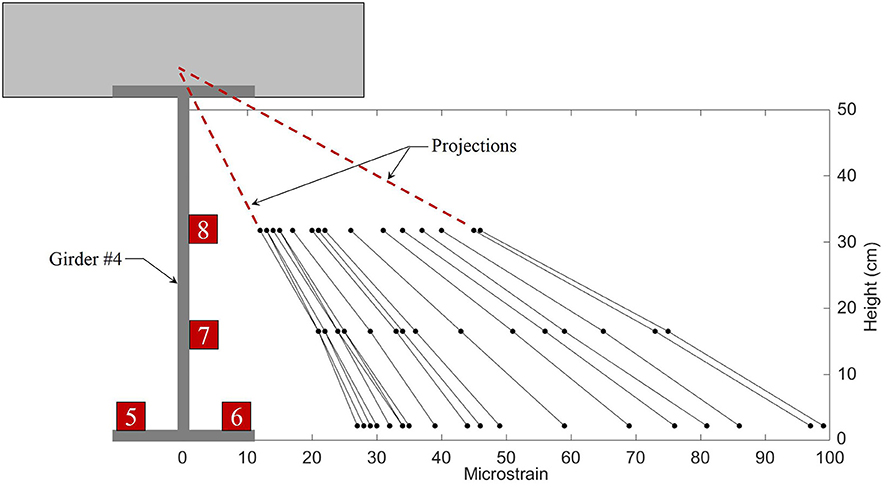
Figure 7. Strain measurements at Girder #4 for the maximum truck event.
To comprehensively evaluate the composite nature of the structure, the neutral axis was projected for all truck events at both girders. The objective was to quantitatively determine the distribution of neutral axis location and the variability in composite action. Figure 8 provides the overall results. The left side of the figure shows the strain profile for each truck event for both girders (over 300 strain profiles). The projected neutral axis location (y-axis intercept) is also identified. A wide spread of results can be observed. As a frame of reference the plastic neutral axis of the composite section (PC), elastic neutral axis of the composite section (EC), and the neutral axis of the non-composite section (NC) are provide in the center of the figure. In addition, the right side of Figure 8 provides a histogram of the neutral axis locations. The data indicates a mean neutral axis location of 534 mm (21 in) with a standard deviation of 52 mm (2.1 in), thus a coefficient of variation (COV) of 0.10. The magnitude of loading subjected to the bridge was in the elastic range so the comparison of measured neutral axis should be with EC and NC. The results indicate composite behavior under service level truck loading. The variability comes from a number of uncertainties (many discussed earlier in the paper). In this particular case some of the primary uncertain parameters are the concrete material properties and fixity of the bearings (which can induce axial force), and the presence of a large concrete barrier near one of the measured girders. Conclusions and recommendations taking into account these results are provided at the end of the paper.
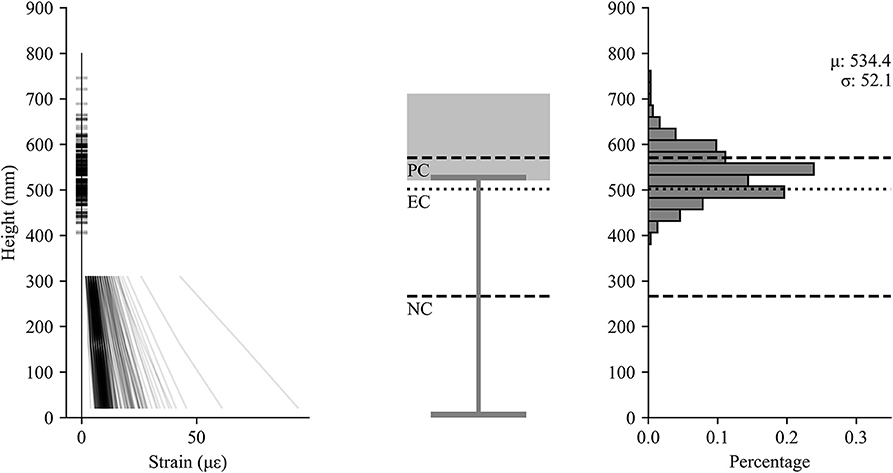
Figure 8. Measured strains vs height (left), schematic of girder (center), histogram of neutral axis locations (right).
Case Study II
Background and Motivation
The second case study focuses on a typical highway structure in the eastern United States. The structure is a multi-span, simply-supported steel multi-girder bridge with varying span geometries (i.e., straight, skewed, and straight-skewed combination, as shown in Figure 9) and lengths [ranging between 21 and 40 m (70 and 130 feet)]. The adjacent twin spans were built in 1983 and include variable, built-up section properties. The structure was designed composite with 152 mm (6 in) tall, 19 mm (3/4 in) diameter shear studs in groups of two to three at a spacing of 380 to 530 mm (15 to 21 inches).
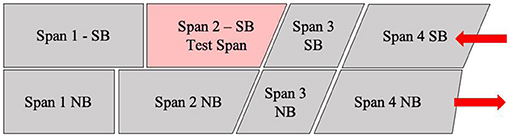
Figure 9. Plan view schematic of Case Study II bridge showing varying span geometry, direction of traffic (red arrows) and test span.
This bridge was selected for field testing for several reasons. Unlike the other case studies presented herein, this test was not conducted specifically to determine whether the bridge behaved in a composite fashion, nor was the test specifically conducted to load rate the structure. The bridge was selected for an international study on bridge assessment. As the bridge was going to be accessed by numerous teams of researchers from around the globe, access was a critical driver. Additionally, the bridge exhibited many performance problems that are common on many operating structures in the United States (e.g., fatigue cracking, bearing deterioration, deck and joint deterioration), making it an ideal candidate for the international study. For the sake of simplicity, testing was limited to one span (identified on Figure 9) of a total of eight available spans.
Approach
The instrumentation and testing approach utilized for the structure was in line with the overarching goal of the international study which was to conduct a round robin test on single structure using best practices from other countries. The results presented here were to be considered the “ground-truth.” The instrumentation was laid out in a grid, with the following general desired outcomes:
• Provide situational awareness during the live load testing (i.e., safety)
• Function within the situational constraints of the test (i.e., budget, time on site, etc.)
• Facilitate both direct and model-based interpretation of the test results
Figure 10 illustrates the instrumentation plan, with sensor configurations at each node that allows for data interpretation at the system, component, and material levels. To that end, each main grid location had two or three longitudinal strain gages to identify demand on the cross section, and level of composite action, as these are good indicators of both system and component level behavior.
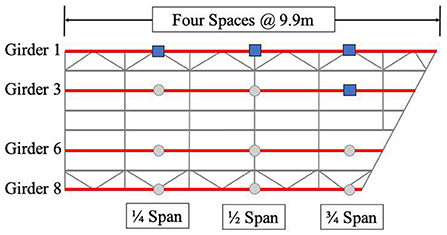
Figure 10. Instrumentation layout of Span 2 Southbound, showing sensor grid (Locations with blue squares are presented in this paper).
The strain sensors were 25.4 mm (1 in) weldable, quarter bridge strain gages from Hitec Products. The sensors were installed per manufacturer specifications on the top of one side of the bottom flange, and 508 mm (20 in) up the height of the web, as shown in Figure 11. The budget for the testing did not allow for sensors on both sides of the flange and web, and the time on site prevented installation of sensors on the bottom of the bottom flange. This sparse cross-sectional instrumentation creates uncertainty related to both axial force and out-of-plane bending, but unavoidable in this situation. Due to the unique geometry, each girder has a different overall length with different start and end points for flange transitions on the top and bottom flanges, shown generally in Figure 12. This results in seven different cross-section configurations out of a total of 12 instrumented locations. Testing itself consisted of three load stages of three to six dump truck at various load levels, and positions across the deck. The final load level achieved exceeded the proof level load as required by the AASHTO Manual for Bridge Evaluation (AASHTO, 2018), meaning the test served as a proof level load test. Note that after each load stage, the sensor outputs returned to zero, indicating an elastic test.
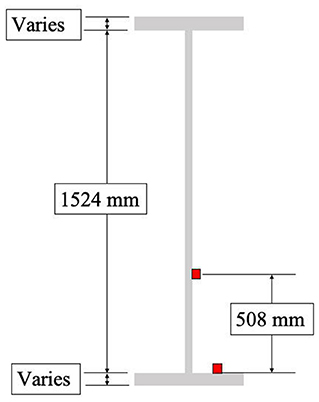
Figure 11. Girder cross-section showing sensor locations (typical for all instrumentation locations).
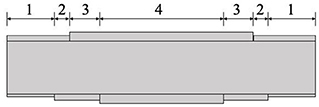
Figure 12. Schematic elevation of girder showing flange transitions with four different section properties per girder.
Results
Longitudinal strains at each location were plotted vs. position on the height of the cross-section. The strain profile was assumed to be linear, and extrapolated to the neutral axis. This analysis was carried out for each load level and load position on the bridge. Figure 13 shows the linearity plots, a girder cross-section with the location of the elastic neutral axis (EC), plastic neutral axis (PC), and non-composite elastic neutral axis (NC) plotted for reference, and a histogram for experimental neutral axis location at all load stages for the sensors along Girder 1 (the longest exterior girder). These sensors produce consistent composite results across load levels and positions, with the experimental mean occurring almost directly at the composite elastic neutral axis.
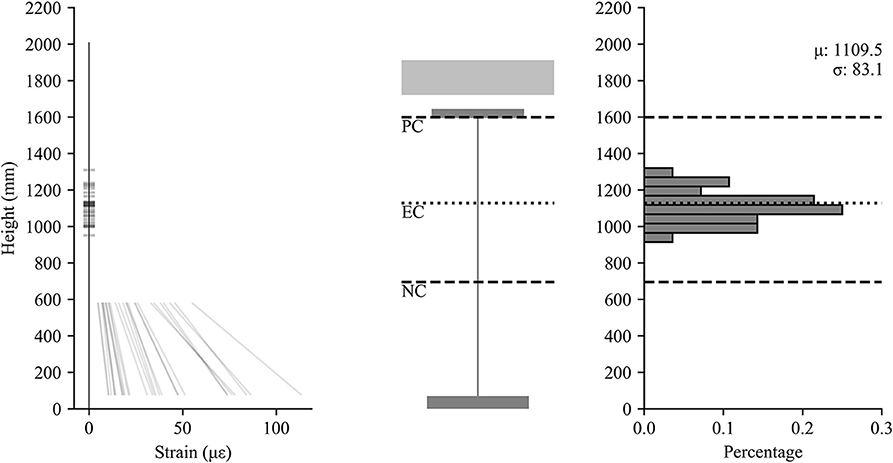
Figure 13. Measured strains vs. height (left), schematic of girder (center), histogram of neutral axis locations (right) for Girder 1.
The responses at three quarter span for Girder 3 are shown in Figure 14. At this location, it can be observed that the neutral axis location is shifted toward the elastic, non-composite neutral axis which indicates a partial loss of composite action. Given that all load levels and positions produced neutral axis location results consistently between the elastic composite and non-composite neutral axis locations, it can be concluded that there was a reduction in composite action at this location that was not observed along Girder 1. This can be concluded in spite of the uncertainty stemming from the sparse cross-sectional instrumentation. There is additional uncertainty in the distribution of neutral axis location which may stem from material properties, load location and magnitude, the presence of non-structural components, as well as the aforementioned out-of-plane behavior and axial components. At the cross-sectional level, much of this could be reduced by adding additional sensors along the height of the girder and on both sides of the flange and web. In practice, the spatial variation of composite action observed here makes a strong case for a dispersed instrumentation grid where it may be infeasible to heavily instrument every cross-section location.
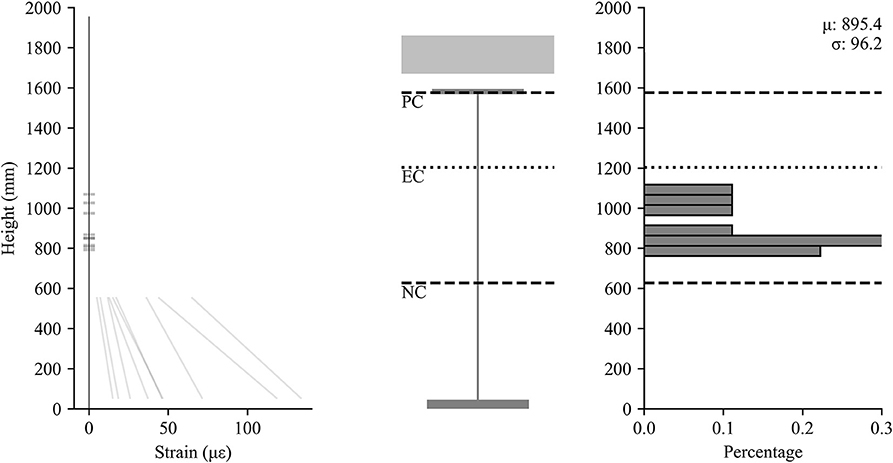
Figure 14. Measured strains vs. height (left), schematic of girder (center), histogram of neutral axis locations (right) for Girder 3 at -span.
Case Study III
Background and Motivation
The third case study bridge consists of a two-span continuous structure with spans of roughly 24.4 m (80 ft). The concrete deck is supported on nine kinked steel girders with a spacing that varies from 2.20 m (7 ft 2.5 in) to 2.05 m (6 ft 8.75 in). The variable girder spacing is the result of a tapering lane from an onramp right before the bridge. The girders are supported by a fixed bearing at the center pier and by expansion bearings at the ends. The concrete deck was initially 190 mm (7.5 in) thick, rehabilitation drawings indicate the top 50 mm (2 in) has been removed and replaced with a 65 mm (2.5 in) thick concrete overlay. A typical girder elevation is shown in Figure 15. Note that the positive moment regions are designed as composite with shear studs while the negative moment regions have no shear studs and are indicated as non-composite.
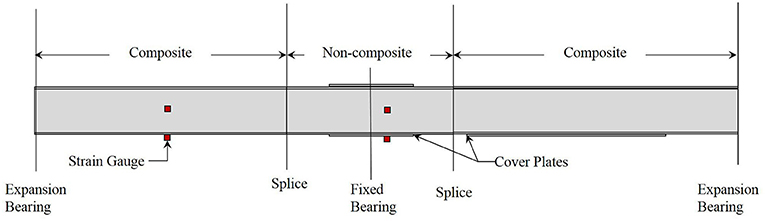
Figure 15. Typical girder elevation (shear studs are only present in the positive moment regions).
Approach
A load test of this structure was carried out with the intent of capturing moment distribution among the girders to compute a more accurate load rating. In order to achieve this, two cross sections of the bridge were instrumented with Geokon Model 4000 vibrating wire strain gauges (Figure 16). Each girder in the cross section was instrumented as shown in Figure 17. The placement of three gauges on the cross section was selected to measure primary bending strains while being able to exclude any out-of-plane moment of the girder webs. This instrumentation also allows for an evaluation of composite action of each girder by linearly projecting strain values to find the neutral axis. Results presented herein focus on composite action, rather than moment distribution.
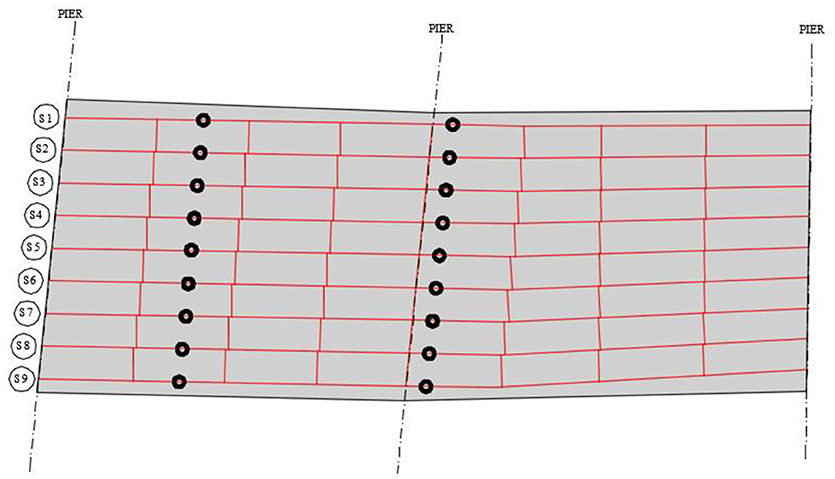
Figure 16. Plan view showing instrumented locations.
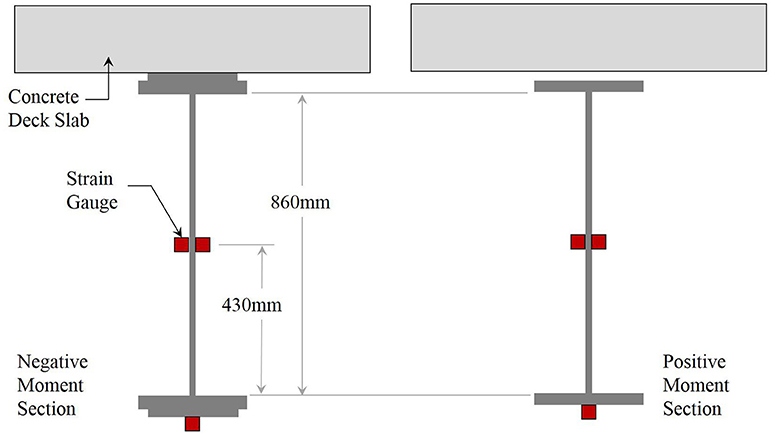
Figure 17. Instrumented cross section details.
The load test was conducted using three axle dump trucks with their rear axles placed at quarter-span locations in each lane. Multi-truck cases were also considered, by placing all three trucks side by side at quarter span locations, and by placing one truck at the center of each span in the same lane. A total of 31 different vehicle placement locations were included in the load test using empty dump trucks. The trucks were then loaded with salt and all tests were repeated. This provided some indication of response linearity while maintain the vehicle configuration. In addition, the variability of composite action with load level was evaluated.
Results
Load test results are shown in Figures 18, 19 as strain profiles in each of the nine instrumented girders in the positive and negative moment regions, respectively for load cases which generated at least 10 με in the bottom flange. From Figure 18 it is seen that the positive moment region is primarily composite. The neutral axis locations are consistently near the bottom of the top flange with a coefficient of variation (COV) of 0.07. The negative moment region (Figure 19) also behaves with essentially composite behavior in most girders but with a wider variation, COV of 0.13. In both Figures 18, 19 reference lines are drawn indicating the location of the non-composite neutral axis (NC), elastic neutral axis (EC), and plastic neutral axis (PC). The first interior girders are the closest to non-composite with neutral axis locations in the upper half of the web, but in all other girders, the neutral axis location is near the bottom of the top flange. The lack of shear studs in the negative moment region did not create non-composite behavior in this region. Rather, the reinforced concrete deck stiffness in tension and bond to girders was adequate to exhibit essentially composite behavior. Both regions show an average neutral axis location between the theoretical elastic and plastic neutral axes. Comparing this data between the full and empty trucks (approximately twice the total loading) shows linear behavior, and similar neutral axis trends.
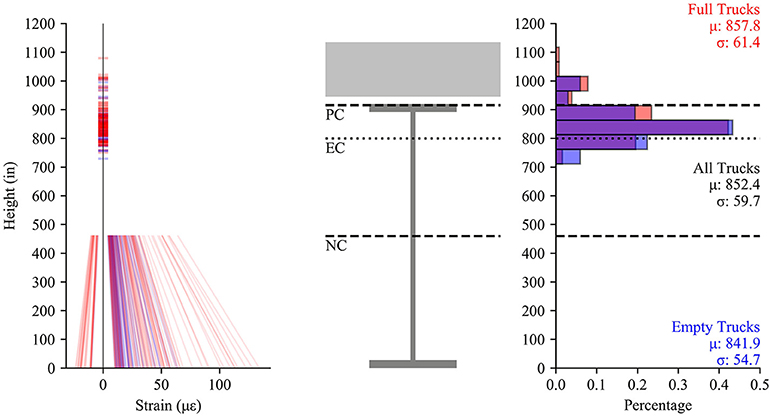
Figure 18. Measured strains vs. height (left), schematic of girder (center), histogram of neutral axis locations (right) for the positive moment section.
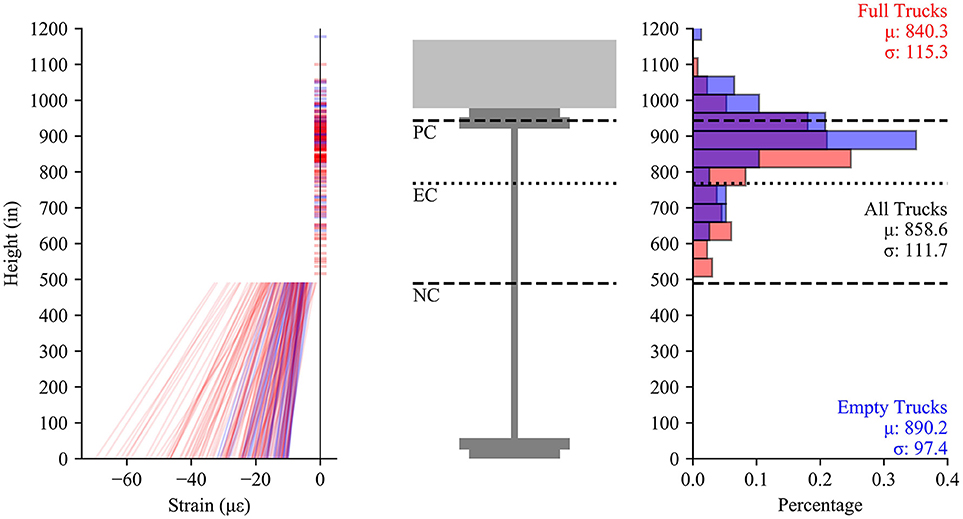
Figure 19. Measured strains vs. height (left), schematic of girder (center), histogram of neutral axis locations (right) for the negative moment section.
Conclusions
The level of composite action between the steel girders and deck slab can have a significant impact on the assessment of vertical load capacity. Truck load testing has been utilized to field identify composite action (or lack thereof) for bridges with capacity concerns. The literature and three case studies performed as part of this research have shown varying degrees of success for reliably identifying the composite nature of girder bridges. Even simple structures, such as Case Study I, show appreciable variability in the results.
Variability in field identified composite action results comes from a wide range of parameters. These include environmental conditions, material properties, geometry and the test setup itself. Reducing uncertainty due to environmental conditions is typically mitigated through relatively short test durations. Material property uncertainties can be addressed with specimen testing (e.g., concrete cylinder tests) or non-destructive evaluation techniques. The desired accuracy and resources of the project will dictate if this should be performed. Uncertainties associated with the geometry and the test setup itself can be dealt with through carefully designed field measurement strategies. General recommendations are provided below as a result of a substantial literature review and the three case studies performed.
Recommendations
These recommendations are intended to provide a strategy for field identification of composite action using truck load testing. Recommendations are provided for local measurement of the girders, global measurement across the structure, truck loading, and data processing. These recommendations are intended to be comprehensive and minimize uncertainties to a significant extent, while maintaining a realistic instrumentation plan. The authors realize resources, access, etc. vary per project and all components described below may not be addressed (similar to the case studies). However, it is beneficial to understand the capabilities of different test setups for planning and future data interpretation.
Local Measurement
The girder cross-sections instrumented should address the potential for out-of-plane bending and signal-to-noise levels. Out-of-plane bending is more prevalent in curved and skewed structures; however, it may not be negligible for girders with slender elements. Therefore, it is recommended to place sensors on opposite sides of the flange and web (Figure 20). This allows future averaging of the data. Note that if resources are limited the bottom flange can be instrumented at the center of the bottom. The setup utilized for Case Study II is not recommended because it was susceptible to issues with out-of-plane bending.
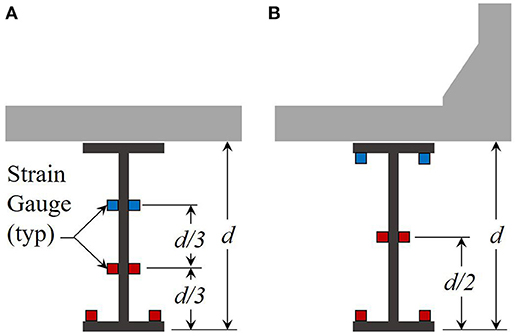
Figure 20. Recommended strain gauge locations to identify the neutral axis for (A) interior steel girders and (B) exterior steel girders with symmetric cross-sections.
Measurement signal-to-noise ratios can be an issue if sensors are placed near the neutral axis. The design of an instrumentation system should consider both composite and non-composite behaviors as a possibility, therefore measuring strain in the upper half of the web or on the bottom of the top flange (for interior girders) can inadvertently locate a gauge near the neutral axis producing very little response. This makes it difficult to confirm the gauge functionality. The minimal response also introduces more error in the projection of the strain profile to identify the neutral axis.
For example, it is recommended for a steel interior girder with a symmetric section to implement strain gauges on both sides of the top surface of the bottom flange along with a pair of gauges on the web at approximately 1/3 the girder depth (d) from the bottom flange. Figure 20A illustrates this setup with the sensors shown in red. Ideally, another gauge pair would be placed at 2/3 the web depth if resources allow (Figure 20A blue sensors). For the exterior girder, it is recommended to move the web gauges up the height of the web due to the presence of a barrier (Figure 20B red sensors). Even minimal composite action will move the neutral axis high on the section so signal-to-noise should be adequate at that location. This should allow for better linear interpolation and identification of the neutral axis, minimizing the effects of sensor noise. Again, a second pair of gauges may be placed on the web if resources allow (Figure 20B blue sensors).
Note that if the girders are not symmetric due to different flange sizes, then the web gauges should be adjusted accordingly to avoid potential neutral axis locations.
Global Measurement
Spatial location of the instrumented girder cross-sections is a critical aspect of the load test. It is recommended to provide locations that have sufficient response (e.g., mid-span of a simple span structure). The literature shows that this is commonly applied with the exception of tests that had access restrictions. The spatial resolution of the testing is also important and widely varies among studies. It is recommended to instrument at least two different girders and to provide measurements at a minimum of two different bridge cross-sections for identification of composite action. Following the local measurement recommendation provide above, that would equate to a minimum of 16 strain gauges. This is very realistic to incorporate into a load test.
The girders can be subjected to axial forces from live loading in cases where the bearings are restrained. The eccentricity of the support conditions can induce axial forces from vertical loading. In these cases, it is recommended to consider placement of another strain gauge setup near the end of the girder to minimize flexure. This should allow for measurement of the axial contribution (Barker, 2001). Another option to identify the bearing stiffness is to leave the setup but include thermistors to measure the temperature changes. Then record measurements throughout several days and compare the thermal input with the strain responses (Yarnold and Dubbs, 2015). Mechanical strain measurements will indicate the magnitude of boundary condition restraint.
Truck Loading
For a controlled truck load testing (diagnostic or proof) it is recommended to vary the truck magnitudes and positions. There is variability in the data and it is best to have statistically sufficient data for future processing. The final truck weight should be well above service load levels. As stated earlier, the reliability of the composite action results are up to the magnitude of test truck. It is recommended to utilize the heaviest truck that can safely be justified for the test.
If controlled truck load testing is not possible, then ambient data can be utilized as illustrated in Case Study I. The results are more limiting in that the magnitude of vehicles crossing the structure are not controlled. In addition, the vehicle weight is not known for each recorded truck event. However, estimates can be back-calculated. Another option worth considering in this situation is to orchestrate a heavy vehicle to make passes across the structure with the bridge operational. This will supplement the ambient data and ensure several truck events with sufficient response.
Data Processing
Once strain data is acquired, care should be taken in data processing to ensure accuracy in the analysis. Depending on the location of loading and the location of instrumentation, there may be test data with very low magnitude responses, as in the case studies above. Data points of less than a specific threshold strain in the bottom flange are not used because poor signal quality can introduce errors in locating the neutral axis. It is also recommended to choose a consistent axis system between all instrumented locations that is maintained through changes in cross section configuration. Selecting the bottom of web as a reference location avoids the need to adjust the height of gauges relative to different bottom flange thicknesses. This is another benefit to instrumenting on the top of the bottom flange. Lastly, care should be taken in computing cross section parameters such as reference neutral axis locations and section strengths, especially when the cross section configuration is non-standard. For example, when the top flange is embedded in the deck, this is essentially a negative haunch which may invalidate some of the standardized equations.
Author Contributions
All authors have contributed to the contents within this paper. The lead for Case Study I, II, and III was MY, JW, and TG, respectively. The literature review was mostly performed by MY. Statistical analysis and figure development was primarily conducted by TG. All the authors developed the overall challenges, conclusions, and recommendations.
Funding
Case Study I was an internally funded study by the first author. Case Study II was supported by the United State Federal Highway Administration (FHWA). Case Study III was funded by the Maryland Department of Transportation (MDTA). The open access publishing fees for this paper have been covered by the Texas A&M University Open Access to Knowledge Fund (OAKFund), supported by the University Libraries and the Office of the Vice President for Research.
Conflict of Interest Statement
The authors declare that the research was conducted in the absence of any commercial or financial relationships that could be construed as a potential conflict of interest.
References
Bakht, B., and Jaeger, L. (1992). Ultimate load test of slab-on-girder bridge. J. Struct. Eng. 118, 1608–1624. doi: 10.1061/(ASCE)0733-9445(1992)118:6(1608)
Barker, M. G. (2001). Quantifying field-test behavior for rating steel girder bridges. J. Bridge Eng. 6, 254–261. doi: 10.1061/(ASCE)1084-0702(2001)6:4(254)
Barker, M. G., Imhoff, C. M., McDaniel, W. T., and Frederick, T. L. (1999). “Field Testing and Load Rating Procedures for Steel Girder Bridges,” in RDT99-004. (MoDOT).
Breña, S., Jeffrey, A., and Civjan, S. (2013). Evaluation of a noncomposite steel girder bridge through live-load field testing. J. Bridge Eng. 18, 690–699. doi: 10.1061/(ASCE)BE.1943-5592.0000398
Burdette, E. G., and Goodpasture, D. W. (1988). NCHRP Report 306: Correlation of Bridge Load Capacity Estimates with Test Data. Washington, DC: Transportation Research Board.
Chajes, M., Mertz, D., and Commander, B. (1997). Experimental load rating of a posted bridge. J. Bridge Eng. 2, 1–10. doi: 10.1061/(ASCE)1084-0702(1997)2:1(1)
James, E. D., and Yarnold, M. T. (2017). Rapid evaluation of a steel girder bridge: case study. J. Bridge Eng. 22:05017013. doi: 10.1061/(ASCE)BE.1943-5592.0001151
Jauregui, D. V., Yura, J. A., Frank, K. H., Wood, S. L., and Jirsa, J. (2000). “Measurement-Based Evaluation ofNoncomposite Steel Girder Bridges,” in FHW A/TX-0-1746-1.
Lichtenstein, A. G. (1993). NCHRP 12-28(13)A: Bridge Rating Through Nondestructive Load Testing. Washington, DC: Transportation Research Board.
Sigurdardottir, D. H., and Glisic, B. (2013). Neutral axis as damage sensitive feature. Smart Mater. Struct. 22:075030. doi: 10.1088/0964-1726/22/7/075030
Keywords: load testing, composite action, bridges, capacity, neutral axis
Citation: Yarnold M, Golecki T and Weidner J (2018) Identification of Composite Action Through Truck Load Testing. Front. Built Environ. 4:74. doi: 10.3389/fbuil.2018.00074
Received: 01 October 2018; Accepted: 21 November 2018;
Published: 07 December 2018.
Edited by:
Eva Lantsoght, Universidad San Francisco de Quito, EcuadorReviewed by:
Michael Chajes, University of Delaware, United StatesOsman Eser Ozbulut, University of Virginia, United States
Copyright © 2018 Yarnold, Golecki and Weidner. This is an open-access article distributed under the terms of the Creative Commons Attribution License (CC BY). The use, distribution or reproduction in other forums is permitted, provided the original author(s) and the copyright owner(s) are credited and that the original publication in this journal is cited, in accordance with accepted academic practice. No use, distribution or reproduction is permitted which does not comply with these terms.
*Correspondence: Matthew Yarnold, bXlhcm5vbGRAdGFtdS5lZHU=