 Aleksandra Bogdanovic*
 Zoran Rakicevic
- Institute of Earthquake Engineering and Engineering Seismology, IZIIS, Skopje, Macedonia
Passive control of structures represents practical concept and qualitative change of the design and construction of new seismically resistant structures and strengthening of existing ones. The best distribution obtained by the minimization or maximization of the defined structural responses is achieved by optimal placement of the different types of control devices in structures. In this paper the procedure for optimal placement of viscous damping devices (PDD–Prestressed Damping Device-PDD) (space distributed) in structures for controlling their response due to seismic excitation, will be presented. For the purpose of determination of the PDDs' optimal location, 3D five story steel frame structure has been designed following Eurocode 3 and Eurocode 8 requirements. Nine, previously defined, initial configurations have been used as a starting point in the process of optimization. The desired performance has been defined using the fitness function derived from the inter-story drift and energy dissipated by the PDDs vs. input energy in the structure in two directions x and y. The value of the fitness function has been used to rank and quantify the optimum of the particular solution among all other solutions in the optimization process. Numerous nonlinear analyses have been conducted and a lot of analytical results have been collected in order to confirm the validity and the application of the presented procedure including the fitness function in any steel structure.
Introduction
For the last 20 years, intensive research in the field of structural control, carried out in highly developed countries, has resulted in a large number of different technological solutions and many of them have already been applied to numerous structures, high-rise buildings, large span bridges, towers, etc. Development of new materials, computer science, and sensors enables fast development of this scientific discipline, which philosophy is based on the requirement to provide systems' stability at any time and under any dynamic excitation. The placement of dampers is a critical design concern, as the distribution of damping may greatly affect a building's dynamic response and the necessary damping cost. Gluck et al. (1996), optimized performance cost function for selection of the most suitable configuration of viscous elastic dampers. They used linear design for determination of the constant coefficients for dampers for the first mode of the structure, that is dominant for the high rise buildings. Wu et al. (1997) investigated the optimal damper placement for torsional dependent structures in order to get minimal rotations and translations. They used the transfer function method of matrix to obtain the target function and concluded that a very large amount of damping does not always produce better results in the behavior of the structure. Optimal damper placement in this case corresponded to the places where the maximal displacements appeared. Gurgoze and Muller (1992) presented numerical method for optimal location and optimal damping coefficient for viscous damper in multi degree of freedom systems. Zhang and Soong (1992) proposed a procedure for finding the optimal location of viscoelastic dampers in symmetrical buildings assuming that the damper is optimally positioned in a place where the relative displacement of the structure is maximal. They determined that with optimal damper placement, modification in the response of the structure and depending seismic excitation, is achieved. Hahn and Sathiavageeswaran (1992) made several studies on the effects of the dampers' distribution when the structures are exposed to earthquake and found that buildings with uniform floors stiffness should have dampers installed on the lower halves of the lower floors. Takewaki (1997) presented an optimal placement technique for dampers, with the objective of minimizing the sum of the amplitudes of the transfer functions of the interstory drifts, assessed at the structures undamped fundamental frequency. Optimal location of dampers corresponds to the places with the maximal interstory drifts. De Silva (1981) presented a sequential algorithm for optimal damper design for flexible structures. Inaudi and Kelly (1993) proposed procedure for obtaining the optimal damping in order to obtain a minimal response in terms of acceleration of base isolated structures under the action of a random excitation. Tsuji and Nakamura (1996) proposed an algorithm for finding the optimal distribution of floor stiffness and the optimal location of the dampers in shear buildings under the excitations of spectral compatible earthquakes. Singh and Moreschi (2002) used a genetic algorithm to obtain the optimal damper placement in linear systems. They used the classic viscous dampers and viscous elastic dampers for energy dissipation. As fitness function was used, root mean squares of interstory drifts were restricted to minimize the difference between the sum of damping coefficients of added dampers and the total value of the damping distributed in the structure. Main and Krenk (2005) developed approximative solution for complex eigenvalue problem resulted from the free vibration of structures with added damping. The approximative solution for frequencies is obtained by interpolation between the results of two limiting real problems of eigenvalue values. With these results best location for dampers using mode shapes for undamped structure in order to get the maximum relative displacement between the two ends of the viscous dumper, was obtained. Fujita et al. (2010) proposed a method for optimal damper placement and supporting elements for the structures exposed to earthquake excitation. As optimization parameter the sum of the mean root squares of interstory drifts was used. Optimization technique is based on the Lagrange's method of multiplication, with two limitation conditions aiming to minimize the maximum response of the structure. Shukla and Datta (1999) determined the optimal location of the viscoelastic dampers using the control index, defined as a measure of response of the structure under earthquake excitation. The root mean square of interstory drifts was used as a performance index. Yousefzadeh et al. (2011) used a genetic algorithm to determine the features and optimal location of TADAS dampers in structures. For determining the optimal position of the dampers index of vulnerability for each element and an average index of vulnerability for all elements in a frame, are used.
Kokil and Shrikhande (2007) based on their research done on the 10 story structure realized that added damping in symmetric structures is more effective than in the structures with irregularities–asymmetrical structure. Installed dampers gives the best results when they are installed on the lower and upper floors at symmetrical structures. While for asymmetrical and flexible structures middle floors are places where the most optimal location of the dampers is achieved. In Movaffaghi and Friberg (2006) optimization process used the genetic algorithm for 3D steel structure, obtaining optimal position of the dampers as well as their number. The procedure included reduction in fitness function defined as the maximum value of the vector sum of the three translational acceleration in the second floor of the structure. Singh and Moreschi (2002) used a genetic algorithm to find the optimal size and location of the dissipation devices that were considered as frequency-dependent and independent viscous and viscous elastic dampers in the structure. They proposed a procedure based on the base shear force to find optimal damper distribution using the transfer functions. For planar building frames Aydin et al. (2007), also proposed the procedure based on the base shear force for optimal damper distribution using transfer function. A generalized objective function that combines displacements, accelerations and the base shear transfer function is used for optimal damper placement in the procedure proposed by Cimellaro (2007). For minimizing the transfer function of the sum of interstory drifts, Fujita et al. (2010) proposed the procedure for optimal damper placement and their supporting members, while Wang et al. (2010) used penalty function and first order theory in long suspension bridges. A new objective function for finding optimal size and location of the added viscous dampers was proposed based on the elastic base moment in planar steel building frames by Aydin (2013). A new dynamic procedure that requires reasonably reduced computational effort, called the endurance time (ET) method, was applied to the problem of optimal damper placement in steel moment frames by Homayoon and Mohammad (2011). Lavan and Levy, (2009), Levy and Lavan (2006), studied optimal design problem of added damping in frame structures. They defined the performance functions for both linear and nonlinear cases and used the added damping of pre-located dampers and mean squared inter-story drifts as objective functions. A practical optimal design method was formulated by Adachi et al. (2013) to minimize the maximum interstory drift or maximum top story acceleration under design earthquakes for non-linear oil dampers. Systematic procedure for optimal placement and characteristics of different linear velocity-dependent dampers according to modal damping ratios was developed by Mousavi and Ghorbani-Tanha (2012). Optimal location and sizes of the added dampers based on the meta-heuristic algorithms was also developed and proposed by group of researchers (Amini and Ghaderi, 2013; Sonmez et al., 2013).
For finding the optimal damper placement, an optimization technique must be employed using different structural responses. A very complex research have been realized in the Institute of earthquake engineering and engineering seismology in Skopje, R. Macedonia. The first part involved experimental testing of a 3D five story steel frame structure without and with prestressed damping devices (PDD)–manufactured by GERB Schwingungsisolierungen GmbH & Co. KG Company (Germany). Rakicevic et al. (2010), Basu et al. (2014), and Bogdanovic et al. (2014). The second part included a complex analytical investigation for verification of the analytical model of the structure and the damper, as a base for the last phase of this research: definition and application of the fitness function, proposed by the author, for optimal damper placement.
Analyzing the procedures that have so far been carried out regarding optimal position of dampers in structures, it has been realized that most of these are for 2D frame structures including one optimization parameter. Hence, the author was motivated to find out the optimal position of space distributed dampers in 3D frame structures using combined fitness function with two parameters. In this paper optimization procedure, development of optimal solutions, and obtained results are presented and explained in details.
Performed Experimental Testing
The structure was tested on the shake table at IZIIS' Dynamic Testing Laboratory, by simulation of real earthquake time histories with different intensities for two cases as follows:
• Model without PDD–MODEL01 (Figure 1)
• Model with PDDs having different position in the frame structure: MODEL02, MODEL03, MODEL04, and MODEL05, as shown in Figure 2, respectively.
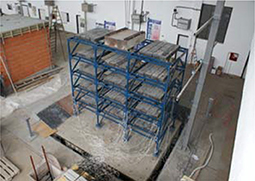
Figure 1. Tested structure without dampers—MODEL01.
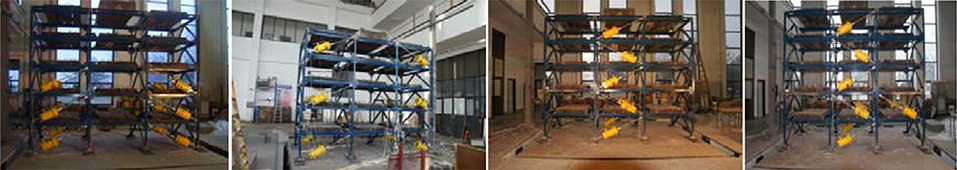
Figure 2. Tested structure with different positions of dampers-MODEL02-MODEL05.
The inherent viscous damping in first mode of vibration for the MODEL 01–without PDDs is found to be within the range of 0.65–0.85%. For the MODEL 02 to MODEL 05 the viscous damping in the first mode was within the range of 4.5–6.5%.
For the needs of further stage of this research it was necessary to have good analytical model for PDD. Comparisons for the damper displacements obtained experimentally and analytically were done (Figure 3). It can be seen that there is a good correlation between the experimental and the analytical results, which verifies the developed analytical model of the PDD as suitable for further use in the process of optimization. Another confirmation was obtained using the cross correlation coefficient with the value within range of 0.83–0.9 (Figure 4).
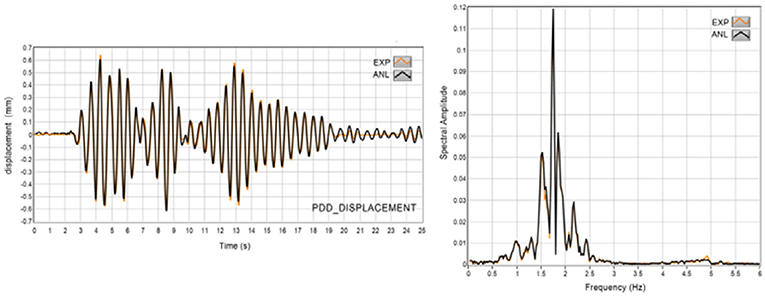
Figure 3. Comparison between analytical and experimental response histories PDD displacement.
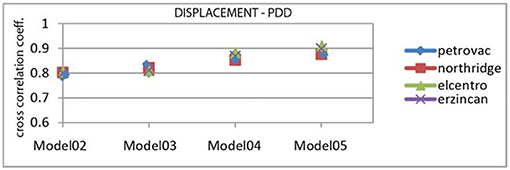
Figure 4. Cross correlation coefficient of PDD displacement for MODEL02 -MODEL05.
It must be noted that the experimental testing of the structure with and without PDDs was very important and gave valuable results and confirmations in the process of verification and definition of the analytical model for damper which was further used in the process of optimization.
Modeling of the New Real Structure
A new real structure was designed according to Eurocode 3 and Eurocode 8 requirements. The response spectrum for PGA = 0.28 g in X and Y direction for 2% of damping, type of soil B and behavior factor q = 4 was used. The frame structure was modeled as 3D frame structure with 6 degrees of freedom at each node using frame elements in ANSYS12.1 software (Figure 5).
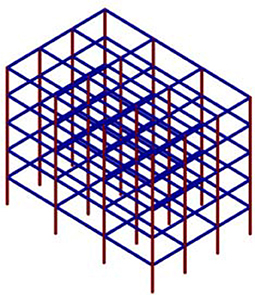
Figure 5. Analytical model of 3D structure used in the optimization process.
The analytical modeling of PDDs has been done by using the combin14 element (Figure 6). The element works based on the Kelvin Vought model and was defined by two nodes, a spring constant (K) and damping coefficient Cv.
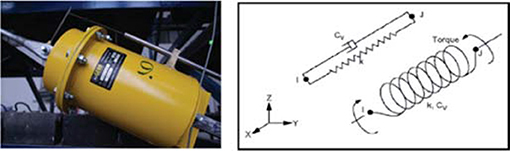
Figure 6. Prototype and analytical model of the damper device (PDD).
The damping force (F) is computed with the equation given below:
Preload in the spring as a compression was specified through an initial force in the combin14 element. In the process of optimization of the PDDs, the following characteristics have been used: stiffness of the spring K = 5,000 kN/m, Cv = 2,000 kNs/m and prestressing force F = 150 kN. The PDD had a mass of 180 kg, which was added using the appropriate mass element mass21. Damper characteristics were taken in accordance with the manufacturer and were based on the previous analytical and experimental analysis realized in IZIIS [ Rakicevic et al. (2009) and Bogdanovic et al. (2010)].
Optimization Process
The process of optimization starts with previously defined, nine initial configurations of damper placement, in X and Y direction on the external frames presented in Table 1.
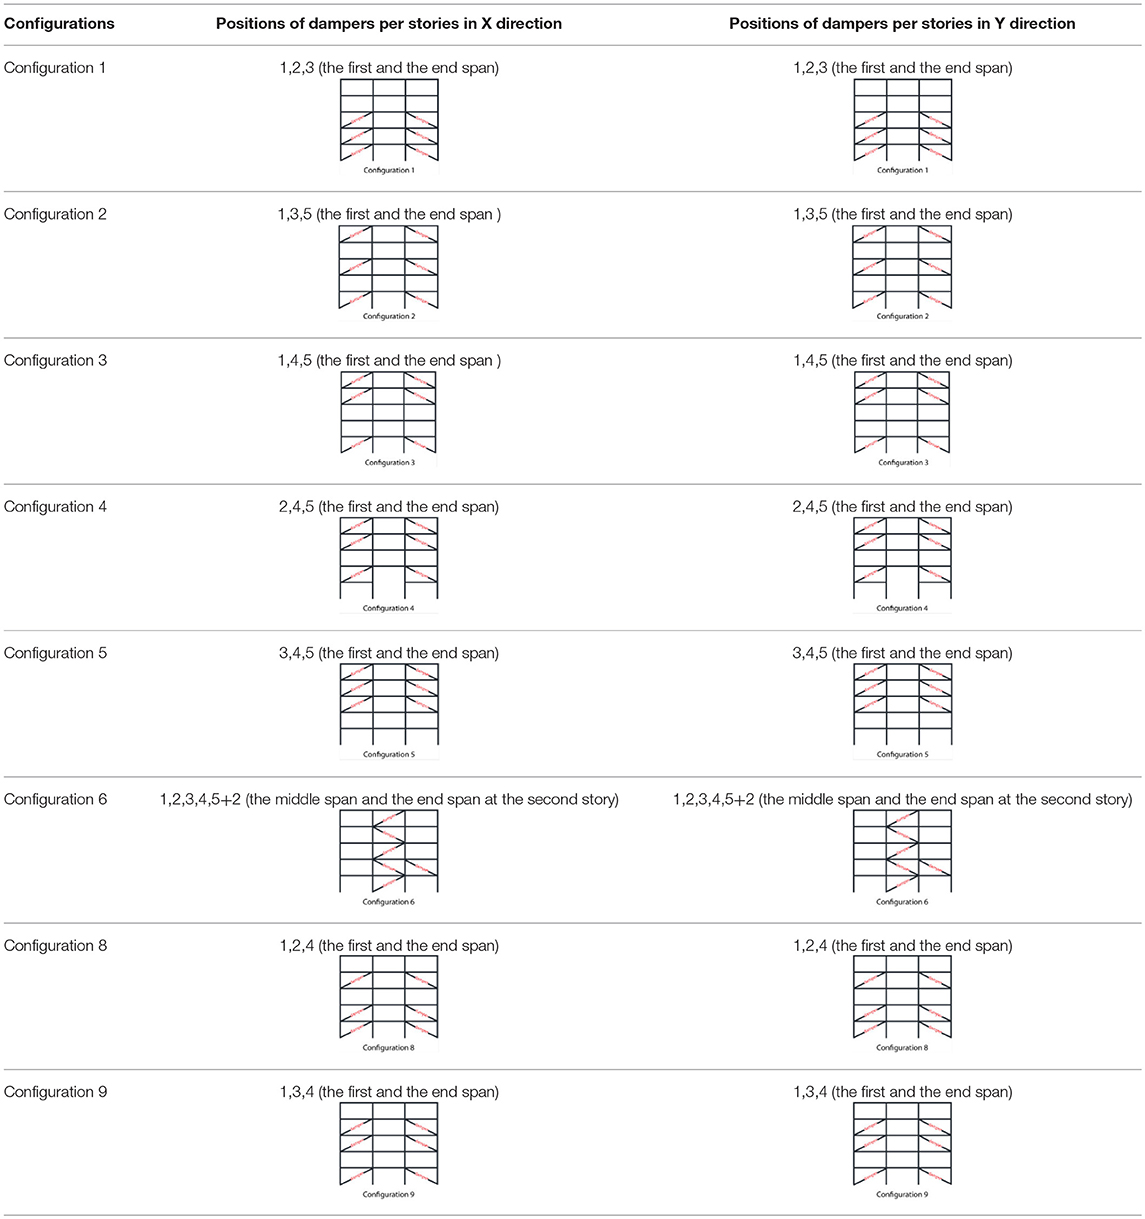
Table 1. Initial configurations of dampers.
Genetic algorithm was used only as a tool in the procedure, using the fitness function proposed by the author as sum of two quantities, namely, interstory drift and energy coefficient for the two directions (X and Y), respectively.
where,
Pi(x), Pi(y) are performance indexes in x and y direction, respectively;
driftx, drifty are the maximum interstory drifts in the structure in x and y direction, respectively;
Edam(x) = ∫ Fxdx, Edam(y) = ∫ Fydy is the total energy dissipated by the damper in x and y direction, respectively.
, is the input energy in x and y direction, respectively.
The value of driftx, drifty ≤ 3.5 cm is taken as a condition for limitation of the inter story drift, in accordance with the formula from Eurocode 8, referring to an inter story height of h = 3 m.
The limitation of the interstory drift is considered to correspond to a structure in the linear range of behavior, whereat in the case of occurrence of plastic hinges, they should occur first in the beams, while the structure should remain functional.
As far as the energy coefficient is concerned, the maximum dissipation energy of the dampers is taken to be 70% of the total input energy in the structure, where remaining 30% are to be absorbed by the structure itself. From the analyses, it has been defined that the value and the participation of this coefficient in the entire fitness function is lower in respect to the participation of the interstory drift, but has a considerable effect upon definition of the value of the entire performance index Pi(x), Pi(y) and hence on the optimal position of the PDD dampers in the structure.
From such established limitation conditions, the maximum value of Pi(x), Pi(y) amounts to 4.2, i.e.,
which would be obtained in the case when the maximum interstory drift reaches the value of 3.5 while the energy coefficient (EcoefX, EcoefY) has a value of 0.7.
The optimal solution is obtained when Pi(x), Pi(y) ≤ 4.2, while at the same time, driftx, drifty ≤ 3.5.
Generation of Optimal Solutions
The tables below summarize the ranked position of parental configurations of damper placement in both directions (for the third generation solutions) according to the value of the fitness function defined in terms of the ideal value of 3.5 obtained when the energy ratio would have a zero value. Configurations ranking is done according to the fitness function Pi (x), Pi (y), driftx, drifty, and energy ratio EcoefX, EcoefY for X and Y directions given in Table 2.
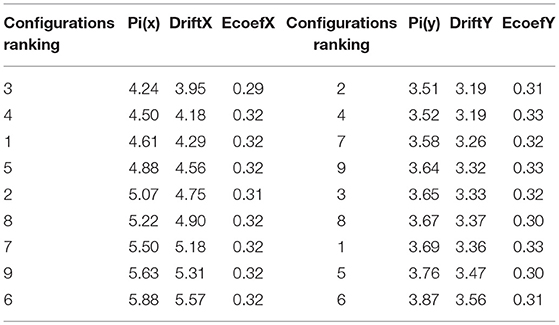
Table 2. Configurations ranking–X and Y direction.
For both directions, the first place has the configuration which has the smallest values from the remaining ones presented in Table 2. Configuration 3 for x direction and configuration 2 for y direction have values of the performance index (Pi) of 4.24 and 3.51, respectively and, compared with the other configurations below, have the smallest value and the first position in the table.
The fitness function deviation from the limitation value of 3.5 used to determine the presence of the parent in the next generation is given in Table 3 for both directions.
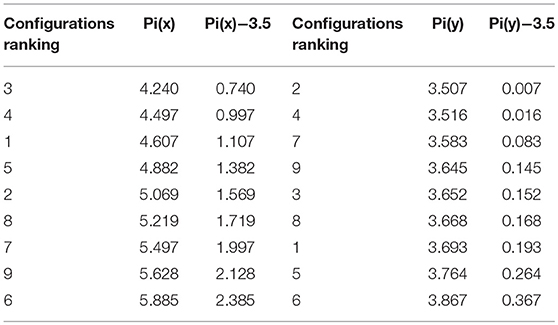
Table 3. Values for the fourth generation-chromosomes in X and Y direction.
The amount of multiplied reciprocal values of the parent presence in the next generations for X and Y direction is given below.
In order to create a system where chromosomes with more favorable values would be likely selected as a parents, the first that must be done is to calculate the percentage of each selected chromosome. One way is to choose the amount of suitable multiplied reciprocal values (Equations 7, 8) and also to calculate the participation percentage in the solution given in Table 4.
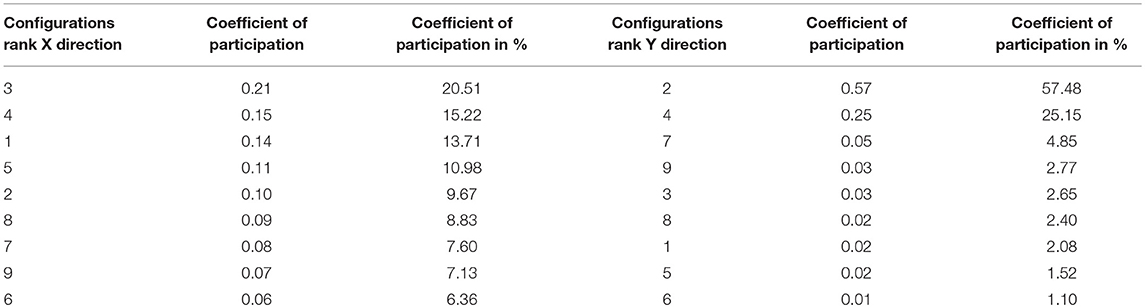
Table 4. Parental choosing in X and Y direction.
Namely, the third configuration would be present in 21% of the new configurations, the fourth configuration–in 15 % of the new configurations, configuration one in 13% of the new configurations, fifth configuration in 10%, and so on. The total sum is 100% and the same holds for the Y direction (Table 4).
Using the procedure explained previously in the Table 5 are given parents for X and Y direction.
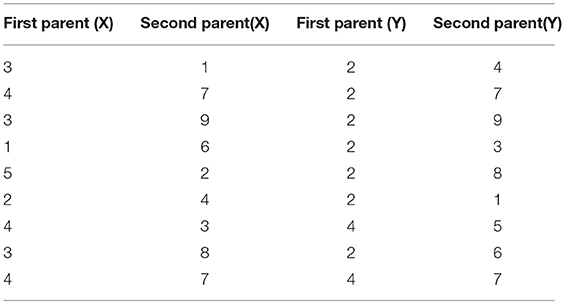
Table 5. Parents in X and Y direction.
Once all parental positions are filled, dampers that are common to both configurations are transferred to the new configuration and half of the remaining ones are taken from the first parent and half from the second using “cross-over” method given in Table 6. Dampers that are common for both configurations are marked with red color. Blue and green marked dampers are different between two given configurations. As a result of using the cross-over method, the new configuration 1 from the fourth generation solutions in x direction is obtained and given in Table 7.
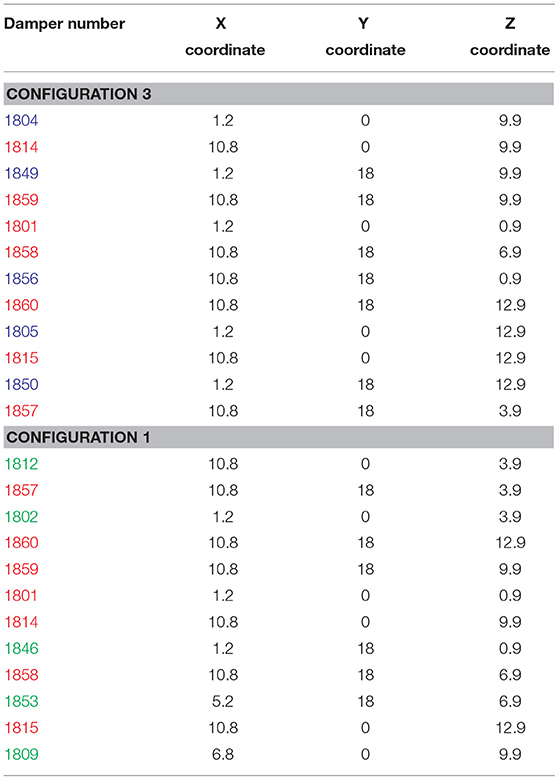
Table 6. Third generation dampers in X and Y direction-third configuration.
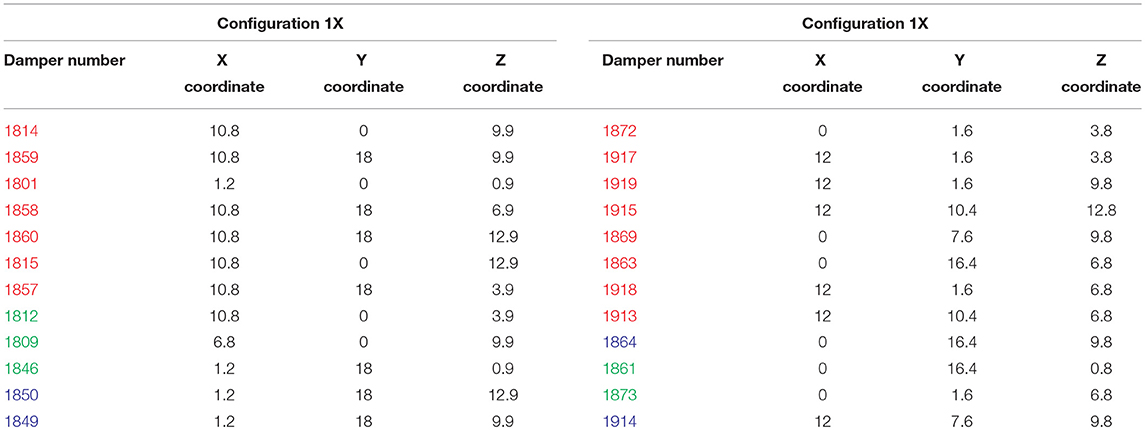
Table 7. New configuration 1 in X and Y direction (fourth generation solutions).
In the new configuration 1, dampers with red color are the same for both configurations while the blue marked dampers are half from configuration 3 and the green ones are half from configuration 1. The same procedure is used to obtain the new configuration 1 in y direction also given in Table 7.
Schematic presentation of a new configuration in X and Y direction is given on on Figures 7A,B.
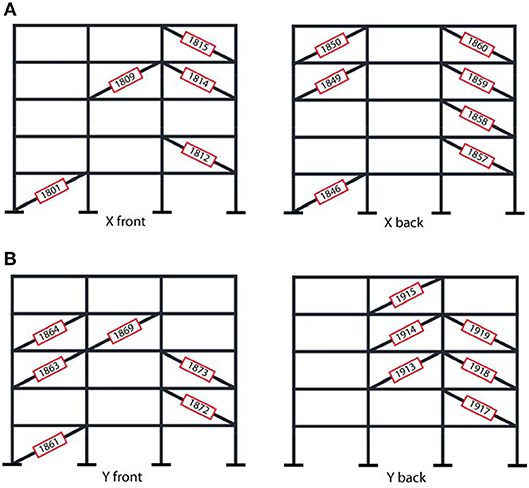
Figure 7. (A) Schematic presentation of the new configuration 1 in X direction. (B) Schematic presentation of the new configuration 1 in Y direction.
The final 3D model for the new configuration 1 from the fourth generation solutions consisting from configuration 1 in X direction and configuration 1 in Y direction is presented on Figure 8.
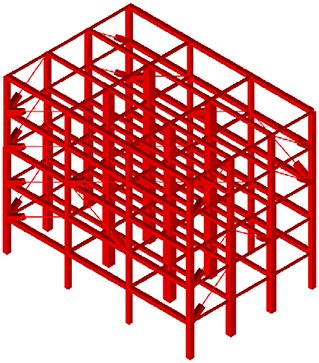
Figure 8. New Configuration 1—the fourth generation solutions 3D ANSYS model.
Obtained in the same way are the remaining eight configurations in the fourth generation of solutions that become potential parents for generating the next fifth generation of solutions.
Table 8 shows new nine configurations for the fourth generation of solutions and for every configuration the two limitation conditions explained before, are checked. Only for configuration 3 Pi(x), Pi(y) and driftx, drifty are satisfied at the same time and combination 3 is one of the solutions for optimal damper placement called optimal solution. For this configuration, the energy dissipated by the dampers is 44%.
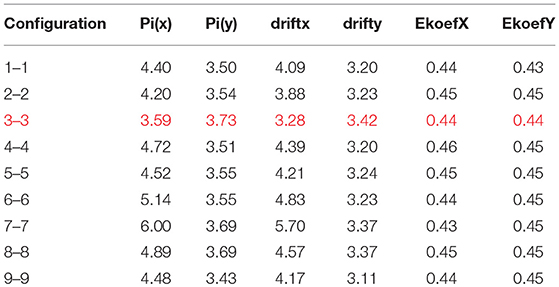
Table 8. Configuration solutions for the fourth generation.
It must be mentioned that this process has been repeated for nine generations of solutions with nine configurations obtained from 86493225 combinations of possible damper placement where only thirty configurations satisfied the limitation conditions and they are called solutions for optimal damper placement.
Results
In this paper, a part of the obtained results and observed structural behavior will be presented. Comparisons will be given for all thirty optimal solutions in terms of story accelerations and interstory drifts vs. structure without dampers–moment resisting frame (MRF).
Figure 9 shows the comparison of envelope values for acceleration in X direction and Y direction along the height of the structure. As it can be seen, the accelerations in X direction and Y direction are smaller than the accelerations of the structure without dampers—MRF.
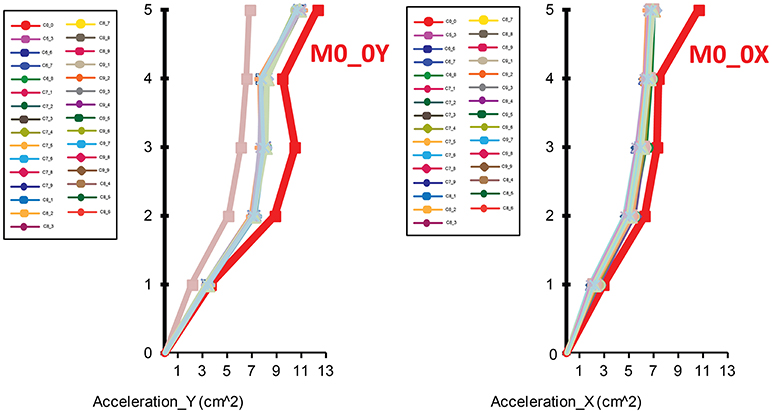
Figure 9. Acceleration in X and Y direction for all thirty optimal solutions compared with a structure without dampers (M0_0X; M0_0Y).
Due to the large number of optimal solutions (thirty) and for the purpose of simplification of the diagram, the reduction of the structural response expressed in percentage has been divided into a number of diagrams.
From the presented diagrams on Figures 10, 11, it is clear that, under this level of excitation, there is a considerable reduction of extreme values of accelerations per all the stories compared with the structure without dampers M0_0. The maximum reduction of accelerations in X direction is achieved for the optimal solution C7_1 and it amounts to 38% for the fifth story, while minimal reduction of 8% is achieved for the fourth story for C6_8.
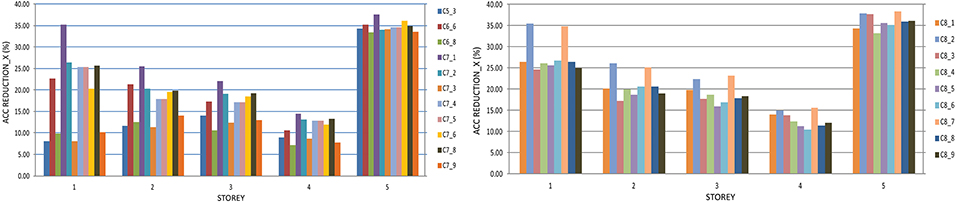
Figure 10. Reduction of accelerations per stories of the structure with the optimal solutions from the fifth, sixth, seventh and eighth cycle compared with the structure without dampers in X direction.
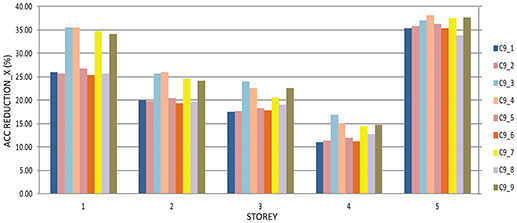
Figure 11. Reduction of the accelerations per stories of the structure with the optimal solutions from the ninth cycle compared with the structure without dampers in X direction.
The same as in X direction, there is a minimal percentage of reduction in the case of the first story for the optimal solution C7_6 amounting to 5%, while maximum reduction of 29% is achieved at the third story for C8_5 for the Y direction (Figures 12, 13, respectively).
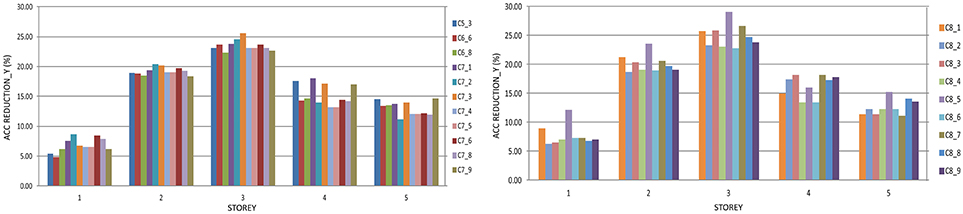
Figure 12. Reduction of accelerations per stories of the structure with the optimal solutions from the fifth, sixth, seventh and eighth cycle compared with the structure without dampers in Y direction.
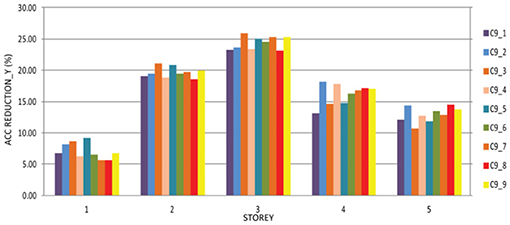
Figure 13. Reduction of the accelerations per story of the structure with the optimal solutions from the ninth cycle compared with the structure without dampers in Y direction.
The envelope values for the interstory drifts in X and Y direction compared with the structure without dampers are presented in Figure 14. In both directions, the inter-story drifts for the structure with the optimal damper placement are smaller compared with the inter-story drifts obtained for the moment resisting frame and are also within the limits defined with EC8 as the previously mentioned limitation factor.
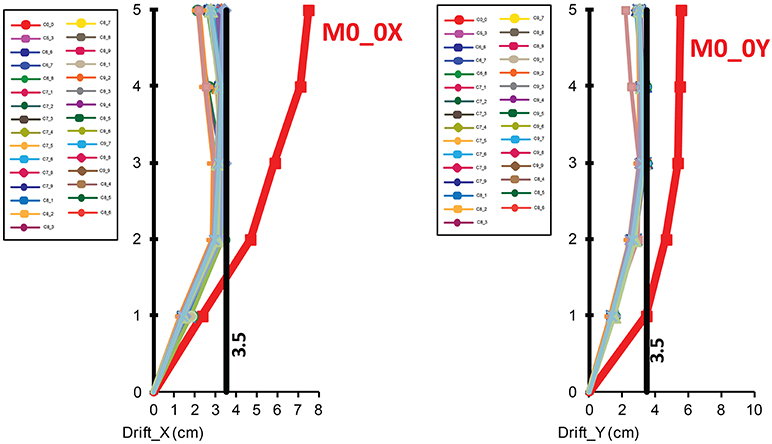
Figure 14. Drift in X and Y direction for all thirty optimal solutions compared with the structure without dampers (M0_0X; M0_0Y).
The maximum drift reduction in X direction is obtained for configuration C9_2 and it is 73% for the fifth story and 60% for the same story in Y direction for configuration C9_4 presented in Figures 15, 16, respectively. In further text, the diagrams of reduction of the inter story drifts compared with the structure without dampers M0_0 in both X and Y direction, will be presented.
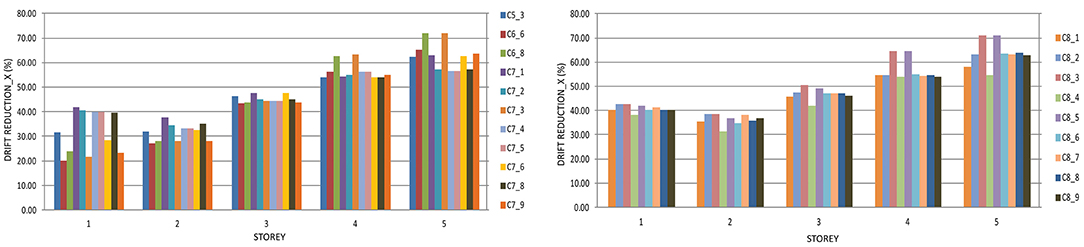
Figure 15. Reduction of inter story drifts in the case of the structure with the optimal solutions from the fifth, sixth, seventh and eighth cycle compared with the structure without dampers in X direction.
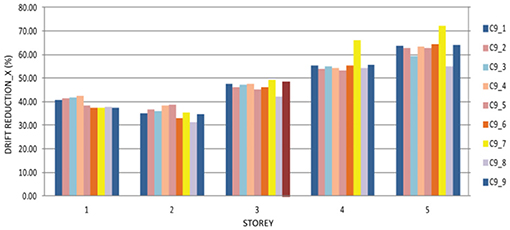
Figure 16. Reduction of the inter story drifts in the case of the structure with the optimal solutions from the ninth cycle compared with the structure without dampers in X direction.
As to the interstory drifts shown in Figures 17, 18, the least reduction is observed at the first story for the optimal solution C6_6 amounting to 20%, whereas the greatest reduction of 75% occurs in the case of the optimal solution C9_7 in X direction.
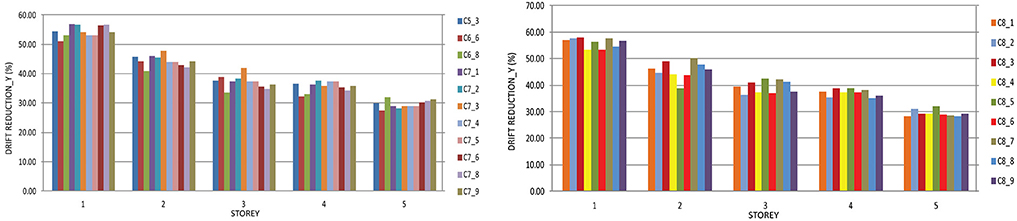
Figure 17. Reduction of the inter story drifts in the case of the structure with the optimal solutions from the fifth, sixth and seventh cycle compared with the structure without dampers in Y direction.
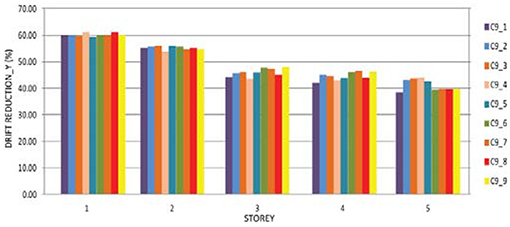
Figure 18. Reduction of the inter story drifts in the case of the structure with the optimal solutions from the ninth cycle compared with the structure without dampers in Y direction.
Figures 17, 18 show the reduction of the inter story drifts in Y direction in the case of all optimal solutions compared with the structure without dampers M0_0.
The minimal reduction is achieved in the case of the optimal solution C7_6 amounting to 28% for the fifth story, while the greatest maximal reduction of 64% is achieved for the first story in the case of the optimal solution C9_8.
Comparisons in time domain for accelerations and interstory drifts are given in Figure 19 for the structure without dampers and structure with optimal solutions where can be seen that there is a very good reduction in the responses.
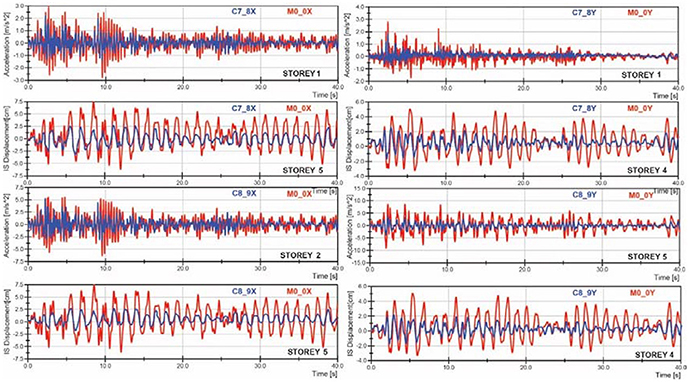
Figure 19. Comparison between the response time histories of accelerations, interstory drifts of the structure without dampers (M0_0) and the structure with the optimal solution (C7_8 and C8_9) in X and Y directions.
Structure with optimal dampers solutions will contribute toward elimination and reduction of number of plastic elements (hinges). Figure 20 shows plastic hinges for the structure without dampers and structure with optimal solution. It can be seen that for the structure with optimal solution very big number of plastic hinges are eliminated.
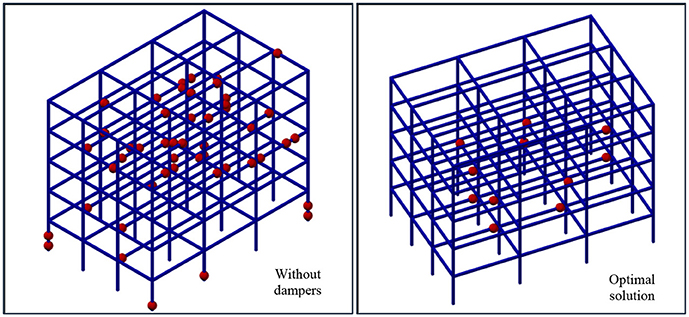
Figure 20. Occurrence of plastic hinges in the structure without dampers and the structure with the optimal solution.
Figure 21 shows the hysteretic diagrams for elements of the structures where plastic hinges occur, i.e., already formed plastic elements. The red color indicates hysteretic loops for the structure without dampers where plastification of the given element is completed. The blue color is used to indicate hysteretic loops in the same element of the structure with the optimal solution. The figure clearly shows that the placement of the dampers in a configuration referring to the optimal solution enables elimination of the plastic hinge whereat the element remains to behave in the linear range.
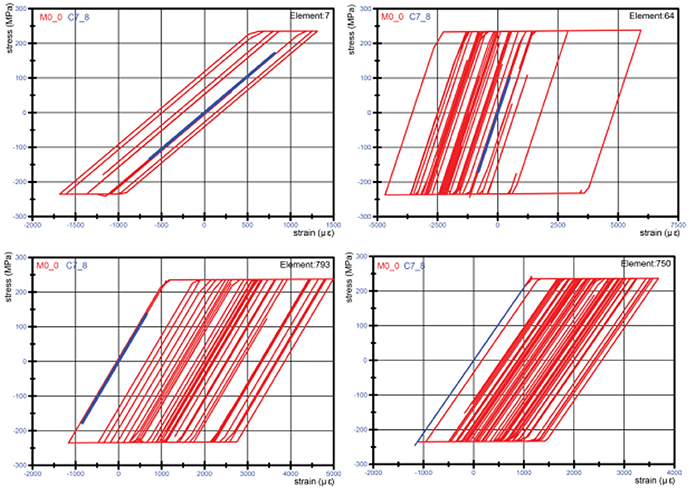
Figure 21. Stress-strain relationship of a plastic element (hinge) for the structure without dampers and the structure with optimal solution.
Conclusions
In the process of designing the seismically resistant structures, deformability of structural elements and structures as a whole, should be provided so that, after exceeding the yielding point, the structures should have sufficient ductility and capacity for dissipation of the input seismic energy in order to avoid their failure under strong earthquake effect. The installation of viscous devices for energy dissipation in the structures enables dissipation of considerable part of the energy and contributes to keeping the structure functional. A better effect is achieved if the devices are placed in an optimal position whereat their number will be reduced and their efficiency increased. The fitness function according to which the optimal position of the dampers was defined represents a sum of the maximum inter story drift and the relationship between the energies dissipated by the damper and the total input energy in the structure in both X and Y direction. The genetic algorithm was used as a tool of the optimization process and thirty optimal solutions were obtained. The procedure itself is quite complex and requires a longer computational time for obtaining the desired solutions.
Based on the performed, complex, experimental-analytical investigations and the acquired corresponding knowledge, the following conclusions can be drawn:
• In accordance with the analyses, it has been obtained that energy dissipation via dampers within the optimal solutions, ranges within the limits of 41–46%.
• The number of plastic hinges is reduced down to 80% when the optimal solutions are applied compared with the structure without dampers, i.e., pure 3D frame structure.
• The maximum reduction of accelerations in X direction amounts to 38% and refers to the fifth story, while minimal reduction occurs at the first story of the structure, amounting to 8%.
• The maximum reduction of accelerations in Y direction amounts to 29% and refers to the third story, while the minimal reduction of 5% refers to the first story.
• Drift, which has been treated as a parameter in the process of optimization is much more reduced (in percentage) in respect to the accelerations. The maximum value of reduction of the drift is achieved for the fifth story, amounting to 75%, while minimal reduction is achieved at the first story, amounting to 20%. These values refer to the X direction.
• In Y direction, maximum drift reduction is obtained for the fifth story, amounting to 64%, while minimum reduction is observed at the first story, 28%.
Based on the performed complex analysis and derivate conclusions, substantial reduction and visible effects in acceleration and drifts have been considered, leading to better performance of the structure from one side and confirmation of the proposed fitness functions for optimal damper placement from the other side.
Author Contributions
AB research analysis, previous experimental analysis, processing the results and writing the paper. ZR checking the paper, and the results.
Conflict of Interest Statement
The authors declare that the research was conducted in the absence of any commercial or financial relationships that could be construed as a potential conflict of interest.
The reviewer ZZ declared a shared affiliation, with no collaboration, with the authors to the handling editor at time of review.
References
Adachi, F., Yoshitomi, S., Tsuji, M., and Takewaki, I. (2013). Nonlinear optimal oil damper design in seismically controlled multi-story building frame. Soil Dynam. Earthq. Eng. 44, 1–13. doi: 10.1016/j.soildyn.2012.08.010
Amini, F., and Ghaderi, P. (2013). Hybridization of harmony search and ant colony optimization for optimal locating of structural dampers. Appl. Soft. Comput. 13, 2272–2280. doi: 10.1016/j.asoc.2013.02.001
Aydin, E. (2013). A simple damper optimization algorithm for both target added damping ratio and interstorey drift ratio. Earthq. Struc. 5, 83–109, doi: 10.12989/eas.2013.5.1.83
Aydin, E., Boduroglu, M. H., and Guney, D. (2007). Optimal damper distribution for seismic rehabilitation of planar building structures. Eng. Struc. 29, 176–185. doi: 10.1016/j.engstruct.2006.04.016
Basu, B., Bursi, O. S., Casciati, F., Casciati, S., Del Grosso, A. E., Domaneschi, M., et al. (2014). A european association for the control of structures joint perspective. Recent studies in civil structural control across Europe. Struc. Control Health Monitor. 21, 1414–1436. doi: 10.1002/stc.1652
Bogdanovic, A., Rakicevic, Z., and Filipovski, D. (2014). “Comparison Between two Optimization Procedures for Damper Location in Steel Frame Structures” in 15th European Conference on Earthquake Engineering, (Istanbul).
Bogdanovic, A., Rakicevic, Z., Jurukovski, D., Kammerer, H., and Nawrotzki, P. (2010). “Analytical estimation of the effectiveness of prestressed damping devices using shaking table,” in Proceedings of 14th Europian Conference on Earthquake Engineering, August 30-3 September, Ohrid, R.Macedonia
Cimellaro, G. P. (2007). Simultaneous stiffness-damping optimization of structures with respect to acceleration displacement and base shear. Eng. Struc. 29, 2853–2870. doi: 10.1016/j.engstruct.2007.01.001
De Silva, C. W. (1981). An algorithm for the optimal design of passive vibration controllers for flexible systems. J. Sound Vib. 75, 495–502. doi: 10.1016/0022-460X(81)90437-5
Fujita, K., Moustafa, A., and Takewaki, I. (2010). Optimal placement of visco-elastic dampers and supporting members under variable critical excitations. Earthq. Struc. 1, 43–67, doi: 10.12989/eas.2010.1.1.043
Gluck, N., Reinhorn, A. M., Gluck, J., and Levy, R. (1996). Design of supplemental dampers for control of structures. J. Struc. Eng. 122, 1394–1399M. C. doi: 10.1061/(ASCE)0733-9445(1996)122:12(1394)
Gurgoze, M., and Muller, P. C. (1992). Optimal positioning of dampers in multi-body systems. J. Sound Vibr. 158, 517–530. doi: 10.1016/0022-460X(92)90422-T
Hahn, G. D., and Sathiavageeswaran, K. R. (1992). Effects of added-damper distribution on the seismic response of buildings. Comp. Struc. 43, 941–950. doi: 10.1016/0045-7949(92)90308-M
Homayoon, E., and Mohammad, Ch. B. (2011). Optimal damper placement in steel frames by the Endurance Time method. Struc. Design Tall Spec. Build. 20, 612–630. doi: 10.1002/tal.689
Inaudi, J. A., and Kelly, J. M. (1993). Optimum damping in linear isolation systems. Earthq. Eng. Struc. Dyn. 22, 583–598. doi: 10.1002/eqe.4290220704
Kokil, A. S., and Shrikhande, M. (2007). Optimal placement of supplemental dampers in seismic design of structures. J. Seismol. Earthq. Eng. 9, 125–135.
Lavan, O., and Levy, R. (2005). Optimal design of supplemental viscous dampers for irregular shear frames in the presence of the yielding. Earthq. Eng. Struc. Dyn. 34, 889–907. doi: 10.1002/eqe.458
Lavan, O., and Levy, R. (2009). Simple iterative use of Lyapunov's solution for the linear optimal design of passive devices in framed structures. J. Earthq. Eng. 13, 650–666. doi: 10.1080/13632460902837736
Levy, R., and Lavan, O. (2006). Fully stressed design of passive controllers in framed structuresfor seismic loadings. Struc. Multidiscipl. Optimizat. 32, 485–489. doi: 10.1007/s00158-005-0558-5
Main, J. A., and Krenk, S. (2005). Efficiency and tuning of viscous dampers on discrete systems. J. Sound Vib. 286, 97–122. doi: 10.1016/j.jsv.2004.09.022
Mousavi, S. A., and Ghorbani-Tanha, A. K. (2012). Optimum placement and characteristics of velocity-depend dampers under seismic excitation. Earthq. Eng. Eng. Vibr. 11, 403–414. doi: 10.1007/s11803-012-0130-4
Movaffaghi, H., and Friberg, O. (2006). Optimal placement of dampers in structures using genetic algorithm. Int. J. Comp. Add. Eng. Soft. 23, 597–606. doi: 10.1108/02644400610680324
Rakicevic, Z., Bogdanovic, A., and Jurukovski, D. (2009). Shaking Table Effectiveness Testing of GERB PDD (Prestressed Damping Device) Control System. IZIIS Report 2009-40, Skopje, R. Macedonia.
Rakicevic, Z., Bogdanovic, A., Jurukovski, D., Kammerer, H., and Nawrotzki, P. (2010). “Shaking table testing of a steel frame structure without and with GERB prestressed damping devices,” in 5th World Conference on Structural Control and Monitoring, (Tokyo), Session E-8, Paper No 226.
Shukla, A. K., and Datta, T. K. (1999). Optimal use of viscoelastic dampers in building frames for seismic force. J. Struc. Eng. ASCE 125, 401–409. doi: 10.1061/(ASCE)0733-9445(1999)125:4(401)
Singh, M. P., and Moreschi, L. M. (2002). Optimal placement of dampers for passive response control. Earthq. Eng. Struc. Dyn. 31, 955–976. doi: 10.1002/eqe.132
Sonmez, M., Aydin, E., and Karabork, T. (2013). Using an artificial bee colony algorithm for the optimal placement of viscous dampers in planar building frames. Struc. Multidiscipl. Optimizat. 48, 395–340. doi: 10.1007/s00158-013-892-y
Takewaki, I. (1997). Optimal damper placement for minimum transfer functions. Earthq. Eng. Struc. Dyn. 26, 1113–1124. doi: 10.1002/(SICI)1096-9845(199711)26:11<1113::AID-EQE696>3.0.CO;2-X
Tsuji, M., and Nakamura, T. (1996). Optimum viscous dampers for stiffness design of shear buildings. Struc. Design Tall Spec. Build. 5, 217–234. doi: 10.1002/(SICI)1099-1794(199609)5:3<217::AID-TAL70>3.0.CO;2-R
Wang, H., Li, A. Q., Jiao, C. K., and Spencer, B. F. (2010). Damper placement for seismic control of super-long-span suspension bridges based on the first-order optimization method. Sci. China Ser. E. Technol. Sci. 53, 2008–2014. doi: 10.1007/s11431-010-4009-1
Wu, B., Ou, J. P., and Soong, T. T. (1997). Optimal placement of energy dissipation devices for three dimensional structures. Eng. Struc. 19, 113–125. doi: 10.1016/S0141-0296(96)00034-X
Yousefzadeh, A., Sebt, M. H., and Tehranizadeh, M. (2011). The optimal TADAS damper placement in moment resisting steel structures based on a cost-benefit analysis. Int. J. Civil Eng. 9, 23–32.
Keywords: prestressed damper, fitness function, passive control, optimal placement, experimental testing
Citation: Bogdanovic A and Rakicevic Z (2019) Optimal Damper Placement Using Combined Fitness Function. Front. Built Environ. 5:4. doi: 10.3389/fbuil.2019.00004
Received: 14 November 2018; Accepted: 07 January 2019;
Published: 31 January 2019.
Edited by:
Ehsan Noroozinejad Farsangi, Graduate University of Advanced Technology, IranReviewed by:
Baki Ozturk, Hacettepe University, TurkeyDavorin Penava, Josip Juraj Strossmayer University of Osijek, Croatia
Zlatko Zafirovski, Saints Cyril and Methodius University of Skopje, Macedonia
Copyright © 2019 Bogdanovic and Rakicevic. This is an open-access article distributed under the terms of the Creative Commons Attribution License (CC BY). The use, distribution or reproduction in other forums is permitted, provided the original author(s) and the copyright owner(s) are credited and that the original publication in this journal is cited, in accordance with accepted academic practice. No use, distribution or reproduction is permitted which does not comply with these terms.
*Correspondence: Aleksandra Bogdanovic, c2Fza2FAaXppaXMudWtpbS5lZHUubWs=