 Gelacio Juárez-Luna
 Omar Caballero-Garatachea
- Departamento de Materiales, Universidad Autónoma Metropolitana, México City, Mexico
The non-linear behavior of reinforced concrete circular, elliptic, and triangular isolated slabs was studied using computational mechanics. Concrete was modeled with a damage model which includes softening, while the behavior of the reinforcing steel was modeled with a 1D bilinear plasticity model. The constitutive models and the finite element method were validated by comparing the computed numerical results with the experimental results of a rectangular slab reported in the scientific literature. The coefficient method is proposed for its simplicity to calculate design bending moments in slabs with circular, elliptic, and triangular geometries. These coefficients were computed from the FE analysis. The layout of steel reinforcement is proposed, particularly lengths of zones for positive and negative moments, respectively. The crack paths are showed, which are depending on the boundary conditions, acting loads, and geometry of the slabs.
Introduction
A floor is a flat structural member whose primary function is to support transverse and in plane loads and carry them to its supports. Generally, floor systems are an arrangement of panels with rectangular geometries; however, some architectural designs need slabs with other kinds of geometries. In the current provisions of the design codes, there are detailed methods for the analysis and design of slabs with rectangular geometries, including methods such as: equivalent frame, direct, coefficient method, among others. However, slabs without rectangular geometry do not have common forms of structuration neither analysis methodologies in the current design codes. Although, there are slabs with other geometries, this paper only considers circular, elliptic and triangular isolated reinforced concrete slabs.
There are mainly three models for modeling cracking: (1) fracture mechanics, which localizes the cracks, either in a line or a surface, the disadvantages of this model is that it is mainly applicable for brittle materials, where initial cracks as well as a costly re-meshing process are necessary; (2) smeared crack model, cracks occur in any point of a finite element; in this model initial cracks and re-meshing are no needed, but it may show problems of stress locking or spurious kinematic modes; (3) the embedded discontinuities model, which takes the advantages of the first two models, since it introduces the discontinuities (cracks) at any place and direction within the finite elements. These discontinuities (cracks) are not observed, but there are zones with high displacement gradients where damage is concentrated.
In the modeling of the reinforced concrete slabs, de Borst and Nauta (1985) applied the smeared crack model to study an axisymmetric slab under shear penetration, showing that cracking initiated at the bottom face of the slab and the corresponding cracking paths. Then, Kwak and Filippou (1990) modeled a square slab supported on its corners with a concentrated load at the center of the span, obtained the load vs. displacement curve, which was congruent with experimental results reported by Jofriet and McNeice (1971) and McNeice (1967); in the reported results by Kwak and Filippou (1990), neither the first crack load nor the cracking pattern was given. There were other proposals for modeling reinforced concrete slabs, such as Gilbert and Warner (1978), Hand et al. (1973), Hinton et al. (1981), Lin and Scordelis (1975), Wang et al. (2013) among others, most of them used the smeared crack model. Juárez-Luna and Caballero-Garatachea (2014) provides flexural design moments and cracking paths in circular, triangular and elliptic slabs, but they also used the smeared crack model for modeling cracking in concrete in the academic version of the software ANSYS (2010). Shu et al. (2015) studied the response of slabs subjected to bending with non-linear finite element analysis in the software DIANA, modeling the concrete with 3D elements and the steel reinforcement with bar elements. Juárez-Luna et al. (2015) investigates the cracking process of reinforced concrete slabs subject to vertical load. Concrete was modeled with hexahedral finite elements with embedded discontinuities; whereas steel reinforcement was modeled by 3D bar elements, placed along the edges of the solid elements. Genikomsou and Polak (2015) investigated the failures modes of reinforced concrete slab-column connections under static and pseudo-dynamic loadings by 3D non-linear finite element analyses. The comparison between experimental and numerical results, computed in ABAQUS, shows that the calibrated model properly predicts the punching shear response of the slabs. Wosatko et al. (2015) carried out numerical simulations of punching shear in a reinforced concrete slab-column, loaded as monotonically increasing imposed displacement at the column. Two regularized plastic-damage models were applied. The first model, implemented in FEAP, was refined by an additional averaging equation where gradient enhancement involves an internal length scale. In the second model, from ABAQUS, a viscoplastic strain rate was introduced. These models properly predicted punching shear behavior. Genikomsou and Polak (2017) performed finite element analyses to investigate the effect of the compressive membrane action in flat concrete slabs. Numerical results showed that the punching shear capacity of a continuous slab is higher than the capacity of a conventional isolated slab. Navarro et al. (2018) carried out a parametric study of the punching shear phenomenon in a reinforced concrete slab by non-linear numerical models based on finite elements. The slab was simulated in ABAQUS software and the model was calibrated with experimental results reported in literature. The studied parameters were: yield strength of steel reinforcement, compressive strength of concrete, flexural reinforcement, relationship between column width and slab width and slab thickness.
In this paper, reinforced concrete slabs with circular, elliptic and triangular geometries are studied by means of computer simulations to make predictions of these slabs under vertical loading and different support conditions. As it is well-known, computational methods are computer-based methods used to numerically solve mathematical models that describe physical phenomena (Plevris and Tsiatas, 2018). Firstly, linear elastic analyses of slabs with these three geometries were carried out to know the negative and positive moment zones and, consequently, the placement of negative and positive reinforcement. Then, non-linear analyses were carried out to obtain the load-displacement capacity curve as well as cracking paths. The linear elastic analyses were carried out with the software for structural analysis and design SAP2000 (CSI, 2009) and the non-linear analyses were carried out with the finite element analysis program (FEAP), developed by Taylor (2008). In the former software, the slabs were modeled with 2D shell finite elements, but in the latter software, the slabs were modeled with solid and bar finite elements in 3D. The concrete constitutive behavior was modeled with a continuous damage model, which includes different threshold values in tension and compression and also includes strain softening. The steel reinforcement constitutive behavior is modeled with a 1D rate independent plasticity model, including isotropic hardening model. It is important to point out that this damage model with different failure surface in tension and compression was formulated and validated by Juárez-Luna et al. (2014), which was also implemented by these authors in FEAP. The developed damage model does not exhibit the problem of stress locking as the smeared cracking model does; this guaranties an adequate energy release as the material fails. An experimental test of a rectangular slab, reported in the literature, was modeled to validate both constitutive models. The computed force vs. displacement curves at the midspan of the slab as well as cracking paths seem to be in good agreement with the experimental results. Taking avantage of the computed FE results, design suggestions for circular, elliptic and triangular slabs were included. The coefficient method is proposed for its simplicity to calculate design bending moments in these slabs. These coefficients were computed from the FE models. Steel reinforcement layout is proposed, particularly lengths of zones with only bottom reinforcement for positive moments and lengths of zones with top and bottom reinforcement for negative moments.
The outline of this paper is as follows. Section Finite Element Model gives a description of the specimens and shows the concrete and steel constitutive models used in the non-linear analyses. The section Validation shows a validation between the finite element method and the constitutive models through numerical modeling based on a laboratory experiment reported in the literature. Section Results shows linear elastic analyses with finite element method to compute the the steel reinforcement layout and non-linear analyses to compute the force-displacement curves at the midspan of the slabs; additionally, this section shows the grown of cracking on the surfaces of the slabs with simple and clamped supports. Section Design Recommendations provides design recommendations for circular, elliptic and triangular slabs. Finally, in section Conclusions, conclusions derived from this work are given.
Finite Element Model
Description of the Specimens
The modeled reinforced concrete slabs with circular geometry has a diameter d = 4.0 m. Elliptic slab models had values of ratio of minor axis to major axis, b/a, equal to 0.5, 0.6, 0.7, 0.8, and 0.9, respectively, considering a constant value a = 4 m for the major axis. The triangular slab model has a height h = 4 m and base 2h/√3. The studied slabs with three different geometries have a thickness of 10 cm, which satisfied the minimum thickness of the Mexican guidelines for concrete structures NTCC-17 (2017).
Initially, elastic analyses were carried out for the study of the slabs in the software SAP2000 (CSI, 2009). These models were modeled with plate finite elements, which have three degrees of freedom in each node: one translational and two rotational. Subsequently, non-linear analyses were carried out in FEAP, but these models were modeled with hexahedral solid elements and bar elements, which have three degrees of freedom in each one of their nodes. The moment distributions were computed with elastic analyses, which were used to place the steel reinforcement at the top and at the bottom zones of the slabs. On the other hand, cracking and propagation were computed with non-linear analyses.
Constitutive Models
A continuous damage model, developed by Juárez-Luna et al. (2014), was used for modeling the constitutive behavior of concrete, congruent with the experimental behavior reported in the literature, e.g., Kupfer and Gerstle (1973), as shown in Figure 1A. The proposed damage model uses the failure surface proposed by Oliver et al. (1990). Nevertheless, the tangent constitutive tensor developed by Juárez-Luna et al. (2014) is different to the one developed by Linero (2006). This concrete constitutive model considers strain softening after reaching the ultimate stress strength. On the other hand, the steel reinforcement was modeled with a 1D rate independent plasticity model, which has an elastic bounded space shown in Figure 1B, considering a bilinear curve with isotropic hardening.
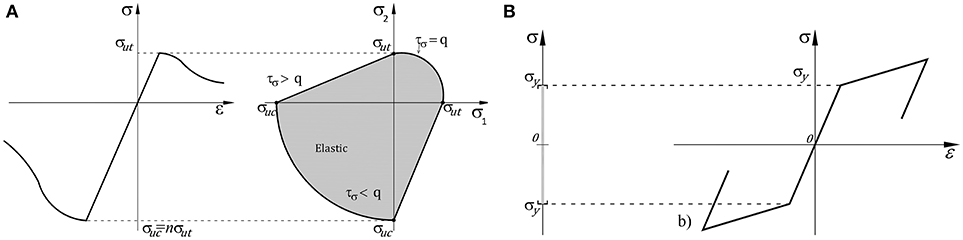
Figure 1. Constitutive behavior of (A) plain concrete and (B) steel reinforcement (adapted from Juárez-Luna et al., 2014).
The continuous damage model, developed by Juárez-Luna et al. (2014), has different failure surface in tension and compression, which is defined by the following equations:
where Ψ is the free energy density, ε is the strain tensor, σ is the stress tensor and C is the elastic tensor. The damage variable, d, is defined in terms of hardening/softening variable q, which is dependent on the hardening/softening parameter, H. The damage multiplier γ determine the loading-unloading condition, the function, f(τσ,q), bounds the elastic domain defining the damage surface in the stress space. The value, ro, is the threshold that determines the limit of the initial elastic domain, i.e, q = ro. In this damage surface, any stress state is transformed to a norm, bounded by ro, where every stress state outside of this surface is inelastic as shown in Figure 2.
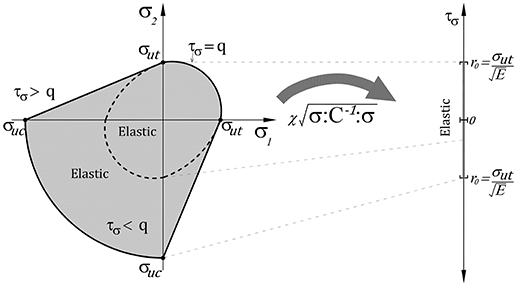
Figure 2. Transformation of the stresses to a norm. (adapted from Juárez-Luna et al., 2014).
The tangent constitutive equation, in terms of rates, from the model in Equation (1) is:
Where CT is the continuum tangent constitutive operator, relating the stress and the strains rates, of the non-linear loading interval, which is defined by
and for the elastic loading and unloading interval (ḋ = 0):
The parameter χ in Equation (3)
where φ a is weight factor, depending on the principal stresses, σi, given by:
where the Maclauy operator < > and the symbol || consider, respectively, the positive and the absolute magnitudes of the principal stresses. The interval of ϕ is [0,1], bounded by 0 for a triaxial compression (σ3 ≤ σ2 ≤ σ1 ≤ 0) and 1 for triaxial tension (0 ≤ σ3 ≤ σ2 ≤ σ1). Consequently, the corresponding interval of χ is [1/n,1], bounded by 1/n for a triaxial compression and 1 for triaxial tension.
The parameter χ scales down 1/n times the norm, as shown in Figure 2, in such a way it is compared with the elastic interval [0, ro]. The value of ro = σut/ depends on the threshold value of σut and the Young's modulus E. Note that the initial elastic interval is the same for 1D, 2D, and 3D problems, all with a limit point ro, and that for a 2D principal stress state, the parameter χ takes the value of 1 in the first quadrant, 1/n in the third quadrant and the interval [1/n,1] in the second and fourth quadrants.
The non-linear analyses were carried out with the software FEAP. The concrete was modeled with hexahedral elements, using the constitutive continuous damage model with different threshold value in tension and compression. The steel reinforcement was modeled with the one-dimensional bar element, which was assigned with a 1D constitutive rate independent plasticity model. Both elements have three degree of freedom per node and large deformations. The 1D elements were placed along the edges of the solid elements and joined at the same nodes to guarantee continuity. In the presented examples hereafter, modeled with bar and solid elements, perfect bond between both elements was considered.
Validation
One of the six specimens tested by Girolami et al. (1970) was modeled to validate the constitutive models of concrete and steel reinforcement. The test slab was 1.829 m square and 0.044 m deep, as shown in Figure 3A. Vertical loads were applied on the top surface through 16 plates, which were 0.2038 m square and 0.0254 m thick, as shown in Figure 3B. Additionally, eight loads were applied at cantilever extensions of the beams to maintain a certain amount of restraint at the corners. The mechanical properties of the concrete are: Young's modulus Ec = 19.90 GPa and ultimate compressive strength σuc = 31.026 MPa. The mechanical properties of the steel reinforcement are: Young's modulus Ea = 206 GPa, Poisson ratio υ = 0.3, yield stress σy = 330.95 MPa and hardening modulus H = 2.871 GPa.
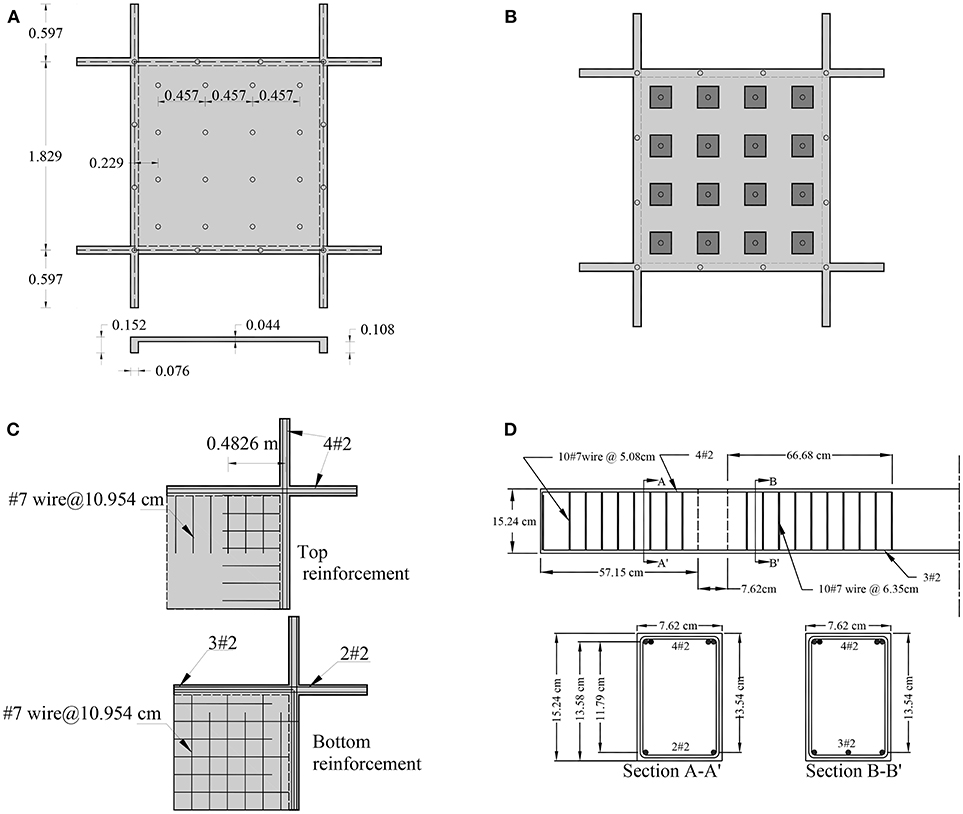
Figure 3. Experimental test: (A) geometry in cm, (B) applied loads, (C) reinforcement of one quarter of the slab and (D) reinforcement of one half of a beam (adapted from Girolami et al., 1970).
The steel reinforcement was placed at top and at the bottom of the slab to support a uniform design load of 7.182 kPa. The top and bottom reinforcement used in the slab consisted of 3.66 mm diameter steel bars cut from No.7 gage wire, which were spaced 10.954 cm in both orthogonal directions, as shown in Figure 3C. Also, the stirrups were bent from the No.7 gage steel wire as shown in Figure 3D. The edge beams have over-reinforced bars because other five of six specimens tested by Girolami et al. (1970) were also loaded in-plane, in addition to vertical load, perpendicular to the surface slab; the reason of the shear reinforcing in the beams is to avoid damage and to transfer the loads to the slab.
The slab geometry and the load have two axes of symmetry, so only a quarter of the slab specimen was modeled, which saves computational cost in the non-linear analysis. In the model, the degrees of freedom perpendicular to the respectively axis of symmetry were restrained. The slab was modeled with two kinds of element, the steel reinforcement was modeled with bar elements as shown in Figure 4A; whereas the plain concrete was modeled with hexahedral solid elements as shown in Figure 4B.
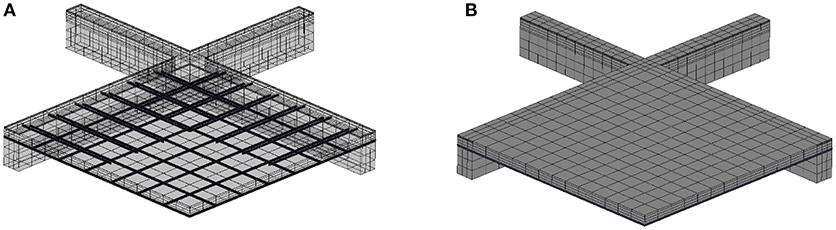
Figure 4. Meshing: (A) steel reinforcement and (B) reinforced concrete.
The experimental and numerical load-displacement curves at the midspan of the slab are compared, as shown in Figure 5. It is seen that both curves in the a-b trajectory are the same; however, in the b-c trajectory a backward motion in the experimental displacement curve was reported, attributed to the loads applied at the ends of the beams to provide restraint. Finally, both curves have the same path in the trajectory d-e. On the other hand, the cracking grown is shown in Figure 6, where cracks started at the corner on the top of the slab. Subsequently, cracking propagates overall the edges to the center, which is in agreement with the experimental results reported by Girolami et al. (1970). This example was also modeled with finite elements with embedded discontinuities by Juárez-Luna et al. (2015), where damage is localized on a surface discontinuity placed at the geometrical center of a solid element.
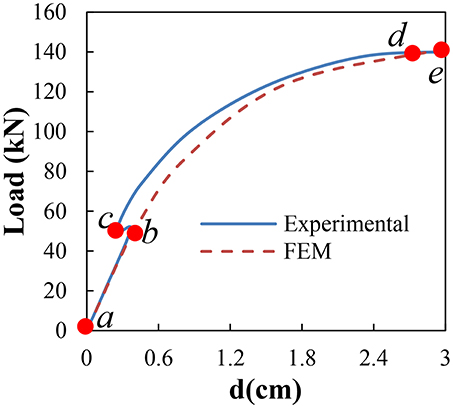
Figure 5. Load vs. displacement curves.
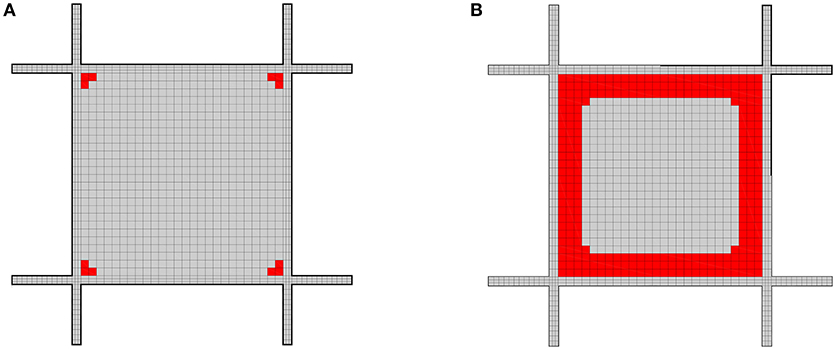
Figure 6. Cracking propagation on the top surface at the: (A) beginning and (B) end.
Results
Linear Elastic Analyses for Steel Reinforcement Distribution
The computed moments of circular, elliptic and triangular slabs were carried out with linear elastic analyses using plate finite elements, as shown respectively in Figure 7. In these models, the reinforced concrete was modeled as an isotropic material with a Young's modulus of E = 21.673 GPa and Poisson's ratio ν = 0.25. In the analyses of these models, only clamped supports were considered, yielding negative moments at the edges and positive moments at the center; simple support slabs were not analyzed because this condition provides only positive moments, which needs only steel reinforcement at the bottom of the slab.
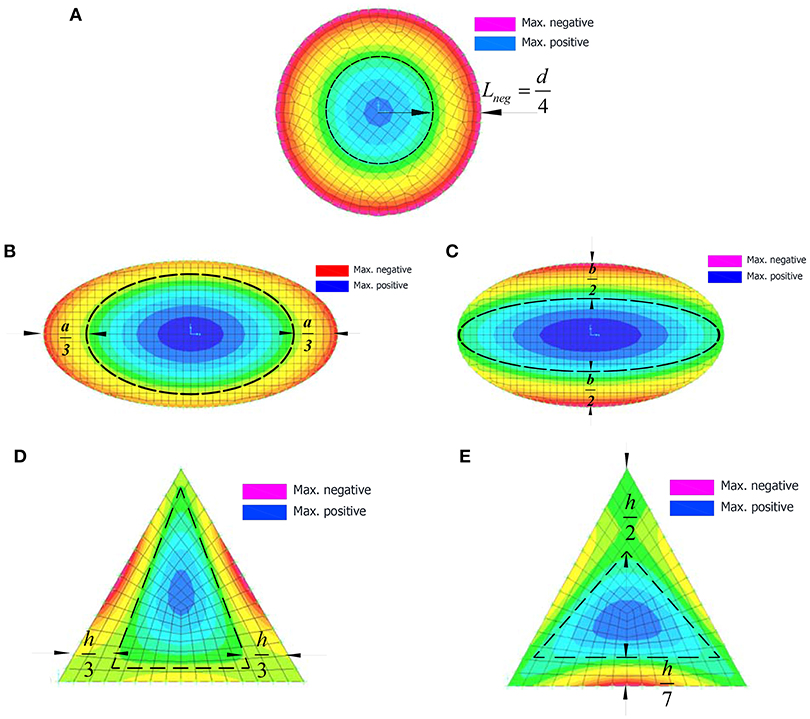
Figure 7. Moment distribution in: (A) circular slab, (B) elliptic slab along horizontal strip (C) elliptic slab along vertical strip, (D) triangular slab along horizontal strip, and (E) triangular slab along vertical strip.
Flexural moments in the circular geometry was computed from a slab modeled with quadrilateral plate elements, avoiding triangular elements at the center of the model, which could generate numerical instability for the large element aspect ratio. According to Figure 7A, negative moments occurred from the edge to the dotted line, in an external ring with an approximated width of one quarter of the diameter, i.e., Lneg = d/4. This length, where negative moments occurs, is analogous to the width of the external band in rectangular slabs, where the steel reinforcement is mainly placed at the top. The steel reinforcement layout was proposed as shown in Figure 8A, where the steel reinforcement is placed at top and bottom faces for negative and positive moments, respectively.
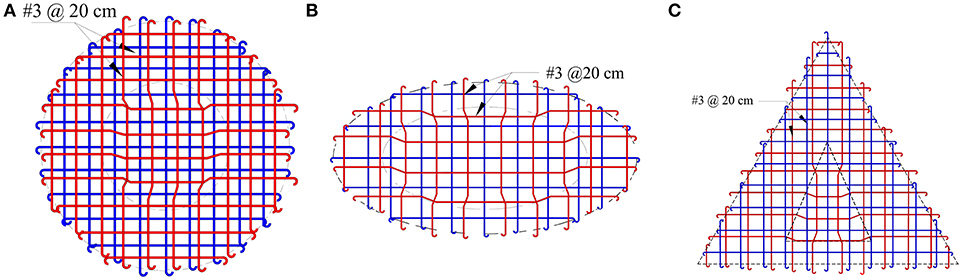
Figure 8. Steel reinforcement layout in: (A) circular slab, (B) elliptic slab, and (C) triangular slab.
Flexural moments in elliptic slabs were computed from numerical models with ratio of minor axis to major axis, b/a, equal to 0.5, 0.6, 0.7, 0.8, and 0.9, respectively, but the major axis length was kept constant, a = 4 m. Quadrilateral plate elements were used for modeling the elliptic slab. According to the moment distribution in Figures 7B,C, the negative moment zones were identified from the edge to the center, having a length of lneg = a/3 for the major axis and a length of lneg = b/3 for the minor axis. A typical the steel reinforcement layout was proposed as shown in Figure 8B, in which the central zone has steel reinforcement only at the bottom, but at the edges, there is steel reinforcement at the top and at the bottom of the slab.
Flexural moments in the triangular geometry were computed from a slab modeled with quadrilateral plate elements, which has a height h = 4 m and base 2h/√3. Figures 7D,E shows the lengths, which mark out the zones of negative moment at both directions: horizontal with a length of h/3 and vertical with a length h/7 at the bottom and h/2 at the top. The proposed steel reinforcement layout is shown in Figure 8C, in which the central zone has steel reinforcement only at the bottom, but at the edges, there is steel reinforcement at the top and bottom of the slab.
Non-linear Analyses
In the non-linear analyses of the slabs with FEAP, 3D solid elements were used for modeling the concrete, which has the following mechanical properties: Young's modulus Ec = 17 GPa, Poisson ratio ν = 0.20, ultimate tensile strength σut = 5 MPa and an ultimate compressive strength σuc = 25 MPa. The steel reinforcement has the following mechanical properties: Young's modulus of Ea = 2.05 × 10⁵ MPa, Poisson's ratio of ν = 0.30 and yield strength σy = 410 MPa. Top and bottom steel reinforcement have 0.025 m of covering. The models were analyzed under two support conditions at the edges: simply supported and clamped, loaded on the surface under distributed load increments. To save computational cost in the analyses, only a quarter of the slabs were modeled, considering the two symmetry axes. The load-displacement curves computed with FEAP are compared with the curves computed in the software ANSYS (2010) reported by Juárez-Luna and Caballero-Garatachea (2014).
In the non-linear analysis of the circular slab, a model with diameter d = 4 m was carried out. The slab was reinforced with number 3 bars, which were spaced 0.20 m in both orthogonal directions. The steel reinforcement meshing was embedded into the solid elements as shown in Figure 9A, where the nodes of both kinds of elements were joined. Figure 10 shows the load-displacement curves at the center of the span, where distributed loads of 17 and 98 kPa were needed on the slabs with simple and clamped supports, respectively, to reach a displacement of 5 cm.
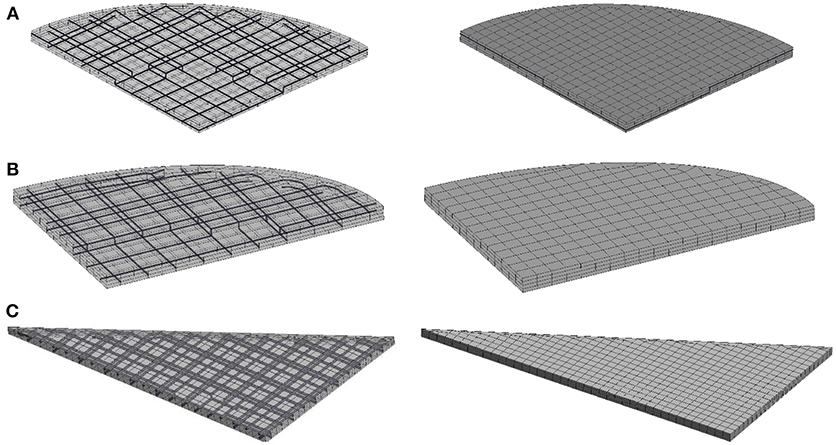
Figure 9. Finite element meshing of steel reinforcement and plain concrete of: (A) circular slab, (B) elliptic slab, and (C) triangular slab.
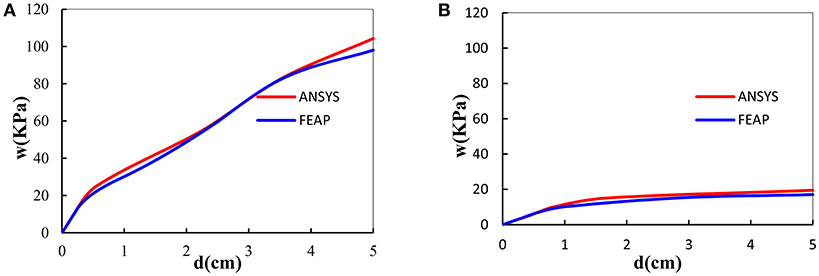
Figure 10. Load vs. displacement curve at the midspan of circular slab: (A) clamped and (B) simple supported.
The non-linear analyses of elliptic slabs were carried out considering minor axis to major axis ratios b/a = 0.5, 0.6, 0.7, 0.8, and 0.9. The steel reinforcement consisted of 3/8 in diameter steel bars placed at the top and at the bottom, which were spaced 0.20 m in both orthogonal directions. The steel reinforcement was modeled with bar elements. The meshing of both concrete and the embedded steel reinforcement is shown in Figure 9B, which were joined at the nodes. The distributed load-displacement at the center of the span curves is shown in Figure 11, where it is observed that the needed loading to develop a displacement at the center of the span is in inverse proportion to the ratio, b/a, for both support conditions. Furthermore, it is observed that the applied distributed load magnitude in the simple supported slab is ~20% of the distributed load magnitude in the clamped supported slab to reach the same displacement.
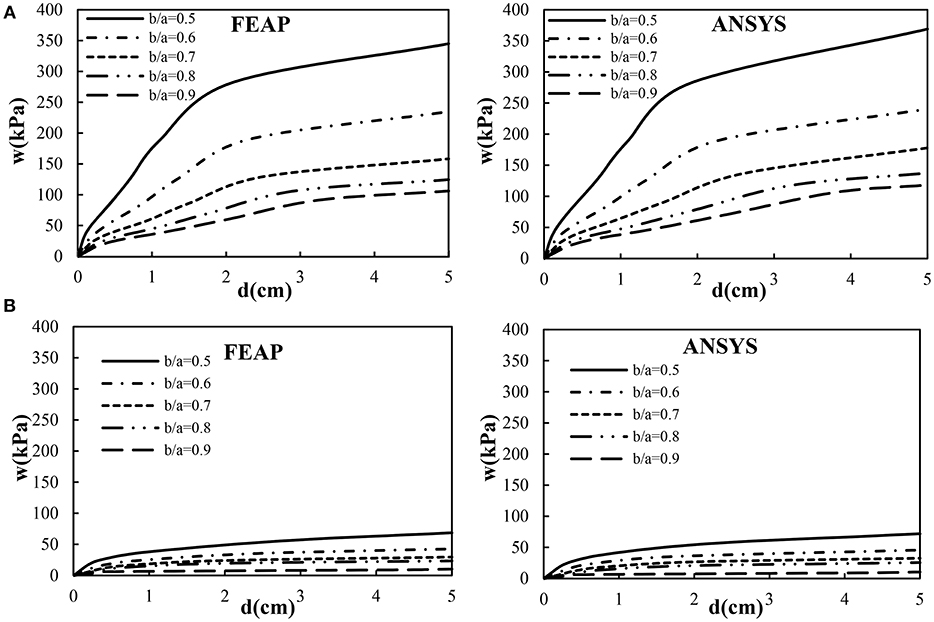
Figure 11. Load vs. displacement curves at the midspan of elliptic slab: (A) clamped and (B) simple supported.
Concerning to the non-linear analysis of the triangular slab, the steel reinforcement consisted of bar size of number 3 placed at the top and at the bottom and spaced 0.20 m in both orthogonal directions, which was modeled with bar elements. The concrete meshing with the embedded steel reinforcement is shown in Figure 9C. Taking advantage of the symmetry, only one half of the model was analyzed. The distributed load vs. displacement at the center of the span curves are shown in Figure 12, where it is observed again that the support conditions have influence in the global behavior, in such a way that the simple supported triangular slab only needs ~20% of the distributed load in the clamped supported slab to reach the same displacement at the center.
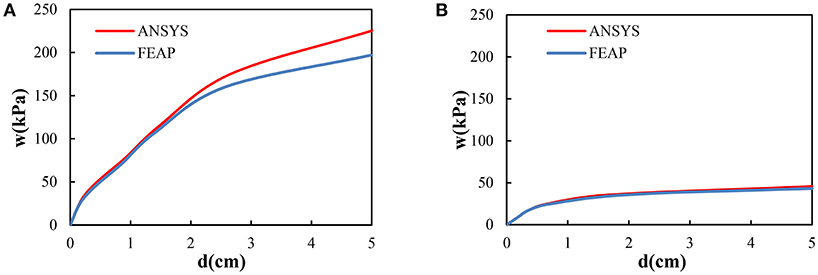
Figure 12. Load vs. displacement curve at the midspan of triangular slab with a = 4 m: (A) clamped and (B) simple supported.
Cracking Paths
Cracking paths are important to identify the tension stress concentration zones, which qualitatively point out the zone where the steel reinforcement must be placed. In this paper, cracking was modeled with a damage model, associated to a stresses state at the Gaussian integration points of each element, where the material reaches a failure surface. Therefore, large displacements and as consequence, strain concentration are observed where the material is damaged. In this section, the bottom and top surfaces of the slabs show those zones where the integration points are damaged. The cracking zones caused by tension stresses are shown in red color, but crashing zones, dominated by compressive stresses, are shown in blue color.
In the clamped circular reinforced concrete slabs, cracking started along the edges on the top surface because of his axisymmetric characteristic, as shown in Figure 13A. Then, cracking occurs at the center of the slab on the bottom surface, see Figure 13B. After that, cracking grows from the edges to the center and crushing occurs at the center on the top surface, while at the bottom surface, cracking grows from the central zone to the edges. On the other hand, in the simply supported circular slabs, cracking starts at the central zone on the bottom surface and it propagates to the edges as shown in Figure 13D. On the top surface, neither cracking nor crushing occurs as shown in Figure 13C.
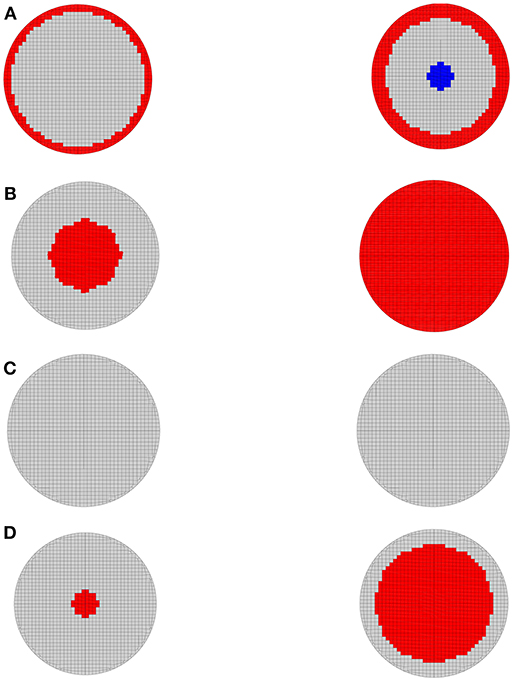
Figure 13. Cracking propagation of a circular slab on the: (A) top-clamped, (B) bottom-clamped, (C) top-simple supported, and (D) bottom-simple supported.
In the reinforced concrete clamped elliptic slab, cracking starts along the edges on the top surface, which are approximately perpendicular to the major axis, as shown in Figure 14A. Then, cracking occurs at center of the slab on the bottom surface, see Figure 14B. On the top surface, cracking propagation is analogous to the circular slab, since it grows from the edges to the central zone; however, at the center, crushing occurs, but on the bottom surface, cracking grows from the central zone to the edges. In the reinforced concrete simple supported elliptic slab, cracking starts on the bottom surface, as shown in Figure 14D. Then, it propagates from the central zone to the edges. On the top surface, neither cracking nor crushing occurs as shown in Figure 14C.
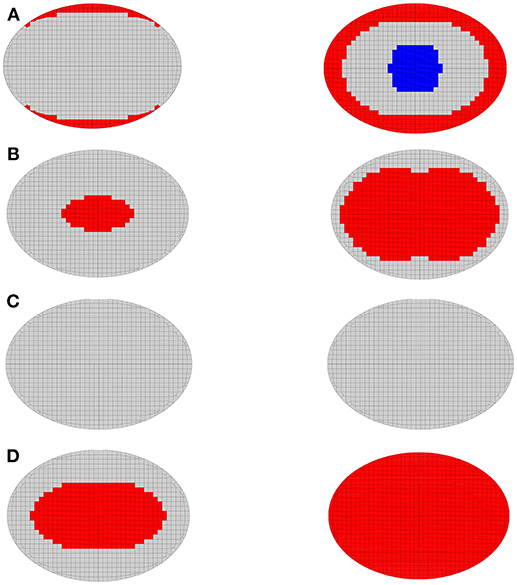
Figure 14. Cracking propagation of an elliptic slab on the: (A) top-clamped, (B) bottom-clamped, (C) top-simple supported, and (D) bottom-simple supported.
In the reinforced concrete clamped triangular slab, cracking starts along the three edges on the top surface, as shown in Figure 15A, where tension stresses are developed. Then, cracking occurs on the bottom surface at the central zone, as shown in Figure 15B. On the top surface, cracking propagation starts from the center of the edges to the vertexes, but on the bottom surface, it propagates from the central zone to the vertexes. On the contrary, in the reinforce concrete simple supported triangular slab, cracking starts on the bottom surface in the central zone and it propagates to the vertexes as shown in Figure 15D. At the same time, cracking occurs on the top surface as shown in Figure 15C.
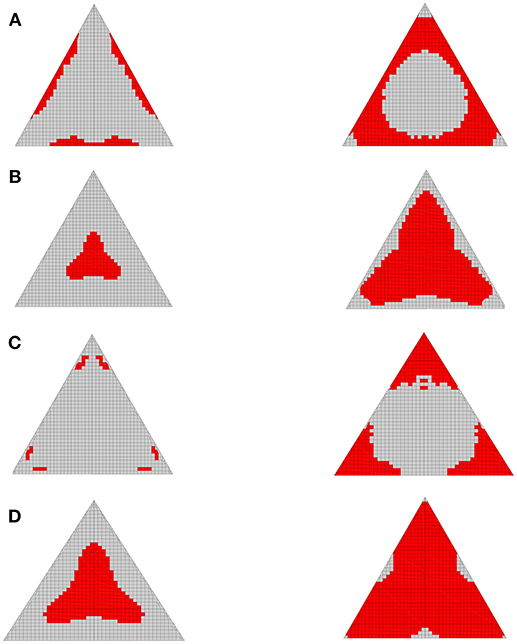
Figure 15. Cracking propagation of a triangular slab on the: (A) top-clamped, (B) bottom-clamped, (C) top-simple supported, and (D) bottom-simple supported.
In general, in reinforce concrete clamped slabs, cracking starts along the edges on the top surface. Then, it occurs at center of the slab on the bottom surface. On the other hand, in reinforced concrete simple supported slabs, cracking occurs on the bottom surface in the central zone and it propagates to the overall surface. After that, an incipient cracking occurs at the central zone on the top surface. The fact that cracking is larger than crushing in the slab is due to the stress re-distributions and to the ultimate tensile strength, which varies from 5 to 20% of the ultimate compressive strength.
Design Recommendations
The steel reinforcement layout for circular, elliptic and triangular slabs is proposed as shown in Figures 7, 8, respectively. Top and bottom reinforcement is placed outside of the dotted line for negative moments, but only bottom reinforcement is placed inside of the dotted line for positive moments.
In this paper, the coefficient method is proposed for its simplicity to calculate design bending moments in slabs. This method to design two-way slabs supported on all sides by walls and deep beams was included in the ACI-318-63 (1963) code. The coefficient method uses a moment coefficient table for a variety of types of panels. In the coefficient method, moments for the middle strips of the slab are computed by the general formula:
where M is the design moment at the critical section considered, w is the total uniform load per square meter acting on the panel and a1 is the short span length. The slabs meshed with solid and bar elements provided stresses at the nodes; however, the design of reinforced concrete slabs is based on moments per unit width, so moments were computed by integrating the stress function along eight elements of the overall thickness, using a linear interpolation, as shown in Supplementary Figure 1.
In Supplementary Tables 1–3, design coefficients are given for circular, elliptic and triangular geometry, respectively. These coefficients must be multiplied by 10−4 wl2 to obtain the flexural design moments per unit width. l is the reference length (r, b, and h for circular, elliptic and triangular slabs, respectively). Two types of construction were considered: case I, slabs built monolithically with their supports and case II, slabs not built monolithically with their supports. In the last one, negative coefficients have zero values at the edges because there are only positive moments in the slab due to the support condition. These coefficients are negative in the edges of the three geometries, but they are positive in the centre of three geometries and in point B of the triangular geometry, as shown in Supplementary Figure 2. The variations of the computed coefficients in the circular, elliptic and triangular slabs are shown in Supplementary Figures 3–9. The variations of their magnitudes are attributed to cracking in concrete and to hardening in steel reinforcement in the nonlinear range at the zones with maximum stresses of the slabs.
Conclusions
The load-displacement curves of the numerical and the experimental test reported from literature, respectively, showed a good agreement. Nevertheless, a backward motion in the experimental displacement was reported, attributed to the loads applied at the ends of the beams to provide restraint.
The yielding line method was not considered in the calculation of cracking paths or ultimate load because this method provides only values of the ultimate load, but it does not provide the cracking paths. Moreover, the aforementioned ultimate load can be greater or smaller than the ultimate load. Therefore, the computational mechanics was used because it provides the starting and the growing of damage.
The steel reinforcement layout in each slab, based on linear elastic analyses of homogenous plate elements, was adequate because there was a good approximation in the moment distribution as well as in the location and initiation of cracking in the slabs. The lengths of the steel reinforcement (positive and negative) are recommended to the design and construction of slabs with the geometries presented in this paper.
The load-displacement curves at the central zone of the slabs with the three studied geometries show that the distributed loading in the simply supported slabs was ~20% of the distributed loading in the clamped slabs with the same displacement. The load-displacement curves computed with FEAP show good agreement with those curves computed with ANSYS (2010) by Juárez-Luna and Caballero-Garatachea (2014).
The coefficient method is proposed for its simplicity to calculate design bending moments in circular, elliptic and triangular slabs, respectively. These coefficients are tabulated, considering two types of construction: case I, slabs built monolithically with their supports and case II, slabs not built monolithically with their supports.
In general, cracking in clamped slabs occurs at the edges on the bottom surface; subsequently, it is propagated from the central zone to the edges. On the other hand, in the simply supported slabs, cracking occurs in the central zone on the bottom surface and it is propagated to the edges.
In general, the study of these complex slabs under vertical loading by computer simulations does not substitute experimental results, but it provides reasonably good approximations.
Author Contributions
GJ-L and OC-G contributed to the conception and idea of the paper. The analyses of the slab models were carried out in the software FEAP by GJ-L and in the software ANSYS by OC-G. Both authors contributed to organize, read, review, and approve the submitted version.
Conflict of Interest Statement
The authors declare that the research was conducted in the absence of any commercial or financial relationships that could be construed as a potential conflict of interest.
Acknowledgments
The authors acknowledge the support given by the Universidad Autonoma Metropolitana. The second author acknowledges the scholarship for his Master's studies given by CONACYT.
Supplementary Material
The Supplementary Material for this article can be found online at: https://www.frontiersin.org/articles/10.3389/fbuil.2019.00009/full#supplementary-material
References
ACI-318-63. (1963). Building Code Requirements for Structural Concrete and Commentary. Farmington Hills, MI: American Concrete Institute.
de Borst, R., and Nauta, P. (1985). Non-orthogonal cracks in a smeared finite element model. Eng. Comput. 2, 35–46. doi: 10.1108/eb023599
Genikomsou, A. S., and Polak, M. A. (2015). Finite element analysis of punching shear of concrete slabs using damaged plasticity model in ABAQUS. Eng. Struct. 98, 38–48. doi: 10.1016/j.engstruct.2015.04.016
Genikomsou, A. S., and Polak, M. A. (2017). 3D finite element investigation of the compressive membrane action effect in reinforced concrete at slabs. Eng. Struct. 136, 233–244. doi: 10.1016/j.engstruct.2017.01.024
Gilbert, R. I., and Warner, R. F. (1978). Tension stiffening in reinforced concrete slabs. J. Struct. Div. ASCE 104, 1885–1900.
Girolami, A. G., Sozen, M. A., and Gamble, W. L. (1970). Flexural Strength of Reinforced Concrete Slabs With Externally Applied In-plane Forces. Civil Engineering Department, University of Illinois, 176.
Hand, F. D., Pecknold, D. A., and Schnobrich, W. C. (1973). Nonlinear analysis of reinforced concrete plates and shells. J. Struct. Div. ASCE 99, 1491–1505.
Hinton, E., Abdel Rahman, H. H., and Zienkiewicz, O. C. (1981). Computational Strategies for Reinforced Concrete Slab Systems. International Association of Bridge and Structural Engineering, Colloquium on Advanced Mechanics of Reinforced Concrete, 303–313.
Jofriet, J. C., and McNeice, G. M. (1971). Finite element analysis of RC slabs, J. Struct. Div. ASCE. 97, 785–806.
Juárez-Luna, G., and Caballero-Garatachea, O. (2014). Determinación de coeficientes de diseño y trayectorias de agrietamiento de losas aisladas circulares, elípticas y triangulares. Ing. Invest. Tecnol. 15, 103–123. doi: 10.1016/S1405-7743(15)30010-X
Juárez-Luna, G., Méndez-Martinez, H., and Ruiz-Sandoval, M. E. (2014). An isotropic damage model to simulate collapse in reinforced concrete elements. Lat. Am. J. Solids Struct. 11, 2444–2459. doi: 10.1590/S1679-78252014001300007
Juárez-Luna, G., Tena-Colunga, A., and Ayala, G. A. (2015). Computational modelling of RC slabs fracture with an embedded discontinuity formulation. Lat. Am. J. Solids Struct. 12, 2539–2561. doi: 10.1590/1679-78251890
Kupfer, H. B., and Gerstle, K. H. (1973). Behavior of concrete under biaxial stresses. J. Eng. Mech. ASCE 99, 853–866.
Kwak, H. G., and Filippou, F. C. (1990). Finite Element Analysis of Reinforced Concrete Structures Under Monotonic Loads, Department of Civil Engineering, University of California, Berkeley, CA, p. 124.
Lin, C. S., and Scordelis, A. C. (1975). Nonlinear analysis of RC shells of general form. J. Struct. Div. ASCE 101, 523–238.
Linero, D. L. (2006). Un Modelo del Fallo Material en el Hormigón Armado, Mediante la Metodología de Discontinuidades Fuertes de Conti-nuo y la teoría de Mezclas. Dissertation, Escola Tècnica Superior d'Enginyers de Camins, Canals i Ports, Universidad Politécnica de Cata-luña.
McNeice, A. M. (1967). Elastic-Plastic Bending of Plates and Slabs by the Finite Element Method. Dissertation, London University.
Navarro, M., Ivorra, S., and Varona, F. B. (2018). Parametric computational analysis for punching shear in RC slabs. Eng. Struct. 165, 254–263. doi: 10.1016/j.engstruct.2018.03.035
NTCC-17. (2017). Normas Técnicas Complementarias para Diseño de Estructuras de Concreto. Gaceta Oficial del Distrito Federal.
Oliver, J., Cervera, M., Oller, S., and Lubliner, J. (1990). “Isotropic damage models and smeared crack analysis of concrete,” in SCI-C Computer Aided Analysis and Design of Concrete Structures, eds N. Bićanć, and H. Mang (Swansea: Pineridge Press), 945–957.
Plevris, V., and Tsiatas, G. C. (2018). Computational structural engineering: past achievements and future challenges. Front. Built Environ. 4:21. doi: 10.3389/fbuil.2018.00021
Shu, J., Fall, D., Plos, M., Zandi, K., and Lundgren, K. (2015). Development of modelling strategies for two-way RC slabs. Eng. Struct. 101, 439–449. doi: 10.1016/j.engstruct.2015.07.003
Taylor, L. R. (2008). A Finite Element Analysis Program (FEAP) v8.2. Department of Civil and Environmental Engineering, University of California at Berkeley, Berkeley, CA.
Wang, Y., Dong, Y., and Zhou, G. (2013). Nonlinear numerical modeling of two-way reinforced concrete slabs subjected to fire. Comput. Struct. 119, 23–36. doi: 10.1016/j.compstruc.2012.12.029
Keywords: slabs, damage model, finite elements, cracking, coefficient method, moment design
Citation: Juárez-Luna G and Caballero-Garatachea O (2019) FE Modeling of Circular, Elliptic, and Triangular Isolated Slabs With a Continuous Damage Model. Front. Built Environ. 5:9. doi: 10.3389/fbuil.2019.00009
Received: 24 August 2018; Accepted: 17 January 2019;
Published: 22 February 2019.
Edited by:
Vagelis Plevris, OsloMet–Oslo Metropolitan University, NorwayReviewed by:
Alessia Monaco, Dipartimento di Architettura e Design, Politecnico di Torino, ItalyFrancesco Tornabene, University of Bologna, Italy
Flavia De Luca, University of Bristol, United Kingdom
Copyright © 2019 Juárez-Luna and Caballero-Garatachea. This is an open-access article distributed under the terms of the Creative Commons Attribution License (CC BY). The use, distribution or reproduction in other forums is permitted, provided the original author(s) and the copyright owner(s) are credited and that the original publication in this journal is cited, in accordance with accepted academic practice. No use, distribution or reproduction is permitted which does not comply with these terms.
*Correspondence: Gelacio Juárez-Luna, Z2psQGF6Yy51YW0ubXg=