 Arindam Gan Chowdhury1
 Mohammadtaghi Moravej2
 Ioannis Zisis1*
 Peter Irwin1Andres Tremante3Bodhisatta Hajra4
- 1Department of Civil and Environmental Engineering, Florida International University, Miami, FL, United States
- 2Extreme Events Institute of International Hurricane Research Center, Florida International University, Miami, FL, United States
- 3Department of Mechanical and Material Engineering, Florida International University, Miami, FL, United States
- 4Engineering Services, Ennova Facades Inc., Windsor, ON, Canada
Coastal areas of the US are affected by extreme wind events, including hurricanes. Roofs are the most vulnerable building components as they are often damaged by high wind uplift forces acting on the edges and corners. This study investigates the application of a mitigation strategy, in the form of an Aerodynamics Mitigation and Power System (AMPS) (US Patent, Gan Chowdhury et al., Patent Number: US 9,951,752 B2, April 2018), designed to simultaneously reduce wind damage and provide power to buildings. The system consists of horizontal axis wind turbines, integrated to roof edges with or without gutters. Four sets of testing on a flat roof low rise building model (without gutters)—including a bare deck configuration (i.e. without AMPS) and three cases where the roof corner was fitted with AMPS—were conducted at the Wall of Wind Experimental Facility at Florida International University. In one of the configurations, the wind turbines were placed slightly above the roof edge, while in the other two configurations, the turbines were placed closer to the roof edge. Wind directions tested ranged from 0° to 90° (considering roof geometric symmetry). Estimation of area-averaged mean and peak pressure coefficients were made for various locations on the roof for the three different configurations, and compared with the case of no mitigation. Results show that for wind directions tested, significant reduction in mean and peak pressure coefficients (reduced suction) were obtained in those cases where the wind turbines were placed closer to the roof edge as compared to the bare roof deck case. Flow visualization studies showed that the turbines helped to disrupt the conical vortices caused by cornering winds, thereby reducing the wind uplift forces on the roof. This study shows that the AMPS can be utilized to prevent wind-induced damage to the roof. Future research will include estimation of the: (1) potential wind energy production using the mitigation system under various wind conditions, (ii) effectiveness of AMPS in mitigating wind loading on other kinds of buildings (e.g., gable and hip roof buildings), and (iii) load transferred from the system to the roof.
Introduction
Wind induced damage to low rise building roofs is common in coastal areas of USA which are prone to hurricanes with wind speeds exceeding 150 mph (Gavanski et al., 2013). The roof of a low rise building is highly vulnerable to wind damage due to the high suctions experienced by the roof during hurricanes (Eamon et al., 2007; Meloy et al., 2007). In the past, various mitigation devices have been studied by researchers to reduce wind induced suction on roofs (Lin and Surry, 1993; Cochran et al., 1995; Banks and Meroney, 2001). For instance, Cochran et al. (1995) performed wind tunnel measurements at Western University, Canada and found that minor modifications on the roof corners can reduce roof suctions. Surry and Lin (1995) found that porous parapets placed at the building edge can substantially reduce roof suctions. Experimental studies on wind load mitigation using various geometries of parapets and roof edges were also conducted by other researchers (Kopp et al., 2005; Blessing et al., 2009). Blessing et al. (2009) carried out studies at the Wall of Wind Experimental Facility (WOW EF) at Florida International University (FIU), USA using two different aerodynamic edge shapes and found significant reduction in wind induced loads on the building roof. Based on wind tunnel studies on a low rise gable roof building, Suaris and Irwin (2010) found that perforated parapets installed at the roof corners and at the ridge resulted in about 60% reduction in the peak pressure coefficients.
There are instances of using wind turbines fixed to a building in areas of high winds to generate wind energy and these turbines are generally known as Building Augmented Wind Turbines (BAWT) (Bahaj et al., 2007). BAWT's are generally of two types: Horizontal Axis Wind Turbine (HAWT) and Vertical Axis Wind Turbine (VAWT) (Lu and Ip, 2009). However, the application of these turbines in reducing wind induced loads on low rise building roofs has not been investigated so far.
The current study focuses on the application of an aerodynamic mitigation strategy by applying lightweight small helicoid horizontal axis wind turbines on the edges of a building roof to simultaneously reduce wind induced suction and produce energy. The system, named as Aerodynamics Mitigation and Power System (AMPS), was originally conceived and designed to simultaneously reduce wind damage and provide power to buildings, homes, stadiums, and other infrastructures related to transportation, traffic, power utilities including bridges, towers, signs, poles, among others. A patent application has been published for this new system (United States Patent, Gan Chowdhury et al., Patent Number: US 9,951,752 B2, April 2018).
This paper describes the aerodynamic performance of the new technology when tested using a flat roof building model at the WOW EF. Mean and peak pressure coefficients were estimated at various locations on the roof, for a bare deck model without any roof edge features and three different system configurations at wind directions ranging from 0 to 90 degrees. In one of the configurations, the wind turbines were placed slightly above the roof edge, while in the other two cases the turbines were placed closer to the roof edge. Section Experimental Setup of the paper describes the experimental setup and various configurations studied, while section Results and Discussion presents the results and discussion. The conclusions from this study are presented in section Conclusions.
Experimental Setup
WOW Experimental Setup and Instrumentation
The WOW EF, designated in 2015 as one of the National Science Foundation's Natural Hazards Engineering Research Infrastructure (NHERI) Experimental Facilities (EFs), is a state-of-the-art wind engineering research facility consisting of a 2 × 6 array of fans; each fan being powered by a 700 horsepower electric motor. The 12-fan WOW system produces a wind field that is 4.3 m high and 6.1 m wide (Gan Chowdhury et al., 2017). The WOW EF is capable of producing wind speeds of up to ~70 m/s that is equivalent of a category five hurricane as per Saffir-Simpson scale. This facility has greatly contributed to the wind engineering community through large- and full-scale test-based research on various aspects which include, among others, wind induced loads on roof components (Habte et al., 2015; Moravej et al., 2017; Gan Chowdhury and Moravej, 2018; Sayyafi et al., 2018) and rooftop solar panels (Moravej et al., 2015; Naeiji et al., 2017). In the present study, spires and roughness elements (Figure 1) were used to generate an Atmospheric Boundary Layer (ABL) wind profile for an open terrain condition.
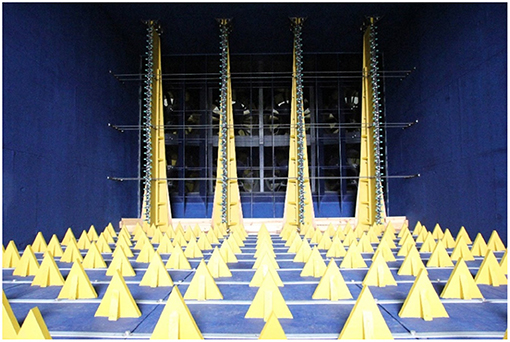
Figure 1. Spires and roughness elements in the WOW at FIU, USA.
The 1:6.5 scale building model used in this study was 1.53 m high and 3.29 × 3.29 m in the plan, thus representing a prototype three-story commercial building 10 m high and 21 × 21 m in the plan. The mean velocity measured at the building height was 21.5 m/s and with a 1:2.5 wind speed scaling, the prototype wind speed was 53.8 m/s.
The wind velocity was measured using cobra probes (Turbulent flow instrumentation, 2008), while the pressures on the roof surface were measured using “Scanivalve ZOC 33” modules1at a frequency of 512 Hz for a sampling time of 1 min. The pressures were measured using the tubes attached to each tap on the roof, and these tubes were connected to the ZOC 33 modules underneath the turntable to ensure that they did not interfere with the oncoming wind flow. A tubing transfer function (Irwin et al., 1979) was applied to correct for the tubing effects. The peak Cp values were estimated using the partial turbulence simulation (PTS) method (Asghari Mooneghi et al., 2016; Moravej, 2018). The PTS method attempts to match the higher end of the turbulence power spectrum between field and wind tunnel measurements while incorporating the effects of the missing low-frequency turbulence content through a post-test analytical approach. Flow visualization study was performed using a smoke generator and gravel on the roof.
Test Configurations
The roof of the building model was equipped with pressure taps located as shown in Figure 2, with a denser distribution near the corner to obtain higher resolution data from the corner and near-edge zones. The edges and corners of the building roof are critical since high wind induced suctions (negative pressures) are generated in these regions due to separated flows or conical vortices, often causing failures of roofing elements such as roof pavers, tiles, or shingles. Therefore, in the present study, the wind turbines were placed on the edges of the building near the corner and were continued for a length of 2 m along each edge (Figure 3A). The turbine blades had a helical shape with a diameter of 22.86 cm and were welded to a spinning shaft (see Figure 3B). Turbines were attached to the building structure using metal brackets screwed to the roof (see Figure 3C) or the wall (see Figure 3D). The brackets had dimensions of 27.94 × 12.7 cm and were spaced at 100 cm. The supports were screwed to the wall (for Cases 2 and 3 described below) or the roof (Case 4) to create the desired configuration. Based on the symmetry of the building, it was tested for wind directions ranging from 0 to 90° (0, 10, 20, 30, 37.5, 45, 52.5, 60, 70, 80, and 90°). Four cases were tested comprising of a bare deck model and three configurations of the wind turbines attached to the roof edges. Schematic of the various cases tested in the WOW are presented in Figure 4. Case 1 consisted of the building without turbines (bare deck). In Case 2, the wind turbines were placed 7.6 cm above the roof. In Cases 3 and 4, the wind turbines were directly in contact with the edge of the roof but the positions were different as shown in Figure 4. For the three cases, the height, “h” is defined as the distance from the top of the turbine to the roof surface. As shown in Figure 4, for Cases 2, 3, and 4, the values of h were 30.46, 15.26, and 22.86 cm, respectively. The ratio h/H (where H was the building height) for Cases 2, 3, and 4 were 0.2, 0.1, and 0.15, respectively.
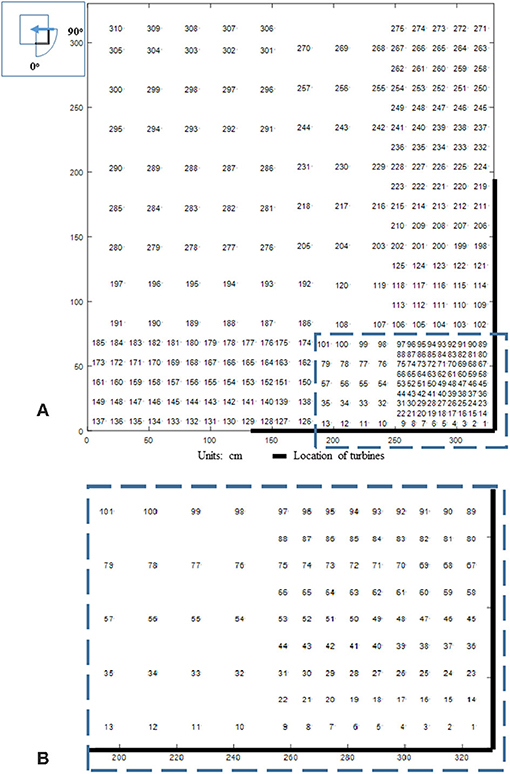
Figure 2. Tap layout on the roof and the range of wind directions tested (A) entire roof area (B) magnified view of the corner.
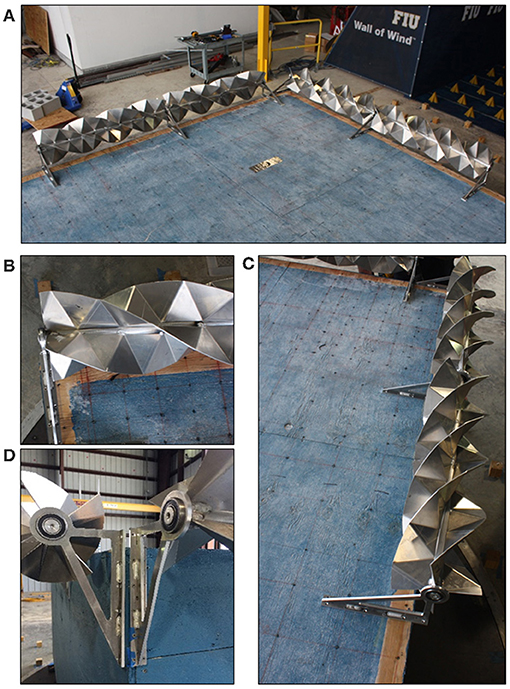
Figure 3. (A) Wind turbine used for the study; (B) helical structure of the turbine blades; (C) turbine connected to the roof edge; (D) turbine connected to the building wall.
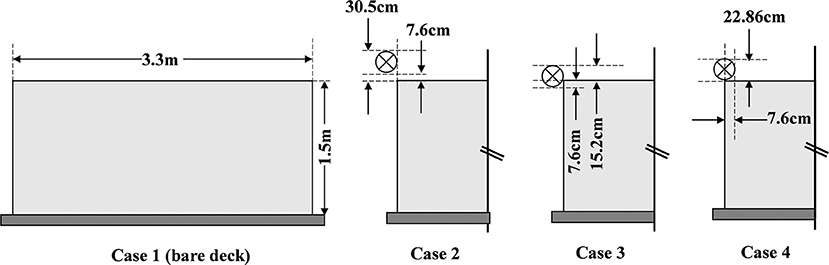
Figure 4. Schematic of the different cases tested in the WOW (note: the turbine location with respect to the building is shown in each case).
Results and Discussion
In this section, the results from flow visualization are discussed, followed by the localized and area averaged mean and peak pressure coefficients obtained on the building roof.
Flow Visualization Using Smoke
The use of gravel in determining the effect of the vortices was successfully carried out in the past while assessing the efficacy of perforated parapets in mitigating wind induced damage on a building roof (Blessing et al., 2009). For the current study, the four cases shown in Figure 4 were tested using gravel on the roofs. A 5 cm layer of 1.3 cm nominal diameter river gravel was loosely laid on the roof. Scouring of the gravels represents the high suction produced under conical vortices emanating from cornering winds. A smoke generator was also used to visualize the structures of those conical vortices. Figure 5a shows scouring of gravel along the bare deck roof edges (Case 1) while the building was exposed to a wind speed of 25 m/s and wind direction of 45 degrees. Smoke visualization image (Figure 5a) depicts the rotating vortices generated from the two adjacent edges of the roof in the absence of the turbines.
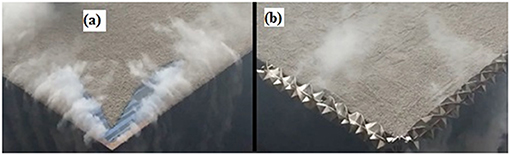
Figure 5. (A) Bare roof (without turbine); (B) turbine attached to the roof edge.
The high suction under these vortices is responsible for the gravel scouring and is one of the major causes of roof damage in windstorms. However, Figure 5b shows flow visualization for Case 4 where the turbines were installed close to the roof edges. As shown in the figure, the presence of the turbines seems to be effective in disrupting the vortex structures and preventing the gravels from being scoured, indicating reduced roof suction.
Even though flow visualization using gravel scouring provides a qualitative assessment, a quantitative assessment of the wind loads using mean and peak pressure coefficients is necessary and discussed further in the following section.
Localized and Area Averaged Pressure Coefficients
The mean pressure coefficient (Cp mean) and peak pressure coefficient (Cp peak) are defined as:
Where, Pmean and Pmin are the mean and minimum (negative peak) of pressures measured at the tap location; ρ is the density of air (1.225 kg/m3), and Vh corresponds to the mean wind speed at the building height (1.53 m). The peak pressure coefficients were estimated using partial turbulence simulation method (PTS) and then converted to 3 s peak pressure coefficients (Cp min, 3s) (Asghari Mooneghi et al., 2016; Moravej, 2018).
In Figure 6, the Cp min, 3s of a group of roof taps with highest peaks from a 45-degree wind direction are compared to each other. The horizontal axis shows the tap numbers based on the layout presented in Figure 2. Since the taps are sorted based on the Cp min, 3s, so the axis labels do not follow a sequential order. The solid blue line belongs to Case 1 and falls far below the values obtained from other cases in which the turbines were installed. A significant reduction in the Cp min, 3s values is observed in the presence of roof edge turbines. According to Figure 6, the configuration of Case 3 results in the highest reduction of roof suctions among other cases as illustrated by the dashed lines.
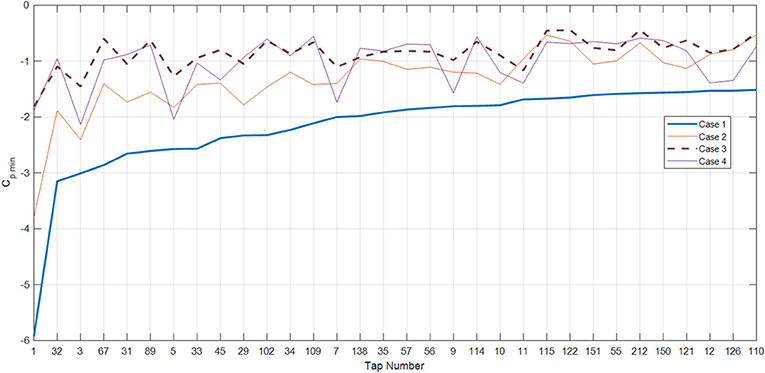
Figure 6. Cp min,3s vs. tap numbers for wind direction of 45 degrees.
To study the results in more detail, a small group of taps from the ones sorted and displayed in Figure 6 are selected and compared in a tabular form. Table 1 shows the Cp mean values for the wind direction of 45 degrees at the selected taps. Locations of the taps are shown in Figure 2. For the tap 1 which is a corner tap with the lowest Cp mean of −3.32 (the highest suction), the Cp is decreased to −2.32 for the case 2 (30% reduction), while it is near −0.04 for the cases 3 and 4, indicating near a 70% reduction of the roof suction at that point. Other taps also show a reduction of similar order, indicating that configurations corresponding to Cases 3 and 4, in which turbines are installed closer to the roof edge, are more efficient and result in more decrease in the suctions than the Case 2.
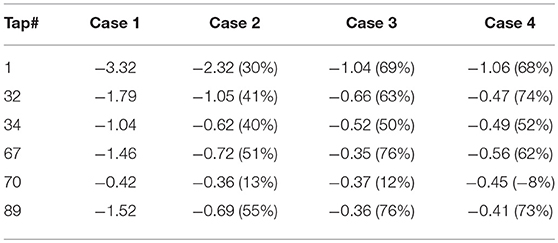
Table 1. Cp mean for selected taps at the wind direction of 45 degrees.
Table 2 presents the Cp min, 3s values for the same group of pressure taps. A very similar trend is also observed here as a reduction of about 60–70% happens for the Cases 3 and 4 and at the taps with highest suctions. As expected, the amount of reduction is less for the taps farther from the roof edge since these taps experience less effect from the turbines. Also as it is observed from the individual tap results (both Tables 1, 2 and Figure 6), the degree of reduction is less for the taps with lower Cp values.
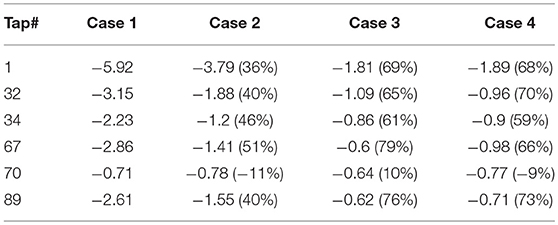
Table 2. Cp min for selected taps at the wind direction of 45 degrees.
Besides investigating individual taps, also the overall pressure distribution on the roof surface is compared in Figure 7. These contours are based on the worst case scenario, which means for each tap the minimum Cp out of all tested wind directions from 0 to 90° (worst direction Cp min) is determined and plotted (i.e., minθ{Cp min(θ)}).
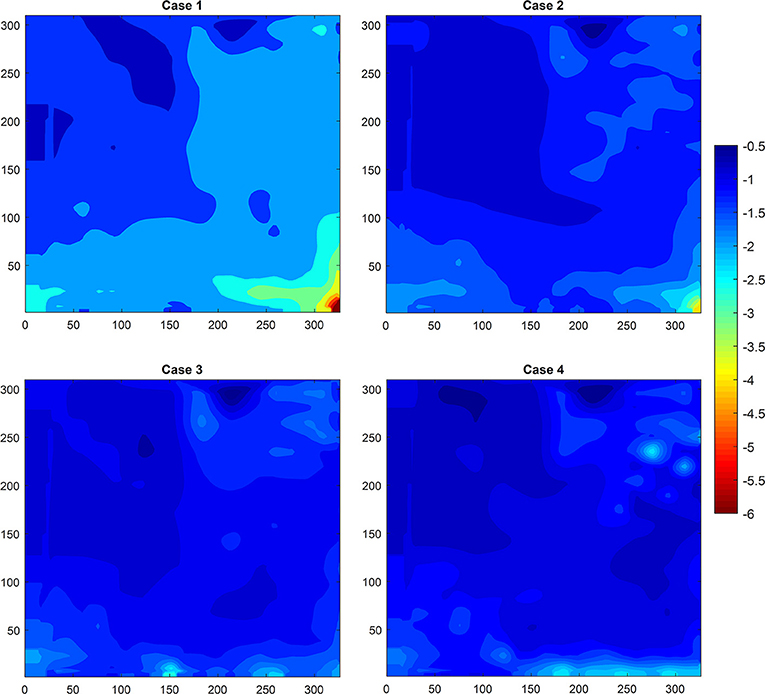
Figure 7. Contour of worst direction Cp min for all four configurations.
According to these plots, in the Case 1 which is a bare deck, Cp min values as high as −6 occur at the corner zone, while on the rest of the roof and away from the corner, a Cp min, 3s of around −1.8 to −2 is dominant. However, when the turbines are installed, these high values are efficiently suppressed. In Case 2, the high-suction area is considerably shrunk and except for a very small corner zone, the rest have Cp values about −1.2, and less. This mitigation effect can be visually assessed by comparing the areas with warm colors (red, orange, light blue) in Case 1 with other cases. The third and fourth turbine configuration (i.e., Case 3 and 4) show the highest reduction both in the peak suctions and also the extent of the areas of high suctions.
In addition to the localized pressures, and from a design perspective, it is important to assess the wind loads on various areas of the roof through an area averaging process. Those areas can be identified based on the dimensions of specific cladding elements or generally based on the zones defined by ASCE7-16 standard by the American Society of Civil Engineers (2016). In this paper, six different areas were defined within the ASCE prescribed zones (ASCE 7-16 Figures 2A, 3) as illustrated in Figure 8. Since the tested wind directions were from 0 to 90° and the turbines were installed at one corner, the defined zones were also confined to the corresponding quarter of the roof area. Zones 2(A), 2(B), 2(C), and 2(D) defined in Figure 8 are all within zone 2 of ASCE, zones 3 and 1 also match the corresponding zone definition in ASCE.
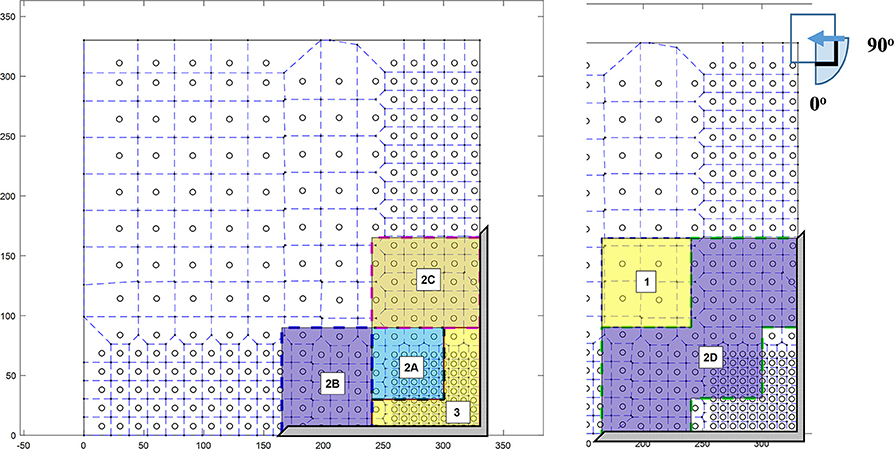
Figure 8. Location of the area averaging zones and the mitigation device.
For a given area (i.e., a zone of interest), the “instantaneous area averaged pressure coefficients” were obtained from pressure time history and corresponding tributary area of each tap. Figure 8 displays the tributary area of each pressure tap which is obtained through the generation of Voronoi diagrams. The contribution of each tap within the zone is determined by calculating the intersection of the tributary area of the tap and the total area of the zone.
The area averaged results for the worst case scenario of each zone (minimum of all directions) are shown in Table 3. For the zone 3 which is the most critical zone with a Cp min, 3s of −1.62 the highest change is observed in Case 3 with about 44% reduction. For the zone 2, the average percentage of peak pressure reduction is about 30% in Case 3, and for the same configuration the zone 1 which is away from the roof edge and the turbines, experiences a 25% reduction of roof suction as a result of the mitigation technique. It should be noted that although the zones 2(B) and 2(C) are geometrically symmetric, but the number of taps covered by them and their relative position to the turbines is slightly different. Because of this difference, a perfect match between the obtained values from these two areas should not be expected.
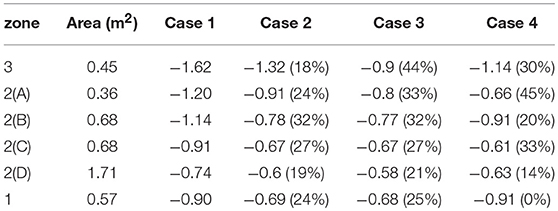
Table 3. Area averaged Cp min, 3s (worst case) values for different test configurations.
In Figure 9, the variation of Cp values with the corresponding prototype area is plotted for the zone 2 and for the Case 1 and Case 3, which is the case with most considerable reduction of roof suction. This plot shows a consistent reduction trend for the whole range of areas with a more pronounced attenuation for the higher Cp values than for the lower values (i.e., larger portions of the roof area.)
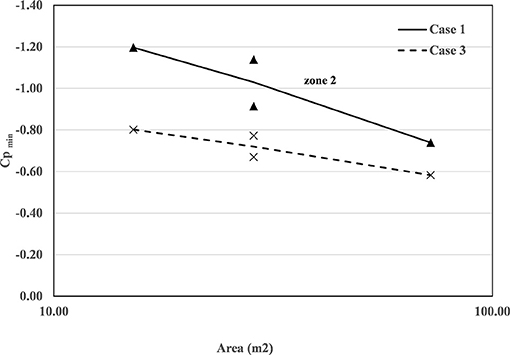
Figure 9. Variation of Cp min,3s vs. effective area in zone 2.
As observed through different sets of results, the configurations of Cases 3 and 4 were more efficient concerning the roof suction mitigation. In these setups, the wind turbines were closer to the roof with h/H values of 0.1 and 0.15, respectively. In Case 3, the turbines were attached to the wall while in the Case 4 they were installed on the roof edge.
The performance of the mitigation technique using wind turbines can be compared to other roof uplift mitigation methods. Kopp et al. (2005) carried out similar studies on a model scale of 1:50 using a “perimetric spoiler” of height 0.0127 m, placed along the edges of a building of 4.6 m height (h/H = 0.002), and obtained 53.8% reduction in area averaged peak Cp in the corner region of the building.
In an earlier study, Bitsuamlak et al. (2013) found 55% reduction in peak Cp on an individual tap located on the roof corner due to the construction of a “wall extension” (wind load mitigation device). Suaris and Irwin (2010) also found 50% reduction of peak Cp on a corner tap by using a 0.2 m high parapet on a 3.67 m high building (h/H = 0.05), through wind tunnel measurements. Likewise, Lin et al. (2008) carried out full-scale measurements on a 3 m high building, using a 0.06 m high porous wall called “aero edge” (h/H = 0.02) and, found 75% reduction of peak Cp on an individual corner pressure tap. Banks et al. (2001) also examined several roof edge elements and reported over 50% reduction in the local pressures near the roof edges.
The results from this study demonstrate the advantage of the AMPS in reducing wind loads on the roof. This technology is particularly useful for existing buildings that are in high wind zones, requiring retrofitting for safer roof design. Based on the results, the AMPS is more effective in cases where it is placed closer to the roof edge. Future experimental studies in this direction must focus on other aspects such as different roof type (e.g., gable/hip roof) and different turbine geometry. Since another functionality of the AMPS is electricity production, the configurations tested should also be examined for the power generation efficiency which is an ongoing research in WOW lab. In addition to that, it is important to know how the different configuration of turbines can alter the pressure distribution on the walls and also to study the load transferred by the turbine system to the structure.
Conclusions
The efficacy of a wind turbine system, named as Aerodynamics Mitigation and Power System (AMPS) (US Patent, Gan Chowdhury et al., Patent Number: US 9,951,752 B2, April 2018), in reducing wind loads on a flat roof building was investigated through experiments at the WOW experimental facility at FIU. The system consists of horizontal axis wind turbines attached to the roof edges and can simultaneously reduce wind damage and provide power to buildings and homes. Four different cases were considered in this study including a roof deck without any mitigation devices on it (a bare deck) and three cases with different configurations for the installation of turbines. The tests were conducted for wind directions ranging from 0 to 90°, in an open terrain condition. Flow visualization conducted using gravels and smoke demonstrated the efficacy of the AMPS in disrupting the conical vortices and preventing the gravel scouring. The rotation of the wind turbines helped to dissipate the vortices by interacting with the wind flow. Localized and area averaged mean and peak Cp values were calculated on the roof surface for all the four cases. The results show that the mean and peak Cp values were attenuated (less suction) in all the cases with the turbines when compared to the bare deck. In the cases 3 and 4 where the turbines were closer to the roof edge, the suctions were significantly reduced as the localized pressure coefficients were reduced by about 70% and the area averaged peak pressure coefficients for the worst wind direction showed a 30–44% decrease in magnitude. The amount of reduction was smaller for less critical locations (i.e., locations with lower suctions and away from the roof edges). The AMPS can also be used to generate electrical energy; however detailed energy quantification is topic of a future research.
Future research is necessary to study: (i) potential wind energy production using the mitigation system under various wind conditions, (ii) effectiveness of AMPS in mitigating wind loading on other kinds of roof geometries (e.g., gable and hip roofs), (iii) integration of AMPS into wall edges/corners of buildings and other structures to reduce wind induced suction generated by separated flows and vortices, and (iv) noise levels and efforts to minimize noise during the operation of the AMPS at high wind speeds (if needed). Another future research task is to perform structural analyses of the support system and connections for attaching AMPS to the structure. Such work will help to estimate the loads on the turbines themselves and loads induced on the structure for various wind directions (including torsional forces, if any).
Author Contributions
AG supervised the experiments and data analyses and revised the manuscript. MM has carried out most of the data analyses and has written sections of this manuscript in collaboration with all the co-authors. BH has helped with the data analyses and writing parts of the manuscript. IZ and PI helped in reviewing and interpreting results and providing input for enhancing the scientific value of the manuscript. AG and AT are co-owners of the patent and conceived the concept of AMPS and conceptualized the experimentation.
Funding
We would like to acknowledge the financial support from the National Science Foundation (NSF Award No. CMMI-1151003; NSF Award No. 1520853).
Conflict of Interest Statement
BH was employed by Florida International University during the time of research. He has since moved to Ennova facades Inc., which has had no influence on this study.
The remaining authors declare that the research was conducted in the absence of any commercial or financial relationships that could be construed as a potential conflict of interest.
Acknowledgments
We greatly acknowledge the help offered by Walter Conklin and Roy Liu-Marques to conduct the experiments at FIU Wall of Wind.
Footnotes
1. ^“ZOC 33/64Px and ZOC 33/64PxX2 Electronic Pressure Scanning Module.” Scanivalve, 2016.
References
American Society of Civil Engineers. (2016). Minimum Design Loads and Associated Criteria for Buildings and Other Structures. Reston, VA: ASCE, 7–16.
Asghari Mooneghi, M., Irwin, P., and Gan Chowdhury, A. (2016). Partial turbulence simulation method for predicting peak wind loads on small structures and building appurtenances. J. Wind Eng. Ind. Aerodyn. 157, 47–62. doi: 10.1016/j.jweia.2016.08.003
Bahaj, A. S., Myers, L., and James, P. A. B. (2007). Urban energy generation: influence of micro-wind turbine output on electricity consumption in buildings. Energy Build. 39, 154–165. doi: 10.1016/j.enbuild.2006.06.001
Banks, D., and Meroney, R. N. (2001). A model of roof-top surface pressures produced by conical vortices : evaluation and implications. Wind Struct. 4, 279–298. doi: 10.12989/was.2001.4.4.279
Banks, D., Sarkar, P. P., Wu, F., and Moroney, R. (2001). “A device to mitigate vortex induced rooftop suction,” in Presented at the Americas Conference onWind Engineering (Clemson, SC).
Bitsuamlak, G. T., Warsido, W., Ledesma, E., and Chowdhury, A. G. (2013). Aerodynamic mitigation of roof and wall corner suctions using simple architectural elements. J. Eng. Mech. 139, 396–408. doi: 10.1061/(ASCE)EM.1943-7889.0000505
Blessing, C., Chowdhury, A. G., Lin, J., and Huang, P. (2009). Full-scale validation of vortex suppression techniques for mitigation of roof uplift. Eng. Struct. 31, 2936–2946. doi: 10.1016/j.engstruct.2009.07.021
Cochran, L. S., Cermak, J. E., and English, E. C. (1995). “Load reduction by modifying the roof corner vortex,” Presented at the 9th International Conference on Wind Eng (New Delhi).
Eamon, C. D., Fitzpatrick, P., and Truax Dennis, D. (2007). Observations of structural damage caused by Hurricane katrina on the Mississippi Gulf coast. J. Perform. Constr. Facil. 21, 117–127. doi: 10.1061/(ASCE)0887-3828(2007)21:2(117)
Gan Chowdhury, A., and Moravej, M. (2018). Large scale wind tunnel simulation of a low-rise residential building. Dataset. doi: 10.17603/DS2CT2K
Gan Chowdhury, A., Zisis, I., Irwin, P., Bitsuamlak, G. T., Pinelli, J.-P., and Hajra, P. (2017). Large-scale experimentation using the 12-fan wall of wind to assess and mitigate Hurricane wind and rain impacts on buildings and infrastructure systems. J. Struct. Eng. 143:04017053. doi: 10.1061/(ASCE)ST.1943-541X.0001785
Gavanski, E., Kordi, B., Kopp, G. A., and Vickery, P. J. (2013). Wind loads on roof sheathing of houses. J. Wind Eng. Ind. Aerodyn. 114, 106–121. doi: 10.1016/j.jweia.2012.12.011
Habte, F., Asghari Mooneghi, M., Gan Chowdhury, A., and Irwin, P. (2015). Full-scale testing to evaluate the performance of standing seam metal roofs under simulated wind loading. Eng. Struct. 105, 231–248. doi: 10.1016/j.engstruct.2015.10.006
Irwin, H. P. A. H., Cooper, K. R., and Girard, R. (1979). Correction of distortion effects caused by tubing systems in measurements of fluctuating pressures. J. Wind Eng. Ind. Aerodyn. 5, 93–107. doi: 10.1016/0167-6105(79)90026-6
Kopp, G. A., Mans, C., and Surry, D. (2005). Wind effects of parapets on low buildings: part 4. Mitigation of corner loads with alternative geometries. J. Wind Eng. Ind. Aerodyn. 93, 873–888. doi: 10.1016/j.jweia.2005.08.004
Lin, J., and Surry, D. (1993). “Suppressing extreme suction on low buildings by modifying the roof corner geometry,” Presented at the 7th National Conference on Wind Engineering Proceedings, University of California, Department of Civil/Environmental Engineering (Los Angeles, CA).
Lin, J. X., Montpellier, P. R., Tillman, C. W., and Riker, W. I. (2008). “Aerodynamic devices for mitigation of wind damage risk,” in Proceedings of The 4th International Conference on Advances in Wind and Structures(AWAS'08) (Jeju).
Lu, L., and Ip, K. Y. (2009). Investigation on the feasibility and enhancement methods of wind power utilization in high-rise buildings of Hong Kong, Renew. Sustain Energy Rev. 13, 450–461. doi: 10.1016/j.rser.2007.11.013
Meloy, N., Sen, R., Pai, N., and Mullins, G. (2007). Roof damage in new homes caused by Hurricane Charley. J. Perform. Constr. Facil. 21, 97–107. doi: 10.1061/(ASCE)0887-3828(2007)21:2(97)
Moravej, M. (2018). Investigating Scale Effects on Analytical Methods of Predicting Peak Wind Loads on Buildings. FIU Electronic theses and Dissertations Paper, Florida International University.
Moravej, M., Chowdhury, A. G., Irwin, P. A., Zisis, I., et al. (2015). “Dynamic effects of wind loading on photovoltaic systems,” Presented at the 14th International Conference on Wind Engineering (ICWE14) (Porto Alegre).
Moravej, M., Irwin, P., Zisis, I., Chowdhury, A. G., and Hajra, B. (2017). Effects of roof height on local pressure and velocity coefficients on building roofs. Eng. Struct. 150, 693–710. doi: 10.1016/j.engstruct.2017.07.083
Naeiji, A., Raji, F., and Zisis, I. (2017). Wind loads on residential scale rooftop photovoltaic panels. J. Wind Eng. Ind. Aerodyn. 168, 228–246. doi: 10.1016/j.jweia.2017.06.006
Sayyafi, E. A., Chowdhury, A. G., and Mirmiran, A. (2018). Innovative Hurricane-resistant UHPC roof system. J. Archit. Eng. 24:04017032. doi: 10.1061/(ASCE)AE.1943-5568.0000290
Suaris, W., and Irwin, P. (2010). Effect of roof-edge parapets on mitigating extreme roof suctions. J. Wind Eng. Ind. Aerodyn. 98, 483–491. doi: 10.1016/j.jweia.2010.03.001
Keywords: wind turbine, Wall of Wind, wind load, low-rise building, wind energy, roof uplift, hazard mitigation
Citation: Gan Chowdhury A, Moravej M, Zisis I, Irwin P, Tremante A and Hajra B (2019) Mitigation of Aerodynamic Uplift Loads Using Roof Integrated Wind Turbine Systems. Front. Built Environ. 5:10. doi: 10.3389/fbuil.2019.00010
Received: 30 October 2018; Accepted: 21 January 2019;
Published: 11 February 2019.
Edited by:
Teng Wu, University at Buffalo, United StatesReviewed by:
Lixiao Li, Shenzhen University, ChinaFranklin Lombardo, University of Illinois at Urbana-Champaign, United States
Copyright © 2019 Gan Chowdhury, Moravej, Zisis, Irwin, Tremante and Hajra. This is an open-access article distributed under the terms of the Creative Commons Attribution License (CC BY). The use, distribution or reproduction in other forums is permitted, provided the original author(s) and the copyright owner(s) are credited and that the original publication in this journal is cited, in accordance with accepted academic practice. No use, distribution or reproduction is permitted which does not comply with these terms.
*Correspondence: Ioannis Zisis, aXppc2lzQGZpdS5lZHU=