 Sheng-Lin Lin
 Andrew King2
 Nick Horspool
 Ryan Paulik
 Shaun Williams
- 1GNS Science, Wellington, New Zealand
- 2Retired, Wellington, New Zealand
- 3National Institute of Water and Atmospheric Research, Wellington, New Zealand
Rapid and profound changes in the technology used for data acquisition, computing and information management provides a framework that has the potential to allow communities to consider acquiring, analyzing and managing data in new ways. Improving the collection and management of data, immediately in post-disaster reconnaissance and in long-term impact assessments, is central to enabling knowledge of such events to be used and applied to improving community resilience to those disasters. This paper presents the development and applications of an integrated and extensible framework for the capture of attribute data that describes pre-disaster physical characteristics and post-disaster damage of assets within our communities. The framework, referred to as Real-time Individual Asset Attribute Collection Tool (RiACT) and its associated Asset Repository Web Portal, enables data capture by direct field observations of asset attributes. It also includes the real-time transfer of these field observations to the web portal and/or the download of previously acquired history and metadata of any specific asset of interest to the observer whilst they are in the field. The use of this framework enables improved understanding of asset portfolios within the context of risk reduction and readiness, as well as facilitating efficient and rapid capture of damage distribution across the affected region. This in turn supports better decision making for a quicker disaster response and recovery. This paper presents a review of the existing state-of-art data collection methodologies and describe the development of an improved tool and its Information Technology architecture. Experiences and challenges in applying the framework are highlighted through: (1) the capture of community data in Viet Nam for a multi-hazard assessment in 2014 and 2018, the refinement of asset data related to residential buildings in the Greater Wellington region in 2016, and a survey of building types in Tanna, Vanuatu in 2018; (2) facilitating training in field data capture processes in Indonesia in 2015, as well as in Samoa and Vanuatu in 2017; (3) collection of asset damage data following the 2016 Kaikoura earthquake in New Zealand, the 2016 Tropical Cyclone Winston in Fiji and the 2015 Illapel earthquake and tsunami in Chile.
Introduction
Importance of Post-disaster Reconnaissance
The Sendai Framework for Disaster Risk Reduction 2015–2030 (UNISDR, 2015), which was endorsed by the United Nations (UN) General Assembly, aims to guide the multi-hazard management of disaster risk in development at all levels, as well as within and across all sectors. The Sendai Framework has four priorities for action to reduce existing disaster risk and for the prevention of new risks. The four priorities are: (1) Understanding disaster risk; (2) Strengthening disaster risk governance; (3) Investing in disaster reduction for resilience; and (4) Enhancing disaster preparedness for effective response and to “Build Back Better” in recovery, rehabilitation and reconstruction.
Post-disaster reconnaissance (i.e., damage and loss data collection and management), addresses all four of the Sendai Framework priorities. The goal of research and practice in disaster risk reduction (DRR) and the aim of the Sendai Framework is to improve the performance of systems (i.e., physical, social and economic) and assets (e.g., buildings, infrastructure, agriculture etc.) before, during and after disasters to provide a safer environment, thereby supporting community resilience. Through field investigations following damaging hazard events in the last few decades, along with theoretical and experimental studies, significant advancements have been gained in various fields including the understanding of disaster characteristics from source mechanisms, structural behavior, and social and economic impacts. Post-disaster damage assessment is critical as observed data collected after an event provides useful information to researchers, decision makers, humanitarian aid workers and donors to inform efforts in all phases of the disaster cycle; reduction, readiness, response and recovery.
The importance of new understanding and knowledge gained from post-disaster damage assessments, notwithstanding challenges related to efficient, comprehensive and precise damage data collection and management, has long been recognized (Porter, 2002; Greene et al., 2004). Within days or weeks of a disaster, rapid damage identification and analysis is used to spatially and temporally inform emergency aid distribution efforts, determine which sectors require support, identify priorities for recovery funding and other forms of support. In addition, a database of building and infrastructure characteristics and observed damage provides valuable insights to refine current design standards and to improve resilience, understanding of changing risk patterns and loss modeling. The importance and value of post-disaster damage data collection and management was clear following the Canterbury earthquake sequence (Galloway and Hare, 2012), in which the residual capacity of many buildings needed to be evaluated and reported as quickly as practical to enable people to be housed and businesses to continue operating.
Post-disaster Damage Data Collection History
Damage data collection is a key task in post-disaster reconnaissance. Damage data collection is defined herein as the inventory of damage to physical assets such as residential buildings, public buildings, industries and commercial buildings, infrastructure, agricultural crops, etc. Traditionally, paper-based surveys by teams/individuals have been carried out to gather the required information. Such a method takes considerable time and effort to process the manual data captured and to complete the required actions post an event. More recently, rapid changes in the technology used for spatial data acquisition and computing and information management, provides a framework that has the potential to allow communities to consider acquiring, analyzing and managing damage data in innovative ways. Improving data collection and management in post-event reconnaissance surveys as well as in long-term impact assessments, is central to enabling knowledge of such events to be used and applied to informing decisions that improve community resilience to those events.
In recognition of the above needs of data capture and management, and by taking advantage of the rapid development of information and communication technology, several digital tools have been developed to directly record observations of the built environment at risk to earthquake impacts. For example, the Earthquake Engineering Research Institute (EERI) ERS (Greene et al., 2004), the Federal Emergency Management Agency (FEMA) ROVER (www.fema.gov/rapid-observation-vulnerability-and-estimation-risk), the Global Earthquake Model (GEM) DO Android tool (Foulser-Piggott et al., 2013), the Harvard Humanitarian Initiative (HHI) KoBoToolBox (www.kobotoolbox.org) and the Natural Hazards Engineering Research Infrastructure (NHERI) DesignSafe Cyber Infrastructure (CI) (www.designsafe-ci.org) along with a smartphone data capture application called Fulcrum (www.fulcrumapp.com).
Despite these advancements in data collection and management tool development, challenges and limitations remain. For instance, support is no longer available for the EERI ERS tool development since its first publication in 2004, hence its application might be limited due to out-of-date technology. GEM DO Android, by contrast, was developed using the current information technology of portable devices. Specific strengths of this option are the use of widely available Android OS, the display and use of a device-enabled global positioning system (GPS) and maps, and built-in relatively high-resolution cameras. However, asset information (i.e., attributes specified in DO Android tool) collection using the tool was restricted to GEM taxonomy and not easily modified. In addition, data acquired was locally stored on each collection device and needed to be manually uploaded and merged following each field survey; an inconvenience when direct download is available, but a necessity when communication channels are disrupted.
Recently, NHERI has developed a set of cyber infrastructures that enable natural hazard engineering communities to further explore computational modeling and data management toward improving our understanding of the impact from natural hazards. DesignSafe-CI, a web-based research platform, is one of these tools which was developed to manage and analyse critical data. DesignSafe-CI features integrated data analysis, sharing and publication. For example, through the Recon Portal, users can upload and share their reconnaissance survey, images and other relevant datasets. Furthermore, when arranging data collection using Fulcrum or other similar data collection tools, the field-captured information can be seamlessly transferred into the Recon Portal. DesignSafe-CI and Fulcrum were used to capture building and infrastructure damage, and water markers following the 2017 Hurricane Harvey in Texas, United States (Roueche et al., 2018). However, as all captured data are stored in the Fulcrum server, additional tasks are needed when processing the data (i.e., downloading from Fulcrum and then uploading to DesignSafe-CI). The archive of surveyed data on the Fulcrum server also introduced concerns on data control, as personal or sensitive information might be contained in some datasets. Due to its on-going development, the current DesignSafe-CI seems to focus on data visualization with limited data editing (e.g., modify survey attributes or add missing information) and analysis abilities (e.g., data extrapolation from survey samples).
Due to the above limitations, an improved data collection system was developed by GNS Science in 2014 (Lin et al., 2014). It included development of an integrated and extensible framework for the capture of attribute data that describes the characteristics (pre-disaster) and damage (post-disaster) of assets. The framework, referred to as Real-time Individual Asset Attribute Collection Tool (RiACT), Inventory Repository (IR) and asset repository web portal (WEB), enables data capture by direct field observations of asset attributes and/or damage data. In this paper, we discuss the development and implementation of the developed framework and its components. Examples of applications are also presented to illustrate the efficacy of this approach.
Development of Field Data Collection Framework
Field Data Collection Framework
The schematic representation in Figure 1 illustrates the RiACT field data collection framework (Lin et al., 2014) and how its components are combined to achieve the main goal of this development. RiACT uses direct observations, its real-time telecommunication, its georeferencing (i.e., background satellite image maps along with a global positioning system, GPS) and photo-taking (i.e., on-board camera) abilities to collect the characteristics and/or damage conditions of each asset feature. It is noted that asset location determined via GPS has been a severe limitation in the past as often it is important to have more accurate location data. To improve this, RiACT uses a tablet GPS to locate observers in the asset vicinity, while the background maps enable the actual location of the surveyed asset to be verified. Because of this improvement, the conventional geocode process of converting street addresses into geographic coordinates (e.g., latitude and longitude) is no longer required. The uncertainty from geocoding verification could therefore be removed.
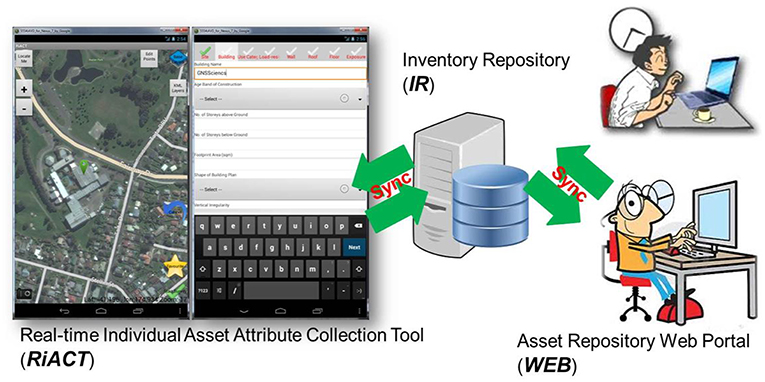
Figure 1. Schematic of the integrated exposure data development framework.
Upon completion of each record, it is stored within the tool and transmitted via mobile internet connection (if available) to the inventory repository (IR). Meanwhile, the recorded information can be modified on/or off-field, and new assets (e.g., individual buildings) can be added to the IR via the WEB either as individual records or batch uploads from spreadsheet compatible files (i.e., comma-separated-values, CSV). The IR can also be updated with additional building information such as design drawings or other PDF files. These can, on request from the field surveyors, be downloaded to RiACT to provide the field inspection team full access to previously available building data to which new or modified data can be added (e.g., damage data) and managed.
The data collection framework has been developed following the methodology and communication protocol described above. The three key components—RiACT, IR, and the WEB—have been developed and tailored to build the framework which includes secure communication between each component. Preliminary improvements and new features are presented and discussed in the following sections.
Improvement and Features
As previously discussed, limitations with older data capture tools such as restricted application and tedious data management in GEM DO, data control and limited editing functions of Fulcrum and DesignSafe-CI, respectively, for example, remain a challenge. To resolve the above obstacles, a next-generation data capture tool referred to as RiACT was developed. Its development and features are described below.
Real-Time Individual Asset Attribute Collection Tool (RiACT)
By taking advantage of the open-source feature of GEM DO Android as well as eliminating duplication of effort, RiACT was developed based on the publicly available DO Android tool. Significant enhancements have been introduced and implemented in RiACT as detailed below.
• Accurate georeferencing: By using the device-enabled GPS ability to acquire its location on the fly from either online maps or off-line satellite images, RiACT provides a more efficient, reliable, and user-friendly way (i.e., seeing and locating the asset of interest via high-resolution satellite images) to record the correct georeferenced asset location—a major improvement over earlier data capture systems.
• Real-time data collection: RiACT was designed as a local server to store all the captured data in addition to being able to communicate in real-time through WiFi or 3G with the IR once the internet is accessible.
• Efficient data recording: with its communication ability, RiACT provides a more rapid data capture procedure by downloading any existing attributes known about the building/infrastructure of interest, allowing the field inspection team to verify/amend this data and update it accordingly.
• Flexible and reliable data archiving: like DO Android, RiACT allows users to export recorded data into various file formats, such as database (i.e. *.db3) and comma-separated-values (i.e., *.csv) locally within tablets. The ability to store and retrieve survey data locally (i.e., data being exported as spreadsheet files locally to tablets and then transferred to any computer for other applications) provides one additional control to data which contains personal or sensitive information. By contrast, if the confidentiality is not a concern, with its telecommunication ability, RiACT can manage data more efficiently and reliably by merging and storing all the perishable data automatically into the IR.
In addition to the above enhancements which are attributed to its real-time communication ability, other key enhancements of RiACT include easy accessibility and editing of survey templates (via XML text files) and its calculation capacity (e.g., %NBS (new building standard) and risk ranking for New Zealand buildings).
Like other data capture tools, RiACT was first designed for building assessments due to earthquake hazards. However, with its easily edited templates, RiACT has been further developed to be used for post-disaster assessment associated with other natural hazards (e.g., flood, wind, tsunami, landslide, etc.) and other assets (e.g., infrastructure and crops).
Inventory Repository (IR)
The main role of the Inventory Repository (IR) is to archive all the building/infrastructure data which can be captured in the field, or recorded via website, or both. In addition, it is intended to provide a unique and flexible platform to manage various data. To do so, three key modules, namely Master Repository, Project Repository, and Attributes Customization module were proposed and developed, as shown in Figure 2.
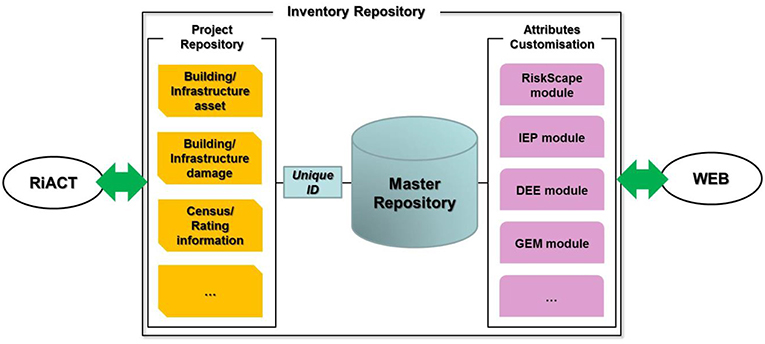
Figure 2. Inventory Repository structures.
As described in the previous section, RiACT can communicate with IR in real-time once the internet is accessible. An obvious problem with the above process is the data version control, namely attribute verification between existing data, field survey data and data modified via the web portal. To facilitate the uploading and downloading of requests as well as to meet various applications (i.e., different attributes of interest or different level of data), the Project Repository module was designed to store data for each individual project. For example, projects entitled “Building/Infrastructure asset” and “Building/Infrastructure damage” store data before and after events. On the other hand, the Attributes Customization module was designed to suit various applications. For example, the RiskScape module can acquire information from the Master Repository and then reformat it to be compatible with RiskScape, a multi-hazards regional impact modeling tool (Schmidt et al., 2011). The GEM module can generate a GEM-Building-Taxonomy-compatible string, which describes the characteristics of a building. Nevertheless, data in both the Project Repository and Attributes Customization module are archived in the Master Repository, the highest hierarchical module in IR. It is worth noting that a building/infrastructure identification system was implemented in the Master Repository to facilitate mega-data management. Hence, a unique identifier (also storage space) is assigned to the same building/infrastructure, though its attributes might be retrieved from various Project Repositories.
Asset Repository Web Portal (WEB)
As an extension of the IR component, and in conjunction with providing an easily accessible platform for data management and sharing with other datasets needed for asset evaluations, a web-based asset repository (WEB) was developed. WEB contains the recorded asset information, and contains several advanced features which include:
• Data security protection: a website with a confidential login information requirement was designed. Access to portfolio(s) (i.e., sets of data) varies between user account levels.
• Data entry: asset data can be edited/added via the portal, and can be synchronized with the IR.
• Data extrapolation: extrapolation of sampled data is the process to take information from the surveys, along with other information such as homogeneous area layers and local asset characteristics and apply it to populate assets with required attributes in the whole study area.
• Result presentation: report context and format can be developed to suit its application needs, such as standardized post-disaster reports.
For each dataset (portfolio), the spatial distribution and attribute information (e.g., age band of construction) of the assets can be presented on a map. Additional dataset management, such as upload/download of datasets as spreadsheet files, export of RiskScape compatible asset layer for modeling, and data extrapolation, are also available via WEB interface. A filter function is also available to focus on assets of interest as shown in Figure 3A. By clicking on the individual asset of interest, all the information (including images) archived in the inventory repository is presented and readily available for editing/adding via the portal, as shown in Figure 3B.
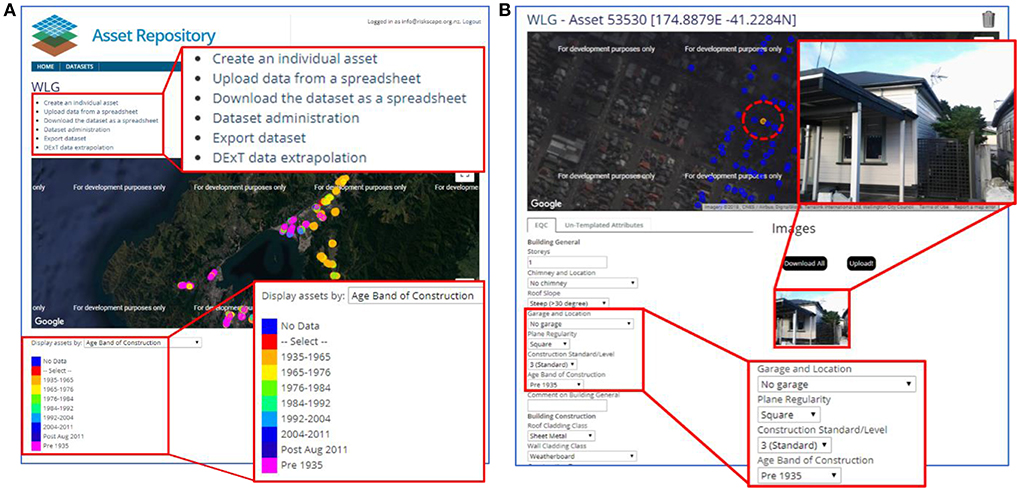
Figure 3. (A). Additional dataset management and spatial distribution of all assets within a portfolio. (B). Recorded and editable attributes, including images of the selected asset.
In this section, refined approaches implemented in RiACT, IR and the asset web portal were discussed. All the above-mentioned enhancements have been developed, tested and used for data collection successfully. With its real-time communication and easily accessible environment, RiACT along with the asset repository web portal facilitates more efficient data capture and management, as well as extends its implementations. The next section illustrates RiACT applications in pre- and post-disaster data collection and training.
Applications
The use of RiACT enables an improvement of understanding of asset portfolios within the context of risk reduction and planning, as well as supports better decision making regarding disaster response. Since its pilot study in Viet Nam for multi-hazard assessment (GNS Science, 2015), the data collection framework has been used for: (1) the capture of exposure data in the Greater Wellington region (Tonkin and Taylor, 2017) and Christchurch in New Zealand, the exposure attributes and damage information collected in the North Central Coast of Viet Nam in 2018 (Lin et al., 2018), and building survey in Tanna, Vanuatu in 2018; (2) facilitating training in field data capture processes in Indonesia (Glassey et al., 2015), Samoa and Vanuatu (Ungaro et al., 2017), and within New Zealand (e.g., University students and faculties, researchers and engineers); (3) collection of damage data following the Kaikoura earthquake (2016), the Illapel earthquake and tsunami (Paulik et al., 2017) and wind damage from Tropical Cyclone Winston in Fiji (Paulik et al., 2016). Selected applications for various purposes are described below. Finally, protocols and ethical guidelines learned from various applications are discussed.
Exposure Inventory Development
Viet Nam Exposure Dataset Development
The Viet Nam—New Zealand Dam Safety Project is a project funded by the New Zealand government (Ministry of Foreign Affairs and Trade, MFAT). The goal of this project is to reduce the risk and impact of dam failures and flooding in the Ca River catchment, Nghe An and Ha Tinh Provinces, Viet Nam. One focus of the project is to build capability in data management and risk modeling. Thus, case studies that demonstrated the potential consequences of dam-related flooding to downstream communities were conducted to maximize awareness and uptake by key stakeholders in Viet Nam.
An exposure dataset is one of the critical components of the above dam failure and associated flood risk modeling scenarios. It can also be one of the most difficult to create. When small numbers of buildings are involved (e.g., less than a thousand or so), it may be practicable to view each building and to acquire all the necessary attributes with a reasonable level of confidence. For regional or national-scale projects, however, the task is next to impossible.
Ideally, for each building within the modeling areas we would know the location and replacement value and have enough structural information to underpin the assignment of vulnerability functions for flood hazards. Such datasets are uncommon and do not exist in Viet Nam, though various exposure databases have been developed for various purposes in the past few decades. Hence, a systematic approach was developed to populate and maintain a less rigorous, but practical, exposure dataset for use in flood risk modeling.
The methodology involved surveying buildings, creating classes of typical building types, and extrapolating building types to create datasets for the entire study area. After consulting the local construction and engineering practitioners of building types, and interpretation of available aerial data, the required attributes were defined for each building in the asset database. Attributes considered in this study include floor height (above ground level), ground floor area, total floor area (ground floor multiplied by the number of stories), construction materials (e.g., frame and wall materials), use category, quality of construction (rated on a scale of 1 (informal) to 5 (superior), and 3 for standard) and structural design (any significant weakness).
A field survey to determine typical building types was undertaken in early March 2014. The survey team consisted of 11 people and was completed over 4 days. Over 700 buildings were surveyed, and the data captured and archived in real-time using the RiACT application and installed on five Android tablets with 3G connections for live upload capability. Most buildings were surveyed in the Thai Hoa area but ~100 buildings in more remote rural areas were surveyed to capture any different construction types in those locations.
Information gathered from the building survey [e.g., construction age band (Table 1) and material (Table 2), and ground floor height (Table 3)] was used to extrapolate building attributes for the non-surveyed areas in Thai Hoa and other areas affected by flood inundation in Nghe An Province. Four age bands of construction, namely” pre 1950,” “1950–1970,” “1970–1990,” and “1990-” were used to present the survey results. The age bands represent the history of socio-cultural influence in Vietnamese housing. For example, the architectural design and construction materials after the economic reform in 1986 (i.e., “1990-”) are different from that used previously after reunification (i.e., “1970–1990”), the French colonialism and the Vietnam War (i.e., “1950–1970”), and the Feudal period with Chinese influence (i.e., “pre 1950”) (Ly, 2012).
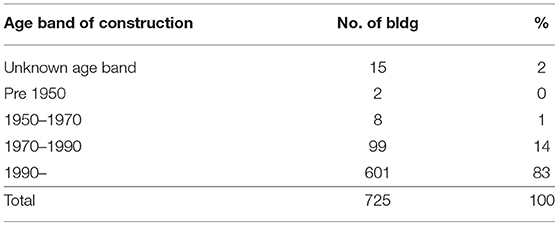
Table 1. Surveyed buildings in different age band of construction.
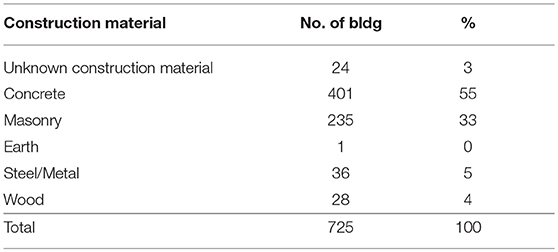
Table 2. Surveyed buildings in different construction material.
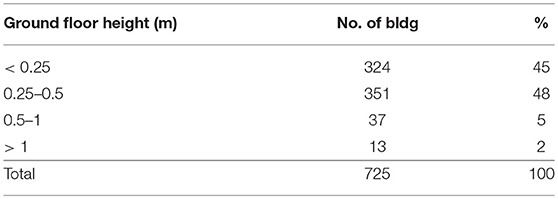
Table 3. Surveyed buildings in different ground floor height (m).
Another field building survey was undertaken in May 2018. The survey team consisted of 7 researchers from Thuyloi University and GNS Science and was completed over 3 days. Around 500 buildings in Ha Tinh Province were surveyed, and the data was captured and archived in real-time using RiACT and transmitted live to the asset repository.
Damage and hazard data (i.e., water depth) from previous events (e.g., the damage from the 2010 and 2016 floods) were collected due to the extensive damage across the survey areas and its influence on the construction practices in the regions. For example, a modern multi-story concrete building alongside an old (i.e., pre-1999) one-story building was very common in this area, as well as elevated ground floor levels to cope with future floods (Figure 4).
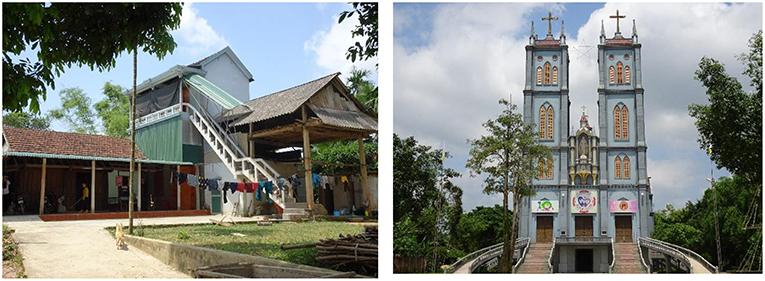
Figure 4. Improved construction practice to cope with the potential floods.
Typical Vanuatu Building Survey in Tanna
To develop the exposure dataset for Tanna Island to undertake a volcanic ashfall impact assessment, a review of existing asset information was first conducted and where gaps were identified, new survey datasets were created using RiACT. This was done to ensure that necessary asset information for impact modeling was collected to create classes of typical building types, and extrapolation of these building types was completed to create datasets for the entire study area.
Building types were determined through a field survey that was undertaken in January 2018. The survey team consisted of 10 people and was completed over 3 days. In addition to understanding the building types in Tanna, questionnaire interviews were conducted to better quantify and understand different impacts of ash fall on buildings, people and crops for use in the modeling analysis. Over 100 buildings were surveyed across 13 villages located inside the ash fall covered zone and Lénakel town area. Like the Viet Nam application, the data were captured and archived in real-time using RiACT. The statistics derived from the survey samples were used to populate asset attributes for the given study area. Different from other applications, information gathered from questionnaire interviews [e.g., ashfall impact on household (Table 4) and on buildings (Table 5)] also provided valuable insight when verifying hazard intensity and impact.
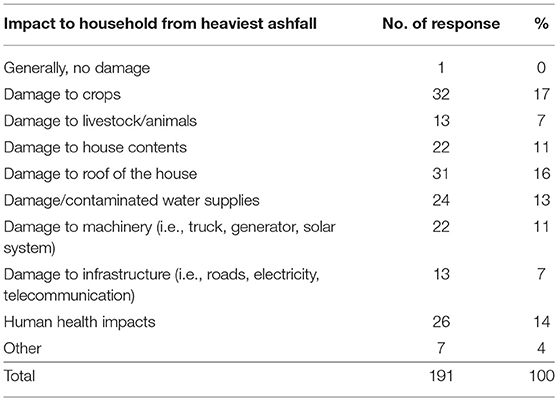
Table 4. Questionnaire interview results in heaviest impacts on household.
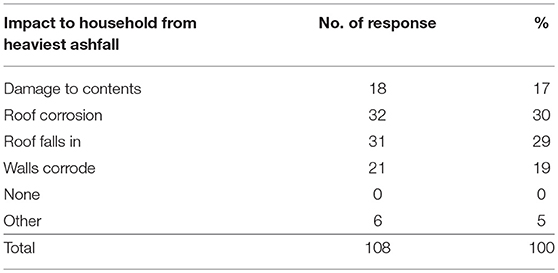
Table 5. Questionnaire interview results in ashfall impacts on buildings.
Wellington Residential Building Dataset Improvement
GNS Science was commissioned by the New Zealand Earthquake Commission (EQC) to contribute to the development of a liquefaction model for EQC's seismic loss model, MINERVA (Shephard et al., 2002).
A field survey was undertaken in early July 2016 to collect basic information of residential building characteristics around the Wellington Region. Information collected included foundation types, building age, roof types and wall cladding types (weatherboard, sheet material, masonry veneers). The survey team was consisted of 8 people from the University of Canterbury, Victory University of Wellington and GNS Science.
The survey was completed over 4 days. Over 3,000 buildings were surveyed, and the data was captured and archived in real-time using RiACT. Three age bands, namely “Pre-1935,” “1935–1976,” and “1976 on” were used to present the survey results. The age bands represent transitions in the architecture and seismic design of residential buildings in New Zealand (e.g., “1976 on,” representing buildings constructed after major upgrades were made to buildings from about 1976).
Though the survey was conducted by civil and architectural engineering students with appropriate training, there were certainly some challenges when collecting building attributes, in particular when assigning building age. Fortunately, the EQC portfolio make up over 95% of the residential building stock in New Zealand. These are one- or two-story buildings of three different vintages (“Pre-1935,” “1935–1976,” and “1976 on”). They cover a range of wall and roof cladding types and architectural design as shown in Figure 5. Therefore, the EQC building age attribute is used for the refined exposure dataset and a reference when conducting field survey. Tables 6–8 summarize several key attributes of the surveyed buildings in the Wellington region. As shown, piles, perimeter footing and slab are the major foundation types for buildings constructed before 1935, 1935–1976, and after 1976, respectively. In terms of cladding materials, most of the residential houses have weatherboard wall cladding and light roof profiles.
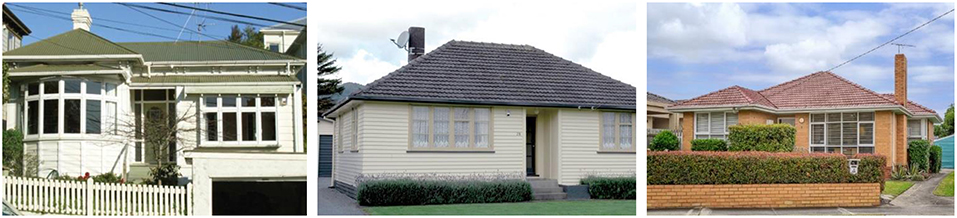
Figure 5. Typical pre-1935 (left), 1935-1976 (central) and post 1976 (right) residential house in New Zealand (BRANZ, 2019).
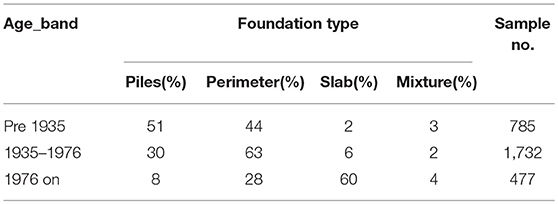
Table 6. Distribution of foundation types in various age bands.
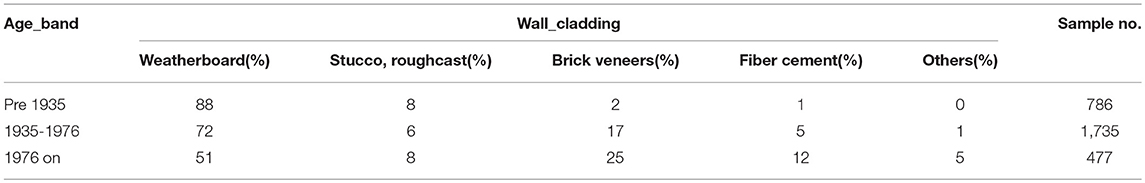
Table 7. Distribution of wall cladding types in various age bands.
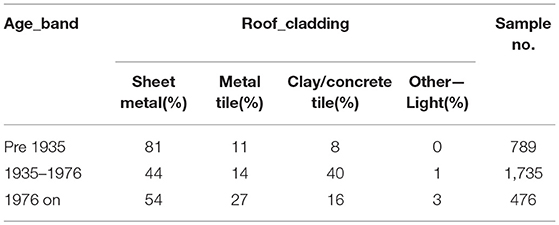
Table 8. Distribution of roof cladding types in various age bands.
To verify the survey data, comparisons of various attributes using existing EQC portfolio have been made, as shown in Tables 9, 10. Generally, the survey data met well with that in the EQC portfolio though there is some inconsistency which was expected (e.g., the weatherboard and fiber cement of the wall cladding).
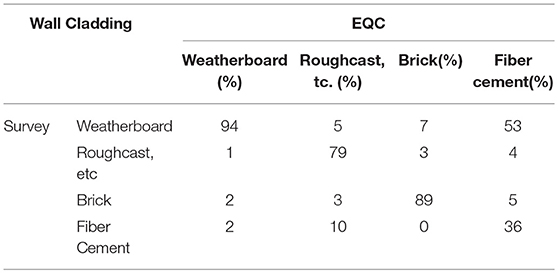
Table 9. Comparison of wall cladding between EQC portfolio and survey data.
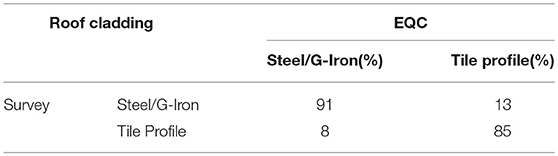
Table 10. Comparison of roof cladding between EQC portfolio and survey data.
Post-disaster Damage Survey
Post-earthquake Damage Survey in Kaikoura, New Zealand, 2016
On the 14th November 2016, a Mw 7.4 earthquake hit the Kaikoura area in New Zealand (Hamling et al., 2017), causing widespread building and infrastructure damage. The most extensively damaged areas included Seddon, Ward, Kaikoura, Hanmer, Waiau, Culverden, and Cheviot in the South Island, and Wellington in the North Island. Though this event caused significant impact to the environment and communities in these areas, it provided an opportunity to collect information on damage to different building and infrastructure types from extreme earthquake shaking.
Two teams consisting of scientists and engineers from the National Institute of Water and Atmospheric Research (NIWA) and GNS Science used RiACT to collect damage information for buildings over a three-day period between November 29th and December 1st, 2016. RiACT's capability to record GPS coordinates of surveyed sites and linking them to electronic damage survey forms and photos allowed efficient and fast damage data collection. Each night the collected data was transferred to the asset repository web portal so that the surveyed data could be reviewed, and the next day's survey activities could be planned accordingly.
In addition, by combining RAPID building assessment from the local government agency (e.g., Marlborough District Council) with RiACT survey, the building damage distribution was presented via various maps to decision-makers (e.g., regional Emergency Coordination Center, ECC) to inform emergency response planning (Woods et al., 2017).
One week later, RiACT was used to collect damage on infrastructure, namely bridges, roads, and the water supply network, by another team of scientists from GNS Science along with engineers from industry. The recorded damage from these earthquakes to buildings and infrastructure, along with instrumental shaking intensity provided a basis for further development of associated vulnerability models (i.e., damage or fragility functions). These models can then be applied in risk modeling tools (e.g., RiskScape) to estimate asset damage and economic losses in future earthquake events.
Post-tsunami Building and Infrastructure Damage Survey, Illapel, Chile, 2015
On 16th September 2015, a Mw 8.3 Illapel Earthquake off the coast of central Chile generated a moderate sized tsunami (~5 m on local tide gauges) that locally inundated and damaged infrastructure assets in Coquimbo, Los Vilos and Concon. Buildings and infrastructure at the coastal settlement of Coquimbo were severely impacted by tsunami inundation.
The absence of published empirical tsunami fragility functions for infrastructure components provided an incentive to conduct a post-disaster survey and collect valuable damage data in Coquimbo. Eight days after the event, a damage survey was conducted by a group of 5 researchers representing New Zealand Crown Research Institutes, universities and local government tsunami research groups.
In the survey lead up, RiACT data templates were configured for tsunami hazard and multi-infrastructure damage data collection. This enabled a significant volume of tsunami hazard exposure and infrastructure damage observations to be collected across the 2.3 km2 survey area over a 4-day period. Tsunami flow inundation depths were measured at 978 locations. Asset attributes and damage states were recorded for over 3,000 infrastructure components including; electricity (power/utility poles, streetlights, traffic lights), telecommunications (cables), transport [footpaths, railways, roads, port structures (wharfs, seawalls)], and water systems (culverts, drains, pipelines, pump stations). Structural and non-structural components vulnerable to tsunami damage were recorded for each surveyed asset and observed damage assessed using four or six state criteria. Collection of the empirical tsunami flow inundation depth, asset component and damage dataset has supported infrastructure fragility function development for risk model applications (Horspool et al., 2015; Paulik et al., 2017). As the electricity structure damage observation shows in Figure 6, in general, increasing mean flow depths increases the damage state.
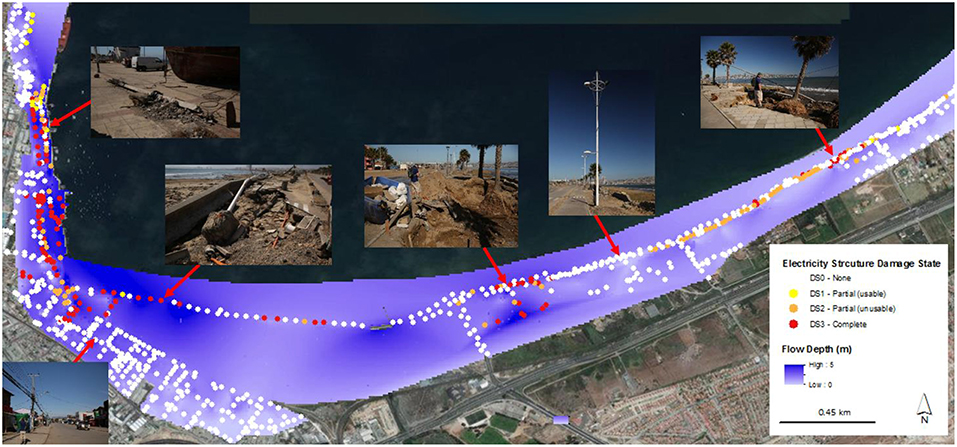
Figure 6. Infrastructure damage observations: Electricity.
Post-cyclone Damage Survey, TC Winston, Fiji, 2016
Tropical Cyclone Winston (TC Winston) was a Category 5 (Australia/SW Pacific Classification) tropical cyclone event that made landfall in Fiji on 20th February 2016. Extreme winds caused widespread building and infrastructure damage on many Fijian islands. The scale of loss from the event reached 44 fatalities, more than 55,000 people displaced and approximately 30,000 buildings damaged or destroyed, with an estimated financial loss of USD$600 million (Government of Fiji, 2016).
Building component damage data from extreme wind events is used in the development and validation of wind vulnerability models using either, empirical, heuristic or analytical methods (Ginger et al., 2010; Walker, 2011; Pita et al., 2015). Extreme winds created by TC Winston affected a range of Fijian residential and non-residential building construction types. Damage data collection for different building classes and their components informed the development of wind vulnerability for Fijian buildings.
A team of Fijian and New Zealand researchers collected wind damage information for affected buildings over a four-day period between March 15 and 18th 2016. The main survey area focused on northwest Viti Levu; primarily the Rakiraki District in Fiji's Ra Province, with buildings of interest (e.g., schools) also surveyed in Ba and Tavua (Paulik et al., 2016). The field team collected structural and/or non-structural building attributes and damage states of structural and non-structural components for 700 buildings (Figure 7). In addition, residential building habitability and the operational function of non-residential buildings were also recorded. The information collected can support the development of empirical or heuristic wind fragility function for Fijian building types including analogous buildings in other Pacific Island countries.
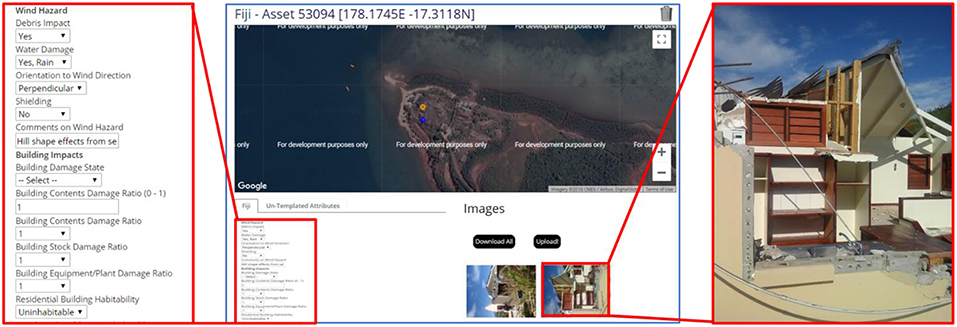
Figure 7. Screenshot of hazard and damaged information during TC Winston in Fiji.
Training
In addition to the above pre-event exposure dataset development and post-event damage data collection applications, several workshops on the data need and management for risk modeling and capture tools were conducted for various projects in various countries (e.g., New Zealand, Viet Nam, Indonesia, Samoa, and Vanuatu). These meetings were attended by key data stakeholders within each project. It was noted by many stakeholders in each country that relevant data was widely available across agencies but that centralized mechanisms to support the sharing/accessibility of data within and amongst them was lacking. Most stakeholders showed great appreciation for the RiACT trainings, the efforts toward establishing a centralized platform to enable the sharing of data and better-informed decision making, and the use of RiACT as a user-friendly and efficient approach for their future data capture tasks. It is worth noting that though they appreciated the seamless integration from field survey to central repository, concern around data control was often raised by some participants. This concern is understandable and can be easily removed within the proposed RiACT framework, as uploading data onto servers is optional, and users can export surveyed data locally as an alternative.
Health and Safety Protocols and Ethical Guidelines for Post-disaster Data Collection
Like other field activities, protocols and ethical guidelines must be followed when carrying out survey missions as mentioned above, particularly for post-disaster damage missions. It is worth emphasizing that the protocols and ethical guidelines discussed here focus on collecting data to support research. Therefore, the damage survey mission often starts days or weeks after response (i.e., during the event recovery phase). In the rest of this section, only Health and Safety (H&S) protocols and Ethical guidelines which have been followed during our previous data collection tasks were discussed, as methodologies of data management have been detailed elsewhere in this paper.
Once the motivation and need for the potential field trip is validated, seeking local support (i.e., support/invitation letter from in-country agency (often it is from the disaster management office), personnel (namely researchers/engineers with local knowledge), as well as logistics support (e.g., transportation, accommodation, and translation) are essential. Internally, a H&S Plan which sets out the terms as to the background, methodology and logistics of the field trip, as well as a list of identification of the hazards and their possible controls is to be treated.
When working in the field, team members must at all times be conscious of their own safety and that of their team members. Correct personal protective equipment (PPE), including hard hats, high visibility vests and identification must be used at all times. In addition to the physical health risks, team members may also have to deal with distressed home owners and occupants who may be in a bad state. A factsheet which contains useful information on survey purpose and available supports from government is often handed to home owners to explain our mission as well as provide support. Ethical guidelines agreed among research agencies in New Zealand are often helpful when dealing with the mental stress during the survey. More details about the ethical guidelines for post-disaster research within New Zealand can be found here (https://www.naturalhazards.org.nz/content/download/12376/65933/file/Guiding%20principles%20data%20gathering%20post-disaster.pdf).
Summary and Next Steps
The experience in developing RiACT to support multi-hazard risk assessment tools (e.g., RiskScape) provided the authors a good understanding of the hazard parameters and asset data attributes that are required to implement quantitative risk/loss modeling, and how to collect them. On-going development of the capture tool via recent post-disaster damage surveys has significantly increased the knowledge of tool development. This encompasses, for example: (1) an open-source communication scheme between tablets and servers; (2) database design and security protection; (3) solutions to offline background maps; and (4) flexibility of choices of various perils including damage and impact to different asset types. Most important in collecting post-disaster damage data is the validation and description of damage levels, which needs both peril-specific expertise and ground truthing.
RiACT and its asset repository are designed and developed with the intent of making it sharable and easily extensible, namely open-source. The whole framework is currently under review and redevelopment to improve its efficiency, capability and flexibility; hence the source code is not yet publicly available. Currently, a customized RiACT process is created which sets out the survey template and study areas (including WEB project setting and any other technical support if needed) and is available on request. The WEB (www.assets.org.nz) is accessible though login protection is required. Upon completion of refinements, RiACT will be easily accessible [e.g., via Google play store (https://play.google.com/store)], and the source code, inventory repository and web portal will also be available e.g., via GitHub (https://github.com or other similar software development platforms.
Furthermore, from projects in Viet Nam, New Zealand and Vanuatu, technical approaches were developed to populate large scale exposure datasets (i.e., building and population) using samples from field surveys, country-specific mapping schemes and other available datasets (e.g., building footprint, national census etc.). Figure 8 shows the scale of the sampled areas and the whole study area in the Viet Nam application. Using the above methodology, the processing to create the asset dataset for the Hieu River region (estimated around 60,000 buildings) took a few to serval days. The computing time for the automated steps in WEB took about 10 min. In contrast, it could take up to a year or more to collect attributes for each individual building.
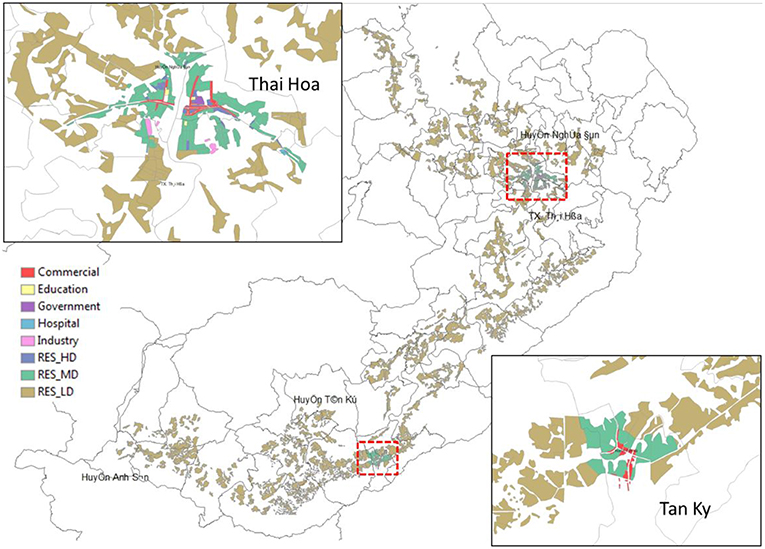
Figure 8. Sampled areas (Thai Hoa and Tan Ky) and the whole study area [the Hieu River region (in brown color)].
Understandably, it would be a trade-off in the reliability of the extrapolated asset datasets, when the interested areas were extended to cover larger range of un-surveyed areas. The potential bias from limited samples, along with the inconsistencies between assessors has always raised barriers to systematic understanding of asset portfolios. The above is not unexpected, as the task to collect building information in a regional/national scale is next to impossible (or costly and time-consuming), particularly in poorly understood regions. However, with support from other available information, such as local construction and engineering knowledge, housing census data, etc., the proposed approach seems to be practical to create the exposure dataset for use in risk modeling.
The developed exposure datasets along with the information from rapid post-disaster damage surveys can be used in loss modeling to estimate damage/impact at regional scales. This regional level impact/loss information could assist emergency responders to prioritize resource allocations during response or could help to inform land-use development planning.
The above technical and professional knowledge, along with a first-hand damage assessment in the field, enables the continuous improvement and refinement of the proposed field data collection framework, from survey templates to data collection to data assessment and analysis, and finally to model and produce useful risk information for emergency response (e.g., RiskScape estimated the preliminary losses immediately after the Kaikoura earthquake, while RiACT was used to conduct building and infrastructure damage surveys).
Through the above successes, innovative technologies are being explored and reviewed to determine their potential for inclusion into the current data collection framework. Examples include: (1) the use of drones (or unmanned aerial vehicle, UAV) to survey damages and provide advice to emergency response personnel; (2) the use of social media applications during disasters (e.g., the immediate response experiences shared via Twitter and/or Facebook, as well as posting images via Instagram); and (3) online disaster mapping (e.g., the Humanitarian OpenStreetMap, HOT) which is created by volunteers immediately after a major disaster strikes anywhere in the world.
In summary, the post-disaster reconnaissance experience after various events along with the technical knowledge of tool development enables the on-going refinement of the proposed data collection framework toward a user-friendly and efficient tool and/or IT solution for post-disaster damage data management.
Conclusions
The developed field data collection framework serves as a user-friendly and easily accessible platform through which asset datasets and impact assessment results can be improved by using: (1) more accurate asset data; (2) pre- and post-event building performance which can be efficiently evaluated by synchronizing these conditions with the inventory repository that helps to facilitate the management of and response to disasters. It differs from other data capture tools such as GEM DO Android, in that RiACT and the inventory repository provide a flexible and easily-adaptable environment.
The implementation and feedback from various application examples not only demonstrates the successful development of the framework for data collection, but also the achievement of the objectives of this development. However, more applications are being conducted to further demonstrate and refine the feasibility of this framework according to targeted user needs, such as post-event land damage and agriculture impact evaluation.
In addition, this integrated and unique platform addresses the Sendai Framework priorities for action to reduce disaster risk. For example, it facilitates a purpose developed information communication technology system for the natural hazard communities (e.g., flood, wind, earthquake, tsunami, and landslide etc.), the engineering response community (for damage evaluation to building and infrastructure), and the emergency response and planning organizations. It provides an improved pre- and post-disaster data collection framework that is efficient, transparent, standardized, and which integrates collected damage data, estimated preliminary impact, and emergency response in one seamless, verified, secured cyberinfrastructure framework.
It is noted that whilst the framework was originally designed to directly record observation of the built environment at risk to earthquake impacts, it has been easily adapted to other extreme events such as flood, wind, tsunami, and landslide thus moving toward building a safer and more resilient community.
Finally, though the successful development of the integrated framework for data collection and its applications in pre- and post-event building surveys and trainings, further development using a range of new technologies and tools may instill more efficiency, transparency and standardization of the developed data collection framework.
Author Contributions
S-LL: lead the developments and applications of RiACT and development/review of this paper. Other authors: involved in the development and application of RiACT and development/review of this paper.
Conflict of Interest Statement
The authors declare that the research was conducted in the absence of any commercial or financial relationships that could be construed as a potential conflict of interest.
Acknowledgments
The funding provided by the New Zealand Ministry of Business, Innovation and Employment (MBIE) and Ministry of Foreign Affairs and Trade (MFAT) that enabled this research is gratefully acknowledged. We would like to acknowledge the Global Earthquake Model. Much of the RiACT has been based on the DO Android tool developed by GEM. The authors would like to thank the New Zealand Society for Earthquake Engineering Inc to allow us to reuse the published conference paper. We would also like to thank the Fijian and Chilean Governments for permission to conduct the damage survey. We thank the residents and villagers of the impacted areas, and stakeholders in each country, for their helpfulness and willingness to answer questions from survey team members. Finally, we thank the journal editors and reviewers for their constructive feedback and support.
References
BRANZ (2019). Renovate- the Technical Resource for Industry. Available online at: https://www.renovate.org.nz/ (Accessed January 2019).
Foulser-Piggott, R., Vicini, A., Verrucci, E., Bevington, J., and Shelley, W. (2013). IDCT Mobile Tools – Field Test Reports, Produced in the Context of the Inventory Data Capture Tools Risk Global Component, Version 1.0. Pavia: GEM Foundation
Galloway, B. D., and Hare, H. J. (2012). “A review of post-earthquake building control policies with respect to the recovery of the Christchurch CBD,” in Proceedings of the NZSEE Annual Technical Conference and AGM (Christchurch).
Ginger, J., Henderson, D., Edwards, M., and Holmes, J. (2010) “Housing damage in windstorms mitigation for Australia,” in Proceedings of 2010 APEC-WW IG-WRDRR Joint Workshop: Wind-Related Disaster Risk Reduction Activities in Asia-Pacific Region Cooperative Actions, pp. 1-18. From: 2010 APEC-WW IG-WRDRR Joint Workshop: Wind-Related Disaster Risk Reduction Activities in Asia-Pacific Region Cooperative Actions, Incheon.
Glassey, P., Crowley, K., Setianto, A., Lin, S.-L., Nayyerloo, M., Satyarno, I., and Wilopo, I. (2015). Risk Modelling Training, Palu 19-23 October 2015. GNS Science International Consultancy Report.
GNS Science (2015). Dam and Downstream Community Safety Initiative (DDCSI). Viet Nam: Damwatch Engineering Ltd and Water Resources University
Government of Fiji (2016) Fiji: Post-Disaster Needs Assessment May 2016 - Tropical Cyclone Winston, February 20, 2016. p,153.
Greene, M., Grossi, P., Tubbesing, S. K., Basoz, N., and Love, R. J. (2004). “Learning from earthquakes: new directions and initiatives,” in Proceedings of the 13th World Conference on Earthquake Engineering (Vancouver).
Hamling, I. J., Hreinsdóttir, S., Clark, K., Elliott, J., Liang, C., Fielding, E., et al. (2017). Complex multifault rupture during the 2016 Mw 7.8 Kaikoura earthquake, New Zealand. Science 356:eaam7194. doi: 10.1126/science.aam7194
Horspool, N., Fraser, S., Mowll, R., Paulik, R., Woods, R., and Williams, J. (2015). “Tsunami impacts to lifelines: review of current knowledge and post-event survey of the 16 september 2015 m8.3 illapel, chile tsunami,” in Proceedings of National Lifelines Forum 2015 (Christchurch).
Lin, S.-L., Berryman, K., Glassey, P., Tu, V. T., Thuy, N. T., Van, N. C., and Huong, L. T. T. (2018). Viet Nam – New Zealand Dam Safety Project Phase II: Ngan Truoi Dam Consequence Impact: Asset Data Collection – Trip Report. GNS Science consultancy report, CR 2018/103
Lin, S.-L., King, A. B., and Matcham, I. (2014). “Exposure data development framework: real-time individual asset attribute collection tool (RiACT), inventory repository and asset repository web portal,” in Proceedings of the 2014 NZSEE Conference (Auckland).
Ly, P. (2012). A Critical Regionalist Approach to Housing Design in Vietnam: Socio-Environmental Organisation of Living Spaces in Pre- and Post-Reform Houses. Ph.D. thesis, Queensland University of Technology.
Paulik, P., Turner, R., Williams, S., Moore, S., Lin, S.-L., Funaki, M., Tabua, M., and Seruiratu, M. (2016). Tropical Cyclone Winston 2016 Fiji Building Damage Survey – Trip Report. NIWA Client Report, WLG2016–24.
Paulik, R., Horspool, N., Williams, J., Mowll, R., and Woods, R. (2017). “Infrastructure post-event impact survey for the 2015 chile earthquake and tsunami,” in Proceedings of the 27th International Tsunami Symposium (Bali-Flores).
Pita, G., Pinelli, J.-P., Gurley, K., and Mitrani-Reiser, J. (2015). State of the art of hurricane vulnerability estimation methods: a review. Nat. Hazards Rev. 16:04014022. doi: 10.1061/(ASCE)NH.1527-6996.0000153
Porter, K. A. (2002). Learning from Earthquakes: a Survey of Surveys, EERI Invitational Workshop: An Action Plan to Develop Earthquake Damage and Loss Data Protocols, Pasadena, California
Roueche, D. B., Krupar, I. I. I., Lombardo, F. T., and Smith, D. J. (2018). Engineering assessment of residential building performance during Hurricane Harvey. The Wind Engineer, Special Issue: 2017 Hurricane Season, American Association for Wind Engineering, 4-6.
Schmidt, J., Matcham, I., Reese, S., King, A., Bell, R., Smart, G., Cousins, J., Smith, W., and Heron, D. (2011). Quantitative multi-risk analysis for natural hazards: a framework for multi-risk modelling. Nat. Hazards 58, 1169–1192, doi: 10.1007/s11069-011-9721-z
Shephard, R. B., Spurr, D. D., and Walker, G. R. (2002). “The Earthquake Commission's earthquake insurance loss model,” in Proceedings of the 2002 NZSEE Conference (Wellington).
Tonkin and Taylor. (2017). MINERVA Earthquake Loss Model – Liquefaction Modeule Technical Document. Auckland: Tonkin and Taylor Report.
Ungaro, J., Lin, S.-L., Williams, S., Crowley, K., Simi, T., Yerta, L., et al. (2017). PARTneR Pacific Risk Tool for Resilience Project - Data Management System Report for 654 Samoa and Vanuatu. Wellington: NIWA Project MFA16301.
UNISDR (2015). Sendai Framework for Disaster Risk Reduction 2015–2030. Avaialble online at: https://www.unisdr.org/files/43291_sendaiframeworkfordrren.pdf (Accessed May 2018).
Keywords: post-disaster reconnaissance, field data collection, survey attributes, inventory repository, exposure dataset, damage assessment
Citation: Lin S-L, King A, Horspool N, Sadashiva V, Paulik R and Williams S (2019) Development and Application of the Real-Time Individual Asset Attribute Collection Tool. Front. Built Environ. 5:15. doi: 10.3389/fbuil.2019.00015
Received: 28 June 2018; Accepted: 04 February 2019;
Published: 27 February 2019.
Edited by:
Sean Wilkinson, Newcastle University, United KingdomReviewed by:
Michele Palermo, University of Bologna, ItalyRichard J. Krupar III, Independent Researcher, College Park, United States
Copyright © 2019 Lin, King, Horspool, Sadashiva, Paulik and Williams. This is an open-access article distributed under the terms of the Creative Commons Attribution License (CC BY). The use, distribution or reproduction in other forums is permitted, provided the original author(s) and the copyright owner(s) are credited and that the original publication in this journal is cited, in accordance with accepted academic practice. No use, distribution or reproduction is permitted which does not comply with these terms.
*Correspondence: Sheng-Lin Lin, cy5saW5AZ25zLmNyaS5ueg==