 Andrea Miano
 Giovanni Chiumiento1
- 1Department of Structures for Engineering and Architecture, University of Naples Federico II, Napoli, Italy
- 2Independent Researcher, Salerno, Italy
A significant number of non-ductile existing reinforced concrete frame buildings, built in different seismic regions around the world but without adequate seismic detailing requirements, suffered damages, or collapse after past earthquakes. In fact, these reinforced concrete frame buildings are much more susceptible to high level of damage or to collapse than modern code-conforming frames. A crucial issue in the community of the earthquake engineering is the assessment and the upgrading of these non-ductile reinforced concrete structures. In particular, a careful assessment of the existing buildings is very important in order to understand the failure mechanisms that govern the achievement of predefined limit states or the collapse of the structures. Only after an in depth seismic assessment, the best upgrading/retrofit strategy can be designed and applied to the structure. In some cases, the historical value of these buildings makes the assessment procedure and the upgrading design more complicated due to the constraints related to the limited possibility of interventions. In this work, a building belonging to an old multi-sports center, is used as case study. The complex orbits around the soccer stadium called Collana and located in Naples. This soccer stadium was initially built in the late ‘20s and then it was completely rebuilt in the post-war period and used as a sports center for different sporting activities. Currently, the complex includes a soccer field, an athletic track, three indoor gyms, three tennis fields, a medical center sports, and the indoor pool building investigated herein. The analysis of seismic vulnerability implemented for the case study building shows an unsafe condition under both vertical and seismic loads. The building upgrading is provided choosing the best strategy among different options in order to achieve a certain predefined threshold of the seismic safety for the building. Definitively, the paper presents a real upgrading design case study for a building belonging to an historical complex. Assessment and upgrading are shown based both on linear and dynamic non-linear analyses procedures. Finally, the effectiveness of the structural interventions of upgrading is measured coherently with the new Italian guidelines for seismic risk classification of constructions.
Introduction
The “Collana” football stadium was initially built in the late '20s and then be completely rebuilt in the post-war period and used as a multi-sports center together with other buildings intended for various sporting activities. Currently, the complex includes a soccer field, an athletic track, three indoor gyms, three tennis courts, a medical center sports, and the indoor pool under study. The present work concerns the description and verification of the structural upgrading design for the swimming pool building, realized inside the more general scope of the project of functional upgrading of the entire building, which at the moment of the design was unusable. In general, the assessment and upgrading/retrofit of existing structures in highly seismic zones are crucial issues in earthquake engineering. In fact, post-earthquake reconnaissance and recent research on seismic risk analysis have shown that non-ductile concrete frame structures are much more susceptible to collapse than modern code-conforming frames. In particular, a careful assessment of the existing buildings is fundamental for understanding the failure mechanisms that govern the collapse of the structure or the achievement of the recommended limit states. Based on the seismic assessment, the best upgrading/retrofit strategy can be designed and applied to the structure. Many conventional upgrading methods, such as concrete or steel jacketing of the columns, addition of shear walls and methods often based on new materials as fiber reinforced polymers (FRP), have been proposed and used (Moehle, 2000; Thermou and Elnashai, 2006; Calvi, 2013; Formisano and Sahoo, 2015a; Formisano et al., 2015, 2016, 2017a; Miano et al., 2017a). These methods can be applied considering the desired limit states/performance levels, using the requirements of new seismic codes or more advanced performance based approaches to measure the probability of collapse and quantify and minimize the costs and/or the losses with different approaches (Aslani and Miranda, 2005; Liel and Deierlein, 2013; Jalayer et al., 2015, 2017; Miano et al., 2018a). Non-linear static analysis procedure, also known as pushover, has been implemented in this work for seismic and vertical loads safety assessment and for measure the effectiveness of the different retrofit strategies. In particular, pushover analysis, can be used to calculate the vulnerability index indicator, also called seismic safety factor (Frascadore et al., 2015; NTC, 2018). Moreover, non-linear dynamic analysis procedures can be used to perform probabilistic seismic assessment using recorded ground motions. Cloud Analysis is chosen here by applying simple regression in the logarithmic space of non-linear dynamic structural response vs. seismic intensity for a set of ground motion records. Cloud Analysis is particularly efficient since it involves non-linear analyses of the structure subjected to a set of un-scaled ground motion time histories. The simplicity of its formulation makes it a quick and efficient analysis procedure for fragility assessment (Jalayer et al., 2007, 2015, 2017; Celik and Ellingwood, 2010; Miano et al., 2017b). The 3D model of the building is produced using the commercial software for structural calculation CDS (CDS, 2018). The analysis of seismic vulnerability carried out on the mentioned building highlights deficiencies in both vertical loads and seismic loads conditions. The upgrading of the building is designed in order to solve the vertical load deficiency and to achieve a certain threshold of the seismic vulnerability index, as described in Italian code (NTC, 2018). The design solutions adopted and described below are based on a careful campaign of in situ investigations performed on the existing structure together with accurate measurements to represent the dimensional characteristics and the construction details of the building. Based on different considerations related to effectiveness, costs and invasive grade of the upgrading options, steel jacketing is chosen. The steel jacketing is realized through steel plates wrapped completely around the beams plus angular plates in the corners around the length of the members. In this upgrading option, all the reinforced concrete (RC) columns and beams are steel jacketed. Assessment and retrofit are shown both based on linear and dynamic non-linear analyses procedures. In particular, the achievement of an adequate value of seismic vulnerability index through non-linear static analysis, as required for buildings susceptible to crowding in the case of temporary use of the structure for purposes related to the management of the emergencies in general, is shown. Moreover, non-linear dynamic analyses are implemented to measure the probability of achieving predefined limit states before and after the upgrading. Finally, the seismic risk class is assigned before and after the upgrading according to two parameters (Guidelines, 2017; Cosenza et al., 2018). The first parameter is economic and is called expected annual mean losses (Perdite Annue medie, PAM). The second one is related to the safety of the structure and id called Life Safety Index (Indice di sicurezza della vita, IS-V).
Case Study
Building Description
The building is roughly rectangular in plan and consists of a pool block of consistent height, equal to about 6.50 m, with a surface area of about 600 m2. In adjacency on the two sides of the pool body there is the stripped area, with a plant area of 500 m2, with a height of about 3.50 m above ground and, limited to one of the service areas, 5.30 m. The covered area of the entire structure is about 1,200 m2 and, in addition to the two bodies described, there is also a technical room of about 60 m2. Access to the pool, as well as from inside the stadium, is allowed directly from the street, with respect to which the footfall is slightly higher. There is also an underground floor, done with RC walls at different quotes and directly connected to the foundation system, but the design project regards only the upper floor. However, it was possible to note that no damages or cracks are present in the underground floor. Figure 1 shows the lateral view of the building.
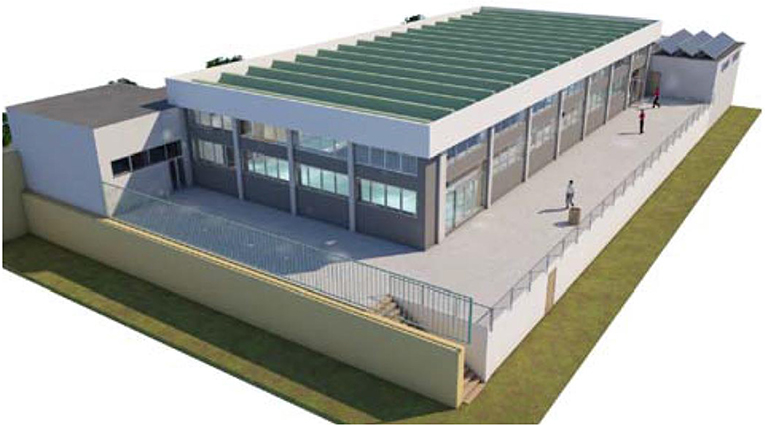
Figure 1. Lateral view of the building.
The process of knowledge for the building has been done following two different directions, e.g., respectively visual and in depth in situ surveys and tests and research of the technical, administrative and planning documentation referred to structure under study, as required by the Italian technical regulations for buildings existing (NTC, 2008, 2018). Considering the construction time of the building, dating back to the 60 s, and the lack of the obligation to deposit the project at the city offices, it was not possible to find any documentation useful for the knowledge of the structural characteristics of the building. Definitively, in this section, the visual structural relief is commented, while, in the next section, the in situ tests campaign is described. Figure 2 shows the plan view of the building. Structurally, the building is done by frames of RC beams and columns. The slabs are made of prefabricated joists on the first level and of prefabricated RC concave tiles for the pool area. At the basement level, around the perimeter, there are RC walls, covered by the ground for three of the four sides of the building. The cross section of the beams is 400 × 450 mm, while the columns have two different cross sections, respectively 250 × 500 mm and 400 × 400 mm. The number of bars and stirrups is limited in all the sections. The bars are smooth, as in the most part of the buildings of the same construction age. The distribution of the frames is quite regular with the adoption of similar typologies referred to sections of beams and columns. However, the structural design of the building is affected by the era of realization of the works since there are no connecting elements between the supporting frames. It is clear that there is a lack of an earthquake-resistant design of the structure in this building, such as in numerous buildings of the period, designed only for vertical loads.
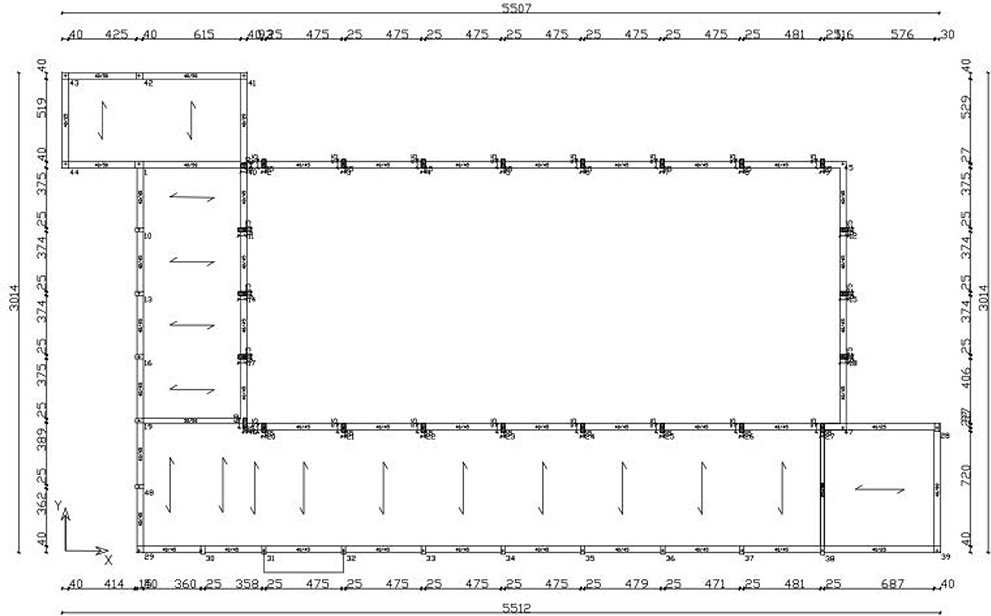
Figure 2. Plan view of the building.
Figure 3 shows the typical structural designs of the layout of the cross sections of columns and beams (in cm). In particular, Figures 3A,B shows the cross sections of beams (a) and columns (b) before structural upgrading operations, while Figures 3C,D shows the cross sections of beams (c) and columns (d) after structural upgrading operations (for the details of the upgrading operations, see Section Building Structural Upgrading).
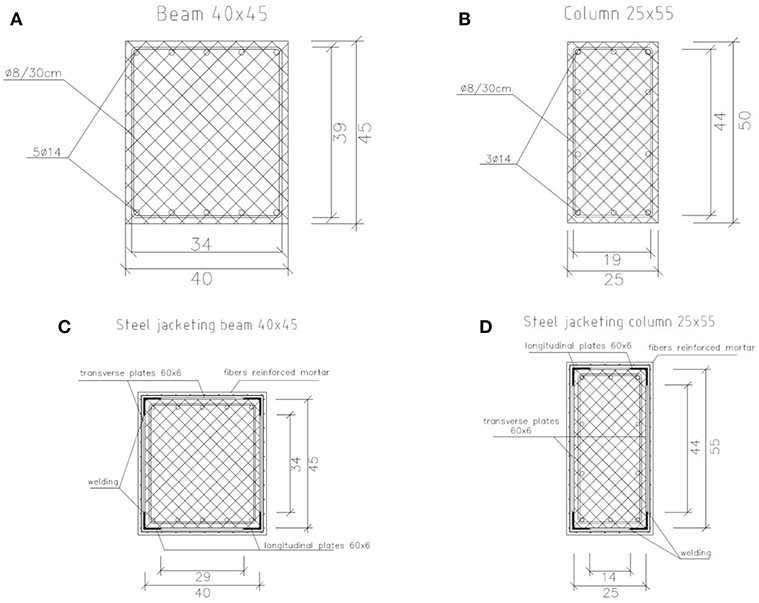
Figure 3. Layout of the cross sections of columns and beams (in cm), before (A,B) and after upgrading operations (C,D).
In situ Tests Campaign and Materials Mechanical Characteristics
For the definition of the properties of the materials, reference has been made to the indications of point C8A.1B3 of the Italian code explanatory test (Circolare, 2009, Table 1). The goal has been to obtain the knowledge level 2 (KL2). Based on this consideration, extended in situ tests have been carried according to table C8A.1.3a of Circolare (2009), considering the absence of technical design documentation. The engineers have chosen to achieve KL2, also in order to use static non-linear analysis as procedure for the assessment, as shown in Table 1.
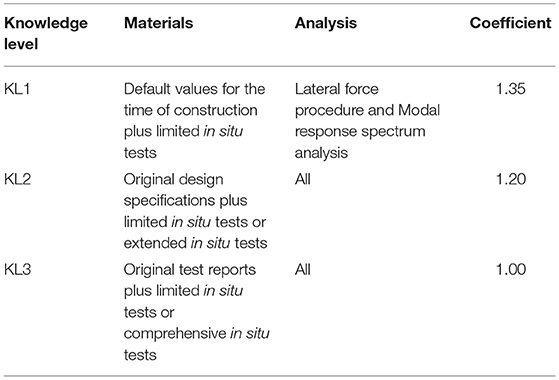
Table 1. Knowledge levels definition for materials, methods of analysis, and confidence factors (CF) (BS EN 1998-3:2005) and (Circolare 2 febbraio 2009, n. 617).
With respect to the determination of the mechanical characteristics of the concrete, direct (destructive), and indirect (non-destructive) tests have been carried out, according to Circolare (2009). The types of tests performed in structural elements in order to evaluate their compressive strength are, respectively, the compression breaking of cylindrical specimens of concrete and non-destructive tests (Sonreb tests). The mechanical characteristics of the steel have been determined based on destructive tests with the removal of bars from structural elements. In particular, the steel specimens have been taken from the columns. The cover of the designated element has been removed with the subsequent removal of a piece of length equal to about 1 m and re-insertion of a suitable replacement bar with subsequent restoration of the cover. In general, the choice of the elements to be investigated has been carried out in order to obtain a significant sample of elements, able to represent the average characteristics of the concrete and the steel. Table 2 summarizes the recommended minimum requirements for different levels of testing for the number of concrete and steel tests. It is important to note that the Circolare (2009) allows to replace each destructive test with three non-destructive tests up to the 50% of all the required destructive tests.
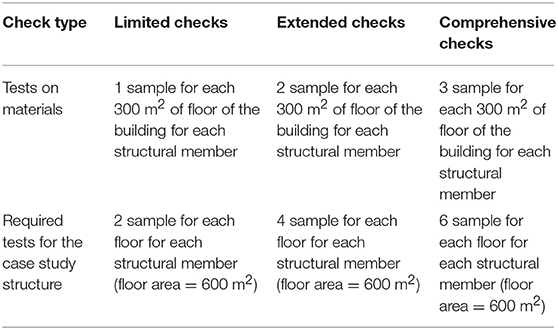
Table 2. Recommended minimum requirements for different levels of testing (Circolare, 2009).
Based on the recommendations provided in Table 2 line 1 and considering a surface of about 600 m2 of the building, a number of four samples is required at each floor for each structural member in order to achieve extended checks and, then, KL2 (Table 2 Line 2). With reference to concrete, the performed tests have included a number of two destructive plus six non-destructive tests for each structural member at the floor under consideration. With reference to steel, only two destructive tests have been realized for each structural member. This is quite reasonable since the variability of the steel mechanical properties can be considered less than that the one affecting concrete specimens. Moreover, in same cases it is to consider the impossibility to perform in situ tests on steel samples for different reasons. For example, in some columns, only corner bars were found. Since this circumstance was judged dangerous from the structural designers, they decided to don't extract steel bars from the corners. Definitively, based on the analysis of the results of the tests carried out, the average compressive concrete and steel yielding strengths assumed in the modeling of the structural members are:
- concrete: fcm = 24.5 Mpa;
- steel: fym = 356.8 Mpa.
Building Structural Assessment
Non-linear Static Analysis Procedure
Non-linear static analyses are presented in this section. They are implemented through the commercial software CDS (CDS, 2018). First, some basic information about the modeling is provided. The analysis for the combinations of permanent and variable actions is carried out in a linear elastic regime. The checks are carried out using the limit state method (Life Safety and Damage Limitation Italian Limit States), using the partial coefficients of the regulations as in NTC (2008, 2018). In particular, with reference to the Damage Limitation (DL) limit state, the limit state condition is represented by the attainment of the value of 0.005 of the height of the floor as maximum displacement in a floor. Instead, with reference to the Life Safety (LS) limit state, the limit state condition is represented by the attainment of the maximum shear strength (brittle safety checks) or the maximum rotational capacity (ductile safety checks). In addition, the joints safety verifications are carried out. With respect to the structure resolution method, the structure is modeled with the finite elements method. The constitutive laws for concrete and steel are presented in Figure 4. Concrete material behavior is modeled using a zero tensile strength and a parabolic compressive stress-strain behavior up to the point of maximum strength with a linear deterioration beyond peak strength, according to the Kent-Scott-Park model (CDS, 2018). Longitudinal steel behavior is simulated using a bilinear stress-strain envelope with the definition, respectively of a yielding and a rupture deformations, according to Fedeas model (CDS, 2018). Member force-deformation response is computed assuming that inelastic action occurs mainly at the member ends and that the middle of the member remains typically elastic. A sectional analysis is implemented to obtain the non-linear moment-curvature relation in the member ends. Plastic hinge integration methods are used to confine non-linear deformations in end regions of the element of specified length. The remainder of the element is assumed to stay linear elastic and it is assumed that the length of the plastic region is equal to the depth of the cross-section. The deformational contributions from shear and bar slip are neglected in the section analysis. In particular, it is to consider that slip of longitudinal column bars at column ends (i.e., from the footing or beam-column joint) causes rigid body rotation of the column. This rotation is not accounted for in flexural analysis, where the column ends are assumed to be fixed. Many studies have been proposed to taking into this deformational contribution (Sezen and Moehle, 2004; Braga et al., 2012, 2015; D'Amato et al., 2012; Caprili et al., 2015). Finally, it is to note that the shear safety checks are however performed as post-processing, comparing the maximum demand value with the capacity in terms of force.
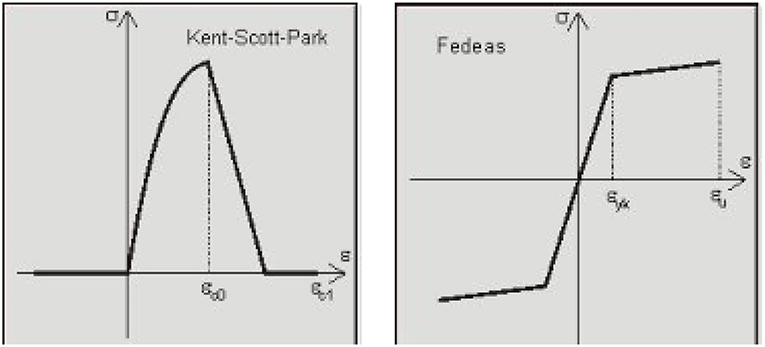
Figure 4. Concrete and steel constitutive laws.
Definitively, a moment curvature envelope is calculated based on section analysis and is assigned at the end of the members with a concentrated plasticity model. Pushover analysis is carried out by following the Italian seismic code (NTC, 2008) for the case study building, based on the properties calculated with respect to KL2. Vertical loads analysis is implemented before pushover analysis. The safety verifications after vertical loads analysis show mainly premature shear failures in some beams. Then, a number of 16 pushovers is done, using two different distributions of forces and using a possible eccentricity of the 5% in each direction. The first forces distribution is proportional to the floor masses, while the second one is proportional to the shape of the first vibration mode (NTC, 2008 and Circolare, 2009). Figure 5 shows the pushover results in terms of base shear/acceleration vs. top displacement. The 16 pushovers are differentiated by colors in group of four, where each group represent a certain direction of application of the forces, while the four pushovers for each direction are relative to the two distributions of forces suggested by Italian code and with the application of plus/minus 5% eccentricity with respect to the geometrical barycentre of the building. In particular, the red curves correspond to forces parallel to horizontal × positive direction (see Figure 3); the blue curves correspond to forces parallel to horizontal × negative direction; the black curves correspond to forces parallel to horizontal y positive direction; the green curves correspond to forces parallel to horizontal y negative direction.
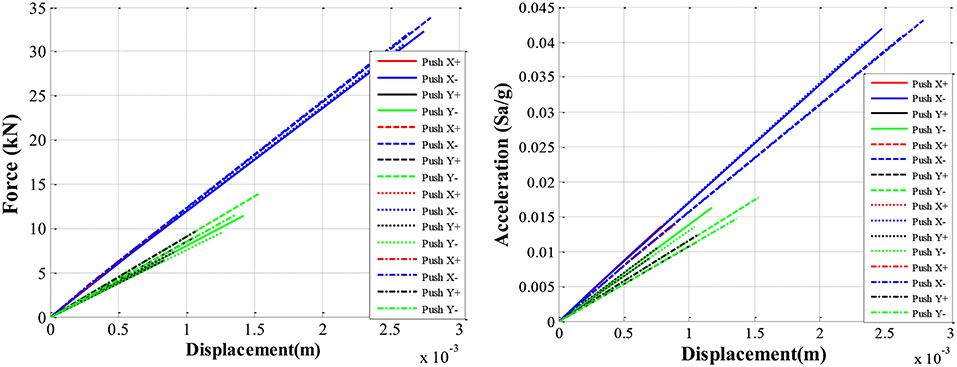
Figure 5. Pushover curves for the case study building before upgrading operations.
For the DL and LS limit states, the members verifications are provided, showing a situation of strong deficiency. It's interesting to show the safety verifications for the LS limit state. In particular, Figure 6 shows for the LS limit state with red color the members for which the safety verifications are not satisfied and with green color the members for which the safety verifications are satisfied, showing that a high number of beams and columns result unsafe. The safety verifications are implemented also for the DL state, showing a lot of deficiencies in the structural members. In particular, there is the same configuration of the brittle failures of the beams as in the vertical loads analysis. These premature failures don't allow to the structure to reach a ductile behavior and to have excursions in plastic zone. The analysis is stopped when these premature failures are reached, as it is possible to see from the linear behavior in Figure 5. It is to note that the first crises are related mainly to shear failures of the beams along the principal direction of the building. So, it is to consider that the most important deficiency is related to the unsafe verifications of the members against vertical loads (as it can be seen from the results of the pushovers and from the consideration that the capacity displacement is about the same for DL and LS limit states, based on the fact that there is no possibility to develop plastic dissipation, because in the first step of the pushover the vertical loads shear failures happen).
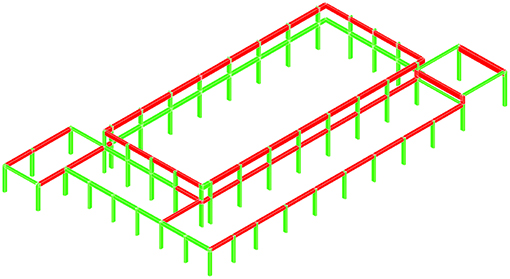
Figure 6. Safety verifications after pushover analysis for the case study building before upgrading operations.
In order to measure the level of seismic safety before and after upgrading, the Italian code (NTC, 2008, 2018) suggests to verify the vulnerability index with reference to LS limit state. For this reason, the bare building and its upgraded versions are compared at the end of the process based on the vulnerability index calculated with respect to LS limit state, verifying a part in addition the condition of the members in the DL limit state. Definitively, in order to define if the building is safe with respect to seismic actions, the software (CDS, 2018) calculates the vulnerability index (ζE), also called in literature seismic safety factor (Frascadore et al., 2015), that is a very useful parameter to measure the vulnerability of the structure. The pushover curve is an essential tool for the application of the capacity spectrum method (CSM; Vidic et al., 1994) that allows for the determination of the building response for earthquakes of a given spectral shape. All the steps of the procedure for calculate the ζE are well-described in Frascadore et al. (2015). The procedure starts from the pushover response in terms of the MDOF (Multi Degree of Freedom) system and passes to the response in terms of the corresponding SDOF (Singol Degree of Freedom). The parameters that characterize the SDOF, period T*, yield strength , and ultimate displacement , allow to derive the return period capacity, and therefore the peak ground acceleration capacity, for which the crisis mechanism is reached. The procedure for the quantification of the ζE is implemented in the ADRS space (Acceleration Displacement Response Spectrum, Fajfar, 1999, 2000), in which the abscissas are the spectral displacements and the ordinates are the spectral accelerations. It consists in scaling the elastic spectrum of seismic demand, for small decrements of the return period TR, until the spectrum that contains the point performance (Sae; Sde) of the equivalent SDOF is found, identified by the line of inclination T* and the displacement . Finally, ζE is defined as the ratio between the demand peak ground acceleration (PGA), based on the seismic actions prescribed from the code for the Life Safety limit state, and the capacity PGA of the building:
where PGALS_Capacity is the PGA corresponding to the achievement of the first crisis related to LS limit state inside the building, while PGA LS_Demand is the PGA obtained from the elastic code spectrum for the specific site with reference to the LS limit state. It can be noted that this ratio between these two accelerations is directly related to the measurement of the seismic vulnerability of the structure with reference to the achievement of the crisis condition for the LS limit state. There are 16 SDOF systems associated to the 16 pushovers. The minimum value among the 16 values of the ζE related to the 16 SDOF systems is considered as ζE of the structure. The final value of the ζE is 0.23. Thus, the structure is not safe in terms of seismic actions. Moreover, also the verifications in terms of vertical loads are not satisfied. Definitively, it is clear that upgrading operations are needed for the structure.
Non-linear Dynamic Analysis Procedure
In seismic assessment and upgrading procedures, it's crucial to have accurate evaluation of the seismic vulnerability. Fragility curves are the most common and useful way to have the measure of the vulnerability. Herein, analytical fragility curves are developed for the case study building with reference to the conditions before and after upgrading operations. The curves are based on the application of a set of 30 ground motion records to the SDOF system calculated from the software program (CDS, 2018). In particular, since 16 pushover curves are developed and so 16 SDOF systems are available, Cloud Analysis refers to the most penalized SDOF, the one that minimizes the value of ζE. The methodology starts to the identification of the structural response parameter. As described in Jalayer et al. (2007), for each non-linear time-history analysis, the corresponding critical demand to capacity ratio (DCRLS), for each limit state, equal to the mechanism that brings the structure closest to the onset of the specific limit state, is adopted as the structural response parameter. The DCRLS parameter, that is equal to unity at the onset of the limit state can be calculated for the SDOF systems analyzed here as the ratio between the maximum demand in terms of displacement for each record among all the steps of the non-linear dynamic analysis and the limit state capacity, calculated accordingly with Italian code (NTC, 2008, 2018). Obviously, the ratios between demand and capacity at the level of the SDOF and MDOF systems are equal because both the demand and the capacity have to be multiplied by the modal participation factor in order to pass from SDOF system to MDOF system. Two capacity values refer in this work to DL and LS limit states, but it's to note that the procedure can be used for any other prescribed performance levels or limit states. The record selection is a very critical issue for have a good implementation of non-linear dynamic analysis procedures. Herein, a set of 30 strong ground-motion records is selected from the NGA-West2 database (see Jalayer and Ebrahimian, 2017 and Miano et al., 2018b for the details about the criteria for record selection) in order to implement Cloud Analysis. This suite of records covers a wide range of magnitudes between 5.6 and 7.2, and closest distance-to-ruptured area (RRUP) up to around 40 km. The shear wave velocity in upper 30 m of soil, Vs30, at the structure's site is in the range of 180–360 m/s (e.g., soil class C, accordingly to Italian code, NTC, 2018). Based on this information, the main part of the selected records are chosen to be on NTC (2018) site classes B and C. Only one of the two horizontal components of each recording. Finally, the records are selected to be free field or on the ground level. Table 3 summarizes the most important information about the suite of ground motion records used in this study.
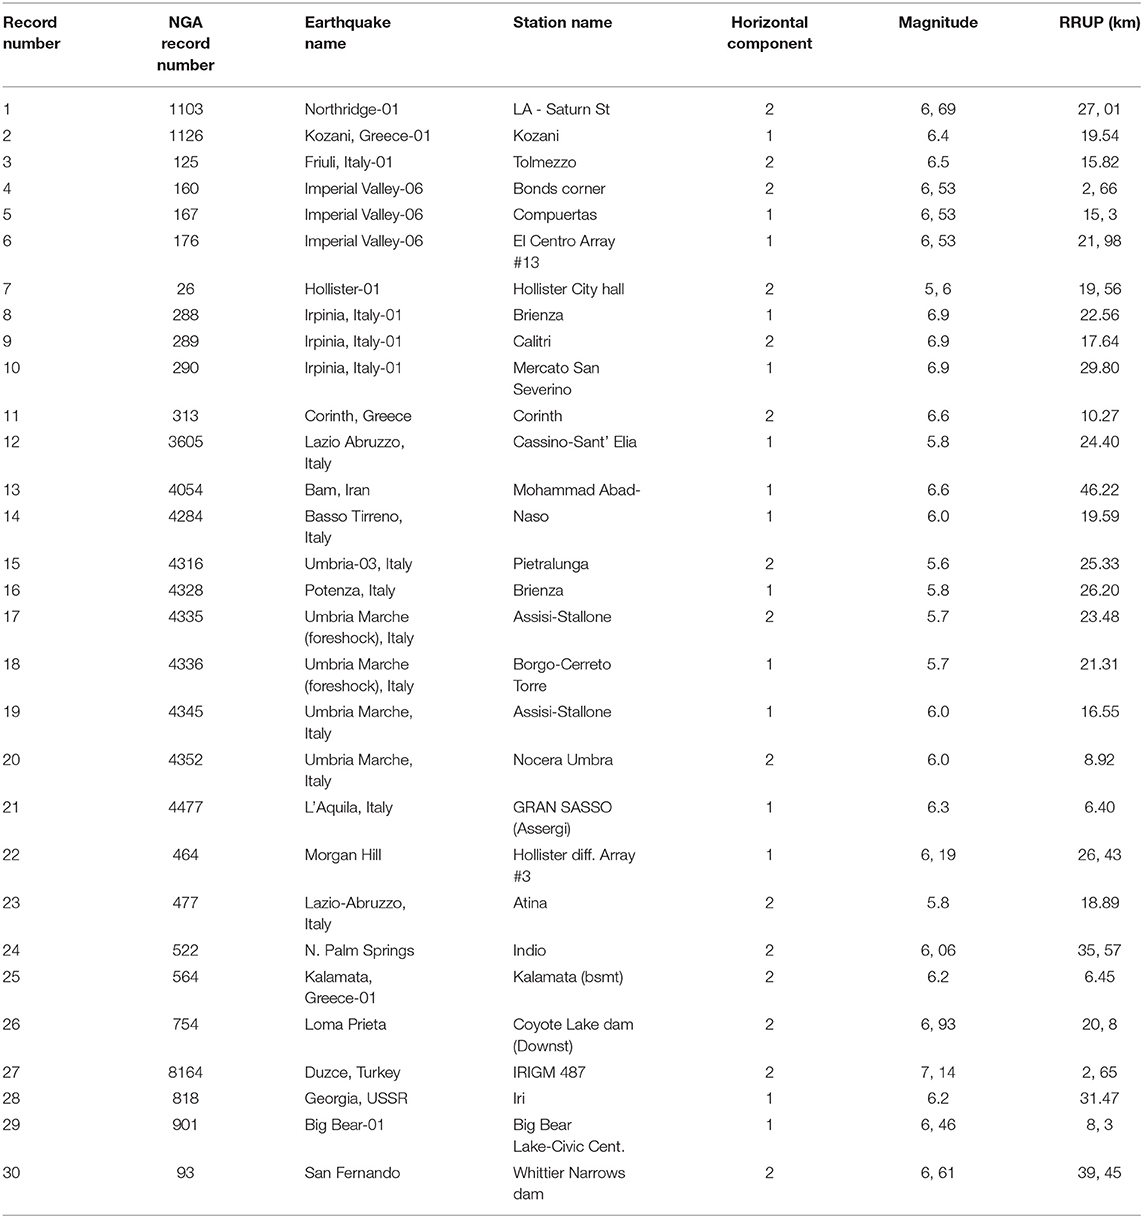
Table 3. The suite of strong ground-motion records used in this study.
In order to estimate the structural fragility, Cloud analysis is adopted herein as non-linear dynamic analysis procedure. Cloud analysis is a procedure in which a structure is subjected to a set of ground motion records of different first-mode spectral acceleration, Sa(T), values. It is to note that Sa(T) or simply Sa is adopted herein as the IM. This intensity measure has been proved to be a relatively sufficient IM for moment-resisting frames with first-mode periods lying within the moderate range (Jalayer et al., 2012). Once the ground motion records are selected, they are applied to the structure and the resulting DCRLS is calculated. This provides a set of values that form the basis for the cloud-method calculations. In order to estimate the statistical properties of the cloud response, conventional linear regression is applied to the response on the natural logarithmic scale, which is the standard basis for the underlying log-normal distribution model. This is equivalent to fitting a power-law curve to the cloud response in the original (arithmetic) scale. This results in a curve that predicts the median drift demand for a given level of structural acceleration:
where ln(a) and b are regression constants. The logarithmic standard deviation βDCR|Sa is the root mean sum of the square of the residuals with respect to the regression prediction:
where DCRi and Sa, i are the demand over capacity ratio values and the corresponding Sa for record number i within the cloud response set and N is total number of records. The standard deviation of regression, as introduced in the preceding equation, is presumed to be constant with respect to Sa over the range of spectral accelerations in the cloud. Finally, the structural fragility curves based on the Cloud Analysis can be expressed as:
Figure 7A presents the results of the Cloud linear logarithmic regression for the LS limit state with respect to the pre-upgrading building (it corresponds also the DL limit state as explained before). Figure 7A shows the scatter plots for Cloud Analysis data D = {(Sa, i, DCRLS,i), i = 1:30, where LS corresponds to Limit State} for the set of records outlined in Table 3. For each data point (cyan colored squares), the corresponding record number is shown. Moreover, the figure illustrates the Cloud Analysis regression prediction model (i.e., regression line and the estimated parameters, see Equation 2) fitted to the data. The line DCRLS = 1 corresponding to the onset of limit state is also shown with red-dashed line. It can be noted that consistent with the recommendations provided in Jalayer et al. (2017), the Cloud Analysis data not only cover a vast range of Sa values but also provide data points both in the range of DCRLS >1 and in the range of DCRLS <1. Figure 7B shows the resulting Cloud Analysis-based fragility curve. The values of the statistics (e.g., median and the logarithmic standard deviation) associated with the Cloud Analysis based fragility curve are, respectively, 0.04 and 0.72.
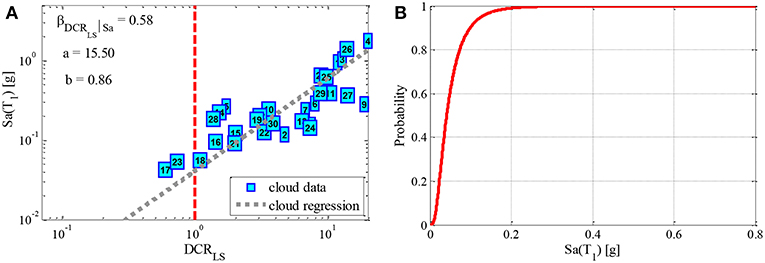
Figure 7. Cloud regression (A) and fragility curve (B) for the LS limit state with respect to the bare building.
Building Structural Upgrading
Upgrading Operations
The main goal of the upgrading design is to prevent premature failure of non-ductile elements and to increase their ductility and strength. In addition, the lateral displacements need to be limited and as uniform as possible over the height of the structure to prevent soft story mechanism. To control lateral drift by keeping them below the target displacement, one effective strategy for concrete moment frame is to add lateral stiffness, e.g., by adding a shear wall, to reduce the period, and decrease the resulting displacements. Another effective way to improve ductility and strength of the frame is to increase flexural and shear strength and deformation capacity of lateral load resistant members by better confining the columns and shifting the failure mode from shear to flexural mode (e.g., by enlarging the cross section of concrete jacketing). In some cases, to avoid the restriction of use of building for a long time, methods based on a quick application, such as fiber reinforced polymers (FRP), can be useful. However, there are many practical upgrading options (Moehle, 2000; Thermou and Elnashai, 2006; Formisano et al., 2008; Calvi, 2013; Formisano and Mazzolani, 2015b; Bertolesi et al., 2017; Miano et al., 2018b). It's important to highlight that coherently with the actual Italian code, in case of seismic retrofit of a public building, the minimum value of the ζE after the upgrading operations should be 0.60. In this building, steel jacketing is chosen as upgrading technique. The reason for choosing this technique is that there was no possibility to change the dimensions of the cross sections, due to architectural recommendations. Moreover, there was a quite total absence of steel in the structural members. The steel jacketing is less invasive with respect to other common upgrading strategies. The purpose of the steel jacketing is to increase the low shear strength of the elements (as a result of the lack of stirrups) and, in particular for the columns, to increase the bearing capacity due to the concrete confinement effect. It is to note that also the FRP wrapping allows to have a good increase of confinement action (Formisano et al., 2006, 2017b; Laterza et al., 2017). However, the steel jacketing has been chosen because it allowed an higher increase of the flexural capacity of the members, given a fixed economical threshold. The steel jacketing is applied to the structural elements (e.g., columns and beams, see Figures 3C,D) with a rectangular section. The jacket consists of four angular profiles (dimensions 60 × 60 × 6 mm) connected by welded plates, with a width of 60mm and a thickness of 6 mm positioned with appropriate distance. The angular profiles are fixed to the element by epoxy resin, after preliminary treatment of the surface of the members, with protection of the bars, restoring of the concrete cover with cement mortar and cleaning of the surface.
Non-linear Static Analysis Procedure
First, it is to note that the same modeling approach used for the bare building is used also for the upgraded building. As for the bare building, pushover analysis has been carried out by following the Italian seismic code (NTC, 2008) for the case study upgraded building. A number of 16 pushovers has been done, using two different distributions of forces and using a possible eccentricity of the 5% in each direction. Figure 8 shows the pushover results in terms of base shear vs. top displacement. As explained for the pushovers of the bare building, the red curves correspond to forces parallel to horizontal × positive direction (see Figure 1); the blue curves correspond to forces parallel to horizontal × negative direction; the black curves correspond to forces parallel to horizontal y positive direction; the green curves correspond to forces parallel to horizontal y negative direction.
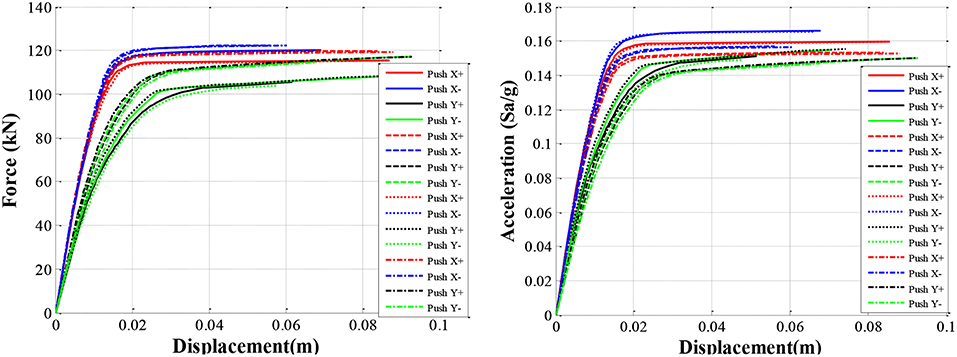
Figure 8. Pushover curves for the case study building after steel jacketing.
Figure 9 shows for the LS limit state with red color the members for which the safety verifications are not satisfied and with green color the members for which the safety verifications are satisfied, showing that however a limited number of members result unsafe. It is to note that the unsafe members still present shear deficiencies and so the first crisis in the members is still related to possible shear failure. The reason is related to the impossibility to operate in that zone of the building, as consequence of the presence of the engine of the climate installations, that is fundamental to be preserved in a swimming pool. However, as general goal of the upgrading, a vulnerability index of 0.61 has been achieved.
Figure 9. Safety verifications for the case study building after steel jacketing.
Non-linear Dynamic Analysis Procedure
Figure 10 shows the scatter plots for Cloud Analysis data D = {(Sa,i, DCRLS,i), i = 1:30 for the set of records outlined in Table 3. For each data point (cyan colored squares), the corresponding record number is shown. Moreover, the figure illustrates the Cloud Analysis regression prediction model (i.e., regression line and the estimated parameters, see Equation 2) fitted to the data. The line DCRLS = 1 corresponding to the onset of limit state (herein, DL in Figure 10A and LS in Figure 10B) is also shown with red-dashed line. Figure 11 shows the resulting Cloud Analysis-based fragility curves for the pre e post upgrading building with reference to the limit states of DL and LS. For DL limit state, the capacity is assumed as the displacement corresponding to the end of the bilinear system of the SDOF. The LS capacity, instead, is attained in correspondence of the ultimate displacement of the bilinear system of the SDOF. The values of the statistics (e.g., median and the logarithmic standard deviation) associated with the Cloud Analysis based fragility curve are, respectively, 0.51 and 0.66 (LS limit state) and 0.13 and 0.66 (DL limit state).
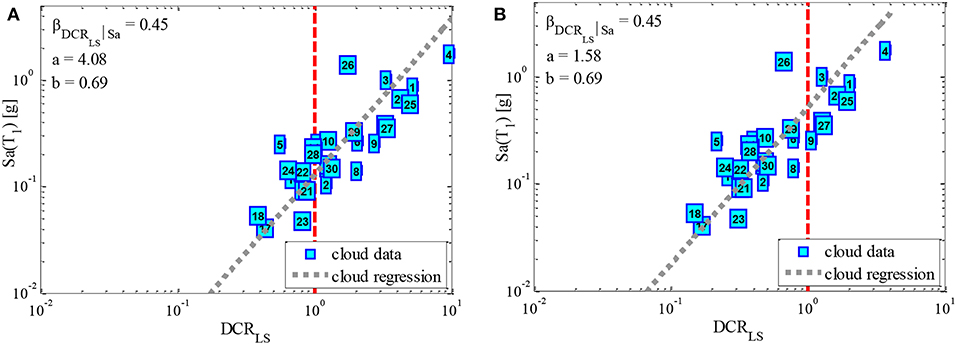
Figure 10. Cloud regression for (A) DL limit state and (B) LS limit state.
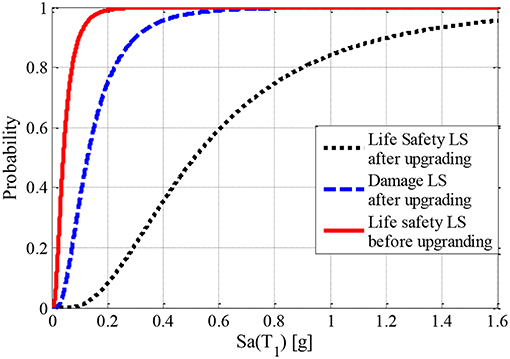
Figure 11. Fragility curves comparison before and after upgrading operations.
Class of Risk According to Italian Seismic Classification Before and After the Upgrading
In this last section, the class of risk (according to the Italian Guidelines on the seismic classification, Guidelines, 2017) is calculated for the case study building before and after the upgrading. Once the capacity of the structure is assessed, two parameters are calculated. The first parameter is economic and is called expected annual mean losses (Perdite Annue medie, PAM). The second one is related to the safety of the structure and id called Life Safety Index (Indice di sicurezza della vita, IS-V). The same calculation is repeated after the upgrading. It is to note that with the 2017 law (Italian Balance Law, 2017), a campaign has been launched for the seismic improvement of existing structures. This is the so-called “Sismabonus,” an opportunity to stimulate a voluntary plan for the evaluation and prevention of seismic risk of buildings. In this context, the Italian guidelines have been conceived, with the goal of providing the operational tools for classifying the seismic risk of buildings; The document defines eight Classes of Risk, with increasing risk from letter A+ to G, and establishes two methods for determining the risk class of a building: the conventional method and the simplified one. The first one is conceptually applicable to any type of construction and is based on the application of the standard methods of analysis provided by the current codes (NTC, 2018) and allows the assessment of the class of risk of the construction both before and after upgrading. Instead, the simplified method, applicable only to masonry buildings, allows a reliable but simplified estimate. Herein, in the following seismic classification, the conventional method is used. As said, for the determination of the risk class, reference is made to two parameters (e.g., the PAM, that takes into account the economic losses associated with damage to the elements, structural or not and the IS-V, that takes into account the safety of the structure or the safety index). The seismic risk class assessment procedure includes the following steps:
• PGA evaluation: with respect to the specific site, the peak ground accelerations, PGAD, for reaching the different limit states are evaluated;
• Structural analysis: the values of the capacity peak ground accelerations, PGAC, which induce the achievement of LS and DL limit states are calculated;
• Identification of the IS-V class, that is the relationship between the PGAC (for LS limit state) and the PGAD of the site where the construction is located. The percentage value obtained, through the table shown in Figure 12A, allows to identify the seismic risk class of the building according to the vulnerability index.
• Vulnerability analysis—which allows to quantify the structural and non-structural damage consequent to the achievement of certain levels by the response parameters, through the calculation of the following values: (a) return periods, TrC, associated with the earthquakes that generate such accelerations; (b) value of the annual average frequency of exceeding λ (equal to the inverse of the return period); (c) the value of the reconstruction cost percentage (CR%) associated with the corresponding value of λ for each of the limit states considered;
• Identification of the PAM class as the area under the curve representing direct economic losses, obtained as function of the annual average frequency of exceeding the events that cause the achievement of a certain limit state for the structure. The PAM Class is identified, using the table shown in Figure 12B.
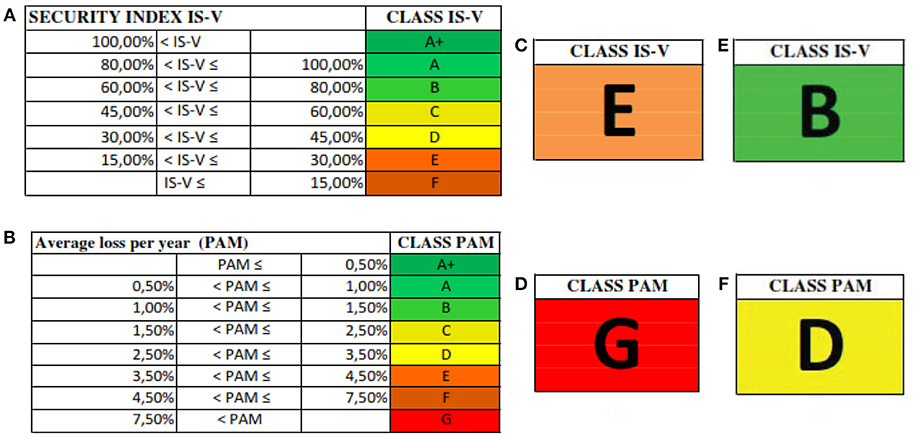
Figure 12. (A) Assignment of the IS-V risk class according to the size of the Security Index; (B) Attribution of the PAM risk class according to the magnitude of the expected annual average Losses; (C) IS-V class before upgrading; (D) PAM class before upgrading; (E) IS-V class after upgrading; (F) PAM class after upgrading.
Finally, the risk class is identified as the worst class between the PAM class and the IS-V class. Figure 12 shows the results in terms of risk class before and after the upgrading operations for the case study building. It can be noted that before the upgrading operations the risk class was G, while after the upgrading operations, the risk class D is achieved.
Conclusions
The “Collana” football stadium was initially built in the late '20s and then be completely rebuilt in the post-war period and used as a multi-sports center together with other buildings. The present work concerns the description and verification of the structural upgrading design for the swimming pool building, realized inside the more general scope of the project of functional upgrading of the entire building. The upgrading of the building is designed in order to solve the vertical loads deficiency and to achieve a certain threshold of the seismic vulnerability index, as described in Italian code. Based on different considerations related to effectiveness, costs and invasive grade of the upgrading options, steel jacketing is chosen. The steel jacketing is realized through steel plates wrapped completely around the beams plus angular plates in the corners around the length of the members. All the columns and the members are steel jacketed. Assessment and upgrading are shown both based on linear and dynamic non-linear analyses procedures. In particular, the achievement of an adequate value of seismic vulnerability index through non-linear static analysis, as required for buildings susceptible to crowding in the case of temporary use of the structure for purposes related to the management of the emergencies in general, is shown. Moreover, non-linear dynamic analyses are implemented to measure the probability of achieving predefined limit states before and after the upgrading. Finally, the seismic risk class is assigned before and after the upgrading according to two parameters. The final results show the effectiveness of the structural interventions of upgrading with respect to the application of non-linear static and dynamic analyses procedures and based on the new Italian guidelines for seismic risk classification of construction.
Data Availability
The datasets generated for this study are available on request to the corresponding author.
Author Contributions
AM is responsible for the organization and implementation of this research. GC is responsible for the structural calculations. AS is responsible for the architectural design project.
Conflict of Interest Statement
The authors declare that the research was conducted in the absence of any commercial or financial relationships that could be construed as a potential conflict of interest.
References
Aslani, H., and Miranda, E. (2005). Probabilistic Earthquake Loss Estimation and Loss Disaggregation in Buildings, Dissertation, Stanford University.
Bertolesi, E., Fabbrocino, F., Formisano, A., Grande, E., and Milani, G. (2017). FRP-strengthening of curved masonry structures: local bond behavior and global response. Key Eng. Mat. 747, 134–141. doi: 10.4028/www.scientific.net/KEM.747.134
Braga, F., Caprili, S., Gigliotti, R., and Salvatore, W. (2015). Hardening slip model for reinforcing steel bars. Earthq. Struct. 9, 503–539. doi: 10.12989/eas.2015.9.3.503
Braga, F., Gigliotti, R., Laterza, M., D'Amato, M., and Kunnath, S. (2012). Modified steel bar model incorporating bond-slip for seismic assessment of concrete structures. ASCE J. Struct. Eng. 138, 1342–1350. doi: 10.1061/(ASCE)ST.1943-541X.0000587
Calvi, G. M. (2013). Choices and criteria for seismic strengthening. J. Earth Eng. 17, 769–802. doi: 10.1080/13632469.2013.781556
Caprili, S., Moersch, J., and Salvatore, W. (2015). Mechanical Performance vs. corrosion damage indicators for corroded steel reinforcing bars. Adv. Mater. Sci. Eng. 2015:739625. doi: 10.1155/2015/739625
Celik, O. C., and Ellingwood, B. R. (2010). Seismic fragilities for non-ductile reinforced concrete frames–role of aleatoric and epistemic uncertainties. Struct. Saf. 32, 1–12. doi: 10.1016/j.strusafe.2009.04.003
Circolare (2009). Circolare 2 febbraio 2009 n. 617 del Ministero delle Infrastrutture e dei Trasporti (G.U. 26 febbraio 2009 n. 27 – Suppl. Ord.), Istruzioni per l'applicazione delle 'Norme Tecniche delle Costruzioni' di cui al D.M. 14 gennaio 2008.
Cosenza, E., Del Vecchio, C., Di Ludovico, M., Dolce, M., Moroni, C., Prota, A., et al. (2018). The Italian guidelines for seismic risk classification of constructions: technical principles and validation. Bull. Earthq. Eng. 16, 5905–5935. doi: 10.1007/s10518-018-0431-8
D'Amato, M., Braga, F., Gigliotti, R., Laterza, M., and Kunnath, S. (2012). Validation of a modified steel bar model incorporating bond-slip for seismic assessment of concrete structures. ASCE J. Struct. Eng. 138, 1351–1360. doi: 10.1061/(ASCE)ST.1943-541X.0000588
Fajfar, P. (1999). Capacity spectrum method based on inelastic demand spectra. Earth Eng. Struct. Dyn. 28, 979–994.
Fajfar, P. (2000). A nonlinear analysis method for performance-based seismic design. Earth Spectr 16, 573–592. doi: 10.1193/1.1586128
Formisano, A., Castaldo, C., and Chiumiento, G. (2017a). Optimal seismic upgrading of a reinforced concrete school building with metal-based devices using an efficient multi-criteria decision-making method. Struct. Infrastruct. Eng. 13, 1373–1389. doi: 10.1080/15732479.2016.1268174
Formisano, A., De Matteis, G., Panico, S., and Mazzolani, F.M. (2008). Seismic upgrading of existing RC buildings by slender steel shear panels: a full-scale experimental investigation. Adv. Steel Constr. 4, 26–45.
Formisano, A., Di Lorenzo, G., Iannuzzi, I., and Landolfo, R. (2017b). Seismic vulnerability and fragility of existing Italian industrial steel buildings. Open Civil. Eng. J. 11, 1122–1137. doi: 10.2174/1874149501711011122
Formisano, A., Faggiano, B., Landolfo, R., and Mazzolani, F. M. (2006). “Ductile behavioural classes of steel members for seismic design,” in Proceedings of the 5th International Conference on Behaviour of Steel Structures in Seismic Areas (Yokohama), 225–232.
Formisano, A., Iaquinandi, A., and Mazzolani, F.M. (2015). Seismic retrofitting by FRP of a school building damaged by Emilia-Romagna earthquake. Key Eng. Mat. 624, 106–113. doi: 10.4028/www.scientific.net/KEM.624.106
Formisano, A., Lombardi, L., and Mazzolani, F. M. (2016). Perforated metal shear panels as bracing devices of seismic-resistant structures. J. Constr. Steel Res. 126, 37–49. doi: 10.1016/j.jcsr.2016.07.006
Formisano, A., and Mazzolani, F. M. (2015b). On the selection by MCDM methods of the optimal system for seismic retrofitting and vertical addition of existing buildings. Comput. Struct. 159, 1–13. doi: 10.1016/j.compstruc.2015.06.016
Formisano, A., and Sahoo, D. R. (2015a). Steel shear panels as retrofitting system of existing multi-story RC buildings: case studies. Adv. Struct. Eng. Mech. 1, 495–512. doi: 10.1007/978-81-322-2190-6_41
Frascadore, R., Di Ludovico, M., Prota, A., Verderame, G. M., Manfredi, G., Dolce, M., et al. (2015). Local strengthening of reinforced concrete structures as a strategy for seismic risk mitigation at regional scale. Earth Spectr. 31, 1083–1102. doi: 10.1193/122912EQS361M
Guidelines (2017). Guidelines for the seismic risk classification of constructions, Decreto del Ministero delle Infrastrutture e dei Trasporti 28 febbraio 2017, n. 58.
Italian Balance Law (2017). L.205/17, Balance Law 2018, Official Gazette n. 302 of 29/12/17, Ordinary Supplement n. 62 (in Italian).
Jalayer, F., Beck, J., and Zareian, F. (2012). Analyzing the sufficiency of alternative scalar and vector intensity measures of ground shaking based on information theory. J. Eng. Mech. 138, 307–316. doi: 10.1061/(ASCE)EM.1943-7889.0000327
Jalayer, F., De Risi, R., and Manfredi, G. (2015). Bayesian Cloud Analysis: efficient structural fragility assessment using linear regression. Bull. Earth Eng. 13, 1183–1203. doi: 10.1007/s10518-014-9692-z
Jalayer, F., and Ebrahimian, H. (2017). Seismic risk assessment considering cumulative damage due to aftershocks. Earthq. Eng. Struct. Dyn. 46, 369–389. doi: 10.1002/eqe.2792
Jalayer, F., Ebrahimian, H., Miano, A., Manfredi, G., and Sezen, H. (2017). Analytical fragility assessment using un-scaled ground motion records. Earth Eng. Struct. Dyn. 46, 2639–2663. doi: 10.1002/eqe.2922
Jalayer, F., Franchin, P., and Pinto, P. E. (2007). A scalar damage measure for seismic reliability analysis of RC frames. Earthq. Eng. Struct. Dyn. 36, 2059–2079. doi: 10.1002/eqe.704
Laterza, M., D'Amato, M., Braga, F., and Gigliotti, R. (2017). Extension to rectangular section of an analytical model for concrete confined by steel stirrups and/or FRP jackets. Compos. Struct. 176, 910–922. doi: 10.1016/j.compstruct.2017.06.025
Liel, A. B., and Deierlein, G. G. (2013). Cost-benefit evaluation of seismic risk mitigation alternatives for older concrete frame buildings. Earth Spectr. 29, 1391–1411. doi: 10.1193/030911EQS040M
Miano, A., Jalayer, F., Ebrahimian, H., and Prota, A. (2018a). Cloud to IDA: efficient fragility assessment with limited scaling. Earth Eng. Struct. Dyn. 47, 1124–1147. doi: 10.1002/eqe.3009
Miano, A., Jalayer, F., and Prota, A. (2017b). “Considering structural modeling uncertainties using bayesian cloud analysis,” in Proceedings of the 6th ECCOMAS Thematic Conference on Computational Methods in Structural Dynamics and Earthquake Engineering (Rhodes).
Miano, A., Sezen, H., Jalayer, F., and Prota, A. (2017a). “Performance based comparison of different retrofit methods for reinforced concrete structures,” in Proceedings of the 6th ECCOMAS Thematic Conference on Computational Methods in Structural Dynamics and Earthquake Engineering (Rhodes).
Miano, A., Sezen, H., Jalayer, F., and Prota, A. (2018b). “Performance based assessment and retrofit of non ductile existing reinforced concrete structures,” in Proceedings of the Structures Conference (Fort Worth, TX).
Moehle, J.P. (2000). “State of research on seismic retrofit of concrete building structures in the US,” in US-Japan Symposium and Workshop on Seismic Retrofit of Concrete Structures.
NTC (2008). - D. M. Infrastrutture Trasporti 14 gennaio 2008, Norme tecniche per le Costruzioni, G.U. 4 febbraio 2008 n. 29 - Suppl. Ord.Circolare 2009.
NTC (2018). - D. M. Infrastrutture Trasporti 17 gennaio 2018, Norme tecniche per le Costruzioni, G.U. 20 febbraio 2018 n. 42 - Suppl. Ord.
Sezen, H., and Moehle, J. P. (2004). Shear strength model for lightly reinforced concrete columns. J. Struct. Eng. 130, 1692–1703. doi: 10.1061/(ASCE)0733-9445(2004)130:11(1692)
Thermou, G. E., and Elnashai, A. S. (2006). Seismic retrofit schemes for RC structures and local-global consequences. Prog. Struct. Eng. Mater. 8, 1–15. doi: 10.1002/pse.208
Keywords: structural upgrading, historical buildings, non-linear static analysis procedure, non-linear dynamic analysis procedure, seismic risk classification of the constructions
Citation: Miano A, Chiumiento G and Saggese A (2019) Structural Assessment and Upgrading for an Old Building Belonging to an Historical Multi-Sports Center in Naples. Front. Built Environ. 5:23. doi: 10.3389/fbuil.2019.00023
Received: 08 January 2019; Accepted: 13 February 2019;
Published: 15 March 2019.
Edited by:
Michele D'amato, University of Basilicata, ItalyReviewed by:
Silvia Caprili, University of Pisa, ItalyVito Michele Casamassima, University of Basilicata, Italy
Rosario Gigliotti, Sapienza University of Rome, Italy
Copyright © 2019 Miano, Chiumiento and Saggese. This is an open-access article distributed under the terms of the Creative Commons Attribution License (CC BY). The use, distribution or reproduction in other forums is permitted, provided the original author(s) and the copyright owner(s) are credited and that the original publication in this journal is cited, in accordance with accepted academic practice. No use, distribution or reproduction is permitted which does not comply with these terms.
*Correspondence: Andrea Miano, YW5kcmVhLm1pYW5vQHVuaW5hLml0