 T. Y. Yang
 Hediyeh Sheikh
 Lisa Tobber
- 1International Joint Research Laboratory of Earthquake Engineering, Tongji University, Shanghai, China
- 2Department of Civil Engineering, University of British Columbia, Vancouver, BC, Canada
Concentrically braced frame (CBF) is an effective and prevalent seismic force resisting system which is commonly used in low-rise buildings. This type of structural system utilizes steel braces to provide the stiffness and strength needed to dissipate earthquake energy. Several bracing configurations have been proposed in different building codes worldwide. These codes provide detailed design requirements for the structural members and connections, but no guidance is provided in selecting the best bracing configuration for the design. In this study, the impact of the bracing configuration on the seismic response of a five-story prototype office building located in Vancouver, Canada, is systematically examined. Five different bracing configurations were designed according to the National Building Code of Canada and CSA S16 standard. Detailed structural responses, initial costs, and life cycle costs of the prototype building with five different bracing configurations were systematically compared. The results show that the different bracing configurations play an important role in sizing the structural members, which impacts the initial material usage and the overall life cycle cost of the building.
Introduction
Steel concentrically braced frame (CBF) is a seismic force resisting system (SFRS) commonly used in seismic zones around the world. This type of SFRS is effective in providing the stiffness and strength needed to resist earthquake forces. In the Canadian steel building code, CSA S16-14 (CSA, 2014), there are two types of steel CBFs: (1) moderate ductile concentrically braced frame (MD-CBF) and (2) limited ductile concentrically braced frame (LD-CBF). The MD-CBF is targeted to be used in high seismic zones, where the SFRS is designed to have enhanced ductility through yielding of the steel braces, while the beams and columns are capacity designed to resist the maximum load produced by the braces. On the other hand, the LD-CBF is targeted to be used for locations with less earthquake shaking, where the ductility requirement of the braces can be relaxed.
Multiple MD-CBF configurations have been pre-qualified by the CSA S16-14 (CSA, 2014). The configurations include: inverted V-braced (I-VBF), V-braced (VBF), X-braced (XBF), and Multistory-X-braced (M-XBF).
According to CSA-S16-14, the probable tensile and compressive resistance of bracing members shall be taken as Equations (1, 2), respectively.
Where Ag = gross cross sectional area of the brace; Ry = the expected strength factor; Fy = specified yield stress; ϕ = resistance reduction factor and Cr is computed using RyFy.
The probable post-buckling compressive resistance of bracing members shall be taken as Equation (3).
In the V- or inverted V- bracing configurations, the beam must be designed to be continuous between columns and capable of resisting the maximum unbalanced vertical and horizontal loads when the braces below (inverted V) or above (V) the beam has buckled and yielded. This makes the beams in the V- or inverted V- bracing configurations of the MD-CBF very large. To mitigate the unbalanced force demand in the beam, the suspended zipper braced frame (SZBF) was proposed by Yang et al. (2009b). SZBF uses zipper columns placed between the braces to transfer the unbalanced vertical forces to higher stories. To prevent the structure from losing total stiffness, the top story braces of the SZBF are capacity designed to resist the combined unbalanced vertical loads when all the braces yielded and buckled. Similarly, the beams in the M-XBF system must be capacity designed for the yielding and buckling of the braces. Due to the symmetrical geometry of the M-XBF configuration, the unbalanced forces from the floor above and below cancel each other out (if the braces are of the same size). This results in smaller beams compared to the V- or inverted V- bracing configurations. Similarly, in the X-bracing configuration, there are no unbalanced vertical forces in the beams, but the columns are designed to resist large axial forces when the braces have yielded and buckled.
The building code provides detailed design requirements for each of the MD-CBF bracing configurations. However, there has been little discussion about the differences in seismic performance. Although there have been some previous studies comparing different bracing configurations (Mahmoudi and Zaree, 2010; Patil and Sangle, 2015; Ozcelik et al., 2016), the present study is the only one that shows a detailed cost comparison on a Canadian designed building.
In this study, a five-story office prototype building located in Vancouver, British Columbia, Canada was used to compare the seismic performance of the prototype building using each of the I-VBF, VBF, XBF, M-XBF, and SZBF bracing configurations. The prototype building was designed according to the National Building Code of Canada (NBCC, 2015) and the Canadian Institute of Steel Construction design standard S16-14 (CSA, 2014). Detailed finite element models of the prototype building with each of the bracing configurations were developed using OpenSees (McKenna et al., 2009). The finite element models were calibrated against available experimental data. The calibrated finite element models were then subjected to ground motions selected and scaled to three earthquake shaking intensities at the prototype site. Detailed initial construction costs, structural response, and life cycle costs of the prototype building using each of the pre-qualified MD-CBF configurations were examined in this study.
Description of the Prototype Building
The prototype structure is a five-story office building located in Vancouver, British Columbia, Canada, which was adopted from Yang and Murphy (2015). The prototype building was designed according to the National Building Code of Canada (NBCC, 2015) and the CSA-S16-14 (CSA, 2014). The plan dimensions of the building are 45 m by 63 m. The story height is 4.25 m for the first floor and 3.65 m for other floors. Figure 1 shows the global view and plan view of the SFRS. Five different bracing configurations: (1) Inverted V-braced (I-VBF); (2) V-braced (VBF); (3) Suspended zipper column braced (SZBF); (4) Multistory-X-braced (M-XBF); (5) X-braced (XBF), were included in this study. Figure 2 shows the member sizes of the SFRS. Table 1 shows the summary of the gravity frame elements used for all bracing configurations.

Figure 1. (A) Global view of prototype building and (B) location of the MD-CBFs on the plan view.
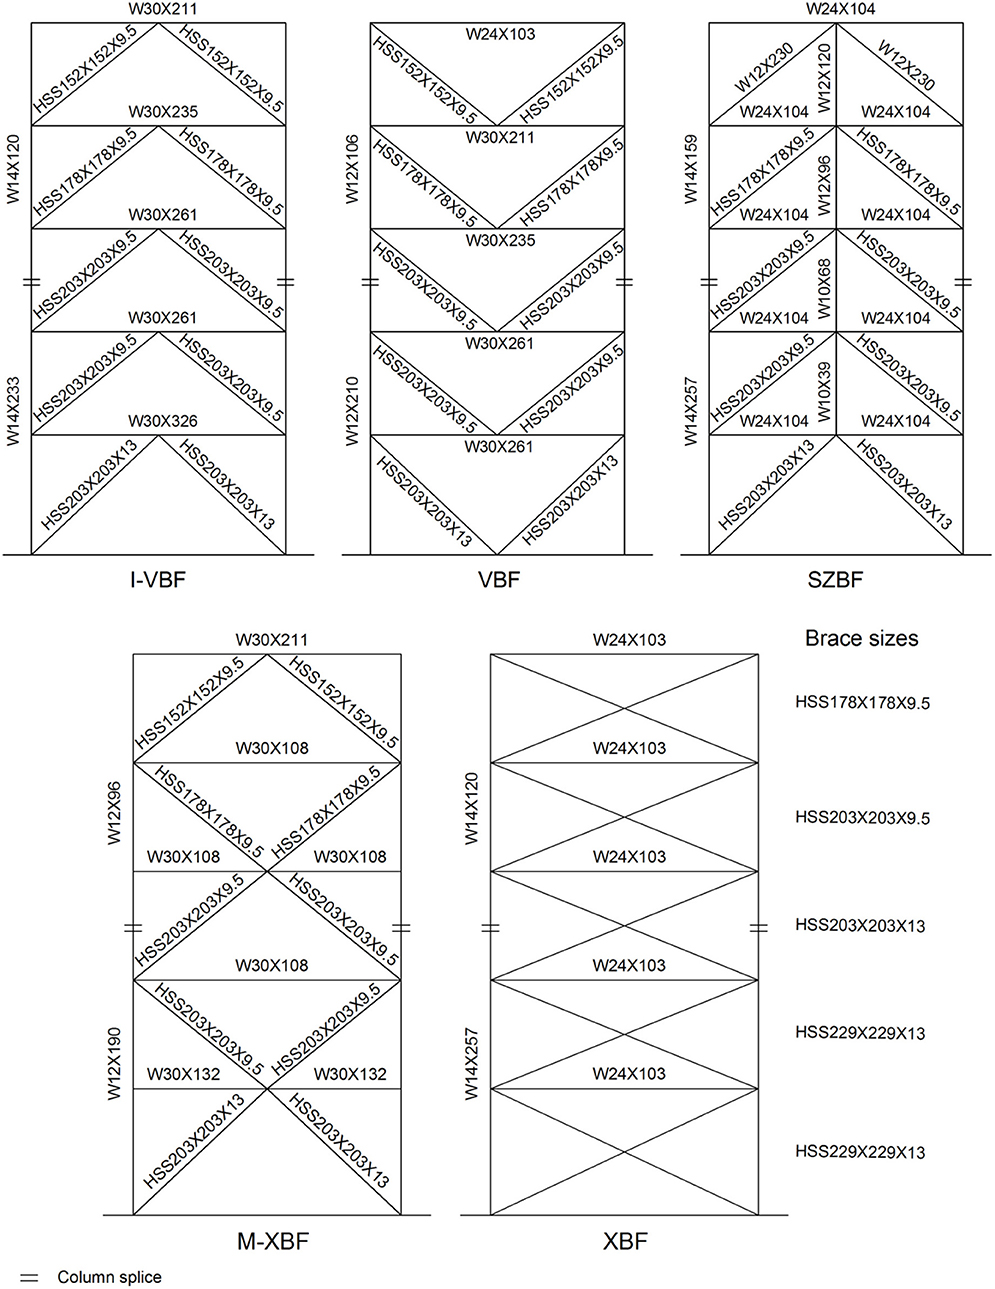
Figure 2. Member sizes of the SFRS.
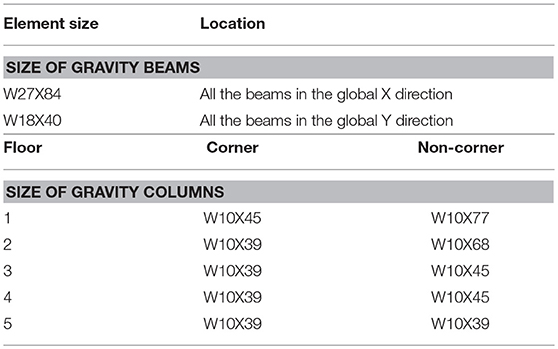
Table 1. Size of the gravity frame elements.
Description of the Finite Element Models
The numerical models of the prototype building were generated using OpenSees (McKenna et al., 2009). Due to the symmetrical nature of the prototype building in the two principal axes, only half of the building was modeled. Because the SFRS was designed to be decoupled in the two principal axes, only the response in the East-West direction is presented in this paper. Masses were lumped at the nodes of the model at each floor based on the tributary area. An average value of 633,000 Kg was assigned at each floor. Rayleigh damping of 2.5%, based on the mass and tangent stiffness proportional damping, was assigned in the first and third modes. The first three vibrational periods of each MD-CBFs are shown in Table 2.
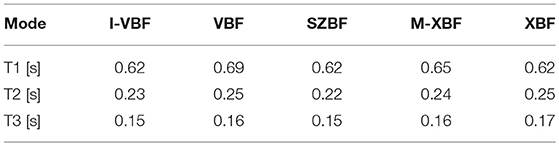
Table 2. Structural periods of systems.
The steel braces were modeled following the approach developed by Yang et al. (2009a), where the braces were modeled using two flexibility-formulation non-linear beam-column elements with fiber sections. Uniaxial Menegotto-Pinto steel material (Steel02) in OpenSees was used to model the kinematic and isotropic hardening of the steel material. Rotational springs with rotational stiffness of EI/5Lb, where E is the modulus of elasticity, I is the moment of inertia about the plane of bending, and Lb is the total length of the brace, were added to the ends of the braces using zero-length elements to simulate the gusset plate response (Yang et al., 2009b). A geometric imperfection of 0.1% of the brace length was used according to the procedure presented in Uriz (2008). The corotational geometry transformation proposed by De Souza (2000) was used to simulate the second-order geometry effects (P-Δ effects). Figure 3A shows the analytical model for the steel braces. Figure 3B and Figure 3C show the comparison of the brace hysteresis from the analytical simulation against the experimental data presented by Black et al. (1980). The results show that the proposed numerical model can accurately simulate the non-linear behavior of the steel braces.
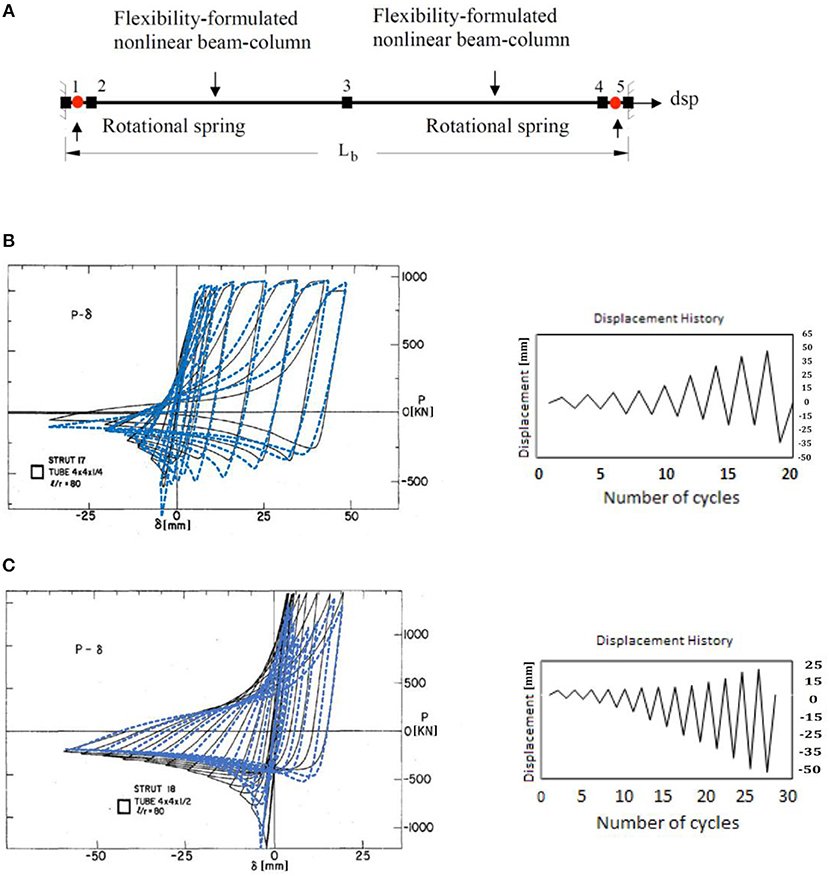
Figure 3. (A) Finite element model used to calibrate with experimental tests (Yang et al., 2009b). (B) Comparison of analytical (dashed line) and experimental (solid line) hysteretic responses of HSS4x4x1/4 and (C) HSS4x4x1/2 struts and their corresponding displacement histories.
The beams and columns of the CBFs were modeled using non-linear fiber-based beam-column elements in OpenSees. The column base connections were modeled using zero-length element according to stiffness relationships proposed by Fahmy et al. (1998). Beam to column connections for shear tab connections were modeled with the rotational properties suggested by Astaneh-Asl (2005). Figure 4 shows the finite element models developed for this study.
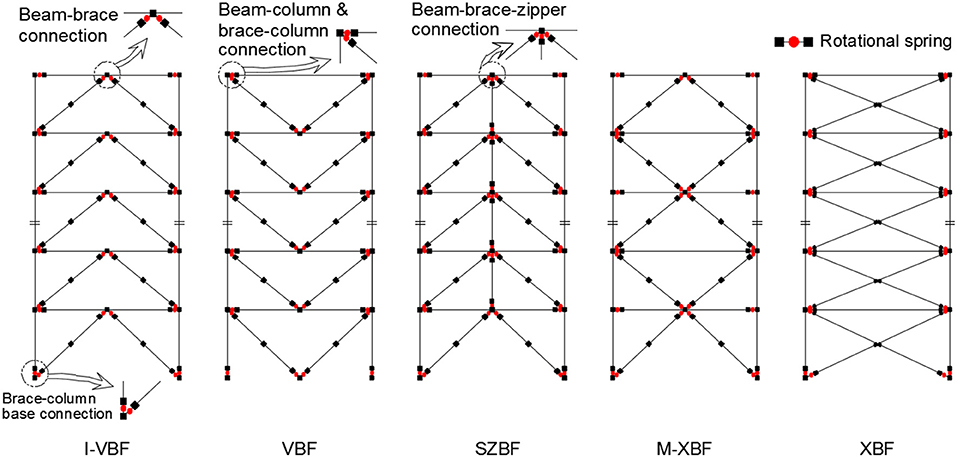
Figure 4. Finite element models of CBFs.
Selection and Scaling of Ground Motions
To simulate the seismic response of the prototype building, the 5% damped spectra for the site was obtained from Natural Resources Canada (NRC) (2016) at three hazard levels: (1) 2% probability of exceedance in 50 years (2/50); (2) 10% probability of exceedance in 50 years (10/50); and (3) 40% probability of exceedance in 50 years (40/50). Ground motions were selected from the PEER NGA database [Pacific Earthquake Engineering Research Center (PEER), 2011]. The ground motions with magnitude (Mw) between 5.5 and 8, soil shear wave velocity (Vs30) between 360 and 760 m/s, and the limited distance to the fault (0–100 km) were selected. The ground motions were amplitude scaled such that the mean spectrum for the scaled ground motions does not fall below the target spectrum by 10% over the period range from 0.15 Tmin to maximum of 2.0 Tmax and 1.5 s (where Tmin and Tmax are the shortest and longest fundamental periods of the structures, respectively). To avoid over scaling, the scale factors were limited between 0.5 and 4 as noted in the commentary of NBCC (2015). Table 3 summarizes the selected ground motions used in this study. Figure 5 shows the scaled response spectra and the target spectrum for the three hazard levels considered.
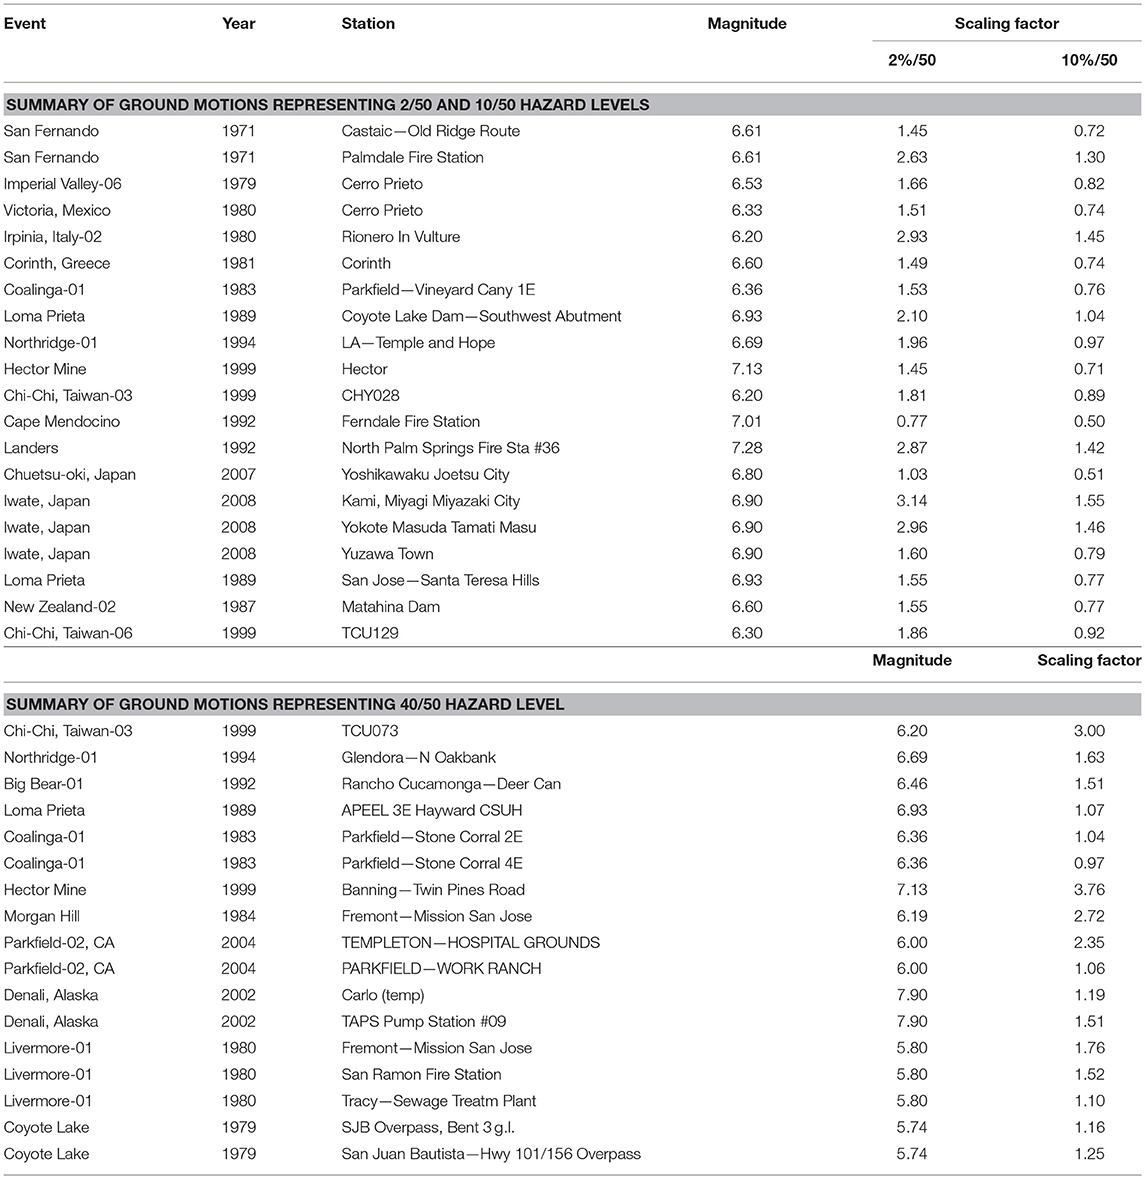
Table 3. Summary of ground motions.
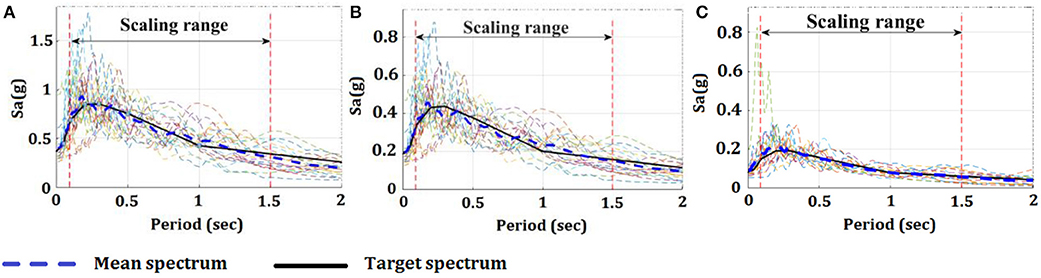
Figure 5. Response spectra of scaled ground motions at (A) the 2/50 hazard level, (B) the 10/50 hazard level, and (C) the 40/50 hazard level (Target spectrum from Natural Resources Canada (NRC), 2016).
Response Quantification
A total of 57 non-linear dynamic analyses were carried out to examine the response of the prototype building using each of the bracing configurations. Table 4 shows the summary of the structural responses. Figure 6 shows the comparison of the peak inter story drift ratio (ISD) and peak floor acceleration (FA) and the corresponding standard deviations (Std).
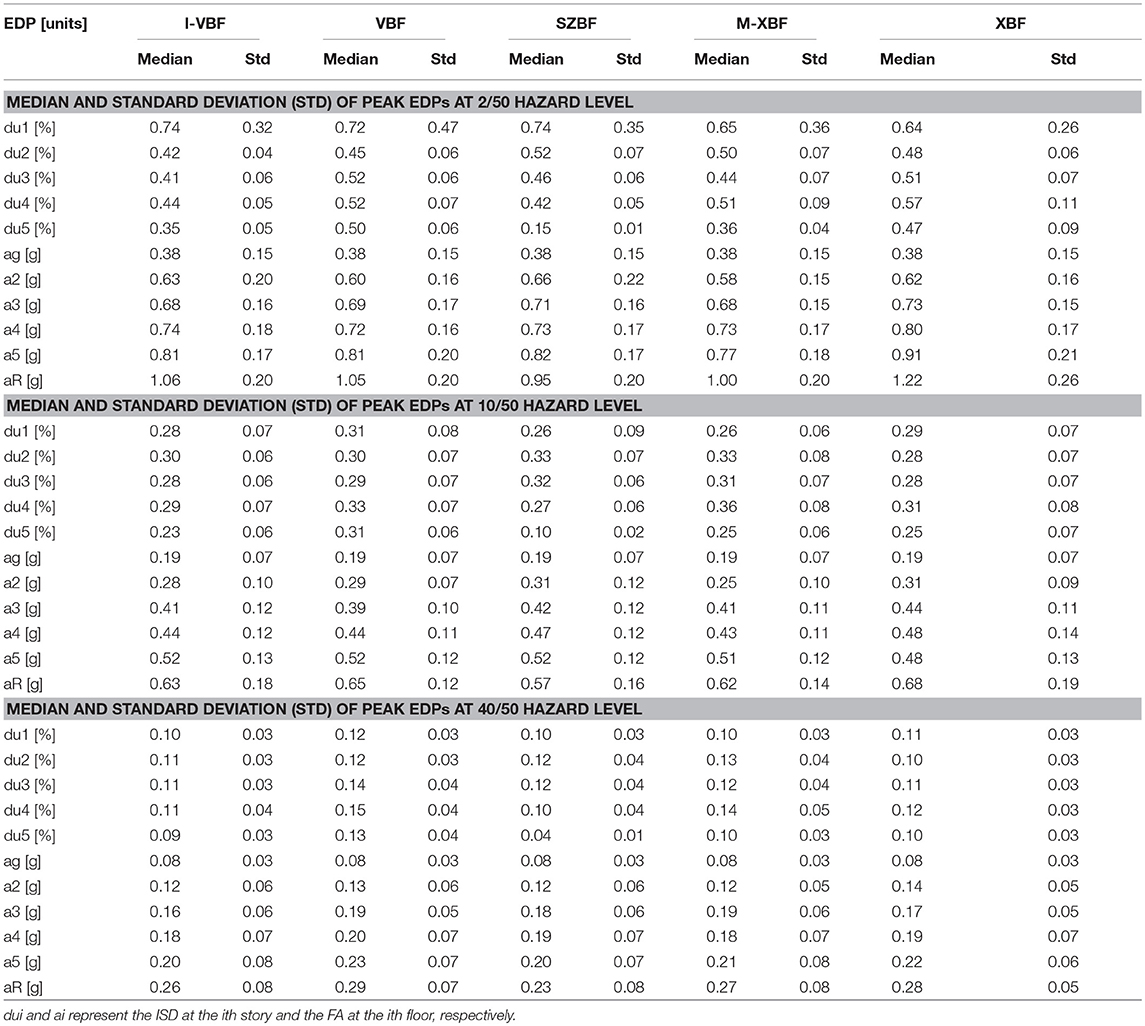
Table 4. Median and standard deviation (Std) of peak EDPs.
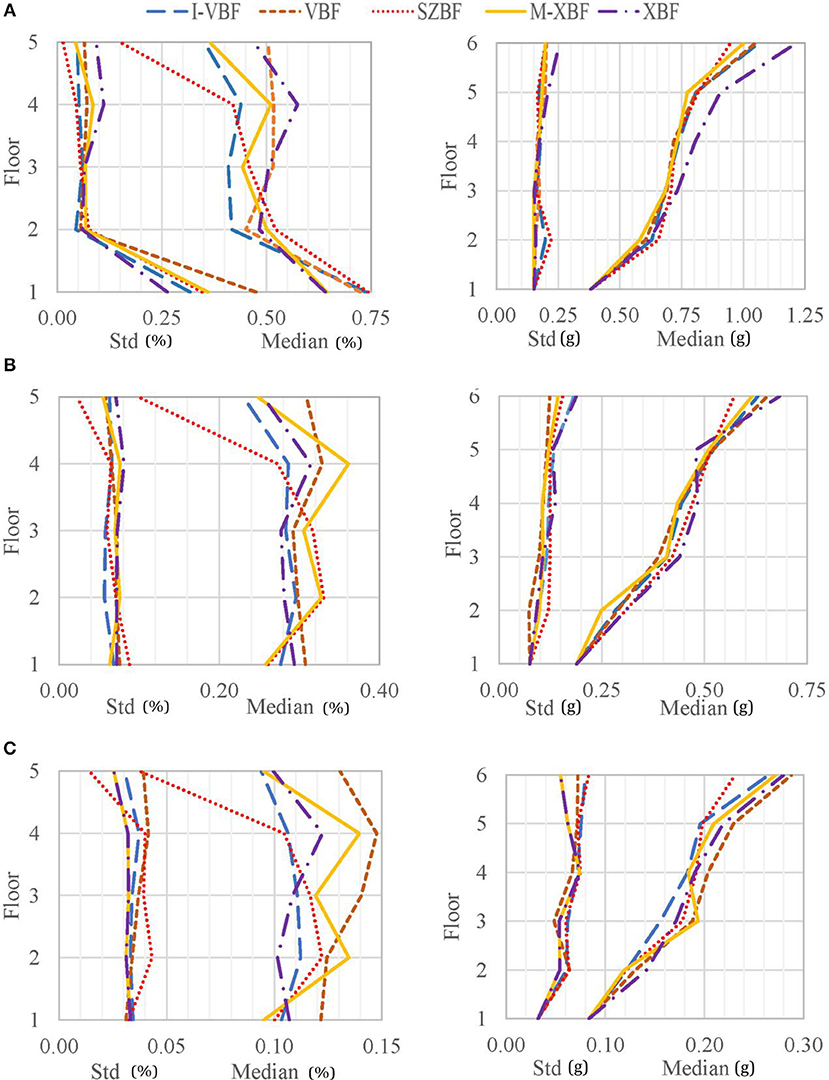
Figure 6. Median peak inter story drift ratio and its corresponding standard deviation in left plots and peak floor acceleration and its corresponding standard deviation in right plots at (A) 2/50 hazard level, (B) 10/50 hazard level, and (C) 40/50 hazard level.
At the 2/50 hazard level, all configurations have the highest ISD at the first floor. Among the bracing configurations, the SZBF, VBF and the I-VBF has the highest 1st floor ISD, while the M-XBF and XBF has the lowest 1st floor ISD. All bracing configurations have a significant reduction in ISD at the 2nd floor. The I-VBF, VBF, M-XBF, and XBF have some increase of ISD at the 3rd and 4th floor. This is likely caused by the higher mode effect. All systems show a reduction of ISD at the 5th floor. XBF has the highest ISD at the 5th floor, while the SZBF has the lowest 5th floor ISD. The variation in the ISD shows very similar trends as the median response, where the 1st floor has the largest variation. Peak floor accelerations tended to increase with height. XBF has slightly higher FA at all floors, while the other configurations all have very similar FA. The variation in FA is very similar among all configurations.
At the 10/50 hazard level, the ISD for the I-VBF, VBF, and XBF configurations are quite similar among the floors. On the other hand, the SZBF has lowest ISD at the 1st floor with increased ISD at the 2nd and 3rd floors and reduced ISD at the 4th and 5th floor. M-XBF has a similar trend as the SZBF, except 4th and 5th floor have less reduction as the SZBF. The variation in ISD is similar among the floors. In terms of FA, all configurations have a similar trend, where acceleration increases linearly at the floor number increases. The variation of FA shows a similar trend for all systems.
At the 40/50 hazard level, I-VBF and XBF configurations have similar ISD at all floors. SZBF has a similar trend as the M-XBF at the 2nd and 3rd floors but has smaller ISDs at the 4th and 5th floor. Among the different configurations, the VBF has the highest ISD for almost all floors (except the 2nd floor). The variation in ISD is very consistent among all floors. The trend for the FA is very similar for all configurations, where the FA increases as the floor number increases. The variation of FA is very similar among all floors and bracing configurations.
Performance Assessment
To quantify the seismic performance of the prototype building with different bracing configurations, the performance-based earthquake engineering (PBEE) method developed by Yang et al. (2009a) was used. The main steps of the PBEE method can be summarized as the following: (1) seismic hazard analysis; (2) response analysis; (3) damage analysis, and (4) loss analysis. Figure 7A illustrates the four analysis phases. The goal of the seismic hazard analysis is to determine the ground motions that are most representative of the seismic hazard of the prototype building site. The response analysis is used to identify the engineering demand parameters (EDPs), such as drift and acceleration that could damage the structural and non-structural components. Once the peak structural responses have been identified, the damage analysis utilizes fragility curves obtained from past research to determine the damage state (DS) of each structural and non-structural component in the prototype building. Because many structural and non-structural components could be affected by the same EDP, and the DS could be similar, these structural and non-structural components could be grouped into performance group (PG). The last step of the PBEE method is the loss analysis, where the analysis uses DS identified in the damage analysis to quantify the building repair cost.
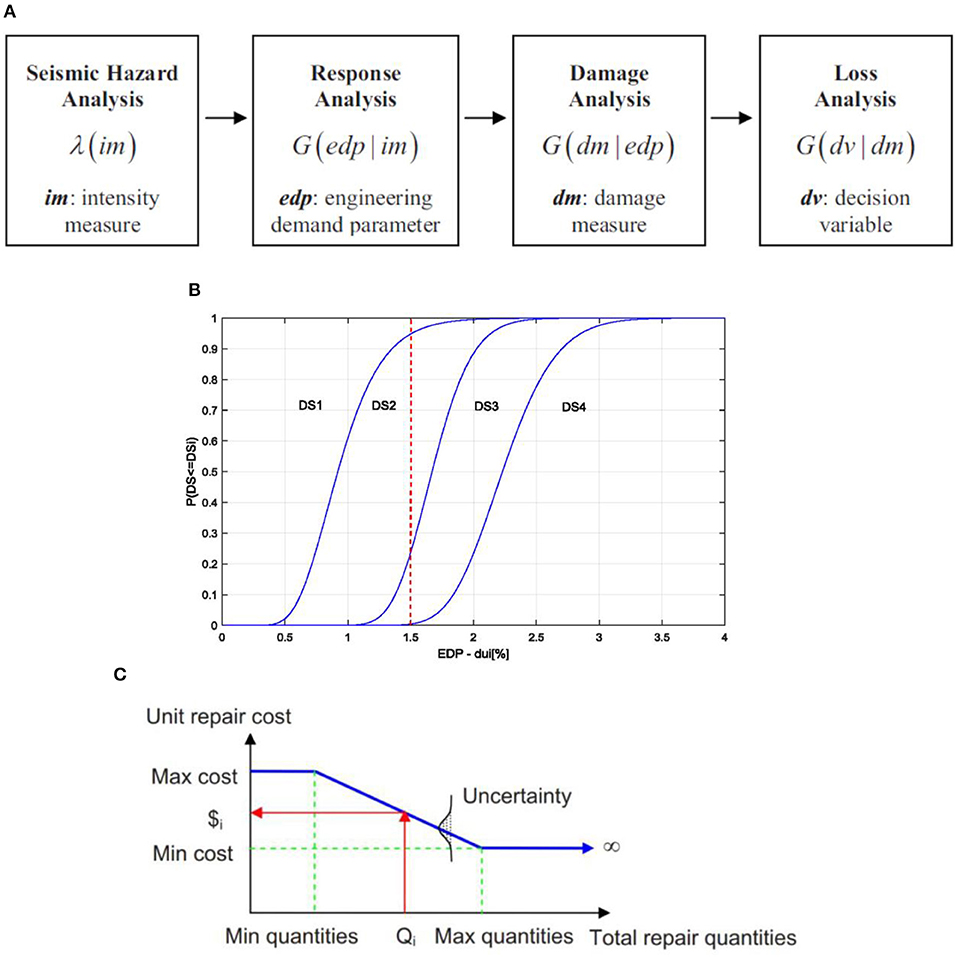
Figure 7. (A) Performance-assessment framework (Moehle and Deierlein, 2004). (B) Fragility curves for MD-CBFs. (C) Example of the unit repair cost function (Yang et al., 2009b).
In this study, 26 different PGs were defined. Each PG consists of one or more building components whose performance was similarly affected by the same EDP. The DS of each PG was determined in relation to the different types of repairs that may be required. For each DS, a fragility curve was defined to present the probability that the damage of the components of a PG will be equal or greater than the specified DSs for a given EDP. Figure 7B shows a sample fragility curve for the braces. In this fragility curve, there are four DSs. As shown in this figure, if the peak ISD equals to 1.5%, the component has a 5, 70, 25, and 0% probability of being in DS1, DS2, DS3, and DS4, respectively. The numerical values of the fragility relations, unit repair cost data, and repair quantities for all the structural and non-structural PGs were adapted from the FEMA P-58 project (FEMA, 2012). Table 5 provides the summary of the PGs and fragility data used in this study. The first five rows of Table 5 present the structural PG for the MD-CBFs system, and the rest of the table presents the non-structural components. The median and beta parameters of each DS used to determine fragility curve are also reported in Table 5. Figure 7 shows the tri-linear curve used to represent the unit repair cost. Min_Qty represents the minimum quantities, Max_cost represents the maximum cost, Max_Qty represent the maximum quantities and Min_cost represent the minimum cost. As shown in Figure 7, the unit repair cost is expected to reduce when the repair quantity is increased. Table 6 lists the data used to quantity the unit repair cost for each PG.
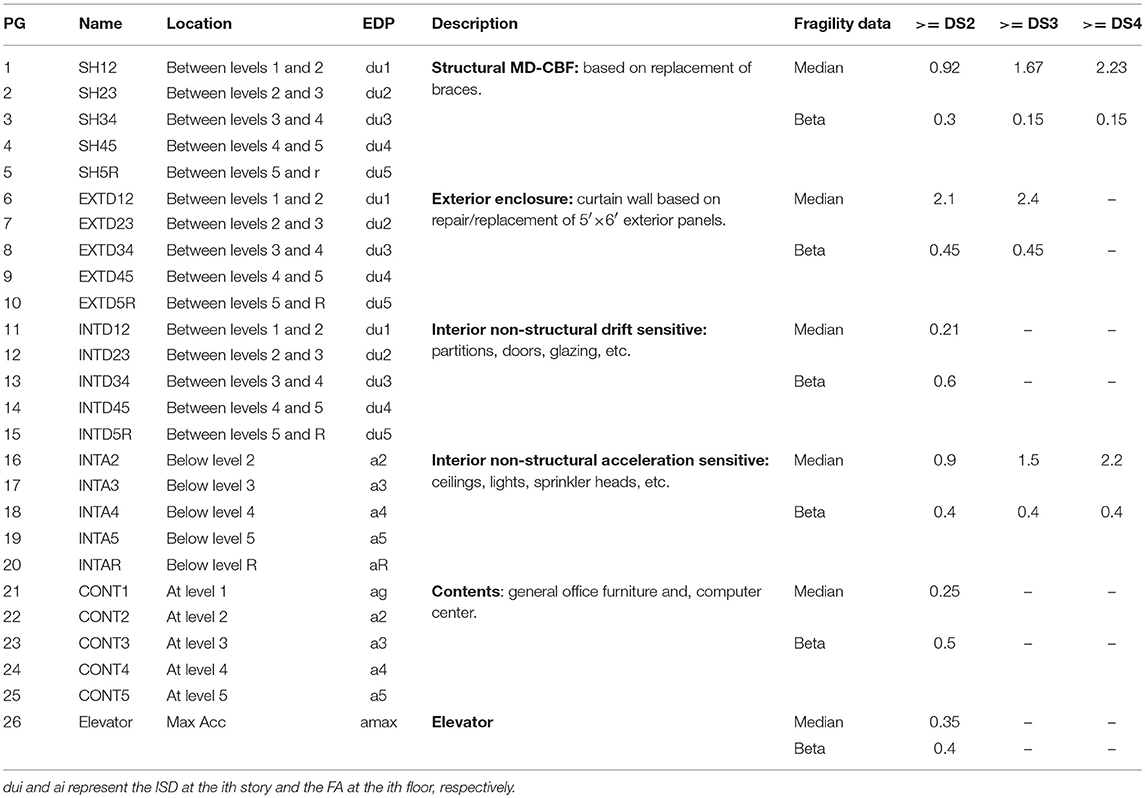
Table 5. Summary of performance groups and their corresponding fragility curve data.
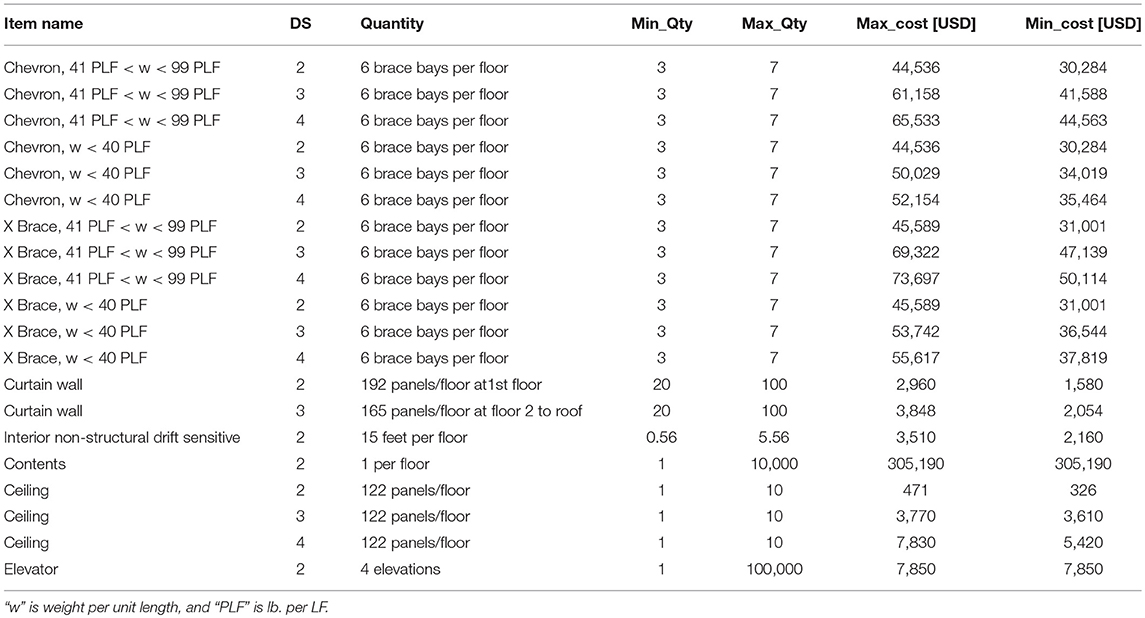
Table 6. Repair quantities and unit cost of repair items.
Result of Performance Evaluation
Table 7 shows the initial structural costs for each of the MD-CBFs configurations. The construction cost of steel components was calculated using typical steel prices in Vancouver Canada, where a unit cost of $5.6 and $7 USD per kg was used for members over and below 60 kg/m, respectively. The result shows the M-XBF uses the least column and brace material, while the XBF and SZBF have the lowest beam material. Overall, the M-XBF has the minimum structural cost, while the I-VBF has the maximum structural cost.
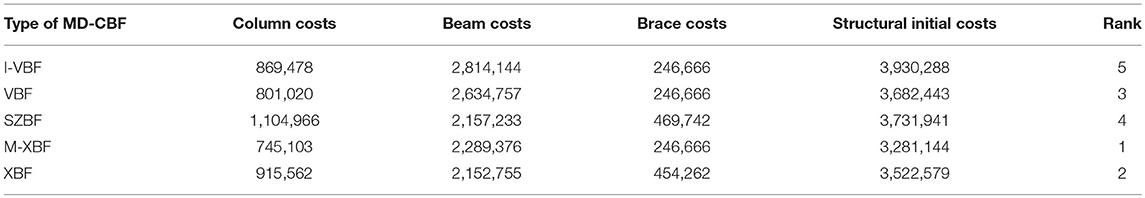
Table 7. Summary of the structural elements cost [USD].
Table 8 shows the summary of the initial construction costs, median repair costs, mean annualized cost and life cycle costs for the different bracing configurations. The initial construction cost of the prototype building was defined as the sum of the structural and non-structural components costs. The non-structural component costs were calculated using an average of $300 USD per square foot which includes the building contents, partition walls, mechanical systems, finishes, office furniture, computers and other contents (Yang and Murphy, 2015). The result shows the difference in structural bracing configurations makes <1% difference in the overall construction cost.
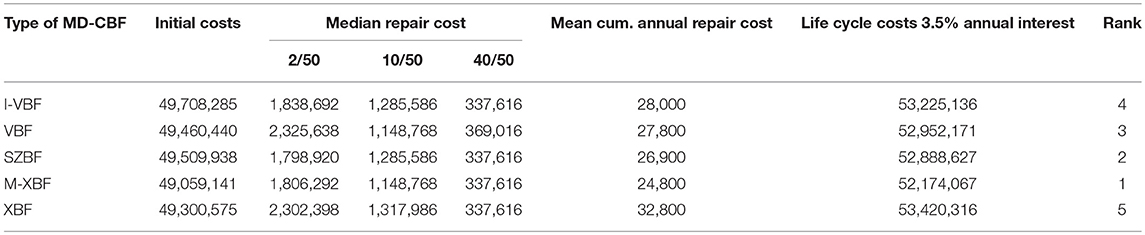
Table 8. Summary of the initial, median repair, and life cycle costs [USD].
Table 8 also shows the median repair costs. By comparing the median repair costs of different MD-CBFs configurations at 2/50 hazard level, the I-VBF, SZBF, and M-XBF have very close median repair cost in the range of $1.8 million USD, while the XBF and VBF have the highest median repair cost of about $2.3 million USD. At the 10/50 hazard level, the lowest median repair costs are for M-XBF and VBF which is about $1.2 million and the highest one is for XBF which is about $1.3 million USD. The median repair costs at 40/50 hazard level are very close for all configurations which are within the range from $340,000 USD to $370,000 USD.
The mean annual rate of the repair cost exceeding a threshold value can be determined by combining the repair cost and the seismic hazard relations. The annual exceedance probability is obtained by multiplying the slope of the hazard curve at the corresponding ground motion intensity level by the complement of the cumulative repair distribution function then integrated the resulting curves across the seismic hazard levels. This process creates a loss curve that represents the mean annual rate of the repair cost exceeding a threshold value. The area under the loss curve represents the mean cumulative total repair cost for all earthquakes over the period of 1 year. Owners and stakeholders can use this information to quantify the mean annualized loss (MAL) when comparing the performance of different bracing configurations (Yang et al., 2009a). The results of this study show that the M-XBF has the lowest MAL of $24,800 USD, while the XBF has the highest MAL of $32,800 USD.
Using the initial costs and mean annualized loss, the total life cycle costs for 50 years with 3.5% annual interest rate is summarized in Table 8. Comparing the five MD-CBF bracing configurations, the M-XBF is the most economical system and has the lowest life cycle cost. Followed by the SZBF, VBF, I-VBF, and XBF.
Summary and Conclusions
Steel CBF is a commonly used SFRS. This structural system is efficient in providing the stiffness and strength needed to resist the seismic load. In this type of SFRS, the braces are designed to be the main energy dissipation component, where they are expected to buckle and yield during strong earthquake shaking. To ensure the system still has a stable force-deformation response after the braces yielded or buckled, the beams and columns of the CBF are capacity designed based on the maximum expected brace forces. Multiple bracing configurations have been presented in the building codes. However, the building codes do not indicate which brace configuration is best suited for different application. In this study, a 5-story office building located in Vancouver, Canada was designed using five different CBF bracing configurations according to NBCC (2015), Natural Resources Canada (NRC) (2016) and CSA S16-14 (CSA, 2014). Detailed finite element models of the prototype building with each of the bracing configurations were developed. The finite element models were calibrated against experimental test then subjected to ground motions selected and scaled to three hazard levels. Detailed structural response, initial construction costs and life cycle costs of the prototype building with each of the bracing configurations were systematically examined. The following findings were observed in this study:
1) The I-VBF uses the most steel material, while the M-XBF requires about 20% less steel material than the I-VBF, making the M-XBF the lightest system among the different bracing configurations considered. The XBF has the second lightest structural materials, followed by the VBF and SZBF systems.
2) At the 2/50 hazard level, all bracing configurations have the highest ISD at the first floor. Among the bracing configurations, the SZBF, VBF, and the I-VBF have the highest 1st floor ISD, while the M-XBF and XBF have the lowest 1st floor ISD. All bracing configurations have a significant reduction in ISD at the 2nd floor. The I-VBF, VBF, M-XBF, and XBF have some increase of ISD at the 3rd and 4th floor. All systems show a reduction of ISD at the 5th floor. XBF has the highest ISD at the 5th floor, while the SZBF has the lowest 5th floor ISD. The variation in the ISD shows very similar trends as the median response, where the 1st floor has the largest variation. In terms of FA, the acceleration usually increases with height. XBF has slightly higher FA at all floors, while the other configurations all have very similar FA. The variation in FA is very similar among all configurations.
3) At the 10/50 hazard level, the ISD for the I-VBF, VBF, and XBF configurations are quite similar among the floors. On the other hand, the SZBF has lowest ISD at the 1st floor with increased ISD at the 2nd and 3rd floors and reduced ISD at the 4th and 5th floor. M-XBF has a similar trend as the SZBF, except the 4th and 5th floors which have less reduction than the SZBF. The variation in ISD is similar among the floors. In terms of FA, all configurations show a similar trend, where acceleration increases linearly as the floor height increases. The variation of FA shows a similar trend for all systems.
4) At the 40/50 hazard level, I-VBF and XBF configurations have similar ISD at all floors. SZBF has the similar trend as the M-XBF at the 2nd and 3rd floors, with a reduction in ISD at the 4th and 5th floor. Among the different configurations, the VBF has the highest ISD for almost all floors, except the 2nd floor. The variation in ISD is very consistent among all floors. The trend for the FA is similar for all configurations, where the FA increases as the floor height increases. The variation of FA is very similar among all floors and bracing configurations.
5) XBF is the most expensive system as it has the highest life cycle cost. By contrast, the M-XBF is the most economical system having the lowest life cycle cost. After that, the SZBF, VBF, and I-VBF are ranked from the lowest life cycle cost to highest.
Data Availability
All datasets generated for this study are included in the manuscript and/or the supplementary files.
Author Contributions
HS contributed development of the proposed models, performed the analysis, and wrote the draft of the manuscript. LT wrote sections of the manuscript and revised the paper. TY supervised the research and revised the paper. All authors read and approved the submitted manuscript version.
Conflict of Interest Statement
The authors declare that the research was conducted in the absence of any commercial or financial relationships that could be construed as a potential conflict of interest.
Acknowledgments
We would like to acknowledge the funding provided by the National Natural Science Foundation of China (grant number: 51778486), International Joint Research Laboratory of Earthquake Engineering (ILEE), National Science Foundation China, State Key Laboratory of Disaster Reduction in Civil Engineering. Any opinions, findings, and conclusions or recommendations expressed in this paper are those of the authors.
Abbreviations
CBF, Concentrically Braced Frame; SFRS, Seismic Force Resisting System; MD-CBF, Moderate Ductile Concentrically Braced Frame; LD-CBF, Limited Ductile Concentrically Braced Frame; I-VBF, Inverted V-braced Frame; VBF, V-braced Frame; XBF, X-braced Frame; M-XBF, Multistory-X-braced Frame; SZBF, Suspended Zipper Braced Frame; ISD, Peak Inter Story Drift ratio; FA, peak Floor Acceleration; Std, Standard Deviations; PBEE, Performance-Based Earthquake Engineering; EDP, Engineering Demand Parameter; DS, Damage State; PG, Performance Group; Min_Qty, Minimum Quantities; Max_Qty, Maximum Quantities; MAL, Mean Annualized Loss.
References
Astaneh-Asl, A. (2005). Design of Shear Tab Connections for Gravity and Seismic Loads. Structural Steel Educational Council (SSEC).
Black, R. G., Wenger, W. A., and Popov, E. P. (1980). Inelastic Buckling of Steel Struts Under Cyclic Load Reversals. [Report No. UCB/EERC-80/40]. University of California, Berkeley, CA.
CSA (2014). Design of Steel Structures. Canadian Standard Association. Specification No. CSA S16-14.
De Souza, R. M. (2000). Force-Based Finite Element for Large Displacement Inelastic Analysis of Frames. Dissertation, University of California, Berkeley, CA.
Fahmy, B., Stojadinovic, B., Goel, S., and Sokol, T. (1998). “Load path and deformation mechanism of moment resisting steel column bases,” in Proceedings of the 6th US National Conference on Earthquake Engineering (Seattle, WA).
FEMA (2012). Seismic Performance Assessment of Buildings. Volume 2—Implementation Guide. Technical report FEMA-P58. Washington, DC.
Mahmoudi, M., and Zaree, M. (2010). Evaluating response modification factors of concentrically braced steel frames. J. Constr. Steel Res. 66, 1196–1204. doi: 10.1016/j.jcsr.2010.04.004
McKenna, F., Scott, M. H., and Fenves, G. L. (2009). Nonlinear finite-element analysis software architecture using object composition. J. Comput. Civil Eng. 24, 95–107. doi: 10.1061/(ASCE)CP.1943-5487.0000002
Moehle, J., and Deierlein, G. G. (2004). “A framework methodology for performance-based earthquake engineering,” in 13th World Conference On Earthquake Engineering (Vancouver, BC), 3812–3814.
Natural Resources Canada (NRC) (2016). Determine 2015 National Building Code of Canada Seismic Hazard Value. Available online at: http://www.earthquakescanada.nrcan.gc.ca/hazard-alea/interpolat/index_2015-en.php (Accessed February 10, 2016).
NBCC (2015). National Building Code of Canada, 2015. Ottawa, ON: National Research Council of Canada.
Ozcelik, Y., Saritas, A., and Clayton, P. M. (2016). Comparison of chevron and suspended-zipper braced steel frames. J. Constr. Steel Res. 119, 169–175. doi: 10.1016/j.jcsr.2015.12.019
Pacific Earthquake Engineering Research Center (PEER) (2011). Strong Motion Database. Berkeley, CA: University of California. Available online at: https://ngawest2.berkeley.edu
Patil, D. M., and Sangle, K. K. (2015). Seismic behaviour of different bracing systems in high rise 2-D steel buildings. Structures 3, 282–305. doi: 10.1016/j.istruc.2015.06.004
Uriz, P. (2008). Toward Earthquake-Resistant Design of Concentrically Braced Steel-Frame Structures. Berkeley, CA: Pacific Earthquake Engineering Research Center.
Yang, T. Y., Moehle, J., Stojadinovic, B., and Der Kiureghian, A. (2009a). Seismic performance evaluation of facilities: methodology and implementation. J. Struct. Eng. 135:10, 1146–1154. doi: 10.1061/(ASCE)0733-9445(2009)135:10(1146)
Yang, T. Y., and Murphy, M. (2015). Performance evaluation of seismic force–resisting systems for low-rise steel buildings in Canada. Earthq. Spectra 31, 1969–1990. doi: 10.1193/022314EQS032M
Keywords: seismic performance evaluation, concentrically braced frame, time history analysis, life cycle cost, finite element model
Citation: Yang TY, Sheikh H and Tobber L (2019) Influence of the Brace Configurations on the Seismic Performance of Steel Concentrically Braced Frames. Front. Built Environ. 5:27. doi: 10.3389/fbuil.2019.00027
Received: 13 December 2018; Accepted: 18 February 2019;
Published: 14 March 2019.
Edited by:
Izuru Takewaki, Kyoto University, JapanReviewed by:
Yutaka Nakamura, Shimane University, JapanConstantinos Repapis, University of West Attica, Greece
Peng Pan, Tsinghua University, China
Manolis S. Georgioudakis, National Technical University of Athens, Greece
Copyright © 2019 Yang, Sheikh and Tobber. This is an open-access article distributed under the terms of the Creative Commons Attribution License (CC BY). The use, distribution or reproduction in other forums is permitted, provided the original author(s) and the copyright owner(s) are credited and that the original publication in this journal is cited, in accordance with accepted academic practice. No use, distribution or reproduction is permitted which does not comply with these terms.
*Correspondence: T. Y. Yang, eWFuZ0BjaXZpbC51YmMuY2E=