 Maria M. Gibbs1
 Dae Kun Kwon
 Ahsan Kareem
- 1NatHaz Modeling Laboratory, University of Notre Dame, Notre Dame, IN, United States
- 2Center for Research Computing, University of Notre Dame, Notre Dame, IN, United States
Rural footbridges have proved to be an impetus for growth in vulnerable areas of the developing world, increasingly being built in many isolated communities around continents. Yet, little prior assessment of their dynamic characteristics had been made due to the non-traditional constraints that arise from instrumenting footbridges in rural, off-grid settings across multiple continents. Their characteristics remain largely unknown even if the low mass and flexible nature of rural footbridges make them vulnerable to wind-induced motions. To this end, this study proposes a data-enabled prediction framework based on a novel citizen sensing protocol, which aims at predicting the dynamic properties of rural footbridges during the conceptual design phase to enhance their safety under winds. The protocol is established which enables non-experts including local citizens in isolated communities to collect vibration data of rural footbridges by way of rapidly deployable and low-cost sensing systems in a novel application to full-scale monitoring with the concept of the community engagement. This citizen sensing data helps not only establish database with dynamic properties, but also develop empirical models to predict their dynamic properties of a footbridge in the conceptual design phase without detailed and bridge-specific dynamic modeling. In addition, a simple yet effective batch processing procedure to be done by non-experts is also devised to readily process upcoming citizen sensing data from new footbridges in the future, which offers instant and continuous updates of existing database with minimal efforts for enhancing the knowledge and the prediction of dynamic characteristics of rural footbridges.
Introduction
Rural infrastructure plays an important role in poverty alleviation, giving isolated communities access to essential healthcare, education, and economic opportunities. In particular, rural footbridges in those sites have proved to be an impetus for growth in vulnerable areas of the developing world, e.g., allowing children to safely cross flooded rivers to get to school, giving pregnant mothers a means to reach health clinics, and connecting farmers to markets. Those footbridges are generally constructed without following detailed design procedure, utilizing locally available materials in a low-efficient manner. Footbridge span guidelines that do exist are arbitrary, and are not based on a dynamic assessment of the structures. For this reason, their dynamic properties and behaviors remain largely unknown and the low mass and flexible nature of rural footbridges make them vulnerable to wind-induced motions. Understanding the dynamic response of these structures under wind loads is of vital importance to ensure public safety and the prevention of excessive structural damage.
Vibration-based testing and monitoring of bridge structures to acquire their dynamic properties, such as natural frequencies, damping values, and mode shapes are one of the most common practice since the early 1980s (e.g., Farrar and Worden, 2007; Fei et al., 2009; Benedettini and Gentile, 2011; Wang et al., 2013, 2014, 2016; Gara et al., 2016; Ivorra et al., 2017). More recently, researchers have started using pedestrian footbridges as test beds due to their flexibility and ease of testing compared to typical large-scale highway bridges. For example, full-scale structural testing and monitoring were performed on the Millennium Bridge in London, England in order to detect vertical and lateral modes for remediation of vibration issues (Pavic et al., 2002). Similarly, vibration testing using an electrodynamic shaker was performed on a footbridge in Montenegro and the first seven vertical and lateral models were identified (Živanović et al., 2006). In addition, dynamic assessments have been performed on several suspension footbridges (e.g., Brownjohn et al., 1994; Au et al., 2005; Meng et al., 2007; Gentile and Gallino, 2008) and success has been shown using free decay time histories to extract modal parameters. These examples demonstrate how dynamic testing and monitoring can be used to estimate natural frequencies, damping ratios, and mode shapes for characterizing footbridges.
Traditionally, full-scale monitoring of bridges have relied on wired sensors, however, advancements in wireless sensor networks have shown promise for applications to bridge structural health monitoring (e.g., Hoult et al., 2009; Zhou and Yi, 2013; Li et al., 2016). Typically, these systems utilize distributed systems of micro-electro-mechanical systems (MEMS)-based sensor nodes which communicate via gateways using radio transmission. Similar MEMS technology has also been adopted in modern smartphones and trial applications in measuring the displacements of structural members have been explored in laboratory settings (e.g., Morgenthal and Hopfner, 2012). Initial validation has also been achieved for mobile structural health monitoring using smartphones within the specific application of measuring the force in individual cables using built-in iPhone accelerometers and external board sensors (Yu et al., 2015).
The dynamic properties of rural footbridges, such as natural frequency, damping, and mode shape offer invaluable information to improve their safety against wind-induced motions, such as flutter phenomenon which is a destructive action of wind on bridges. However, they remain mostly unknown, thus it is usually lack of a viable mechanism in nature for footbridge designers to estimate and consider the properties during the conceptual design phase and likewise, one does not have a means to assess the properties once a footbridge is built (Gibbs, 2017). This is due to a number of constraints, including the following: (a) Designer's knowledge: most rural footbridge designers are not well-versed in structural dynamics; (b) Accuracy and access for finite element modeling: informal construction practices result in large discrepancies between as-built dynamic properties and those predicted using finite element models (e.g., Živanović et al., 2006, 2007). This aspect generally holds true for any civil structures where full-scale monitoring or structural health monitoring methodology needs to be invoked for reliably evaluating dynamic properties of full-scale structures (e.g., Kijewski-Correa et al., 2006; Fei et al., 2009; Benedettini and Gentile, 2011; Wang et al., 2013, 2014, 2016; Foti et al., 2015; Gara et al., 2016; Ivorra et al., 2017). For rural footbridges, detailed finite element modeling and analysis are even rarely carried out in design practice; (c) Deployable sensors and data management/analysis: structural monitoring equipment of industry standard is expensive and cumbersome, thus requires an expert to deploy it and perform data analysis after measurements. Given the fact that reliable numerical and analytical solutions of such rural footbridges are rare, a data-driven approach through a large amount of structural monitoring efforts may only be a viable option to improve the knowledge of their dynamic characteristics. Existing solutions are not suitable for deployment to dozens (and eventually hundreds) of rural footbridge sites due to a geographical difficulty, which the sites are distributed across several continents. Data management and analysis will also be eventually problematic due to the lack of experts and the increasing number of footbridges to be monitored in the future.
To overcome these limitations, this study aims at predicting the dynamic properties of rural footbridges during the conceptual design phase to enhance their safety under winds. To this end, a data-enabled prediction framework of dynamic property of footbridges is proposed, offering a multifaceted solution which accommodates those constraints by combining a novel citizen sensing approach. This approach leverages low-cost portable sensors operated by citizens who are non-experts in the field of structural dynamics, invoking community engagements to alleviate geographical difficulties of rural footbridge to access and monitor. The novel sensing protocol enables rapid and extensive collection of data from existing footbridges, which the data help to not only establish database with dynamic properties of footbridges, but also develop the empirical models to predict their dynamic properties in the conceptual design phase without detailed and bridge-specific dynamic modeling. A simple yet effective batch processing procedure to be performed by non-experts is also designed to easily proceed citizen sensing data from new footbridges in the future. This procedure offers instantaneous and continuous updates of existing database with minimal efforts for enhancing the knowledge and the prediction of dynamic characteristics of rural footbridges in a preliminary design stage.
Rural Footbridges
In this study, a number of rural footbridges constructed by the international non-profit Bridges to Prosperity (B2P) organization were utilized to evaluate the efficacy of the proposed citizen sensing protocol. The B2P envisions a world where poverty caused by rural isolation no longer exists and has built more than 250 cable-supported footbridges in 18 countries (https://bridgestoprosperity.org). Standardized B2P footbridges are designed to utilize locally available materials and construction practices to facilitate a participatory community development model where local communities and municipalities contribute significantly to the execution of projects. The B2P footbridges are generally comprised of two towers and a couple of main suspension cables which support the deck via rebar suspenders. The decks are composed of steel crossbeams and longitudinal timber boards. In addition, safety fencing using wire mesh spans between the deck and a pull cable. Figure 1 shows an example of a B2P standard footbridge, Melara Footbridge in El Salvador.
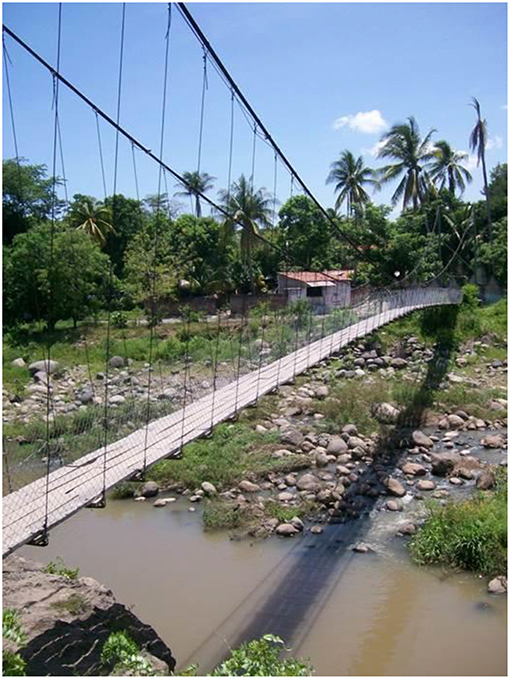
Figure 1. An example of rural footbridge: Melara Footbridge, El Salvador (taken by the first author).
Yet, little has been known about the dynamic behavior of these footbridges in wind. Concerns about wind effects prevent the B2P from constructing longer span footbridges. The urgency of developing cost-effective footbridge solutions which are safe under wind loading is underscored by the work of the B2P in the walking world, where a footbridge failure can lead to the extreme isolation of a community, cutting off access to schools, markets, and healthcare facilities.
Novel Citizen Sensing Approach
The citizen sensing approach proposed in this study is comprised of two key elements: (a) Citizen sensor: leveraging existing low-cost, rapidly deployable sensing and data logging technology in the novel application of full-scale footbridge monitoring system; (b) Citizen sensing protocol: enabling the collection of footbridge data from disperse and rural sites. These two elements facilitate the development of a database of footbridge dynamic properties. It is important to note that the novel citizen sensing approach is developed to accommodate the collection and input of data from additional footbridges as they come in line. For example, the B2P and their global partner network are building suspension footbridges at an increasing rate, thus the proposed sensing approach will prompt to enable the inclusion of data from these bridges, and, most critically, the insights that will result from an ever-increasing body of data.
Citizen Sensor: Low-Cost and Rapidly Deployable Sensing Systems for Footbridge Applications
To determine the citizen sensor in the context of the proposed approach, a variety of candidate sensing systems were evaluated across technical and non-technical constraints. Technical constraints focused on the ability of the sensing systems to collect and record acceleration data for the purpose of estimating natural frequencies and damping ratios of footbridge, such as measurement ranges, sampling frequency, noise level, etc. Non-technical constraints centered on deployability to remote locations and operability by non-experts including local citizens, such as cost, size/weight, user-friendly interface, triggering, internal storage, battery capacity, laptop/USB compatibility, etc. It should be noted that no sensing systems developed specifically for footbridge monitoring met the deployability and operability constraints, therefore sensing solutions typically used for other applications were explored. In consequence, two monitoring systems comprised of accelerometers and datalogger were adopted as citizen sensors. The systems selected for incorporation into the citizen sensing approach are the Vibration Sentry Vibration Meter Data Logger (Vibration Sentry, hereafter) manufactured by Convergence Instruments and the Nexus 4 Android smartphone co-developed by Google and LG Electronics. Note that however, neither systems were specifically designed for footbridge monitoring as an intended use case, thus the application of both systems in the context of system level footbridge vibration monitoring is challenging.
The Vibration Sentry is a smart data logger that can record accelerations and tilts which was developed to monitor shipments in transit and record adverse events, such as shocks, high vibration levels, and/or tilt. The unit includes a 3-axis ±16 g (gravitational acceleration) MEMS accelerometer, a built-in time/date clock, and a non-volatile 128 Mb recording memory. Its small size (7.62 × 3.94 × 2.06 cm), lightweight (65 g), and weatherproof casing make it ideal for theft-proof data collection on frequently trafficked footbridges. Additionally, this data logger/sensor unit is low-cost and has a simple user interface that allows it to be easily deployed by non-experts to monitor footbridges. Multiple Vibration Sentries can be deployed on the same footbridge with approximate time synchronization using the data loggers' built-in clock and a triggering mechanism which is activated either by the exceedance of an acceleration threshold or the commencement of a set time.
The Nexus 4 smartphone is used in conjunction with the embedded ASPIRE Android app, developed by the Modeling and Simulation of Structures Laboratory (MSSL) at Bauhaus-Universität Weimar, Germany, to record the vibration with the Nexus 4's built-in accelerometers (Morgenthal and Hopfner, 2012). The ASPIRE intended to facilitate monitoring of structures with a variety of options to collect data. Photos, videos, audio commentary, GPS location, and more information can be easily recorded, stored, and transmitted to other devices. The ability to record vibration using the smartphone's built-in tri-axial accelerometer is of great interest in this study. The sampling rate is variable, with an average of 180 Hz. The built-in accelerometer resolves the accelerations with a 16 bit A/D converter and measures vibrations within the range of ±4 g. Note that the ASPIRE app used in this study was modified by the MSSL as per authors' requests based on specifications developed specifically for the application of footbridge dynamic monitoring to include a triggering mechanism which starts recording at the next clock minute. This allows approximate time synchronization between phones if all phone clocks are synced at the start of the test and the app is activated within the same clock minute.
Citizen Sensing Protocol
A citizen sensing protocol for dynamic testing and monitoring was developed with the objective of repeatability across multiple bridges with non-experts. In order to achieve this, the test protocol must be executable in half a day or less and rely on simple instructions which do not require advanced knowledge of structural dynamics. Note that data obtained through the citizen sensing protocol are utilized to estimate the fundamental frequencies and damping values of the vertical and torsional modes of rural footbridges. Notably, mode shapes are used only to categorize vertical symmetric (VS), vertical anti-symmetric (VA), torsional symmetric (TS), and torsional anti-symmetric (TA) modes of footbridges.
The protocol takes advantage of a unique feature of B2P suspension footbridges which allows an individual person to produce a clean free decay response from pulling on a rope attached to the footbridge. A single vertical plucking test excites multiple modes, including the fundamental four modes, such as VS, VA, TS, and TA modes. The simple nature and short duration of the test are significant because they reduce barriers for citizens to perform tests. Additionally, having a clean plucking as a starting point reduces the complexity of system identification (SI) schemes that must be applied to the data in order to populate the database. A schematic diagram of the test layout is shown in Figure 2. In the figure, circle symbols with numbers represent the locations of Vibration Sentry, square symbol represents rope attachment location for plucking test, and X marks indicate structural nodes where citizen sensor or rope should not be placed.
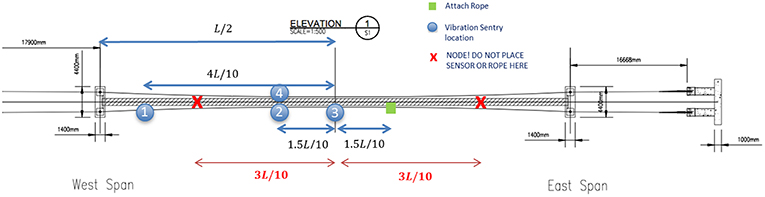
Figure 2. A schematic diagram of sensor locations.
The citizen sensing protocol starts with a non-expert citizen being briefed on the objectives of the footbridge monitoring program and an overview of the protocol. Prior to visiting the target footbridge site to perform the testing, the citizen downloads the ASPIRE smartphone app on the smartphone(s) (Nexus 4) and/or the Vibration Sentry Manager software on the laptop and charges the smartphone(s) and/or the Vibration Sentries. The citizen then assembles a testing kit to take to the site. The kit was developed specifically to fit in a backpack, allowing it to be deployed to even the most remote footbridge sites which can only be accessed on foot or via motorcycle. It consists of the smartphone(s) and/or the Vibration Sentries, USB cables, laptop, 10 m rope for plucking test, notebook and pen, wood screws, screwdriver, and a timing device.
When the citizen arrives onsite, they sketch the bridge according to a standard template and activate sensors. Activation entails connecting each Vibration Sentry to the laptop computer, syncing the clock to the computer's clock, and setting a start time. Syncing the clocks and setting the same start time for each Vibration Sentry allows approximate time synchronization, which is important for the SI scheme and input into the database, which will be discussed later in detail. The clocks of smartphones are also synced at the start of the test and the app is activated within the same clock minute in terms of embedded triggering mechanism in the ASPIRE app.
Next, the citizen installs the sensors at sensor locations which are predetermined based on span, as shown in Figure 2. The driving objective of the sensor layout is to distinguish among the fundamental four modes (VS, VA, TS, and TA modes). Therefore, citizen sensors are usually located on half the target footbridge to increase spatial resolution with a limited number of sensors. Likewise, the majority of sensors are placed on a single edge of the deck to increase the spatial resolution. A single sensor is placed on the opposite edge of the deck to allow for categorization of vertical vs. torsional modes. Predetermined sensor locations also take into account the modes of interest. The locations of Sensor 2 and 4 in Figure 2 ensure that they are not located at a location such that the vertical/torsional classification can be made regardless of modes. Note that Vibration Sentries are attached to the footbridge with wood screws using a manual screwdriver and smartphones are attached via a hard shell case glued to a steel bar that is screwed into the deck using wood screws and a manual screwdriver, as shown in Figure 3.
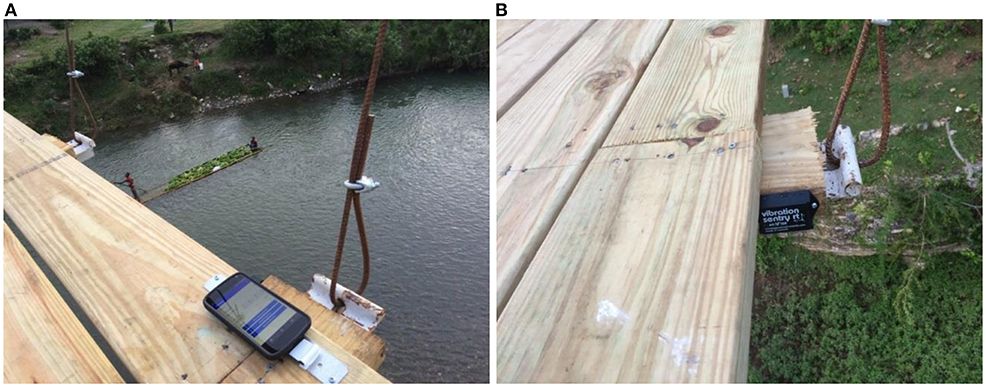
Figure 3. Examples of sensor installation to footbridge: (A) Nexus 4 smartphone; (B) Vibration Sentry.
After the sensors are installed, the citizen attaches the rope to a bridge crossbeam at the predetermined location (square symbol in Figure 2) using a simple knot for the plucking test. The rope location for plucking footbridge intentionally avoids locations where the fundamental symmetric/anti-symmetric vertical and torsional modes are generally observed. The citizen then stands directly below the footbridge at the location of the rope. Traffic is barred from crossing the footbridge for a test duration of 5 min and the citizen pulls slowly down on the rope then quickly releases it, triggering a free decay response from the footbridge. This process is repeated a minimum of three times to ensure the correctness of the tests. After all the tests have been completed, the sensors are removed from the bridge deck and the Vibration Sentries are connected to the laptop via a USB cable. The Vibration Sentry manger software prompts the citizen to download the data then clear the sensor memory. Upon their return to a location with internet access, the citizen submits the measured data by the smartphones and/or Vibration Sentries to a designated database website, which concludes the citizen sensing protocol.
Validation of Citizen Sensors
Nexus 4 Smartphone Sensor
For the validation, three rural footbridges, such as SJP, Dorado, and Jucuapo footbridges were equipped with two sensing systems. A reference sensing system from Bridge Diagnostic Inc. (BDI) was used as a baseline to assess the accuracy of the Nexus 4 Smartphones. The BDI with five pairs of biaxial ±5 g accelerometers for a total of 20 measured channels (10 vertical and 10 horizontal channels) were utilized in this comparison. The BDI accelerometers were connected to the timber bridge deck via wood screws at the outermost edge of the decking, which their placements are shown as circles in Figure 4. A sampling rate of 200 Hz was used. The systems recorded the structural response simultaneously to allow for an objective comparison of sensing capability and excluding the possibility of errors caused by variations among trials.
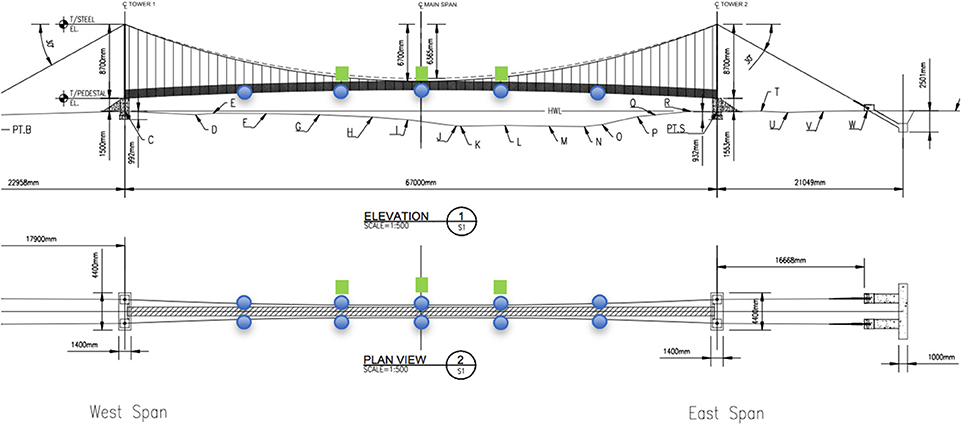
Figure 4. Example of sensor placements of the BDI and Nexus 4 smartphones.
The Nexus 4 smartphones were attached to the bridge deck adjacent to the BDI accelerometers in three locations shown as squares in Figure 4. As mentioned earlier, the smartphones' triaxial accelerometers recorded acceleration data via the ASPIRE app. For the purpose of validating the smartphones, only reference sensors corresponding to the three locations of the smartphones were included in the spatial averaging. A comparison of spatially averaged frequencies and damping ratios is presented in Table 1. Note that continuous wavelet transformation (CWT) was utilized for the SI scheme to estimate natural frequencies and damping ratios from measured data (e.g., Kijewski and Kareem, 2003).
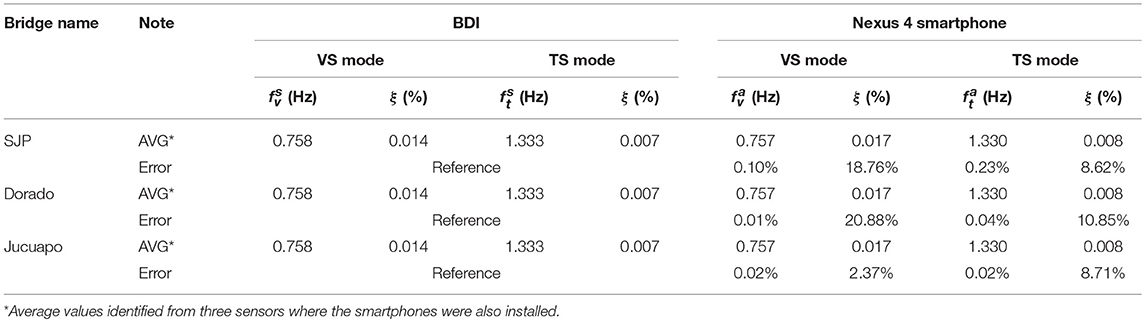
Table 1. Comparison of estimated dynamic properties from BDI and Nexus 4 smartphones.
It was observed that the Nexus 4 smartphones performed well for the identification of natural frequencies of footbridges, with percent differences from the reference sensing system ranging from 0.01 to 0.23% even though the smartphone data are much noisier than the BDI data. However, accuracy of the smartphones on identifying damping values was lower than that on natural frequencies, with discrepancies in averages ranging from 2.37 to 20.88% for all VS and TS modes. These results indicate that updating the frequencies in the footbridge dynamic database with footbridges using smartphones as a primary data collection system is fairly reliable. Similarly, smartphones may be used to reasonably determine an approximate damping ratio. It is worth noting that mode shapes obtained through the BDI and the smartphones showed good agreements each other for all the three footbridges, but the results are omitted here for the brevity sake.
Vibration Sentry Sensor
Similar to the above procedure, a side-by-side comparison was performed between the reference sensing system using the MicroStrain G-link system and the Vibration Sentries. The Microstrain G-link accelerometer nodes by the LORD Microstrain® systems have tri-axial ±2 g MEMS accelerometers with a drift rate of ±3 parts per million, the drift of 0.432 s over 4 h, the sampling rate of 200 Hz, and the noise floor of ±0.007 g. For this test, sensors were connected to the Rancheria footbridge in Nicaragua as shown in Figure 5. Due to the limited number of sensors available, the sensor layout was limited to half of the span and geometric symmetry was leveraged to ascertain mode shapes.
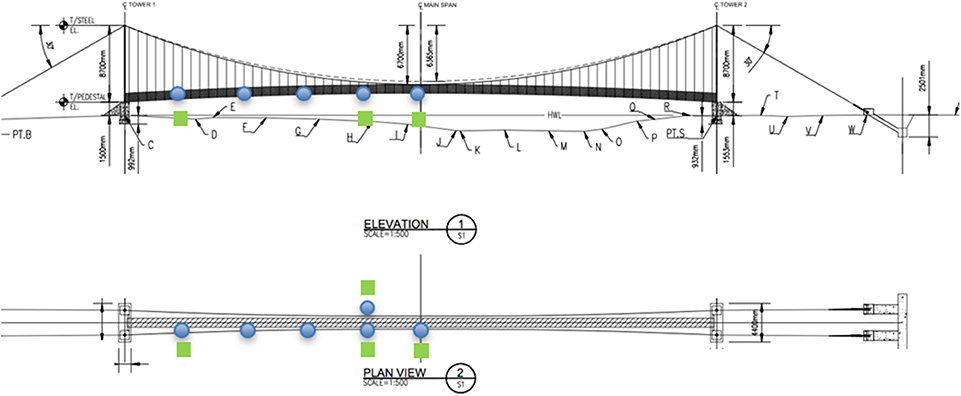
Figure 5. Sensor placements of the Microstrain system (circles) and Vibration Sentries (squares) at Rancheria footbridge in Nicaragua.
A comparison of the natural frequencies and damping values for the VS, VA, and TS modes from the reference Microstrain sensors and the citizen sensor, Vibration Sentry, are listed in Table 2. Similar to the tendency observed in the case of the smartphones earlier, the Vibration Sentries performed well for the identification of fundamental frequencies, with a percent error from the reference sensor below 3% throughout all three modes identified. However, the Vibration Sentry performed worse than the smartphones at damping ratio identification, with percent errors ranging from 8 to 40%. This result is expected, given that the Vibration Sentry is designed to monitor shipments in transit and record adverse events, such as shocks and high vibration levels. This implies limited low frequency support and a large frequency, leading to poor sensitivity, which affected the signal envelope and thus the damping estimation.
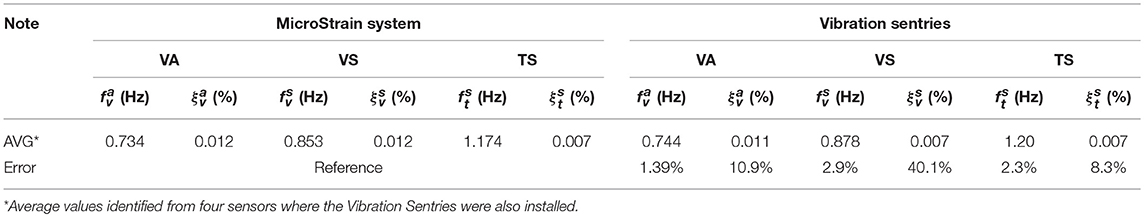
Table 2. Comparison of estimated dynamic properties from MicroStrain system and Vibration Sentries for Rancheria footbridge.
Development of Database Framework for Rural Footbridges
In view of various footbridges in their structural and dynamic properties, a robust database framework for rural footbridges with unknown dynamic characteristics is required to establish a basis set of dynamic properties and trends. This basis set lays a groundwork to achieve the objective of predicting the dynamic properties of a footbridge in the conceptual design stage. This is achieved based on an evolving database of as-built dynamic properties populated by citizen sensing protocol and a batch processing procedure which the latter will be discussed later. The initial database framework adopts SI scheme based on CWT with Morlet wavelet (e.g., Kijewski and Kareem, 2003) with a number of framework controls to accommodate some unique features of the citizen input data from various footbridges for which trends in dynamic properties have not previously been established. An overview of the database framework is shown in Figure 6.
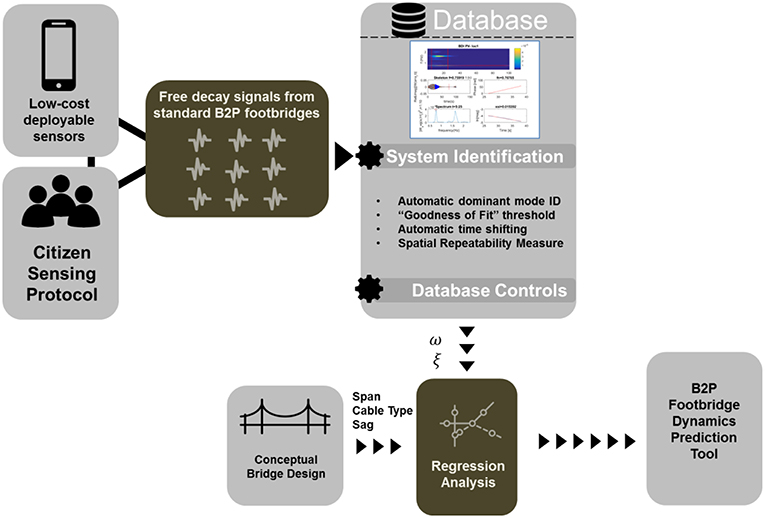
Figure 6. Overall procedure to establish database with baseline properties for footbridges with unknown dynamics (ω = natural frequency; ξ = damping ratio).
Database Framework Controls for Footbridges With Unknown Dynamic Properties
With a preliminary set of these dynamic properties estimated from citizen sensing data, a global footbridge dynamics database is populated to establish general trends for rural footbridges, such as empirical prediction models which will be discussed in the next section. The databasing procedure considers the following constraints to accommodate: (a) Data from multiple footbridges; (b) Data inputs of variable quality; (c) Variable time synchronization between sensors; (d) Variable fidelity of output dynamic properties. These constraints are overcome through the following Framework Controls procedure (Figure 6): (a) Automatic dominant mode identification; (b) “Goodness of fit” threshold; (c) Automatic time shifting; (d) Spatial Repeatability Measure.
Databasing procedure starts from an automatic identification of natural frequencies with the highest energy content at each sensor location. This is done using the wavelet spectrum via CWT over the 20 s based on the plucking test data. The spectrum is divided into segments and the frequency corresponding to the peak magnitude, if a peak exists, is taken as the dominant mode of that segment. For each segment, the wavelet skeleton corresponding to the scale of the dominant frequency is extracted and used to identify the frequency and damping ratio, as shown in Figure 7. A portion of the skeleton with peaks that are monotonically decreasing for twenty oscillations, beginning at the edge of the end effects region, is used for SI. The coefficient of determination (R2) is calculated for the linear regressions used to compute both the natural frequency and damping ratio. This goodness of fit measure is used as a framework control in a subsequent step. The unique clean free decay signal resulting from the excitation methodology (plucking test) that is possible for the footbridges in this database along with the strategic selection of the portion of the decay signal used for SI results in an unusually high goodness of fit for the fitting of the phase.
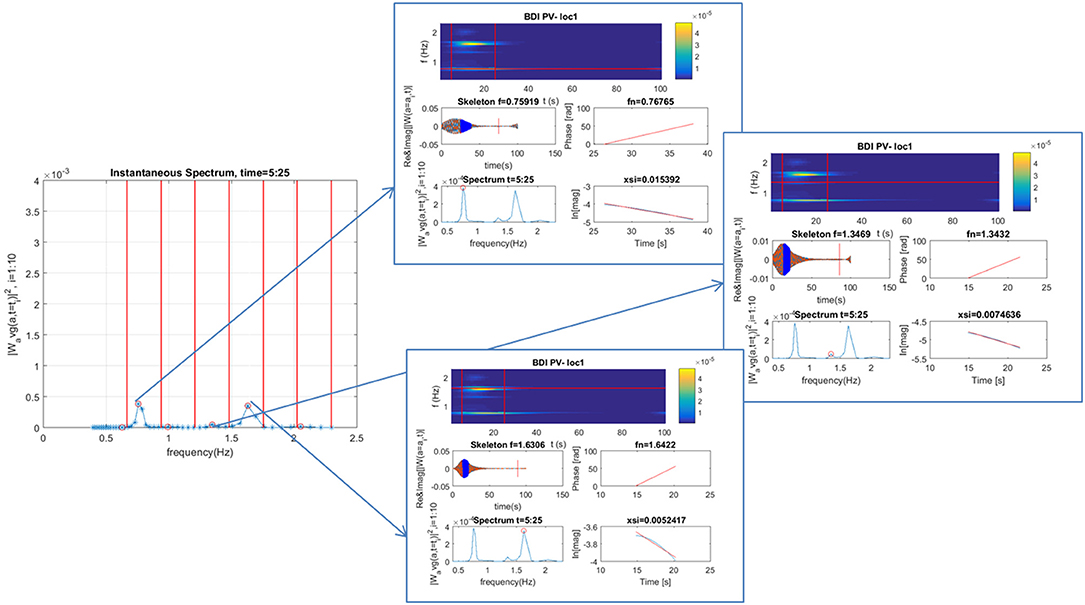
Figure 7. Sorting into modal groupings and subsequent SI for multiple modes at a single sensor location.
After this process is repeated for each sensor location, the next step is to sort the dominant frequencies into modal groupings. For this purpose, it first needs to determine which sensors among multiple sensor locations have picked up the same dominant mode in a given frequency region because each sensor exhibits their own dominant mode depending on its location in a footbridge. The skeleton amplitude of the sensor locations which have picked up the same dominant mode is then used to determine the corresponding mode shape. A Spatial Repeatability Measure (SRM), defined as the coefficient of variation (COV) of the dominant frequencies in a given frequency region, is used to control the sensor locations that are selected for analysis. If the coefficient of determination for the linear fit used to identify the frequency is below the pre-defined threshold, the location is rejected from consideration. The COV is computed using all of the dominant frequencies in a given region. If it exceeds the established threshold, the sensor location with the frequency furthest from the mode is rejected. The COV is then recalculated, and this process is repeated until the COV falls below the threshold.
Next, the mode shape is plotted by pulling the magnitude of the wavelet skeleton at a given time from each included sensor location, similar to conventional peak-picking method using the frequency response function. The time is determined by the first peak falling after the end effects region for the first sensor location. When the signals are well-synchronized in time, the time corresponding to a peak for the first sensor corresponds to peaks for all of the other sensors. However, for the case of the citizen sensing data, time synchronization is not exact, often deviating by several seconds. Therefore, a two stage approach is applied to correct for the time synchronization challenge in this study. First, the signals from each sensor location are automatically shifted based on their cross-correlation with time lags. This automatic time synchronization method is adequate in aligning the signals enough for their relative magnitudes to be indicative of their mode shapes. However, because the signals may still not be exactly time synchronized, the time corresponding to a peak value at the first sensor location, may not correspond to a peak at the other sensor locations, and could in fact be closer to a zero-crossing. Therefore, a simple “nearest extrema” approach is adopted in the next such that a target time is established by the first sensor location and the value corresponding to the nearest peak or trough to this time is selected from subsequent signals.
Another challenge with the citizen sensing data relates to a drawback of the aforementioned automatic time synchronization methodology which occasionally results in a signal being shifted in such a way that it is half a phase off from the benchmark sensor. For example, suppose two sensor locations are out of phase with each other, but when the cross correlation is computed, the extreme value occurs at a positive cross correlation as opposed to a negative one. This results in an incorrect mode shape plot where the magnitudes are correct, but the signs are opposite. In this case, the mode shape is flagged by engineering judgment, the cross-correlation is re-evaluated, and the signal is re-shifted according to the maximum value with the opposite sign of the original. The mode shape procedure is repeated and the phase discrepancy of the mode shape is eliminated.
Once the mode shapes have been established for the dominant modes in each frequency region, the mode shape plots are evaluated to determine which dominant frequencies correspond to the mode shapes of interest, such as vertical symmetric (VS), vertical anti-symmetric (VA), torsional symmetric (TS), and torsional anti-symmetric (TA) modes, which the order of the modes was found to be consistent among monitored footbridges. As an example, the four modes of interests for the Rio Abajo footbridge are shown in Figure 8. In the figure, circles denote sensors on downstream edge of deck, squares denote sensor located on upstream edge. In addition, solid lines connect measured modal amplitudes, dashed lines are reflections with respect to the midspan, and dashed-dot lines show reflections about the zero modal amplitude to reflect the torsional mode shapes. The anti-symmetric modes, such as VA and TA modes are characterized by a single zero-crossing at the midspan, which the torsional mode can be distinguished from the vertical mode by the sensor pairs located on opposite edges of the deck taking on opposite signs. The VS and TS modes are characterized by two zero-crossings located at distance of ~3 L/10 from midspan.
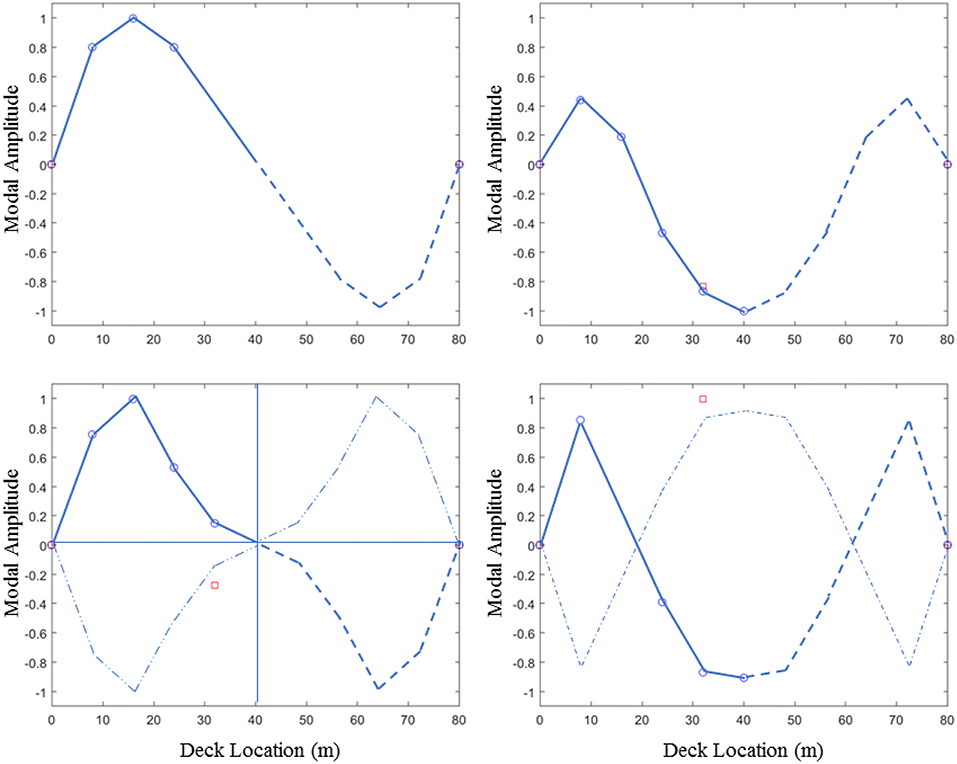
Figure 8. Mode shapes for the Rio Abajo footbridge showing half the span and their reflections around the midspan: VA (top left), VS (top right), TA (bottom left), and TS (bottom right) modes.
The frequencies entered into the database are spatial averages across the sensor locations that meet the SRM criteria and were thus included in the mode shape plots. An additional constraint is imposed on the damping ratios entered into the database. Damping ratios with a coefficient of determination lower than the cutoff threshold are rejected from the database to ensure the fidelity of the database. The pre-defined thresholds are listed in Table 3. It is worth noting that the database framework was applied to a total of 16 suspension footbridges in Nicaragua, El Salvador, Rwanda, Haiti, Panama and Bolivia, which form the basis set for the standard B2P footbridge dynamics database, which the list of footbridges are shown in Table 4. Results from footbridges instrumented with only citizen sensor data as well as reference sensors (BDI and MicroStrain systems) were used to populate the initial footbridge dynamics database.
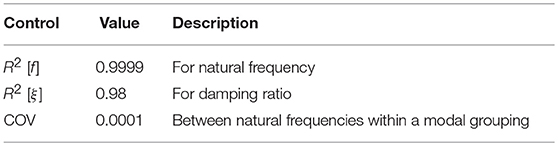
Table 3. Database control cutoff thresholds.
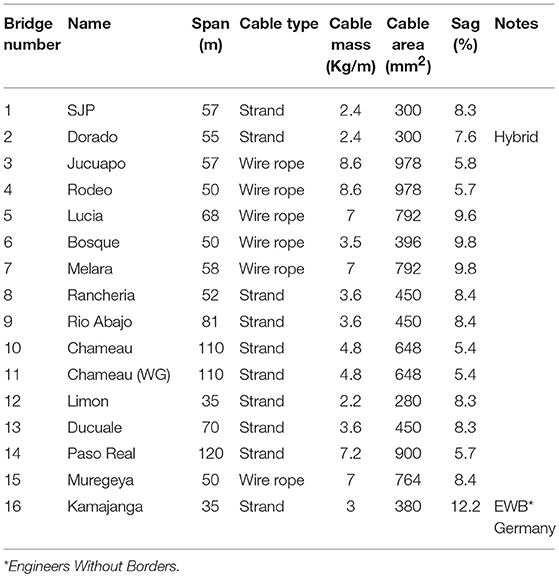
Table 4. Design parameters of B2P footbridges.
Empirical Models for Predicting Natural Frequencies and Damping Ratios of Rural Footbridges
The initial database established from the monitoring of sixteen B2P footbridges facilitates an exploration of the influence of suspension footbridge design parameters on dynamic properties. Several studies have been conducted which investigate the influence of suspension footbridge design parameters on frequencies along with guidelines to mitigate dynamic effects in footbridges. West et al. (1984) explored the influence of sag ratio on suspension footbridge frequencies for symmetric and anti-symmetric modes using a simplified lumped mass model. Sétra (2006) offered guidelines for critical damping ratios of footbridges based on material type and frequency range risk classification as it relates to human induced footbridge vibrations. AISC Design Guide 11 (Ungar, 2015) reported design guidelines for walking excitation in steel-framed structural systems. The AASHTO (2008) provided guidelines for proportioning the relationship between the fundamental vertical frequency and the weight of the structure to avoid the pedestrian lock-in phenomena.
In order to predict natural frequencies and damping ratios of a B2P suspension footbridge during the conceptual design phase, a relationship between design variables and dynamic properties must be established for regression analysis. Based on Irvine (1992), design variables, such as cable length, horizontal cable tension, and mass directly influence both the fundamental symmetric and anti-symmetric frequencies of a suspended cable. Horizontal cable tension is not a candidate input parameter because it is not calculated during a standard B2P footbridge design, while the design sag is a candidate input variable. The sixteen footbridges in this study along with key design inputs are listed in Table 4.
Trends in Natural Frequencies of Footbridges
Trends in vertical and torsional footbridge frequencies are explored over a range of design input parameters, including span, cable type, and sag ratio. These parameters were selected from the list of design variables which are known to a B2P design engineer and also are known to have a theoretical relationship with suspension bridge frequencies (e.g., Irvine, 1992). The four frequencies of interest are the fundamental VS (), TS (), VA(), and TA () frequencies. It is worth noting that few data points are available for the TA mode due to the fact that this mode is difficult to excite. Most footbridges were not sufficiently excited in the TA mode to produce frequency estimates with the requisite amount of confidence to be included in the database.
The visualizations of the data are shown in Figures 9, 10 for the symmetric and anti-symmetric modes, respectively, highlighting the influence of cable type and sag ratio on frequencies over a range of spans. Numbers in the figure specify the footbridge which corresponds to the plotted frequency following the footbridge number in Table 4.
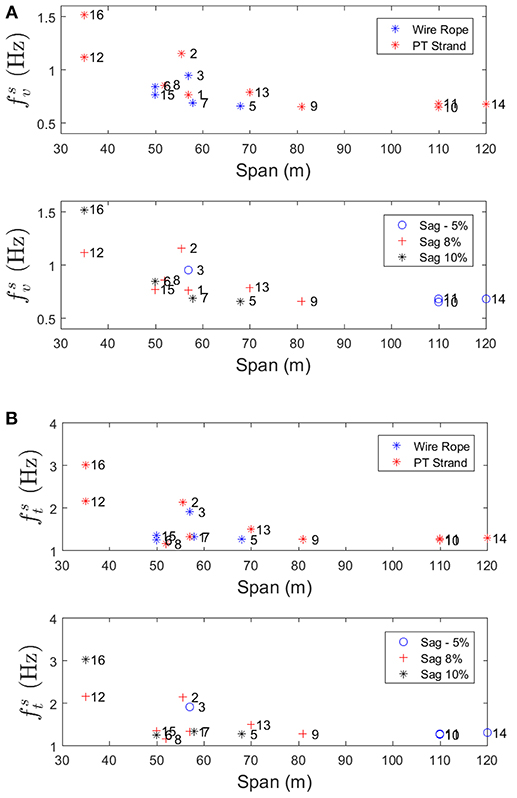
Figure 9. Vertical (A) and torsional (B) symmetric frequencies of footbridges.
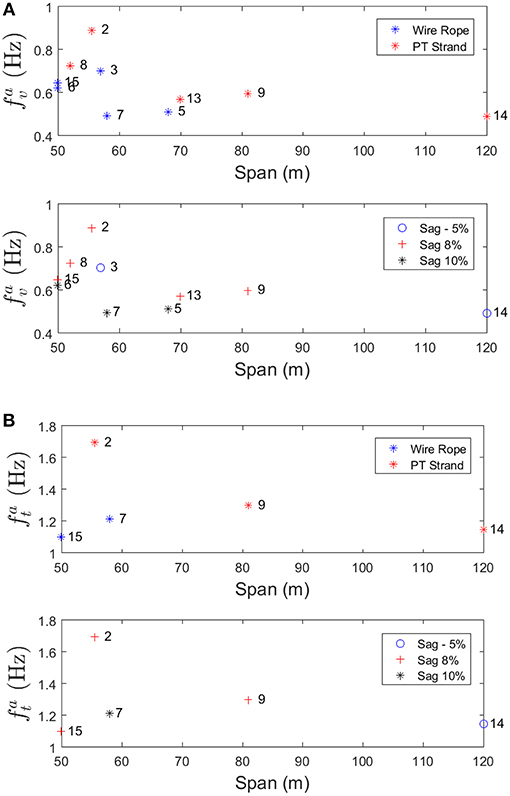
Figure 10. Vertical (A) and torsional (B) anti-symmetric frequencies of footbridges.
Figure 9 clearly highlights the trend that footbridges made with post-tensioning (PT) strand have higher vertical and torsional symmetric frequencies than those made with wire rope for similar strand lengths. This is consistent with expected results given that the post-tensioning strand has a higher modulus of elasticity than wire rope. It is also evident from Figure 9 that increases in sag ratios correspond with lower frequencies for a given span. A notable exception to this trend is the number 16, the Kamajanga footbridge, which has both vertical and torsional frequencies which are outliers. It is the only one in the database which was not built by the B2P; it was constructed through a partnership with Engineers Without Borders Germany (http://ewb-international.com/). The geometry of the footbridge is very similar to B2P footbridges, however, it includes a unique spanner cable feature that follows a catenary in the plan of the deck. The higher frequencies are therefore expected as a result of this additional stiffening member.
Footbridge number 2, the El Dorado footbridge, is also a notable outlier for both the vertical and torsional modes. It is classified as a hybrid of suspended and suspension footbridges, which has one steel suspension tower and one masonry suspended tower in order to accommodate terrain with a significant height difference between banks on either side of the river. As a result of this, the tower to tower span does not reflect the deck span because the masonry suspended tower is offset from the landing spot of the deck on the same side by ~13 m. This configuration results in asymmetric loading of the main cables. Given the unique features of the Kamajanga and El Dorado footbridges, they are excluded from the following regression analysis.
Empirical Modeling of Natural Frequencies of Footbridges
To accomplish the objective that predicts frequencies and damping ratios of rural suspension footbridges in the conceptual design stage, a relationship between design inputs and bridge dynamic characteristics needs to be uncovered. It is found that simplified analytical formulas, which have been developed in the Chinese Wind Resistance Design Guidelines for Highway Bridges (Xiang et al., 1998), are a good analog for rural suspension footbridges of interest because they were developed based on long-span vehicular suspension bridges which share a similar cable geometry and a span to depth ratio which result in similarly flexible, wind vulnerable structures. The formulas for estimating the fundamental VS (), TS (), VA(), and TA () frequencies based on several parameters were expressed as:
where Ec, Ac, mc, Bc, a, and Hgare the Young's Modulus, area, mass per unit length of a single main cable, distance between two cables, sag of the main cables and force in a single cable due to dead loads, respectively (Xiang et al., 1998). GJd, md, r are respectively the free torsional stiffness, mass per unit span, and inertia radius of the stiffened girder, and g is the gravitational acceleration. These formulas reflect basic principles of cable dynamics with additional customization to long-span vehicular suspension bridges. The VS and VA frequencies estimated by Equations (1, 3) are compared to measured values from footbridges (Figure 11).
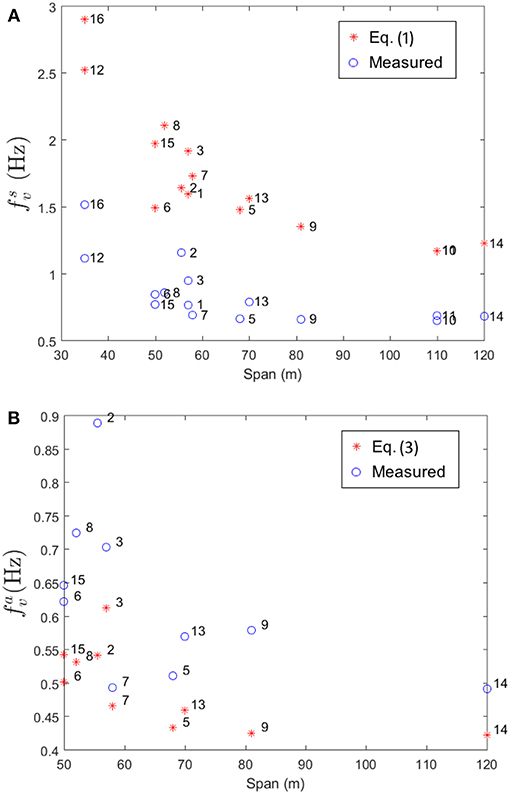
Figure 11. Measured VS (A) and VA (B) frequencies alongside the values predicted from Equations (1, 3).
It is clear from Figure 11 that overall, the B2P footbridges follow the same general trend, however, measured values are offset from the predicted values. This discrepancy is not surprising given the substantial differences between B2P suspension footbridge and a typical long-span vehicular suspension bridge which are not accounted for in Equations (1, 3). For example, decks in the footbridges are comprised of steel crossbeams connected by timber planks. The vehicular suspension bridges which informed the equation for the VS frequency are predominantly concrete box girder bridges, which have significantly higher bending stiffness, resulting in higher frequencies relative to a deck with a lower bending stiffness.
On the other hand, predicted VA frequencies by Equation (3) are lower than the values measured for B2P footbridges. This discrepancy can be explained by the vast difference in masses between vehicular suspension bridges and typical rural footbridges. While the cable and deck masses do appear in the equation for the VS frequency (Equation 1), they do not appear in the equation for the VA frequency (Equation 3). Therefore, because the set of bridges used to determine the coefficient of 1.11 in Equation (3) had much larger masses, which drive frequency values lower, it is evident that Equation (3) would underestimate the VA frequencies for footbridges which have much smaller masses and thus higher frequencies. These trends elucidate the need for a formula to predict footbridge frequencies which is customized to the particular geometry and materials of this type of footbridge.
Based on these observations, new empirical formulas for footbridge frequencies tailored to the investigated sixteen footbridges are developed using data collected from these footbridges. A linear regression was used to quantify the relationship between the key design variables in Equations (1, 3) and the VS and VA frequencies, respectively. A least squares fitting technique was used in this study to determine the coefficients of the empirical formula. The model is represented by the following relationship
where y is the footbridge frequency, θt are the model parameters, e is the model prediction error. In reference to Equations (1, 3), u is defined as the following for the VS and VA modes, respectively:
The model parameters are determined by minimizing the following expression:
where ŷ is the measured natural frequency for a given mode. The variance of prediction error is computed according to the following
where M is the number of observations. The resulting least squares fit with empirical formula and standard deviation of prediction error are shown in Figures 12,13. With some variations, empirical formulas exhibit reasonably good agreement with the data.
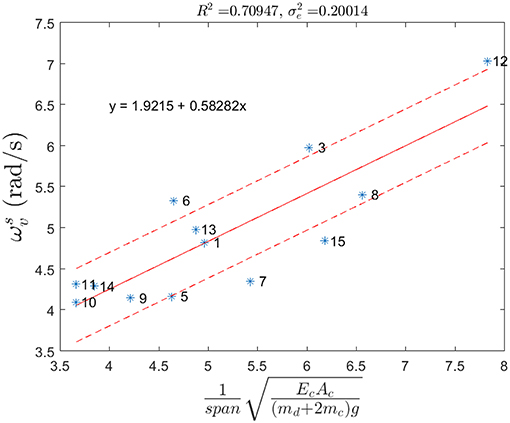
Figure 12. Measured VS frequencies (*), empirical formula (solid line) and standard deviation of prediction error (dashed) along with the formula.
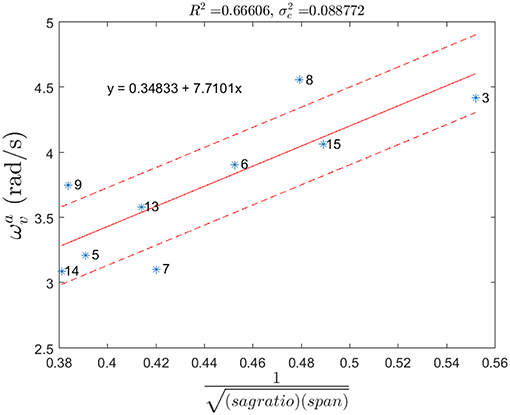
Figure 13. Measured VA frequencies (*), empirical formula (solid line) and standard deviation of prediction error (dashed) along with the formula.
A similar process was used to derive an empirical formula for the TS frequency, with the input parameter, u, defined as the following combination of design parameters in reference to Equation (2):
However, the relationship between this input and the resulting TS frequencies was very weak, with very low coefficient of determination (R2) of 0.03 in this case. Alternatively, since the vertical to torsional frequency ratios in the footbridges turn out to be fairly consistent overall, the VS frequency is used as a surrogate input to predict the TS frequency, where u in Equation (5) is expressed as:
Footbridge numbers 6 and 8, however, were noticeable outliers to this regression analysis. These two footbridges are 50 and 52 m spans, respectively and both share the characteristic of having higher than average camber in their deck, which may contribute to lower than expected torsional symmetric frequencies. When these two footbridges are excluded, the regression has R2 of 0.96 as shown in Figure 14.
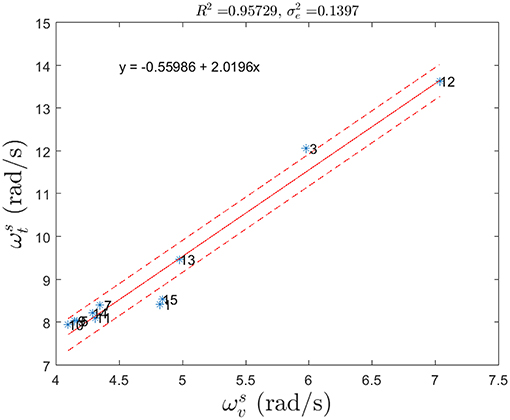
Figure 14. Measured TA frequencies (*), empirical formula (solid line) and standard deviation of prediction error (dashed) along with the formula.
While, there are insufficient data on TA frequencies with only four points to run a regression analysis. Thus, the frequency ratio between the VA and TA modes for the anti-symmetric case is assumed to be the same as for the symmetric modes. As more citizen sensing data will be populated in the database, this assumption can be further examined.
Trends in Damping Values of Footbridges
The influence of a number of design parameters on the damping ratio of B2P suspension footbridges are explored. Similar to the trends of natural frequencies earlier, the effects of span, span, cable type, and sag ratio on the damping values for symmetric and anti-symmetric modes are compared in Figures 15, 16. It is observed that footbridges with wire rope cable have higher damping ratios than those with post-tensioning strand. This difference in damping values is expected, given the different configurations of the two cable types. The wire rope is composed of multiple bundles of braided wires compared to post-tensioning strand, which is composed of six solid strands twisted around a central strand. There is a significantly higher number surface-to-surface interfaces between the dozens of individual strands in the wire rope compared to the seven strands in the post-tensioning strand. Thus, when the cable vibrates, rubbing between the many strands in the wire rope results in a higher damping ratio compared to the post-tensioning strand. For footbridges with the higher sag ratios have more damping in the VS and TS modes than those of similar spans with lower sag ratios. Unfortunately, this tendency will become problematic for the B2P because as spans increase, their current design calls for lowering the sag ratio in order to accommodate static freeboard requirements.
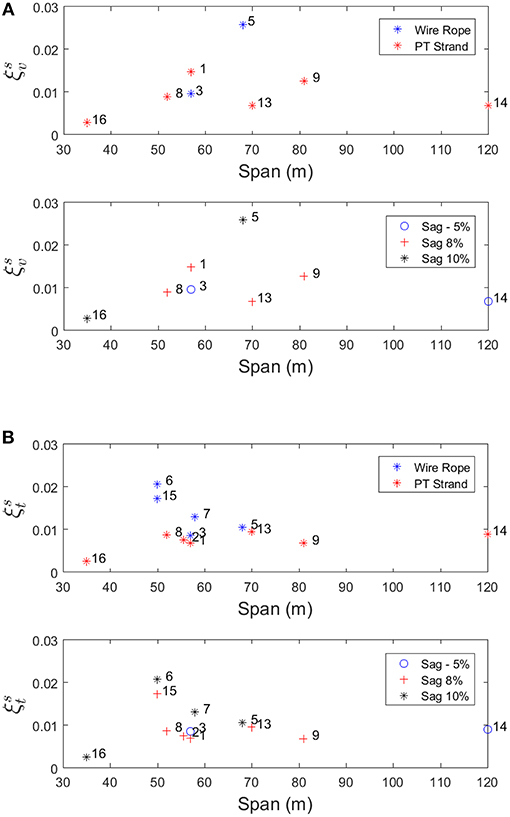
Figure 15. Vertical (A) and torsional (B) symmetric damping ratios of footbridges.
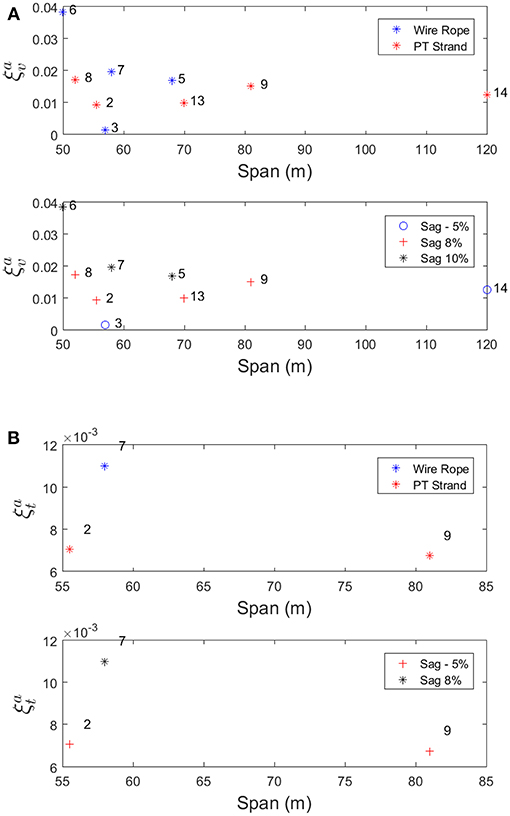
Figure 16. Vertical (A) and torsional (B) anti-symmetric damping ratios of footbridges.
Empirical Modeling of Damping in Footbridges
A number of empirical formulas were explored with the goal of developing a model to predict the damping of a rural footbridge given design variables. However, no single input parameter (i.e., linear regression) yields an empirical formula with a coefficient of determination high enough to reasonably predict a damping as summarized in Table 5, thus a multi-linear regression was explored taking the following form:
where u1…4 are span, modulus of elasticity, cable area, and sag ratio. The resulting empirical formula has a coefficient of determination of 0.53 (Table 5). This implies that with the current amount of data, no empirical formula is satisfactory to predict reliable damping values of rural footbridges used in this study. It is understandable that while the damping is known to be associated with significant uncertainty in nature (e.g., Kareem, 1988; Satake et al., 2003; Kwon et al., 2015). Thus, constant damping values corresponding to the respective minimum values for wire rope and strand may be chosen, such as 1.4% (wire rope) and 0.8% (strand), for the conceptual design stage.
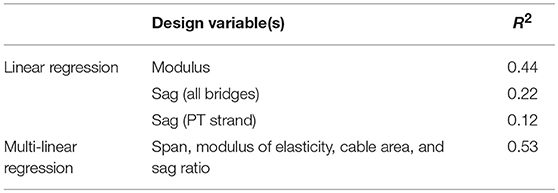
Table 5. Design variables and corresponding R2 in empirical formula of damping.
Batch Processing by Non-Experts for Footbridges with Known Natural Frequency Trends
A simple batch processing procedure is devised to be done by non-experts to process citizen sensing data from upcoming new footbridges in the future. This offers a scalable approach to rapidly process data from multiple footbridges to add to the initial database established. Note that due to both significant uncertainty associated with damping values and the lack of reliable empirical formulas, current batch processing procedure is designed only for natural frequencies of footbridges.
Simplified SI Scheme for Batch Processing of Natural Frequencies
The leading criterion for the batch processing SI scheme is that it can be executed entirely by a non-expert. Therefore, it should not require advanced knowledge of structural dynamics or a bridge-by-bridge adjustment of parameters. One of the simplest SI techniques which has been widely used in civil engineering applications is the peak-picking method. This classical approach is based on applying the discrete/fast Fourier transform to an output-only signal and estimating the structural frequencies by identifying the dominant peaks in frequency domain (e.g., Bendat and Piersol, 1993). Due to the straightforward application of the peak-picking method to free decay data collected by citizen sensing protocol and its generalizability to data from multiple footbridges without parameter modification, it is an ideal candidate for the batch processing procedure. Indeed, natural frequency of a structure is usually much less uncertain as compared to other structural parameter, such as damping, etc. (e.g., Kareem, 1988; Satake et al., 2003; Kwon et al., 2015).
In order for a non-expert to process the data, distinguishing among structural modes should be embedded in the procedure so that batch processors (non-experts) do not require technical judgments. Therefore, the procedure leverages known trends in the dynamic properties of footbridges in the aforementioned database to predict an expected frequency range for each mode of interest. A bandpass filter is then applied to the free decay signal for this range of frequencies to isolate the mode of interest and enable a mode-by-mode analysis. A schematic diagram of the batch processing procedure is shown in Figure 17.
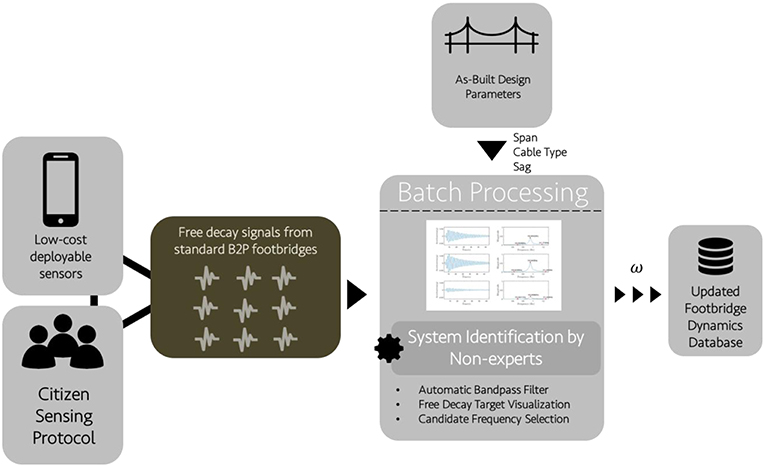
Figure 17. A schematic diagram of batch processing of citizen sensing data.
The first step in the procedure is to enter the span and cable type of the bridge from which the citizen sensing data was collected. Based on the frequency trend regression established earlier, predicted frequencies for the fundamental VS and TS modes are calculated. For each mode, a bandpass filter is automatically applied to the free decay signal with a range of plus or minus one standard deviation from the predicted frequency. The batch processor then manually selects the free decay portion of the signal using a target through a developed graphical user interface (GUI) tool in terms of MATLAB software. If no clean free decay is visually discernable, the data is flagged for expert review.
After the free decay portion of the signal is selected for each sensor location, a fast Fourier transform is used to compute its power spectral density (PSD). The magnitude is plotted and the three highest peaks are marked in the GUI tool along with their corresponding frequencies. The batch processor identifies the most likely frequency by checking the PSD from each sensor location. This process is repeated for other modes by filtering the selected free decay portion of the figure with a bandpass filter with limits of plus and minus one standard deviation from the predicted frequency through the empirical models earlier. In the case where no dominant peak is discernable, the data is flagged for expert review.
The application of the peak-picking method to the batch processing of citizen sensing data from footbridges depends on the non-expert batch processor being able to select the free decay portion of the signal and identify the frequencies of interest from a spectral plot. A prototype of the batch processing procedure was tested with a non-expert, who fits the profile of the type of person with a background in civil engineering but no training or exposure to structural dynamics. The test was performed by providing the non-expert with a written instruction manual and observing the execution of the procedure with data from eight footbridges. The results from the batch processing prototype were then compared to the natural frequencies (VS and TS modes) identified from the same signals using the wavelet-based SI scheme (Table 6).
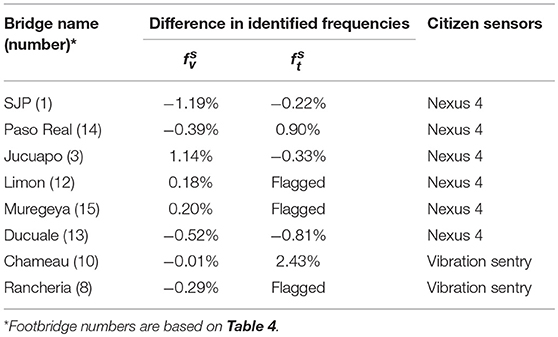
Table 6. Comparison of VS and TS frequencies estimated from wavelet-based SI scheme and batch processing procedure.
During the test, the VS frequencies for all eight bridges were correctly identified, and five of eight TS frequencies were correctly identified, with three being flagged for expert review. The results from the batch processing prototype test matched well with the wavelet-based SI scheme, indicating that this batch processing procedure shows promise in providing a scalable solution to processing an increasing amount of citizen sensing data in the near future that does not vary on experts. Further test and validation are required to check out consistency across a variety of data and non-experts with upcoming new footbridges to be monitored in the future. It would be desirable to grow the number of footbridges in the database as more data through the citizen sensing protocol which are added to the database, the lower the regression error will be, which will help to reduce uncertainty associated with natural frequency and damping of footbridges as well as potentially enhancing the safety of rural footbridges in design practice.
Future Studies
In addition to the current studies, several influential factors for investigating the behavior of rural footbridges need to be considered in the future. For example, it is well-known that walking effects, such as pedestrian-induced lateral and vertical vibrations can be significant on footbridges (e.g., Ingólfsson et al., 2012). Several studies on general footbridges have reported in identifying such effects through full-scale tests and measurements (e.g., Da Silva et al., 2007; Foti et al., 2012; Ivorra et al., 2015; Hawryszków et al., 2017; Shahabpoor et al., 2017a), modeling human-structure interactions in analytical and numerical methods (e.g., Piccardo and Tubino, 2009; Goldstein, 2017; Bassoli et al., 2018), and developing a design framework for a serviceability assessment perspective (e.g., Shahabpoor et al., 2017b). Those preceding studies would help to better examine and understand walking effects on rural footbridges, especially for the case that full-scale monitoring data are available. In this context, it is of great interest whether the proposed citizen sensing system in this study will be feasible to monitor those pedestrian-induced vibrations. In general, its capability depends on the characteristics of the vibrations, such as their amplitudes and frequency ranges. Since typical rural footbridges are quite flexible, the amplitudes of the vibrations would be sufficiently large to be monitored. In addition, based on past studies, average natural frequency of a single pedestrian walking is in the range of 1.8–2.0 Hz (e.g., Pachi and Ji, 2005) and such a frequency generally increases with the growing number of pedestrians (e.g., (Shahabpoor et al., 2017a,b)). Accordingly, it is expected that the proposed citizen sensors including smartphone-based system will be capable of capturing such vibrations. An important aspect is that such a frequency range of vibrations may lie within a range of natural frequency of some rural footbridges (e.g., Figures 9, 10). For this reason, it would need to be carefully checked for structural performance of rural footbridges with respect to walking effects because of possible dynamic amplification due to resonance, which has been of great concern in past studies for general footbridges. In addition, the effects of pedestrian-induced vibrations, aerodynamic forces, and amplitude dependency on the dynamic properties of dynamically sensitive rural footbridges (natural frequency, damping, etc.) may potentially be considered, which are of great importance for accurately evaluating structural performance and serviceability of rural footbridges under practical conditions. To this end, invoking a protocol for long-term monitoring of footbridges would serve to provide new insights into the currently proposed framework. These perspectives deserve more attention in future studies.
Concluding Remarks
The data-enabled prediction framework involving novel citizen sensing protocol, database framework, empirical models, and batch processing procedure introduced in this study allow for the establishment of baseline dynamic properties for a rural footbridge design. Trends from the current set of sixteen footbridges that have been monitored to date provide a starting point for establishing trends in the relationship between key input design variables and natural frequencies and damping ratios of footbridges. These trends enable the application of a batch processing procedure which automatically applies bandpass filters to the free decay signals from citizen sensing data based on predicted vertical and torsional frequencies, respectively. As a result, the proposed protocol can be executed by non-experts to determine the fundamental frequencies of bridges based on the ongoing collection of dynamics data from rural suspension footbridges across the world. It utilizes readily available sensing systems (citizen sensors) that can be deployed by non-experts in a matter of hours to collect free decay vibration signals from rural footbridges. The data can then be processed using the batch processing protocol for entry into the dynamics database. The proposed framework offers instant and continuous updates of existing database with minimal efforts for enhancing the knowledge and the prediction of dynamic characteristics of rural footbridges.
Author Contributions
MG performed full-scale tests, analyzed data, and prepared the manuscript. DK advised/supported footbridge instrumentations/tests and prepared, reviewed, and revised the manuscript. AK directed overall project and reviewed/revised the manuscript.
Conflict of Interest Statement
The authors declare that the research was conducted in the absence of any commercial or financial relationships that could be construed as a potential conflict of interest.
Acknowledgments
This study was funded by NSF-GRFP and NSF-EAPSI fellowships and in part by the US NSF Grant # CMMI-1562244. Authors would also like to acknowledge Bridge Diagnostics, Inc. for generously donating the reference sensors and field engineering time, the Modeling and Simulation of Structures Laboratory (MSSL) at Bauhaus-Universität Weimar, Germany, for the use of the ASPIRE app, and entire Bridges to Prosperity (B2P) team for their supports in the instrumentations of footbridges.
References
AASHTO (2008). AASHTO LRFD Bridge Design Specifications. Washington, DC: American Association of State Highway and Transportation Officials.
Au, S., Ng, C., Sien, H., and Chua, H. (2005). Modal identification of a suspension footbridge using free vibration signatures. Int. J. Appl. Math. Mech. 1, 55–73.
Bassoli, E., Van Nimmen, K., Vincenzi, L., and Van den Broeck, P. (2018). A spectral load model for pedestrian excitation including vertical human structure interaction. Eng. Struct. 156, 537–547. doi: 10.1016/j.engstruct.2017.11.050
Bendat, J. S., and Piersol, A. G. (1993). Engineering Applications of Correlation and Spectral Analysis. New York, NY: John Wiley and Sons, Inc.
Benedettini, F., and Gentile, C. (2011). Operational modal testing and FE model tuning of a cable-stayed bridge. Eng. Struct. 33, 2063–2073. doi: 10.1016/j.engstruct.2011.02.046
Brownjohn, J., Dumanoglu, A., and Taylor, C. (1994). Dynamic investigation of a suspension footbridge. Eng. Struct. 16, 395–406. doi: 10.1016/0141-0296(94)90054-X
Da Silva, J. G. S., Da S. Vellasco, P. C. G., De Andrade, S. A. L., De Lima, L. R. O., and Figueiredo, F. P. (2007). Vibration analysis of footbridges due to vertical human loads. Comput. Struct. 85, 1693–1703. doi: 10.1016/j.compstruc.2007.02.012
Farrar, C. R., and Worden, K. (2007). An introduction to structural health monitoring. Philos. Trans. Ser. A 365, 303–315. doi: 10.1098/rsta.2006.1928
Fei, Q., Li, A., Han, X., and Miao, C. (2009). Modal identification of long-span Runyang Bridge using ambient responses recorded by SHMS. Sci. China Ser. E 52, 3632–3639. doi: 10.1007/s11431-009-0360-5
Foti, D., Ivorra, S., Bru, D., and Dimaggio, G. (2012). “Dynamic identification of a pedestrian bridge using operational modal analysis,” in Proceedings Eleventh International Conference on Computational Structures Technology (Dubrovnik), 4–7.
Gara, F., Nicoletti, V., Roia, D., Dezi, L., and Dall'Asta, A. (2016). “Dynamic monitoring of an isolated steel arch bridge during static load test,” in Proceedings 2016 IEEE Workshop on Environmental, Energy, and Structural Monitoring Systems (EESMS) (Bari), 13–14.
Gentile, C., and Gallino, N. (2008). Ambient vibration testing and structural evaluation of an historic suspension footbridge. Adv. Eng. Softw. 39, 356–366. doi: 10.1016/j.advengsoft.2007.01.001
Gibbs, M. (2017). A framework for the Prediction and Mitigation of Flutter in Suspension Footbridges: a Human-Centered Approach. Ph.D. dissertation, University of Notre Dame.
Goldstein, G. H. (2017). Crowd of individuals walking in opposite directions. A toy model to study the segregation of the group into lanes of individuals moving in the same direction. Phys. A 479, 162–173. doi: 10.1016/j.physa.2017.03.011
Hawryszków, P., Pimentel, R., and Silva, F. (2017). Vibration effects of loads due to groups crossing a lively footbridge. Procedia Eng. 199, 2808–2813. doi: 10.1016/j.proeng.2017.09.565
Hoult, N., Bennett, P. J., Stoianov, I., Fidler, P., Maksimović, Č., Middleton, C., et al. (2009). Wireless sensor networks: creating ‘smart infrastructure’. Civ. Eng. 162, 136–143. doi: 10.1680/cien.2009.162.3.136
Ingólfsson, E. T., Georgakis, C. T., and Jönsson, J. (2012). Pedestrian-induced lateral vibrations of footbridges: a literature review. Eng. Struct. 45, 21–52. doi: 10.1016/j.engstruct.2012.05.038
Ivorra, S., Foti, D., Bru, D., and Javier Baeza, F. (2015). Dynamic behavior of a pedestrian bridge in Alicante, Spain. J. Perform. Constr. Facil. 29:04014132 doi: 10.1061/(ASCE)CF.1943-5509.0000556
Ivorra, S., Foti, D., Paparella, F., and Javier Baeza, F. (2017). Dynamic load tests on the North-South axis cable-stayed bridge with a non-symmetric central pylon. Procedia Eng. 199, 2967–2972. doi: 10.1016/j.proeng.2017.09.528
Kareem, A. (1988). Aerodynamic response of structures with parametric uncertainties. Struct. Saf. 5, 205–225. doi: 10.1016/0167-4730(88)90010-0
Kijewski, T., and Kareem, A. (2003). Wavelet transforms for system identification in civil engineering. Comput. Aided Civ. Infrastruct. Eng. 18, 339–355. doi: 10.1111/1467-8667.t01-1-00312
Kijewski-Correa, T., Kilpatrick, J., Kareem, A., Kwon, D. K., Bashor, R., Kochly, M., et al. (2006). Validating the wind-induced response of tall buildings: a synopsis of the Chicago full-scale monitoring program. J. Struct. Eng. 132, 1509–1523. doi: 10.1061/(ASCE)0733-9445(2006)132:10(1509)
Kwon, D. K., Kareem, A., Stansel, R., and Ellingwood, B. R. (2015). Wind load factors for dynamically sensitive structures with uncertainties. Eng. Struct. 103, 53–62. doi: 10.1016/j.engstruct.2015.08.031
Li, J., Mechitov, K. A., Kim, R. E., and Spencer, B. F. (2016). Efficient time synchronization for structural health monitoring using wireless smart sensor networks. Struct. Control Health Monit. 23, 470–486. doi: 10.1002/stc.1782
Meng, X., Dodson, A., and Roberts, G. (2007). Detecting bridge dynamics with GPS and triaxial accelerometers. Eng. Struct. 29, 3178–3184. doi: 10.1016/j.engstruct.2007.03.012
Morgenthal, G., and Hopfner, H. (2012). The application of smartphones to measuring transient structural displacements. J. Civ. Struct. Health Monit. 2, 149–161. doi: 10.1007/s13349-012-0025-0
Pavic, A., Armitage, T., Reynolds, P., and Wright, J. (2002). “Methodology for modal testing of the Millennium Bridge,” in Proceedings of the Institution of Civil Engineers- Structures and Buildings (London), 152, 111–121. doi: 10.1680/stbu.2002.152.2.111
Piccardo, G., and Tubino, F. (2009). Simplified procedures for vibration serviceability analysis of footbridges subjected to realistic walking loads. Comput. Struct. 87, 890–903. doi: 10.1016/j.compstruc.2009.04.006
Satake, N., Suda, K., Arakawa, T., Sasaki, A., and Tamura, Y. (2003). Damping evaluation using full-scale data of buildings in Japan. J. Struct. Eng. 129, 470–477. doi: 10.1061/(ASCE)0733-9445(2003)129:4(470)
Sétra, F. (2006). Assessment of vibrational behaviour of footbridges under pedestrian loading, Technical Guide, Service d'Études Techniques des Routes et Autoroutes (Sétra). Paris: Ministry of Transport and Infrastructure.
Shahabpoor, E., Pavic, A., and Racic, V. (2017b). Structural vibration serviceability: new design framework featuring human-structure interaction. Eng. Struct. 136, 295–311. doi: 10.1016/j.engstruct.2017.01.030
Shahabpoor, E., Pavic, A., Racic, V., and Zivanovic, S. (2017a). Effect of group walking traffic on dynamic properties of pedestrian structures. J. Sound Vib. 387, 207–225. doi: 10.1016/j.jsv.2016.10.017
Ungar, E. (2015). A preview of the second edition of the AISC design guide 11 “Vibrations of steel framed structural systems due to human activity.” J. Acoust. Soc. Am. 138:1807. doi: 10.1121/1.4933732
Wang, H., Li, A., Guo, T., and Tao, T. (2014). Establishment and application of the wind and structural health monitoring system for the Runyang Yangtze River Bridge. Shock Vib. 2014:421038. doi: 10.1155/2014/421038
Wang, H., Li, A., Niu, J., Zong, Z., and Li, J. (2013). Long-term monitoring of wind characteristics at Sutong Bridge site. J Wind Eng. Ind. Aerodyn. 115, 39–47. doi: 10.1016/j.jweia.2013.01.006
Wang, H., Mao, J. X., Huang, J. H., and Li, A. Q. (2016). Modal identification of Sutong cable-stayed bridge during Typhoon Haikui using wavelet transform method. J. Perform. Constr. Facil. 30:04016001. doi: 10.1061/(ASCE)CF.1943-5509.0000856
West, H. H., Suhoski, J. E., and Geschwindner, L. F. Jr (1984). Natural frequencies and modes of suspension bridges. J. Struct. Eng. 110, 2471–2486. doi: 10.1061/(ASCE)0733-9445(1984)110:10(2471)
Xiang, H., Chen, A., and Lin, Z. (1998). An introduction to the Chinese wind-resistant design guideline for highway bridges. J. Wind Eng. Ind. Aerodyn. 74, 903–911. doi: 10.1016/S0167-6105(98)00082-8
Yu, Y., Han, R., Zhao, X., Mao, X., Hu, W., Jiao, D., et al. (2015). Initial validation of mobile-structural health monitoring method using smartphones. Int. J. Distrib. Sens. Netw. 11, 1–14. doi: 10.1155/2015/274391
Zhou, G., and Yi, T. (2013). Recent developments on wireless sensor networks technology for bridge health monitoring. Math. Probl. Eng. 2013:947867. doi: 10.1155/2013/947867
Živanović, S., Pavic, A., and Reynolds, P. (2006). Modal testing and FE model tuning of a lively footbridge structure. Eng. Struct. 28, 857–868. doi: 10.1016/j.engstruct.2005.10.012
Keywords: rural footbridge, citizen sensing approach, full-scale monitoring, system identification, wind load
Citation: Gibbs MM, Kwon DK and Kareem A (2019) Data-Enabled Prediction Framework of Dynamic Characteristics of Rural Footbridges Using Novel Citizen Sensing Approach. Front. Built Environ. 5:38. doi: 10.3389/fbuil.2019.00038
Received: 12 December 2018; Accepted: 07 March 2019;
Published: 28 March 2019.
Edited by:
Branko Glisic, Princeton University, United StatesCopyright © 2019 Gibbs, Kwon and Kareem. This is an open-access article distributed under the terms of the Creative Commons Attribution License (CC BY). The use, distribution or reproduction in other forums is permitted, provided the original author(s) and the copyright owner(s) are credited and that the original publication in this journal is cited, in accordance with accepted academic practice. No use, distribution or reproduction is permitted which does not comply with these terms.
*Correspondence: Ahsan Kareem, a2FyZWVtQG5kLmVkdQ==