 Rebecca Napolitano
 Zachary Liu2
 Branko Glisic
- 1Structural Health Monitoring and Heritage Structures Labs, Princeton University, Civil and Environmental Engineering, Princeton, NJ, United States
- 2Structural Health Monitoring and Heritage Structures Labs, Princeton University, Computer Science, Princeton, NJ, United States
With the current deterioration rate of existing infrastructure, the importance of intervention and preservation efforts such as on-site visual inspections, non-destructive evaluation, structural health monitoring (SHM), and building pathology are on the rise. A critical aspect of these intervention and preservation methods is the visualization and accessibility of large, heterogeneous data sets. To enable diverse stakeholders to make informed choices, data and metadata for the built environment needs to be directly integrated into a user's viewing environment. To address this challenge, a human-machine interface which organizes these types of data and provides actionable information is necessary. The main aim of this work is to develop a preliminary framework for documenting and visualizing data about the built environment both on and off site using a combination of image-based documentation and augmented reality (AR). While this work illustrates preliminary annotation mechanisms such as drawing, the concept of projecting data between the image-based environment and the AR environment is the main contribution of this work. This method was applied to test objects as well as case studies in SHM and building pathology.
1. Introduction
Despite its critical role in driving the economy and improving the quality of life, existing infrastructure in the United States is deteriorating (rated with a D+ by the American Society of Civil Engineering, ASCE) (American Society of Civil Engineers, 2017). To ensure the safety and longevity of existing structures, on-site visual inspections, non-destructive evaluation, structural health monitoring (SHM), and building pathology are used to quantify the structural deterioration of infrastructure. A challenge with these methods however is that they can result in the collection and analysis of large, heterogeneous data, and metadata sets. To ensure that decision-makers develop informed choices which safeguard the functionality, safety, and longevity of infrastructure, it is necessary that these diverse data sets are integrated, accessed, and visualized in a manner that yields actionable and objective information. However, current data management methods are frequently inefficient, confusing, and deficient in one way or another (Glisic et al., 2014). This can significantly reduce the effectiveness of these methods and result in expensive or inadequate engineering solutions. To address the above challenges, it is necessary to develop a human-machine interface that can organize these types of heterogeneous data and provide actionable information to a diverse range of stakeholders. The objective of this work is to outline a preliminary framework for collecting, integrating, accessing, and visualizing (i.e., managing) data and metadata associated with these methods that is suitable for both on and off site use. In particular, the developed application has been applied to case studies in SHM and building pathology.
2. Rationale
For the duration of the paper, the term “data” refers to parameters (e.g., crack size, internal force, vibration, etc.) assessed on the structure manually (e.g., by an inspector) or remotely (e.g., using sensors), as well as results of their analysis and numerical modeling. The term “metadata” refers to data describing the structure and any installed sensor system (e.g., plans with locations of sensors, type / specification of sensors, etc.). Currently, there are three challenges in the data and metadata record management:
1. The heterogeneous nature of the data and metadata (e.g., drawings, static and dynamic measurements, photographs, camera streams, notes, etc.) makes it difficult to access and visualize in an integrated yet simple, intuitive, and meaningful manner. If the different sources of data could be streamlined by the user, then their heterogeneous nature could become an advantage to better understand the observed phenomenon.
2. The size and geometry of infrastructure components (e.g., bridges, pipelines, etc.) are large and frequently complex, which presents a challenge to directly correlate the data with metadata (e.g., sensor readings are not directly correlated with their position, results of data analysis with the location of the damage, etc.). This in turn is crucial to understanding the data and for deciding subsequent actions. Therefore, the data collected from infrastructure components becomes meaningful only if it is related to the position where it is collected. In a human-centered assessment context, instead of separating data from the structures where it was collected, it would be beneficial for users to visualize data “overlaid” on the structures and across the time, especially while the user is in the field.
3. A diverse user group consults the infrastructural data and metadata; for example, the inspector, evaluating engineer, and decision maker are frequently not the same person for an infrastructure project. They may have different backgrounds and needs in terms of documentation, access, and visualization. Therefore, how they manage (collect, update, consult, understand, and use) the data and metadata differ; thus an integrated method that enables all of these parties to manage the data is critical.
Therefore, a robust method of managing data and metadata can offer a new strategy for inspectors, engineers, and managers. This will lead to successful structural assessment using data that is not separated from its environment but becomes part of the infrastructure. For this method to be efficient, it must be affordable in terms of time and cost, and simple and intuitive in terms of usability. As a preliminary step toward addressing this need, this paper proposes a combination of image-based documentation and augmented reality. This work commences with a review of current methodologies and uses prior literature to highlight gaps in existing methods. Subsequently, the novel framework is described on a conceptual level, implementation of the code is discussed, and a prototype of the human-AR interface is shown. Lastly, this work shows the method being applied to test objects as well as case studies in structural health monitoring and building pathology.
3. Review of Current Methodologies and Existing Gaps
Historically, there have been two main methods for visualizing SHM and building pathology data. Two-dimensional (2D) documentation includes Computer-Aided Design (CAD) programs which enable a user to create scaled drawings of a structure and indicate the locations of sensors. In addition, there are other 2D programs for visualizing data with still images from a structure. Many SHM companies have their own proprietary software which utilize this methodology to organize and visualize information about the overall system (Canary Systems, 2015; Data Monitoring Systems Limited, 2015; Colombo and Bittencourt, 2016; Smartec, 2017). One advantage of 2D methods is that they can be cheaper in terms of time, money, and data management. However, one major shortcoming is that they are not always able to convey the complex geometry of a site. By simply conglomerating several 2D images of a site, an intuitive and efficient method for understanding problems on a structure or existing sensor networks is not guaranteed. Additionally, as more advanced sensor networks are developed such as sensing sheets, skins, and other methods (Sabra et al., 2008; Loh et al., 2009; Zonta et al., 2009; Yao and Glisic, 2015; Yao et al., 2015; DiGiampaolo et al., 2017) it will become increasingly harder to clearly convey the space using 2D methods (Carno, 2017). This is not an issue for only visualizing SHM networks.
Commonly in building pathology, evident symptoms and their underlying causes lie in different planes. For example, spalling of a stone on the ground level of a building could be facilitated by subflorescence which is originally caused by a pipe draining improperly in the vicinity. While this shortcoming is not addressed in this preliminary framework, it is the subject of a future work. In addition to the issues of documenting complexities, another short coming of 2D methods is the disconnect between what is happening on site and what is in the images. A user has to understand how the images relate to the structure and then in their minds project where the issues or sensors are located; there is no direct integration into their environment which can give room for human error. This shortcoming is specifically addressed in the current work.
Similar to 2D methods, 3D methods have both their advantages and disadvantages. One main advantage of 3D methods is that they can be useful for depicting complex geometries and sensor typologies. Common methods of 3D documentation for the built environment include LiDAR (Chang et al., 2003; Park et al., 2007; Puente et al., 2013; Qarib and Adeli, 2014), photogrammetry (Urbanova et al., 2015; Napolitano and Glisic, 2018), Bridge Information Modeling (BrIM) (Jafari et al., 2016; Martinez-Aires et al., 2018; Sacks et al., 2018), and Building Information Modeling (BIM) (Arayici et al., 2017; Bruno et al., 2018; Theiler et al., 2018). While these methods are capable of conveying complex geometries and sensor networks, they can be demanding for a project in terms of time, money, and data management. Similar to 2D methods, with 3D methods there are still issues connecting what is happening on site and what is in the models. This again can provide room for human error which is why it is the main point addressed in this work.
In recent years, advances have been made using virtual and augmented reality to address shortcomings of standard 2D and 3D methods. In a virtual reality (VR) environment, all of the buildings, sensors, etc., are virtual and not integrated with the real building environment. Many major companies such as LERA and AECOM use VR BIM models to convey complex building geometries. However, since not all existing structures have as-built 3D models, this can make VR BIM an investment for a project.
In attempts to ameliorate this issue, a method using virtual tours and informational modeling environments was developed. That method uses spherical panoramas to document a space which mitigates any issues with complex geometries. It has been tested for both building pathology (Napolitano et al., 2017b) and structural health monitoring applications (Napolitano et al., 2017a). While this method was illustrated to be more cost and time effective than 2D and 3D methods (Napolitano et al., 2018b,a), shortcomings of this approach are similar to that of 2D and 3D methods. Along with 2D and 3D methods, VR is still disjointed from what a user would be viewing on site.
While VR suffers from lack of integration within a user's on site environment, augmented reality (AR) is designed specifically for this application. Unlike the virtual objects of VR, AR directly integrates a user's surroundings into the environment and thus is an intuitive method for visualizing data (Kamat and El-Tawil, 2007; Henderson and Feiner, 2011).
AR has been utilized in the architecture, engineering, and construction (AEC) industry for the past two decades (Chi et al., 2013). Specifically, it has been included in workflows for facilities management (Bae et al., 2013; Wang et al., 2013), inspection (Shin and Dunston, 2010, 2009), and design (Webster et al., 1996; Thomas et al., 1999; Broll et al., 2004). While it has been widely used in some sectors of AEC, AR has not been widely leveraged for the fields of SHM and building pathology. (Bleck et al., 2017) outlined a toolbox for using augmented reality for the development of smart nuclear facilities (Bleck et al., 2017). In that approach, a nuclear facility could be modeled in the virtual domain and then augmented to a user's screen so that stakeholders could have access to real-time operations. For that application HoloLens glasses were used in conjunction with QR codes. (Morales Garcia et al., 2017) used a similar approach with the HoloLens glasses for smart infrastructure inspection specifically with regards to the integration of thermal images (Morales Garcia et al., 2017). Continuing the work of Morales et al. (2017) and Ballor et al. (2019) integrated measurement capabilities to the AR environment as they are a standard of visual inspections (Ballor et al., 2019). While these approaches mitigate the underlying issues of depicting complex geometries or intuitive on site viewing, they either still require a 3D model to built or do not address off site viewing capabilities. Since very few structures today have as-built records or building information models, approaches have been outlined for generating BIM models based on video data and laser scan models (Brilakis et al., 2010). Thus, while current AR methods are well-suited for on-site integration of data and this can be paired with BIM for off-site viewing, these methods can be costly for a project in terms of time, money, and management.
Thus there is a dichotomy presented in the existing methods for creating a cyber physical system (CPS) for infrastructure. Currently, efficient methods are available if (1) a 3D model is within the broader project's scope to facilitate off-site viewing capabilities or (2) if the objects of interest do not need to be integrated directly into a user's viewing environment. Figure 1 illustrates the gap in current methods. Hence there is a need for an integrated method which facilitates both on and off site access yet does not necessitate the need for building a 3D model.
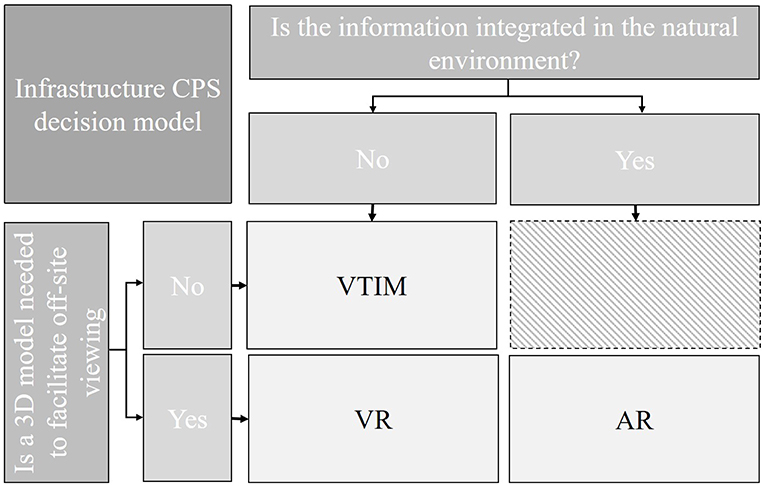
Figure 1. Decision model for documenting and communicating infrastructure data and metadata.
4. Approach
The key idea of this paper is to develop a framework for documenting and visualizing data about the built environment using a combination of image-based documentation and AR to ensure efficiency both on and off site. Figures 2–4 illustrate the concept for this project. Figure 2 illustrates an on site user examining a bridge. While they are on site they can use a tablet or other mobile device to view if there are any sensors installed in the structure and if so, where they are. Additionally a user will be able to interact with the AR annotations through on-click conditions, as the last panel shows, to bring up data and/or metadata of interest. By leveraging the benefits of augmented reality, a user can intuitively view and augment information about a structure while on-site.
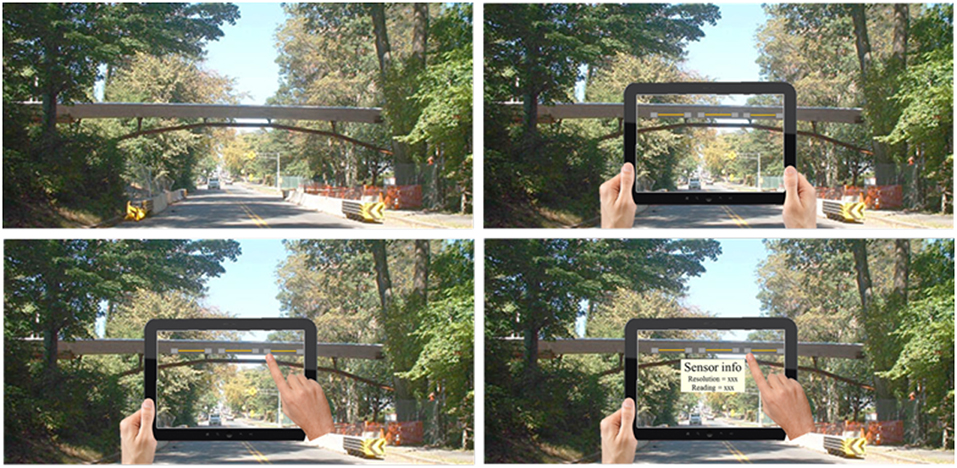
Figure 2. Conceptual design for augmented reality application. Each panel indicates a step in a user's process: (1) view structure on site, (2) view existing damages or sensors in the context of the structure, (3) interact with existing annotations, (4) visualize existing data and metadata for a structure.
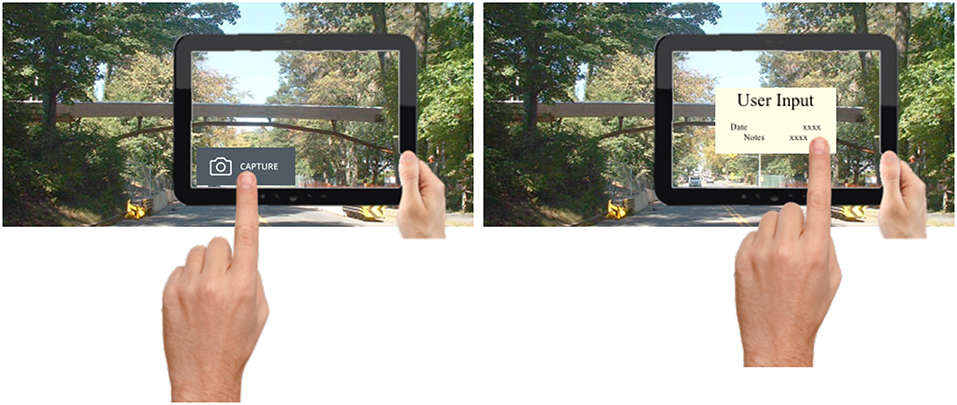
Figure 3. Conceptual design for integrating image acquisition into the augmented reality application. Each panel indicates a step in a user's process: (1) before placing an annotation, a user must capture an image which can be used for off-site viewing (2) then a user can augment the existing project with additional annotations.
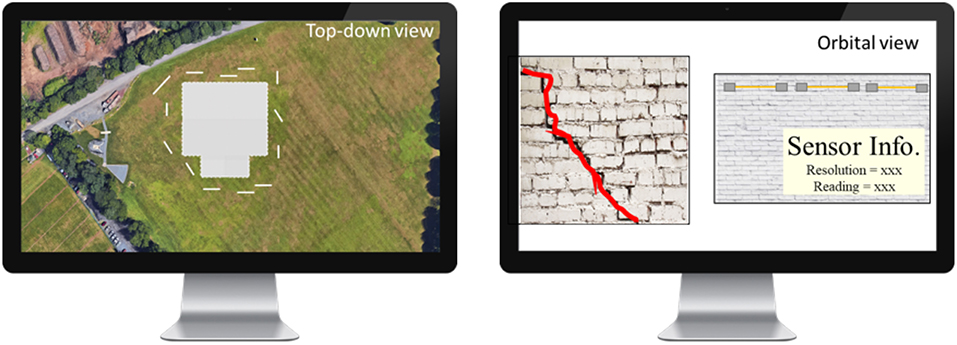
Figure 4. Conceptual design for off site viewing capabilities. Each panel indicates a different viewing mode that the user could choose: (1) the top-down view will situate the captured images on a satellite map to provide contextualization (2) an orbital view will enable a user to interact with individual annotations and “virtually” walk around them and interact.
However, a key aim of this work is not only facilitate on site viewing and augmentation of data, as that has been previously explored by others. This work integrates image acquisition with each AR annotation to ensure efficiency for off site viewing. For instance, when the user goes to add an annotation to a project, they are first prompted to take an image from their current position as shown in Figure 3. This then enables the figures to be used for off site viewing. Additionally a key feature of this method is that annotations that are made in the augmented reality environment are automatically projected onto the images and vice versa. Thus, a user could choose what environment it is more applicable for them to add the annotations and not have to duplicate the work for the purposes of viewing it somewhere else. Figure 4 provides the conceptual design for how a user could interact with these images off site. Each panel illustrates a different viewing mode that the user could choose from. The top-down view shows where all of the images (gray lines) were taken around a building in the context of a satellite map. If a user is interested in seeing what the images and annotations are, they can then use an orbital-mode. This will enable a user to “virtually” walk around the captured annotations. At this point, they can also add further annotations to the images if it is desired. By integrating the system with a real-time client architecture, this method will naturally facilitate a unified development approach. By doing this, the same program can be shared across multiple different platforms (computer, mobile, iOS, android) which will facilitate communication between disparate parties on a project both in the field and in the office.
5. Implementation
Unity Game Engine was used for cross-platform development as it supports open-source programming for headsets, computers, web addresses, and mobile devices. By building the framework for the project in such a versatile manner, the goal is to not rule out any future users or capabilities of the program. Unity's ARInterface library was used to support the cross-platform AR features in this application. ARInterface is an abstraction over ARCore and ARKit which works with android and iOS devices to facilitate a broader application. ARInterface enables an application to perform pose estimation which involves predicting the position and rotation of the device in 3D space. This works by combining data from inertial sensors, including the built-in accelerometer and gyroscope, with visual tracking using the camera. As the user moves their device around the environment, ARInterface tracks the movement of key points in the scene to measure how long it is moving. These key points make up the raw point cloud (Figure 5A). The point cloud is composed of key feature points in a user's surroundings. This point cloud is critical to the current prototype's implementation as it provides interactive depth information about a space. This point cloud can be combined with a technique called raycasting to enable selection of certain points in space to place annotation on.
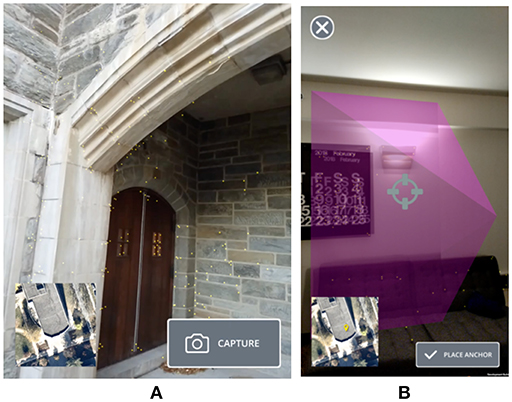
Figure 5. (A) Image showing the initial capture interface; the yellow dots are the point cloud. (B) Image showing the application reanchoring an image. The pink pyramid represents the relationship between the camera position and image plane in terms of position and pose.
5.1. Client Architecture
In creating the architecture for this application, the common Model-View-Controller (MVC) design pattern was used. This is a pattern for data-heavy applications which focus on establishing clear separation of concerns between sections of the application code base. In the MVC pattern, the “model” corresponds to classes which solely handle data, while the “view” corresponds to classes which display data to the user. In between, the “controller” manages fetching data from the model and displaying it on the view. It also listens to events on the view, such as a button being pressed or a text field being updated, and makes any necessary changes to the model. This approach works well for data-heavy web applications, where the primary role of the controller is to manage shuffling data back and forth. But in an interactive 3D environment with complex logic, additional abstractions are needed (Atwood, 2008).
Since Unity is commonly used as a game engine, its development structure favors a visually-oriented, component-based approach. In Unity, an application consists of one or more “Scenes,” each of which is composed of a nested tree of “GameObjects.” Every GameObject has a single parent, with those at the top level having the root as its parent. This rigid hierarchical structure maps well to games or other 3D applications. To add behaviors to this tree, Unity supports an abstraction called components which are scripts, behaviors, or characteristics which are attached to a GameObject in the tree. They can optionally contain references to GameObjects and/or components anywhere else in the tree, whether further above the hierarchy or further down. Importantly, components are designed to be composable abstractions. For example, in this work a drawing component was created which could be attached to a plane to add drawing functionality to the object.
These types of abstractions were combined in building the present application. The controllers were treated as a type of component which had more complex logic and which “owned” a piece of the GameObject hierarchy. The majority of the critical logic was then stored in controllers which managed the job of loading and saving the model. Since a controller owns its subtree, a controller may include or create other controllers as “children” it manages. Similarly, a component may create and own subcomponents if needed. But within the number of controllers and components which interact simultaneously in the framework, for this project it was necessary to establish a guideline for how one controller or component may reference and interact with another to reduce complexity. When one script calls a method on another script, it introduces a hard dependency from the caller to the callee. It should be considered how this would affect UI development. If the code were to be structured as such this button directly calls a method on its parent controller, then this button could never be tested in isolation without the parent. Instead, the “observer” pattern should be used. This type of pattern listens passively for actions on another object. When something should happen in the parent response to something in its child objects, such as a button triggering an action, for this application it is preferred to have the parent controller or component register an event listener on the child. When the button is pressed, the event is triggered by the child looking for any registered listeners and calling them in turn. The child thus is not dependent on which behaviors, if there are any at all, might be triggered in response to something it does, removing this circular dependency.
5.2. Image Visualization
To display a captured image, the representation would need to convey information about the original position and its pose in the scene. After a user captures an image, it is initially placed at a fixed distance from the camera. Several approaches for visually representing the position of the camera were considered. In the case where the image is placed a variable distance from the original camera position, it is especially helpful to have this information visible to the user. In an initial prototype, the camera position was represented by a spherical marker, and a line was drawn from this point to the image plane. However during testing, this method was found to be unintuitive as it was unclear what the line or marker indicated and it did not explain how the size of the image plane was calculated. In the current version, the relationship between the camera position and the image plane was represented as a pyramid (Figure 5B). This provides a user with a direct visualization of the field of view of the camera. If the location of the image is not calculated correctly, the anchor tool can be used to move the image in the AR environment to the proper position or pose.
5.2.1. Anchor Tool
The Anchor tool leverages the raycasting feature of the AR library to provide another way to anchor an image to a location in the scene. When the tool is activated, a raycast is continuously performed from a fixed location on the screen and represented as a crosshair image. The AR library takes the scene coordinates of this position and attempts to determine the z-distance (forward distance from the camera) from this point to the closest point on a surface in the scene, based on the point cloud data it has collected. Once the raycast detects a point, the color of the crosshairs is updated to green and the distance of the image plane is adjusted to match the z-distance to the detected raycast target.
5.3. Annotation Tools
There are two types of annotation tools in the current prototype: image-based and point cloud-based annotations. The image-based annotations refer to annotations (in this prototype, drawing) directly on the flat image itself, while point cloud-based annotations refer to annotations made in the AR environment. Drawing was used as a prototype feature however the same scripts for augmenting, accessing, and storing data can be used to develop additional functionality.
5.3.1. Image-Based Annotations
The simplest type of annotation is the ability to draw free form lines on the image itself. This component works by detecting when the user touches the image plane, and tracing the location of their movements on the surface of their tablet or mobile device. The component then plots the captured positions on the image and this is saved to a server.
5.3.2. Point Cloud-Based Annotations
A more interesting type of annotation is the ability to draw directly on surfaces in the scene, even when the surface is not parallel with the image plane. For example, the user may find it more expressive to annotate the surface of a curved wall, a task which would not be possible on a flat image. This is made possible by leveraging the AR toolkit's raycasting feature to determine the geometry of locations in the scene. Using this input, the user can draw lines directly on surfaces in the scene by moving their device around the area to capture the point cloud. Rather than moving the position of the user's mouse or touch input as with image-based annotations, the point cloud-based annotations use the AR raycasting tool to locate the coordinate on the screen. Connecting together multiple coordinates, the component captures the desired outline.
Using the raycasted coordinates, the drawing can be rendered directly within the point cloud. However, to make these annotations visible on a desktop, projection back to the image plane was necessary. This transformation is performed by projecting a ray starting from the image's original camera location, through the image plane, and ending at the surface point in the scene. The intersection of this ray with the image plane provides the coordinates needed to render a drawing directly on the image. If the image is properly positioned, then the drawing on the image plane will appear to be located at the same spot as the drawing in the point cloud except flattened onto the image. This approach provides the benefit of being able to perform AR annotations that can also be viewed on a 2D screen off site.
5.4. World Alignment
While ARInterface offers precise positional tracking, this method is subject to drift over time as it uses the relative positioning from one camera to the next as a basis. To minimize the adverse effects of this high-precision, yet low-accuracy method, the out-of-the-box tracking with ARInterface has been augmented using GPS. As GPS utilizes an absolute location, it is not subject to drift over time as the AR methods are. However, a shortcoming of only relying on GPS data is that it is not precise. Thus, by combining the two methods, the adverse effects of each can be mitigated.
To combine the methods a Kalman filter was used to incorporate data from each source (Bishop and Welch, 2001). Kalman filters are a statistical estimation technique for predicting the true state of an underlying system using a sequence of noisy output data. It is an optimal estimator as it is able to minimize the covariance of the predicted output even if the individual measurements are noisy.
Kalman filters are composed of two main parts, the process update step and the measurement update step. For this application, the AR position was used as the process update step since the AR framework determines the position of the device using a relative calculation from one frame to the next. Then GPS is used as the measurement update step. Each GPS location update provides an “accuracy” parameter which represents the precision of this measurement as determined by the strength of the received signal. (Evaluation of this method can be found in section 8).
6. Human-AR Interface
6.1. Design Principles
In contrast with VR environments or solely image-based environments, augmented reality operates as a layer within the space that a person occupies. Therefore, it is not as removed from the user as other approaches, and more care needs to be taken to ensure that proper design principles are accounted for. Olarnyk (2018) outlines three main tenants of designing an interface for AR: (Olarnyk, 2018)
• Intentionality for how the real and digital worlds interact
• Flexible immersion levels
• Interfaces beyond the screen
These three tenants encourage a design approach which carefully considers the interaction between a user's screen and their physical space. As interacting with objects through a camera can be awkward, it is important to decide which components should sit on the screen and which objects should be in the real-world space. Additionally, it is important for the screen not to be covered in components and controls as this limits a user's field of view. This project uses these three tenants as the basis for its design principles.
6.2. Interface Prototype
The initial interface for the prototype can be seen in Figure 6A. The application opens directly to the camera view and presents a user with a map preview and capture button. As previously described, pressing this capture button takes a photo using the camera and inserts it into the scene at a fixed distance from the camera position. As a user moves around the object, it can be seen that the image plane remains in place.
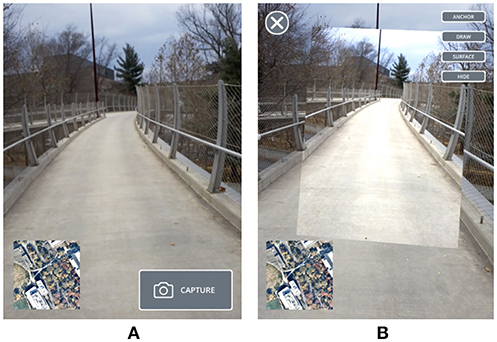
Figure 6. (A) Initial interface for the prototype showing the geographic map and capture button. (B) Second interface for the prototype showing what happens after a user takes an image.
Tapping the image opens the annotation editing tools. The second interface can be seen in Figure 6B. Using the anchor tool, the user can move the image plane to affix it to an object or surface. Figure 7 shows this approach. At first, since the captured image is located a distance away from the wall, a strong parallax effect can be observed as a user moves around the scene (Figure 7A). Using the anchor tool, a spot on the wall can be selected to attach the image plane. The image pyramid (Figure 7B) provides a visual hint for how this sizing is a result of the camera's perspective. After anchoring the annotation, it can be seen that it now aligns with the wall and can now be viewed from multiple angles and positions (Figures 7C,D).
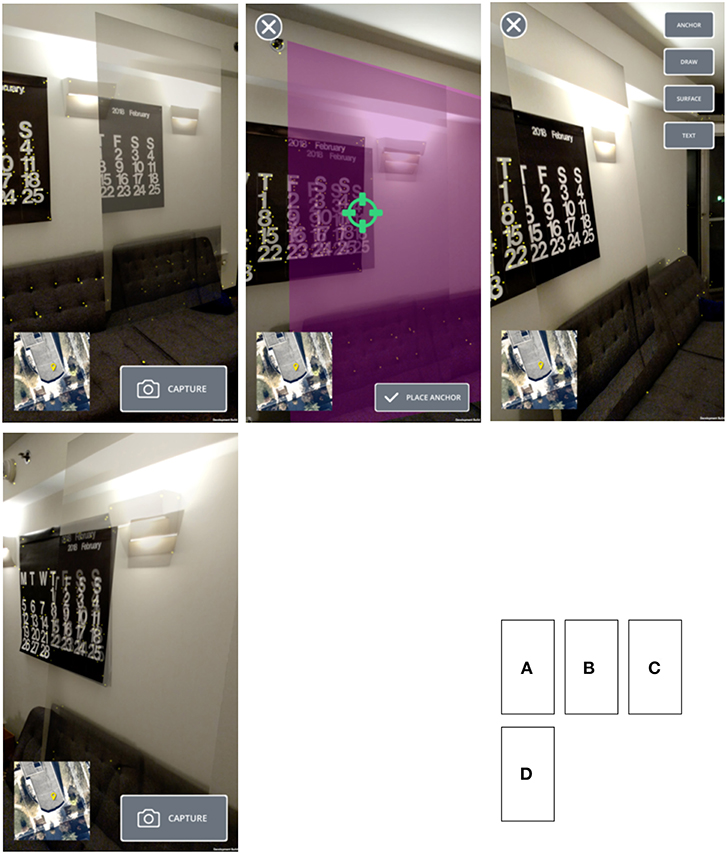
Figure 7. (A) Illustration of image in the AR environment after capture, (B) Image showing the crosshairs turning green indicating there is a spot on the point cloud for this to align to, (C) Image showing alignment of image and AR environment from left angle, (D) Image showing alignment of image and AR environment from right angle.
Next, a point cloud-based annotation can be taken with the “Surface” button (Figure 6B). The AR framework is able to reliably detect the surface, as shown by the yellow dots indicating the point cloud (Figure 8). Even though the initial image was captured from an angle to the left of the wall, a user can still draw flat on the wall itself and view this drawing from multiple angles. Returning to the original image, it can be seen that this annotation was projected back onto the image plane for later viewing on a computer.
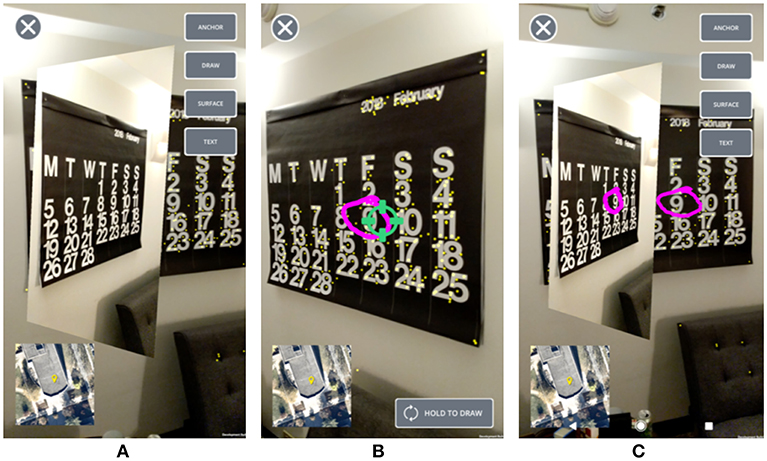
Figure 8. (A) Image projected into the scene, yellow dots represent the point cloud. (B) Surface tool being used to annotate on the point cloud. (C) Illustration of projection onto the image for off site viewing.
7. Application to Case Studies
With the conceptual design and implementation outlined, the prototype was applied to case studies in structural health monitoring and building pathology.
7.1. Structural Health Monitoring
There are five main tenants to SHM monitoring: (1) defining the SHM plan, (2) installing the SHM sensors, (3) maintaining the SHM system, (4) managing data and metadata associated with a system, and (5) closing out of the SHM system (if applicable) (Glisic and Inaudi, 2008). This prototype in particular is useful for the documentation, organization, and visualization of the data and metadata associated with SHM systems (tenant 3). As visualization of SHM data is commonly a “bottleneck” for disparate parties collaborating on a SHM system (Glisic and Inaudi, 2008), an application that facilitates organization of heterogenous data sets for both on and off site viewing is a critical undertaking. While this work presents a very early prototype using only drawing annotations, it provides an understanding into how combining image-based and point cloud-based annotations could fill a gap in existing methods for visualizing SHM sytems.
Streicker Bridge, a pedestrian bridge on Princeton University's campus, is comprised of a deck-stiffened arch and four continuous curved girders termed “legs” throughout this paper. Between 2009 and 2010, the bridge was outfitted with discrete Fiber Bragg-Grating (FBG) long-gauge sensors and distributed Brillouin Time Domain Analysis sensors (Sigurdardottir and Glisic, 2015). In addition to these fiber-optic sensors, the bridge is also outfitted with FBG-based sensors at the termination of the southeast leg (Reilly et al., 2017). More recently, the bridge was instrumented with several sensing sheets (Yao and Glisic, 2015). Figure 9 shows the typology and layout of the sensors in plan and in section (Abdel-Jaber, 2017; Napolitano et al., 2018a). In plan, the locations of the parallel sensors, prestressing tendon, sensing sheet, and the displacement sensor can be seen along the south section of the bridge. The cross section is taken at the location on the southeast leg with the sensing sheet.
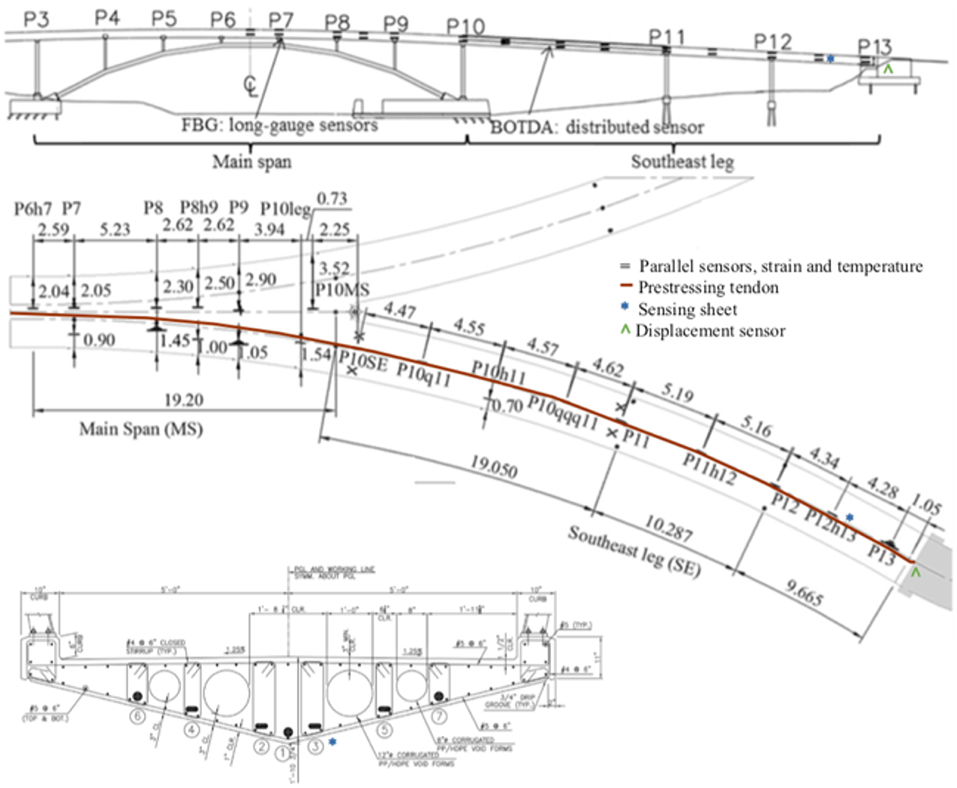
Figure 9. Location of sensors on Streicker Bridge in plan and in section.
Figure 10 illustrates the prototype being used to document and visualize part of this SHM system. The first panel shows the capturing interface being directed at the sensing sheets under the southeast leg of the bridge. In the second panel, the captured image of these sensors can be seen along with the annotation interface. The third panel shows a user utilizing the point cloud-based annotation. The yellow dots representing the point cloud can be seen in the image as well as the pink annotation. The last panel depicts the annotation not only on the point cloud but also projected back onto the image. As stated previously, the main impetus for capturing images is to serve as a low-cost and low-effort visualization system while off site. The ability for the annotations to be projected between the images and the point cloud lessens the amount of documentation a user would have to do to enable both on and off site viewing. Again, drawing is a the first prototype annotation technique. The same mechanisms for annotating the point cloud and projecting it back onto the images will be used in the future to support text annotations, supplemental graphics, as well as web-based links.
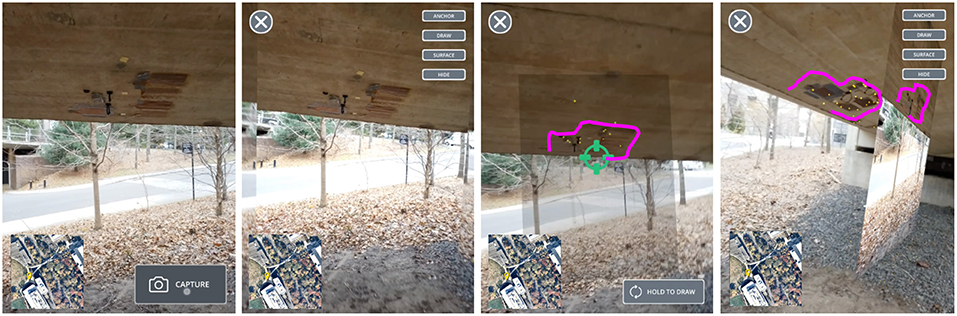
Figure 10. Screen shots of the application utilized for structural health monitoring. The first panel shows the initial capture scene, the second panel shows the annotation screen with the captured image, the third panel shows the annotation being taken on the point cloud, and fourth panel shows the annotation projected back onto the image for off site viewing.
This is only one example of how this method could be applied to SHM systems. As a user defines what information is to be overlaid and where, it is highly flexible for various applications. For example, information can be related to a very local scale (e.g., the position of sensors in cross-section), regional scale (e.g., the position of sensors in a structural element such as a beam or cable), or global scale (e.g., the position of sensors over entire structure).
7.2. Building Pathology
Similar to SHM, visualization and organization of heterogenous data sets is a crucial aspect of building pathology. Before a conservator can diagnose defects in existing buildings, proper documentation of how the building was constructed, how it has changed, how it has deteriorated are necessary. Similar to the SHM case study, this work provides an understanding into how combining image-based and point cloud-based annotations could fill a gap in existing methods in documentation for building pathology.
The name of this building has been withheld in accordance with Princeton University policy and will be referred to for the duration of the paper as “Building 1.” Building 1 is a historic structure on Princeton University's campus and is plagued with several conservation issues. Two of the most prominent issues are the growth of calcite and spalling of the stones. Figure 11 shows this damage to an arch on the structure prior to being replaced. This spalling is induced by poor drainage on the walkway above. As the drains are placed at a higher elevation than the rest of the walkway, the water tends to pond above the arch. This moisture, along with soluble deicing salts, penetrates into the stones and causes not only the growth of the calcite, but also the spalling of the stones. If a conservator wanted to document the effected area on this structure, they could use the prototype as indicated in Figure 12.
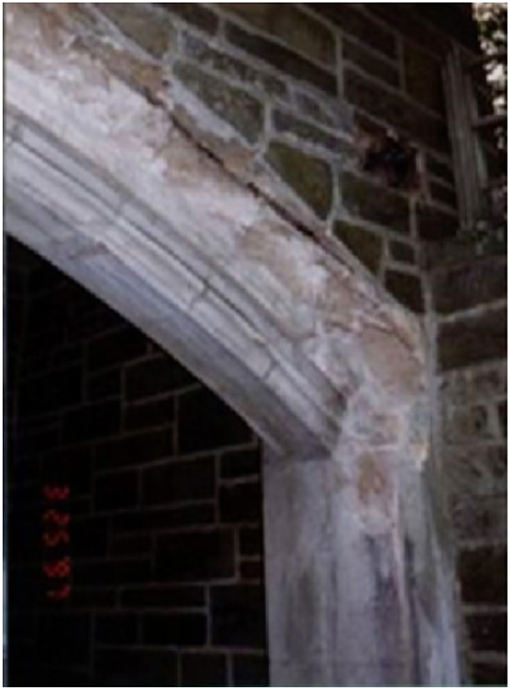
Figure 11. Effects of spalling and calcite growth on an arch on “Building 1.”
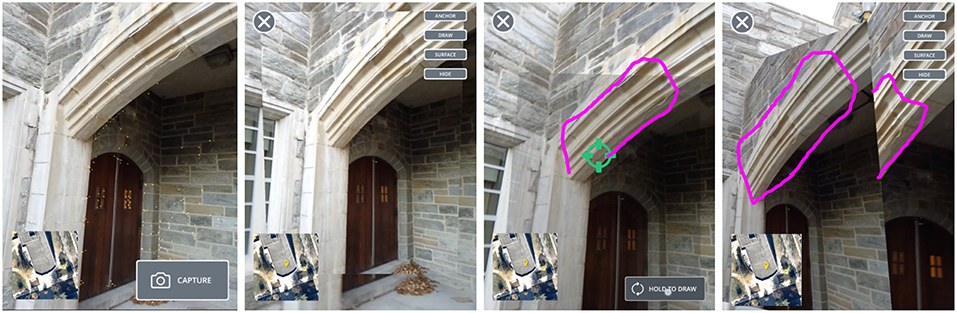
Figure 12. Screen shots of the application utilized for building pathology. The first panel shows the initial capture scene, the second panel shows the annotation screen with the captured image, the third panel shows the annotation being taken on the point cloud, and fourth panel shows the annotation projected back onto the image for off site viewing.
In the first panel, a user can see the initial interface augmenting the damaged environment. In the second screen, the captured image and the annotation options can be viewed. The third panel shows a user indicating the extent of the current damages and the fourth panel shows this annotation being projected back onto the captured image. This type of documentation can be used to measure the rate of change of the damage over time.
8. Evaluation of Prototype
To evaluate the performance of the GPS and AR location tracking, alignment testing was performed at Streicker Bridge. This testing was performed during the day under clear skies. A user started from the east, walked under the bridge, crossed a road, returned to the east end of the bridge, and crossed the bridge to the west before exiting to the north toward the adjacent buildings. Figure 13 shows the locations returned by both AR and GPS positioning and the final aligned result.
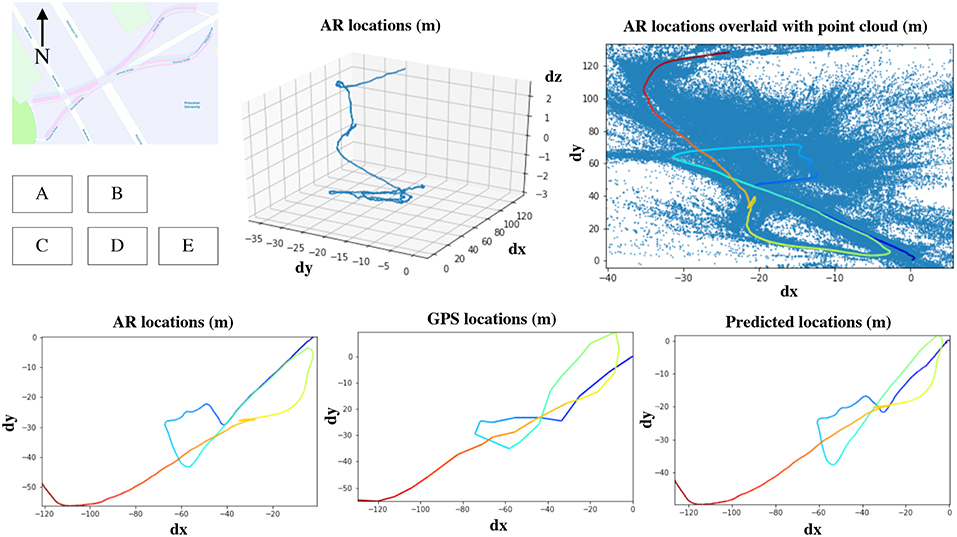
Figure 13. (A) 3D view of AR locations over the course of the user walking across the bridge, (B) AR locations overlaid on the point cloud, (C) AR locations projected into only x and y where color indicates time for comparison with other plots, (D) GPS locations, (E) predicted locations.
It can be seen that the AR-tracked position performs well at tracking when a user returns back to the same location. When the user walked back along the road to return to the end of the bridge, the AR position accurately retraces the original path. In comparison, the GPS locations wander significantly and it is not clear from the GPS trace that the same path was traversed. It can also be seen that during the time when the user was under the bridge, which is the loop in the middle, GPS accuracy and update rate is low. This shows a significant advantage of AR tracking as it is able to continue tracking even when there is no clear view of the sky. The final predicted output is skewed as a result of inaccurate GPS data, especially during the loop under the bridge. However, when Figure 14 is considered, it can be seen how the accuracy actually converges to the correct location over time as the user approaches the end of the path. This is most likely due to the fact that the Kalman filter builds accuracy over time.
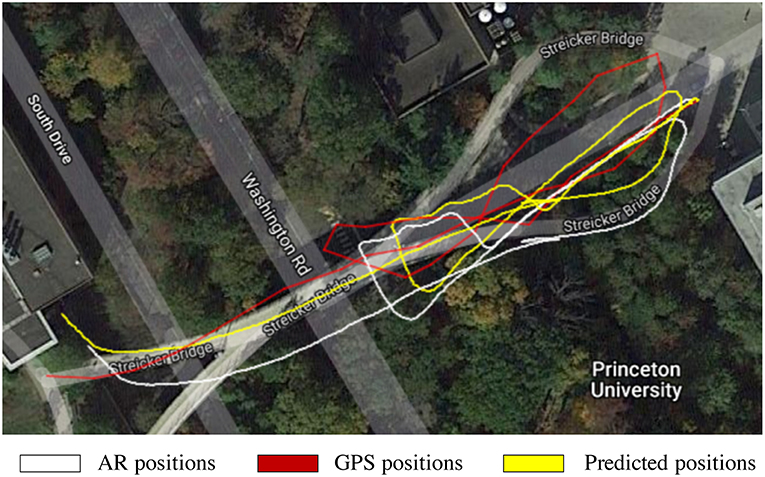
Figure 14. X and y positions of the user during the test according to AR, GPS, and predicted.
9. Conclusions and Future Work
This work outlines a novel framework for both on and off site documenting and viewing of infrastructure using a combination of image-based documentation and augmented reality. A cross-platform, client-server system for creating, saving, and viewing annotations was designed and implemented. The strengths and weaknesses of this implementation were addressed and the accuracy of the approach was evaluated. The findings of this work show the promise of using a combination of image-based an augmented reality as a useful framework for documenting the built environment. This work represents a prototype platform for data and metadata visualization, i.e., it includes the proof of concept in controlled settings. Application of this method was described for case studies in structural health monitoring and building pathology.
Although a user's position was able to be determined to a reasonable degree of precision, the current localization approach is still limited in its ability to accurately relocalize a user across sessions. GPS data is subject to both random noise and systematic error, so the resulting alignment offset between sessions may be insufficiently accurate. One promising future approach could be to leverage the point cloud data collected to build a rough, server-side 3D model of the scene. When a separate session is started, the point cloud data from this second session can then be compared with the one from the first to determine their offset. Techniques designed for point cloud registration could prove successful in this area.
An additional limitation of this method was the use of 2D images for off site viewing. As addressed above, multiple 2D images often cannot efficiently describe complex geometries. While this work mainly was to explore frameworks for on and off site use, this limitation will be the subject of a future work. Future iterations include using the point cloud from AR to generate rudimentary 3D shapes. Then these shapes can be used with a similar projection mechanism so that a user does not have to duplicate their work for on and off site usability.
Author Contributions
The original idea was RN. Preliminary implementation of the code and an initial write up were carried out by ZL under the mentorship of RN and BG. Continuation of the code was carried out by CS under the mentorship of RN and BG. Finalization of the code and case studies were carried out by RN. The write up of the article was done by RN.
Funding
This work was supported by the Department of Civil and Environmental Engineering, the Council on Science and Technology, the Dean's Fund for Innovation, and the School of Engineering and Applied Sciences at Princeton. This material is based upon work supported by the National Science Foundation Graduate Research Fellowship Program under Grants No. DGE-1656466. Any opinions, findings and conclusions or recommendations expressed in this material are those of the authors and do not necessarily reflect the views of the National Science Foundation. Opinions, findings, and conclusions from this study are those of the authors and do not necessarily reflect the opinions of the research sponsors. Additionally, this work was supported by the USDOT UTC Program (Grant no. CAIT-UTC-REG13/0615) enabled through the Center for Advanced Infrastructure and Transportation (CAIT) at Rutgers University.
Conflict of Interest Statement
The authors declare that the research was conducted in the absence of any commercial or financial relationships that could be construed as a potential conflict of interest.
Acknowledgments
We are thankful for fruitful conversations with Anna Blyth, Wesley Reinhart, and Abigail Rettew.
References
Abdel-Jaber, H. (2017). Comprehensive strain-based methods for monitoring prestressed concrete beam-like elements. Dissertation, Princeton University.
American Society of Civil Engineers (2017). Asce's 2017 Infrastructure Report Card. Available online at: https://www.infrastructurereportcard.org/ (accessed January 15, 2018)
Arayici, Y., Counsell, J., Mahdjoubi, L., Nagy, G. A., Dweidar, K., and Hawas, S. (2017). Heritage Building Information Modelling. Taylor & Francis.
Atwood, J. (2008). Understanding Model-View-Controller. Available online at: https://blog.codinghorror.com/understanding-model-view-controller/ (accessed January 15, 2018)
Bae, H., Golparvar-Fard, M., and White, J. (2013). High-precision vision-based mobile augmented reality system for context-aware architectural, engineering, construction and facility management (aec/fm) applications. Visual. Eng. 1:3. doi: 10.1186/2213-7459-1-3
Ballor, J. P., McClain, O. L., Mellor, M. A., Cattaneo, A., Harden, T. A., Shelton, P., et al. (2019). “Augmented reality for next generation infrastructure inspections,” in Model Validation and Uncertainty Quantification, Volume 3 (Springer), 185–192.
Bleck, B. M., Katko, B. J., Trujillo, J. B., Harden, T. A., Farrar, C. R., Wysong, A. R., et al. (2017). Augmented Reality Tools for the Development of Smart Nuclear Facilities. Technical report, Los Alamos National Lab. (LANL), Los Alamos, NM.
Brilakis, I., Lourakis, M., Sacks, R., Savarese, S., Christodoulou, S., Teizer, J., et al. (2010). Toward automated generation of parametric bims based on hybrid video and laser scanning data. Adv. Eng. Informatics 24, 456–465. doi: 10.1016/j.aei.2010.06.006
Broll, W., Lindt, I., Ohlenburg, J., Wittkämper, M., Yuan, C., Novotny, T., et al. (2004). Arthur: A collaborative augmented environment for architectural design and urban planning. J. Virtual Reality Broadcast. 1. doi: 10.20385/1860-2037/1.2004.1
Bruno, S., De Fino, M., and Fatiguso, F. (2018). Historic building information modelling: performance assessment for diagnosis-aided information modelling and management. Autom. Construct. 86, 256–276. doi: 10.1016/j.autcon.2017.11.009
Canary Systems (2015). Mlweb Internet Web Client. Available online at: http://canarysystems.com/software/mlweb-internet-web-client-2/ (accessed January, 2018)
Chang, P. C., Flatau, A., and Liu, S. (2003). Health monitoring of civil infrastructure. Struct. Health Monit. 2, 257–267. doi: 10.1177/1475921703036169
Chi, H.-L., Kang, S.-C., and Wang, X. (2013). Research trends and opportunities of augmented reality applications in architecture, engineering, and construction. Autom. Construct. 33, 116–122. doi: 10.1016/j.autcon.2012.12.017
Colombo, A., and Bittencourt, T. (2016). “Chapter: Development of web interface for structural health monitoring data visualization and structural performance assessment,” in Maintenance, Monitoring, Safety, Risk, and Resilience of Bridges and Bridge Networks, eds Bittencourt T, Frangopol D, Beck A (London: CRC Press).
Data Monitoring Systems Limited (2015). End to End data Management and Web Presentation. Available online at: https://datum-group.com/products/platform-interactive/ (accessed January 15, 2018)
DiGiampaolo, E., DiCarlofelice, A., and Gregori, A. (2017). An rfid-enabled wireless strain gauge sensor for static and dynamic structural monitoring. IEEE Sens. J 17, 286–294. doi: 10.1109/JSEN.2016.2631259
Glisic, B., and Inaudi, D. (2008). Fibre Optic Methods for Structural Health Monitoring. John Wiley & Sons.
Glisic, B., Yarnold, M. T., Moon, F. L., and Aktan, A. E. (2014). Advanced visualization and accessibility to heterogeneous monitoring data. Comput. Aided Civil Infrastruct. Eng. 29, 382–398. doi: 10.1111/mice.12060
Henderson, S., and Feiner, S. (2011). Exploring the benefits of augmented reality documentation for maintenance and repair. IEEE Trans. Visual. Comput. Graph. 17, 1355–1368. doi: 10.1109/TVCG.2010.245
Jafari, B., Khaloo, A., and Lattanzi, D. (2016). “Long-term monitoring of structures through point cloud analysis,” in Health Monitoring of Structural and Biological Systems 2016 (International Society for Optics and Photonics), 98052K.
Kamat, V. R., and El-Tawil, S. (2007). Evaluation of augmented reality for rapid assessment of earthquake-induced building damage. J. Comput. Civil Eng. 21, 303–310. doi: 10.1061/(ASCE)0887-3801(2007)21:5(303)
Loh, K. J., Hou, T.-C., Lynch, J. P., and Kotov, N. A. (2009). Carbon nanotube sensing skins for spatial strain and impact damage identification. J. Nondestruct. Eval. 28, 9–25. doi: 10.1007/s10921-009-0043-y
Martinez-Aires, M. D., Lopez-Alonso, M., and Martinez-Rojas, M. (2018). Building information modeling and safety management: a systematic review. Saf. Sci. 101, 11–18. doi: 10.1016/j.ssci.2017.08.015
Morales Garcia, J. E., Gertsen, H. J., Liao, A. S. N., and Mascarenas, D. D. L. (2017). Augmented Reality for Smart Infrastructure Inspection. Technical report, Los Alamos National Lab. (LANL), Los Alamos, NM. (United States).
Napolitano, R., Blyth, A., and Glisic, B. (2017a). “Virtual environments for structural health monitoring,” in Structural Health Monitoring 2017, (shm).
Napolitano, R., Blyth, A., and Glisic, B. (2018a). Virtual environments for visualizing structural health monitoring sensor networks, data, and metadata. Sensors 18:243. doi: 10.3390/s18010243
Napolitano, R., Douglas, I., Garlock, M., and Glisic, B. (2017b). “Virtual tour environment of cuba's national school of art,” ISPRS-International Archives of the Photogrammetry, Remote Sensing and Spatial Information Sciences, 547–551.
Napolitano, R. K., and Glisic, B. (2018). Minimizing the adverse effects of bias and low repeatability precision in photogrammetry software through statistical analysis. J. Cult. Heritage 31, 46–52. doi: 10.1016/j.culher.2017.11.005
Napolitano, R. K., Scherer, G., and Glisic, B. (2018b). Virtual tours and informational modeling for conservation of cultural heritage sites. J. Cult. Heritage 29, 123–129. doi: 10.1016/j.culher.2017.08.007
Olarnyk, A. (2018). Designing for Augmented Reality. Available online at: https://blog.prototypr.io/designing-for-ar-b276c8251c20 (accessed January 15, 2018)
Park, H., Lee, H., Adeli, H., and Lee, I. (2007). A new approach for health monitoring of structures: terrestrial laser scanning. Comput. Aided Civil Infrastruct. Eng. 22, 19–30. doi: 10.1111/j.1467-8667.2006.00466.x
Puente, I., Solla, M., González-Jorge, H., and Arias, P. (2013). Ndt documentation and evaluation of the roman bridge of lugo using gpr and mobile and static lidar. J. Perform. Construct. Facilit. 29:06014004. doi: 10.1061/(ASCE)CF.1943-5509.0000531
Qarib, H., and Adeli, H. (2014). Recent advances in health monitoring of civil structures. Sci. Iran. 21, 1733–1742.
Reilly, J., Abdel-Jaber, H., Yarnold, M., and Glisic, B. (2017). “Evaluating the coefficient of thermal expansion using time periods of minimal thermal gradient for a temperature driven structural health monitoring,” in Nondestructive Characterization and Monitoring of Advanced Materials, Aerospace, and Civil Infrastructure 2017 (International Society for Optics and Photonics), 1016929.
Sabra, K. G., Srivastava, A., Lanza di Scalea, F., Bartoli, I., Rizzo, P., and Conti, S. (2008). Structural health monitoring by extraction of coherent guided waves from diffuse fields. J. Acoust. Soc. Am. 123, EL8–EL13. doi: 10.1121/1.2820800
Sacks, R., Kedar, A., Borrmann, A., Ma, L., Brilakis, I., Hüthwohl, P., et al. (2018). Seebridge as next generation bridge inspection: overview, information delivery manual and model view definition. Autom. Construct. 90, 134–145. doi: 10.1016/j.autcon.2018.02.033
Shin, D. H., and Dunston, P. S. (2009). Evaluation of augmented reality in steel column inspection. Autom. Construct. 18, 118–129. doi: 10.1016/j.autcon.2008.05.007
Shin, D. H., and Dunston, P. S. (2010). Technology development needs for advancing augmented reality-based inspection. Autom. Construct. 19, 169–182. doi: 10.1016/j.autcon.2009.11.001
Sigurdardottir, D., and Glisic, B. (2015). On-site validation of fiber-optic methods for structural health monitoring: Streicker bridge. J. Civil Struct. Health Monit. 5, 529–549. doi: 10.1007/s13349-015-0123-x
Smartec (2017). Diview Software. Available online at: https://smartec.ch/en/product/diview-software/ (accessed January 15, 2018)
Theiler, M., Dragos, K., and Smarsly, K. (2018). “Semantic description of structural health monitoring algorithms using building information modeling,” in Workshop of the European Group for Intelligent Computing in Engineering (Springer), 150–170.
Thomas, B., Piekarski, W., and Gunther, B. (1999). Using augmented reality to visualise architecture designs in an outdoor environment. Int. J. Design Comput. Spec. Issue. Design Comput. Net 1, 1–8.
Urbanová, P., Hejna, P., and Jurda, M. (2015). Testing photogrammetry-based techniques for three-dimensional surface documentation in forensic pathology. Forens. Sci. Int. 250, 77–86. doi: 10.1016/j.forsciint.2015.03.005
Wang, X., Love, P. E., Kim, M. J., Park, C.-S., Sing, C.-P., and Hou, L. (2013). A conceptual framework for integrating building information modeling with augmented reality. Autom. Construct. 34, 37–44. doi: 10.1016/j.autcon.2012.10.012
Webster, A., Feiner, S., MacIntyre, B., Massie, W., and Krueger, T. (1996). “Augmented reality in architectural construction, inspection and renovation,” in Proc. ASCE Third Congress on Computing in Civil Engineering, volume 1, 996.
Yao, J., Tjuatja, S., and Huang, H. (2015). Real-time vibratory strain sensing using passive wireless antenna sensor. IEEE Sens. J. 15, 4338–4345. doi: 10.1109/JSEN.2015.2416672
Yao, Y., and Glisic, B. (2015). Detection of steel fatigue cracks with strain sensing sheets based on large area electronics. Sensors 15, 8088–8108. doi: 10.3390/s150408088
Zonta, D., Chiappini, A., Chiasera, A., Ferrari, M., Pozzi, M., Battisti, L., and Benedetti, M. (2009). “Photonic crystals for monitoring fatigue phenomena in steel structures,” in Sensors and Smart Structures Technologies for Civil, Mechanical, and Aerospace Systems 2009 (International Society for Optics and Photonics), 729215.
Keywords: augmented reality, structural health monitoring, human machine interface, virtual reality, point cloud, building pathology
Citation: Napolitano R, Liu Z, Sun C and Glisic B (2019) Combination of Image-Based Documentation and Augmented Reality for Structural Health Monitoring and Building Pathology. Front. Built Environ. 5:50. doi: 10.3389/fbuil.2019.00050
Received: 19 December 2018; Accepted: 01 April 2019;
Published: 17 April 2019.
Edited by:
David Mascarenas, Los Alamos National Laboratory (DOE), United StatesReviewed by:
Youngjib Ham, Texas A&M University, United StatesKe Chen, The University of Hong Kong, Hong Kong
Copyright © 2019 Napolitano, Liu, Sun and Glisic. This is an open-access article distributed under the terms of the Creative Commons Attribution License (CC BY). The use, distribution or reproduction in other forums is permitted, provided the original author(s) and the copyright owner(s) are credited and that the original publication in this journal is cited, in accordance with accepted academic practice. No use, distribution or reproduction is permitted which does not comply with these terms.
*Correspondence: Rebecca Napolitano, cmtuMkBwcmluY2V0b24uZWR1