 Martijn Schildkamp
 Yoshikazu Araki
- 1Smart Shelter Research, Alphen aan den Rijn, Netherlands
- 2Graduate School of Environmental Studies, Nagoya University, Nagoya, Japan
This paper analyzes the cost breakdown of earthquake resistant schools in Kaski District of Nepal, as built by Smart Shelter Foundation (SSF). Three types of designs are compared, which are rubble stone masonry with a wooden roof structure, and concrete block masonry with either a wooden roof or with a steel trussed roof. An in-depth cost analysis and cost comparison was carried out, based on a unique collection of local building prices from 19 different villages, as well as generally applicable District Rates, all spanning a period of 10 years between 2007 and 2017. Master Estimates were divided into the 5 main building phases of foundation, walls, roof, floor and finishing, and then further broken down into local costs for materials, labor, and transportation. These cost comparisons give a detailed insight in the distribution of the costs, the pricing of individual materials and construction elements, the effect of price fluctuation on the total costs, and the cost implications of different solutions for seismic measures. It is concluded that the market prices, especially of locally sourced materials, fluctuate too much, making it impossible to detect useful patterns for general application or future predictions. Also, no similarities were found between the local village rates vs. the general District Rates, which insufficiently reflect variations at the micro level, such as availability of materials, site accessibility, or local preferences. To address these issues, the paper introduces a helpful tool for rapid cost estimation of different school designs. The last chapter analyzes the price implications of adding or removing certain seismic features. It concludes that improving masonry with cement mortar has the highest cost impact, but that inclusion of important seismic features such as horizontal bands, buttresses, and steel bars is not that expensive, meaning there is basically no financial obstacle to incorporate these in new constructions of schools and houses. However, all interventions require in-depth technical and scientific validation, for which the authors have started an initiative named SMARTnet. The paper ends with an appeal to experts and academics worldwide, to exchange their knowledge and to support the project with their time and expertise.
Introduction
Between 2007 and 2012 the Dutch non-for-profit organization Smart Shelter Foundation (SSF), together with local partner SEED Foundation, executed building projects in 19 villages in Kaski District of Nepal. This included the construction of 15 earthquake resistant schools in two techniques, being locally harvested rubble stones from the mountains (Schildkamp, 2015a) and cast hollow concrete blocks (Schildkamp, 2015b). The designs were developed by SSF, following general rules of thumb from available technical literature and practical manuals. After completion of the designs, six different local Nepalese engineers were invited to make a cost estimate. Without exception, they returned a one-page estimation of the main elements, but for reinforced concrete frame buildings with columns and beams. It turned out that none of the engineers had experience with making estimates for local types of loadbearing masonry buildings with stones or blocks. Most peculiar was the fact that no difference was made between schools at different locations. Following general District Rates (DR) that apply to the whole Kaski District, the engineers prepared exactly the same estimation for 5 classrooms near Pokhara city, as for 5 classrooms in a remote mountain village. This is not realistic, as the costs for certain materials are much higher in the mountains due to higher costs for transportation and carrying these to the site.
Therefore, SSF decided to prepare the estimates for each village themselves, based on local rates for materials, labor, and transport. This has resulted in a unique collection of local building prices spanning a period of more than 10 years, which is now analyzed in this paper, in order to provide answers to the following questions:
(i) Which materials or construction phases have the biggest impact on the overall costing?
(ii) Which technique is most economical; Rubble stone masonry or concrete block masonry?
(iii) What are the cost implications of alternatives and different solutions for foundation, walls, and roofing system?
(iv) Did the material and construction costs rise steeply after the 2015 Gorkha Earthquakes?
(v) And most interestingly: What is the cost difference between a traditional unreinforced school building, and a fully reinforced design with the addition of seismic reinforcing features?
The following methodology was followed. Sets of Master Designs for school buildings were prepared with similar dimensions, for fair comparison of the building features, construction elements, and separate materials. Sets of Master Estimates were prepared with consideration of the local contextual situation, based on local material prices and labor wages as collected in the 19 different villages in different time frames. These were further compared with the general District Rates of Kaski, for compatibility and applicability, and to detect generalities for the cost distribution and total average costs. Also, an in-depth cost analysis for the main construction elements and seismic features of the school buildings was carried out, resulting in a useful break-down of material quantities for standard school designs.
The analyses were done explicitly for the designs as built by SSF in Kaski District, which can be described as “Nominally Reinforced Masonry” or “Masonry Strengthened with Ties” (Schildkamp and Araki, 2019). Other masonry types, for instance Reinforced Masonry or Confined Masonry, are left out of this analysis for various reasons. They are not used in the hill areas of Nepal, and therefore the price of certain materials, for instance bricks, are not known in the villages. Also, structurally these techniques behave differently in earthquakes, possibly making the comparisons unfair. As a final note it is important to stress that this paper exclusively analyzes the costs and cost implications of certain interventions. It gives no indication nor opinion about which wall type or masonry system performs better during a seismic event.
Literature Review
Prior to all analyses and calculations, a literature review on the subject of construction costs in seismically-prone developing countries was carried out. The review revealed that only limited data is available, of which the majority is focusing on the costing of reinforced concrete frames, such as in India (Thiruvengadam et al., 2004) and Nepal (Subedi et al., 2016). Some literature focuses on the comparison of retrofitting solutions, such as in Bangladesh (Roy et al., 2013) and Iran (Jafarzadeh et al., 2015).
Only three references were found for unreinforced masonry (URM) with stones, bricks, or blocks. For use in seismic areas, Arya (1970) explains that such constructions can be much improved by introducing vertical steel bars at corners and junctions of walls, and reinforced concrete bands at lintel level of all stories. He further states that “these provisions have been found to cost about 4 to 8 percent of the cost of buildings in areas with moderate seismic activity,” although it is not mentioned for which country or region these figures apply. With regards to houses in Anatolia in Turkey, Spence and Coburn (1987) describe that 'a program to encourage stronger housing construction should be aimed at both the builder, who constructs the building, and the house owner, who pays for the building (…). The most important aspect of advocating measures to strengthen buildings is, however, the cost of doing so'. For their cost comparison they make a difference between (i) local materials (freely available if collected) such as stones and mud, (ii) market materials (cash cost) such as concrete, brick and steel works, and (iii) labor (free for local materials, paid for market materials). Transportation costs of the materials are not included. They calculate that upgrading of a medium quality traditional house costs an additional 9% for adding 1 horizontal reinforced concrete band, and that further inclusion of horizontal steel bars in the masonry joints, plus upgrading of the foundation adds a total of 28%. The third mention is made by Hausler (2004) after the 2001 Gujarat Earthquake in India, who compares the costing of a 300 square foot unreinforced brick masonry house in mud mortar, with a cement mortared brick masonry house added with horizontal bands and vertical steel reinforcements. The additional costs are +45% (from 2.67 to 3.89$/sq.ft), although numbers and dimensions of the reinforcements are not specified. However, these references are 50, 30, and 15 years old, respectively. No recent costing data was found, and neither any detailed comparisons of all the construction elements and building materials separately.
A secondary literature review was carried out to investigate the general assumption that after a big natural disaster, construction prices “shoot up” (Sustainable Safety Solutions, 2016) due to shortages of materials coupled to high demand, with reports of prices that “doubled overnight” from 25$/sq.ft to 50$/sq.ft, and then rapidly more than tripled to 80$/sq.ft (The Awkward Pose, 2012). However, hardly any literature nor data was found on this subject, besides the following limited mentions. One year after the 2004 Tsunami, construction costs per square foot for a simple house went up with 67%, from 7.74 to 12.90$/sq.ft, in Banda Aceh (Indonesia), mostly due to rising of labor and timber prices (Jayasuriya and McCawley, 2008). In Sri Lanka the increase for reconstruction of houses ranged between 30 and 50% after 8 months toward 60–80% a year later (Ruddock et al., 2010), due to hikes of material prices and shortages of labor. Interestingly, the construction costs in Thailand decreased in 2005, as the hit areas had close access to materials in Bangkok, and more importantly, because a large workforce was available due to high levels of unemployment at the time (Nidhiprabha, 2007). Regarding the post-earthquake situation in Haiti only two references were found. One organization initially reported a hike in their estimations of 131% (29$ to 67$/sq.ft) between 2010 and 2012, but this figure was revised to 86% for actually built houses (at 54$/sq.ft) in 2014 in the north-western part of Haiti (GOA-15-517, 2015), which is in line with the figures of a second organization who built permanent houses at a rate of 53$/sq.ft in 2012 (GFDRR, 2016).
Shortly after the 2015 Gorkha Earthquake immediate shortages of materials were expected in Nepal due to the heavy damage in the country. Just 3 months after the earthquake the Nepali government put a temporary ban on construction, to develop reconstruction regulations and approval guidelines. This ban was followed by a 3-month blockade of petrol, goods and materials, caused by a general political strike. As a result, increases of 40% were expected mostly for steel, sand and aggregates, but not so much for cement of which enough supply seemed available (The Himalayan Times, 2015). This is confirmed by a report of Amnesty International (2017), who documented rates of key material prices for a 2-year period and concluded that the cement prices had actually slightly decreased. They further reported that after 20 months, the price of aggregates doubled from 1,000 to 2,000 Nepali Rupee (NRS), and sand prices tripled from 500 NRS to 1,500 NRS per m3. However, effects of these individual price hikes on the overall costing were not reported. On the national level, the predicted costs for reconstruction in Nepal were calculated based on the 2011 Census building figures (National Planning Commission, 2015a). The indicative costs per sq.ft of plinth area for cement-based masonry was increased with 25% from 1,200 NRS (10.60$) in 2011 to 1500 NRS (13.25$) in 2015 (conversions per xe.com, December 2018).1 This figure is taken as a reference point for the post-earthquake cost analysis further on.
Preparing of Master Designs and Master Estimates
New sets of Master Designs were prepared of school buildings in different techniques, but all with the same dimensions in order to make fair comparisons between these techniques and between their separate elements. Based on these designs, Master Estimates were prepared which are divided in five main building phases, being (a) foundation, (b) walls, (c) roof, (d) floor, and (e) finishing of the building. Each phase is then further subdivided in three main cost categories, which are (i) materials, (ii) labor, and (iii) transport.
Master Designs
Figures 1A–F describe the standard designs as used for the cost comparisons. Although Nepal has officially adopted the Metric System (Government of Nepal, 1968), most villages still use the Imperial System and therefore the drawings, units and calculations in this paper are expressed in feet (′) and inches (″), with conversions according to the SI metric system, such as meter (m) and millimeter (mm).
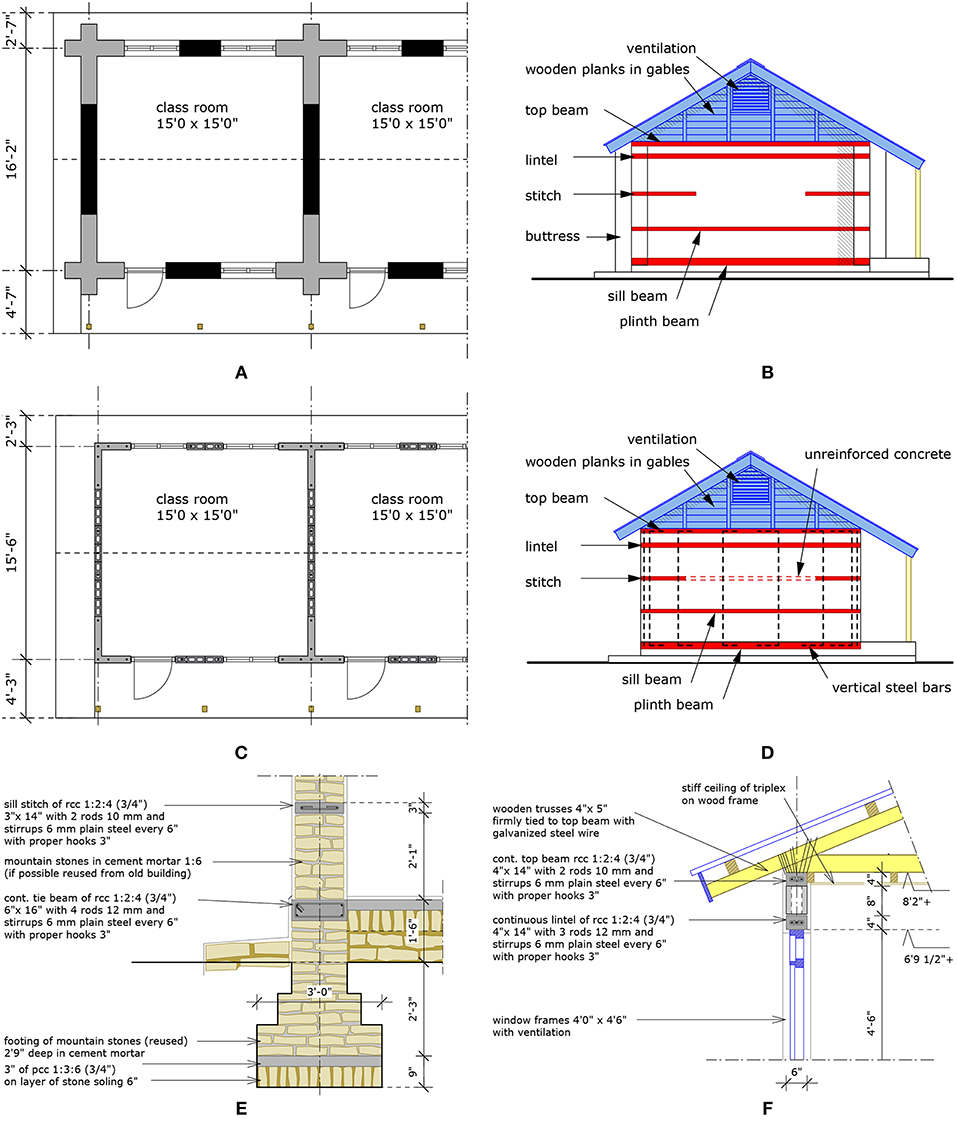
Figure 1. (A,B) School plan and side elevation with horizontal reinforcements and buttresses, in rubble stone masonry. (C,D) School plan and side elevation with horizontal reinforcements and vertical steel bars, in concrete block masonry. (E) Detail of foundation, floor and wall in rubble stone masonry, and (F) Detail of window, wall, and roof in concrete block masonry [all by courtesy of Smart Shelter Foundation (SSF)].
The classrooms have an interior floor plan of 15 × 15ft (4.6 × 4.6 m) and a wall height of 8′2″ (2.5 m), as this corresponds with the height of 10 concrete blocks plus joints, plus thicknesses of the necessary horizontal beams and bands. In general, Kaski District has firm rock soil and both designs include a foundation of 3′0″ (0.9 m) deep and wide, consisting of a stepped strip foundation in rubble stone masonry with cement-sand mortar, placed on a bed of stone soling with a layer of plain cement concrete, topped with a reinforced concrete plinth beam, Figure 1E.
The walls are either 14″ (350 mm) thick rubble stone, or 6″ (150 mm) thick hollow concrete blocks, both in cement-sand mortar. Only the rubble stone walls have buttresses at all wall ends. The opening dimensions for both types depend on the fixed size of the concrete blocks, resulting in door frames of 3′2″ × 6′10″ (0.95 × 2.10 m) and window frames of 4′0″ × 4′6″ (1.20 × 1.35 m). All frames and shutters are made from a local type of hardwood named Sal.
The walls are tied together with horizontal bands made of reinforced concrete, at five different levels in height, being foundation beam, sill band, in-between stitches, lintel beam, and top beam (Figures 1B,D).
The concrete block walls include vertical steel bars in all corners, t-sections and next to openings, in order to prevent shear cracking. However, in the thick massive rubble stone walls these vertical elements are excluded, as it is reasoned that the limited amount of steel will not provide the desired amount of ductility. Also, vertical elements may disrupt the masonry bonding in these critical connections, possibly making these connections weaker rather than stronger. It must be noted that this remains to be a highly debated topic of discussion among experts (Schildkamp and Araki, 2019).
Heavy masonry gables, even with a gable band, have the risk of toppling during an earthquake. To avoid this, the stone gables are replaced by wooden trusses at all interior and end walls, and then boarded up with wooden planks. Further trusses are placed at intermediate points, these are inter-connected with purlins and cross-bracing elements, and a stiff ceiling is placed underneath. This way the roof structure acts as one, thus enhancing the box action of the building. In some cases however, the villagers preferred hollow steel tubes instead of wooden truss members. These roofs have no ceiling but have steel cross-bracing in the total length of the roof and ceiling planes, and the gables are finished with tin sheets.
To guarantee a high construction quality, much emphasis was put on the training and supervision of the local laborers during the construction processes, following the practical principles as described in Schildkamp (2015c). A main focus was on the use of correct materials, proper mixing of mortars and concretes, and detailing of steel reinforcements.
Local Material Constants
Each main phase is divided in its separate building elements, for which length, area, and volume are measured and calculated in feet (′), inches (″), square feet (sq.ft), or cubic feet (cft). All elements are further split into separate materials, each expressed in a certain amount or ratio, per certain unit. For instance, concretes and mortars are proportionally mixed in specified ratios of cement, sand, and/or aggregates. All these proportions are called Material Constants and can be found in tables and annexes of construction manuals such as quantity surveyor guides (Joglekar, 1997), Indian Standard IS:10067-1982 (2005) or the Nepali DoLIDAR Norms (Office of District Development Committee, 2007). This governmental document is often used for civil or housing projects in the rural areas of Nepal and was therefore leading for the preparation of the estimates. Note that Nepal uses the Vikram Samvat calendar, which is 57 years ahead of the commonly used Gregorian calendar, meaning that the Nepali year 2063/2064 resembles the Gregorian year 2006/2007. The DoLIDAR Norms first had to be converted to the Imperial system and then further into local units, added with certain local customs, as follows:
Locally sourced materials such as sands and aggregates are hauled from the river to the building site in old cement bags. One 50 kg cement bag is equal to 1.18 cft and all volumetric mixtures for mortars and concretes can be converted to numbers of bags for each material. As an example, 1 m3 of concrete mix in the ratio of 1:2:4(3/4″) contains 320 kg cement, 0.45 m3 rough sand and 0.85 m3 aggregates. In the mountain areas, for every 100 cft (2.83 m3) this translates to 18.11 bags cement, 38.11 bags of sand and 71.95 bags of aggregates.
In Kaski District the mountain stones are expressed in a locally used volumetric measurement called “chhatta.” The dimensions are based on a number of underarm lengths, which after long discussions with (mostly older) villagers was set at 15 × 4.5 × 4.5 ft, or 303.75 cft (8.6 m3). Only one reference to this unit was found in literature about forestry, describing the chatta (with one 'h') as a stack volume of fuelwood of 20 × 5 × 5ft, or 500 cft (14.2 m3) (Subedi et al., 2014). However, SSF did not receive any negative comments or feedback on the calculations of stone quantities, and therefore 1 m3 of rubble stone masonry in 1:6 cement-sand mortar mix converts to 6.00 bags of cement, 39.83 bags of sand and 0.33 chhatta of stones, for every 100 cft.
The concrete block dimensions are 15.5″ × 8″ × 6″ (395 × 200 × 150 mm) and the walls are 10 blocks high. A deal was made with a concrete block factory, offering 5 Nepali Rupee (NRS) more per block if they promised to put in the correct amount of cement. Generally, block making factories reduce the amount of cement to create competitive prices, resulting in inferior blocks everywhere.
The total needed lengths of steel bars for reinforcements are measured and then multiplied by the number of bars per beam or element, added with extra lengths for splicing, overlapping, and hooks. In 2007 there was no 6 mm plain steel for stirrups available in the markets, and 7 mm deformed rebar was used instead. Steel quantities are expressed per kilo or per quintal (100 kg).
In the hill areas, Sal hardwood generally comes from the community forest of the villages and is therefore considered to be free of cost. Sal wood is used for the trusses and purlins in the roof, for finishing of gables and valance boards, and for door and window frames and shutters. It is usually calculated as a milling fee per cft, added with transport costs to and from the mill.
For cement, sand, aggregates and mountain stones 10% of wastage is added, for instance for spillage, mixing in wrong proportions, or drying out of a freshly mixed batch. For all wood and steel works 10% extra is added for cutting wastage, and also 10% is added to the number of concrete blocks to compensate for breakage.
Labor Output Constants
The amount of work turned out by labor, known as Labor Constants, are an indication of the average timing of a certain construction activity, expressed in daily or hourly wages. These constants can be divided in unskilled activities such as digging, hauling and mixing, as well as rates for skilled masons, carpenters, bar benders, steel welders, and painters. According to Cartlidge (2009) the labor output is the most uncertain variable of an estimate, as it highly depends on the complexity of the project, skills of the work force, the organization of the building site and weather conditions. As a guideline the Indian Standard IS:7272-1974. (2005) was used, which covers the Indian State of Uttar Pradesh, directly neighboring Nepal. However, after execution of the first four schools in Nepal in 2007, these values were found to be too high and had to be revised, resulting in the following Labor Outputs for the Master Estimates, Table 1.
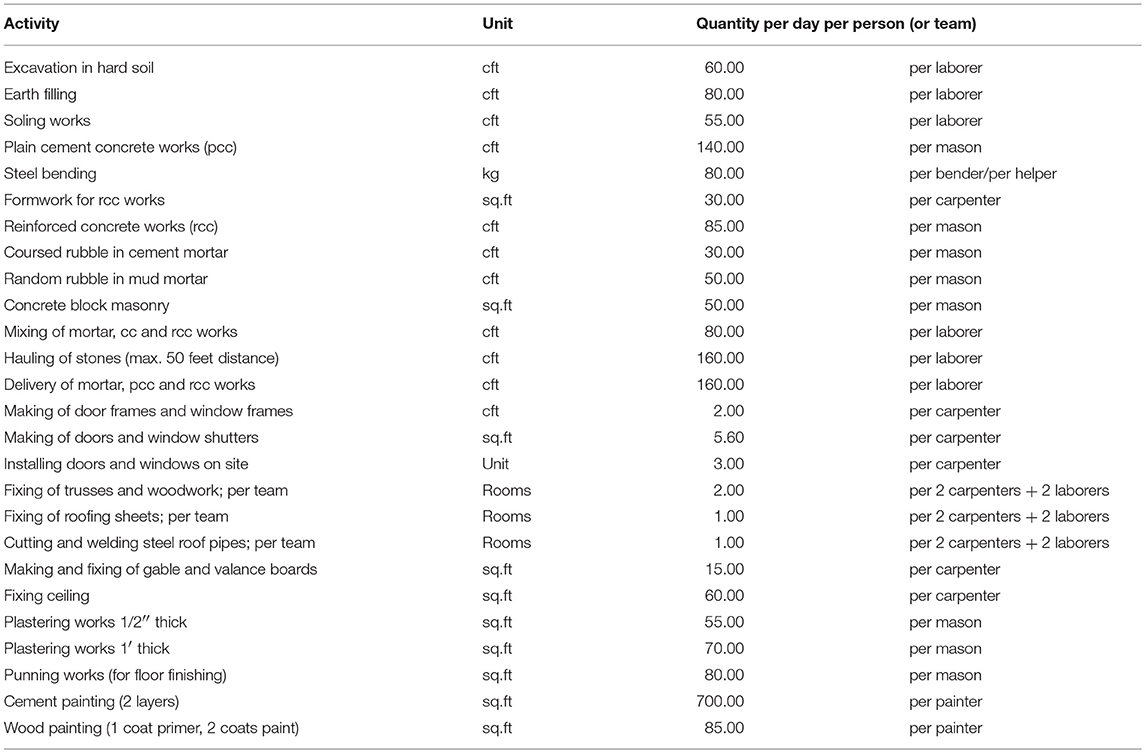
Table 1. Labor Constants for work turned out by labor in Kaski District of Nepal.
Transportation Costs
All materials that are locally harvested, such as stones from the mountains, sand, and pebbles from the rivers and wood from the community forest, are basically owned by the villages and therefore regarded as free of cost. That means that the price for a cubic meter of sand or a bag of aggregates does not represent the value of the material, but this price is determined by costs for labor and transport. It includes tractor rides to the river or forest for collection of the raw materials. In case of aggregates the stones must be broken and wood must be sawn, after which it must be loaded and sent onward. The materials are transported to a drop-off point as close as possible to the construction site, from where it is offloaded, shoveled into baskets, and hauled to its final destination by foot. For our estimates, it was not possible to further break down the cost of such raw materials into costs for labor and transport.
For materials that need to be purchased from outside the villages, such as cement, reinforcement steel, concrete blocks, tin sheets, paints and such, transportation fees apply. The cost of a tractor load, which usually includes loading and unloading, depends on the distance between the building shop and the village. All villages that are located near Madi River must purchase their rough construction sand from Seti River, as the Madi sand is very fine and therefore only recommended for plastering and finishing works. For these villages a higher transport rate for the construction sand is included in the estimates.
Tractors generally transport maximum loads of 2,500 kg into the mountains, which roughly adds up to 50 bags of cement, or 25 quintal of steel, or 175 concrete blocks. Figure 2 shows a schematic map of the southeastern part of Kaski District and the villages in which SSF worked between 2007 and 2012. It marks Prithvi Highway and the main routes (I-VI) into the hills which start from the so-called plain area, a stretch of roughly 3 kilometers between the highway and the two lakes. At some point, all routes into the hills change from tarmac to dirt roads. Distances are measured in kilometers, as well as in number of hours by 4WD, but these timings can easily double for a fully loaded tractor. The map also marks the main markets (called chowks or bazaars) and the places where to buy concrete blocks.
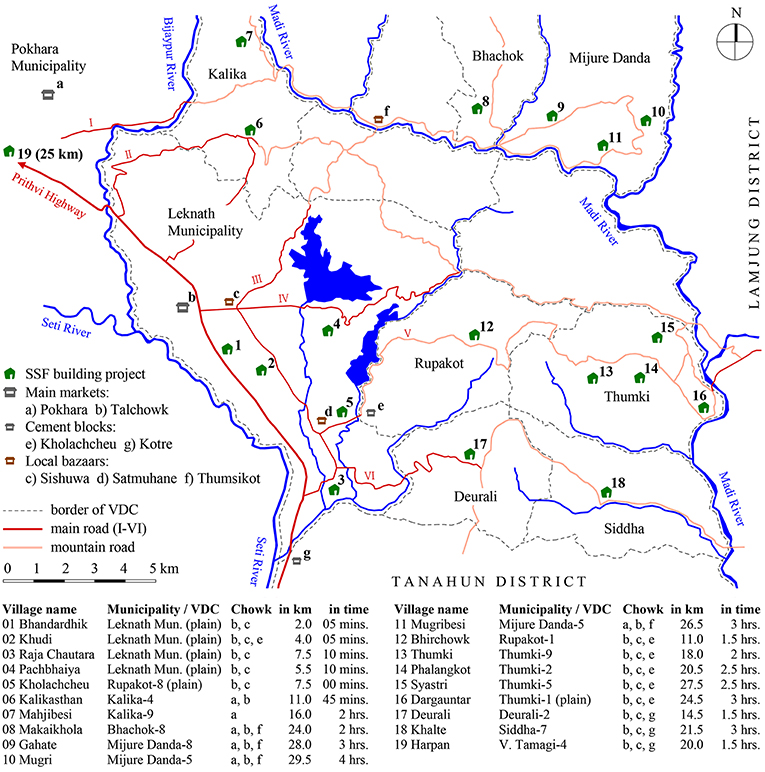
Figure 2. Schematic map of schools and distances to markets in southeastern part of Kaski District.
Collection of Local Construction Data and District Rates
Between 2007 and 2012 a questionnaire was filled in by all 19 villages where SSF built projects, to obtain the going prices of materials, current local wages of the laborers, and distances between the access points of the village and the nearby rivers and building shops. For this purpose, each village established a Construction Committee, usually including the village chief, the school headmaster, some village elders and local laborers, whom after long deliberation determined all needed information. With this local building and costing data, a final set of designs and details was prepared for each village, and a separate estimate was made, divided in the 5 main building phases of foundation, walls, roof, floor, and finishing. To all projects 10% contingencies was added to make up for unforeseen price hikes during the construction process, for instance due to scarcity of materials or strikes in the country. Based on the estimation a financial agreement was drafted between the village and SSF. This included a certain percentage of contributions from the village called “People's Participation,” as well as a payment plan of installments following a schedule of training sessions, inspections, approvals and financial reports. All these communication and administrative activities were carried out by local partner SEED Foundation. Note: To any reader interested, the questionnaire can be sent upon request.
In the period between December 2017 and March 2018, a new questionnaire was distributed in the same 19 villages in order to prepare new estimates. This was done to determine if there are any similarities or deviations between the situations of 2007 and 10 years later, and to determine if any patterns exist that can be generally utilized for preparation of estimates in this district. Out of 19 surveys, 17 villages eventually returned the requested data, but this took longer than anticipated. One reason is that the roads into the mountains have improved at many places, meaning that access to the markets to buy steel tubes and concrete blocks has become easier. Therefore, some of the villages found it more difficult to determine the going rates for local materials such as wood and stones, which seemed to be less used in certain areas. Another possible reason is that there was no direct involvement in a prospective project. With this in mind, it must be noted that there may be some inaccuracies within the collected data. However, an initial review showed that on average the given prices are consistent in the different contexts (plains and hills), and therefore the recent rates are eligible for the comparisons in the next sections.
Also, the District Rates (DR) of Kaski between 2007 and 2017 were collected and separate estimates were prepared related to these DR, to detect any similarities between the actually built projects and the general trends in the whole area. The DR are published right after the monsoon (around September) and dictate the material rates and labor wages for the coming year. The latest versions of these rates (District Technical Office, 2015a, 2017a) can be found online, the previous versions were copied at the District Technical Office in Pokhara (District Technical Office, 2009, 2012). All DR data has been converted to the Imperial system, average transport distances between villages and chowks were determined, and estimates were prepared for each technique. These full estimations are also used for the comparisons in the next sections, and the cost distributions according to the DR are added to Table 2 and Figure 3.
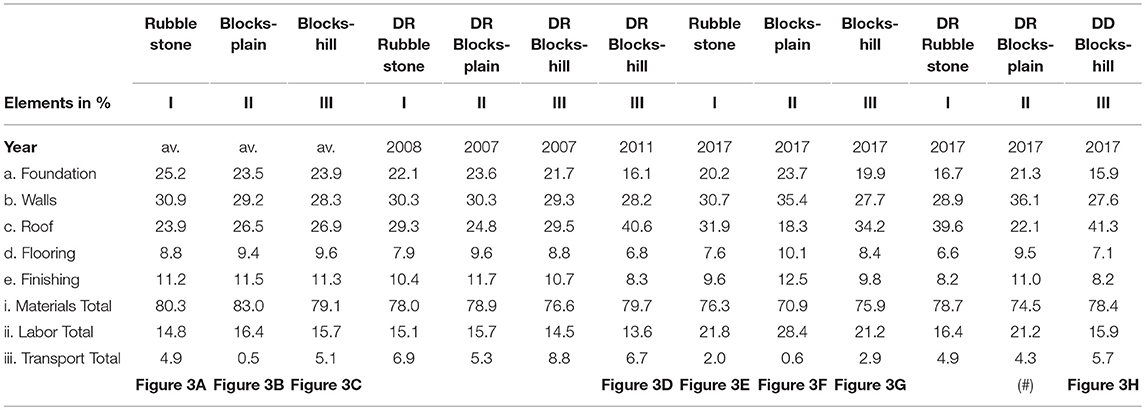
Table 2. Distribution of costs for main construction phases of different techniques, according to actually built rates (on the left) as well as to District Rates (on the right), at different time frames.
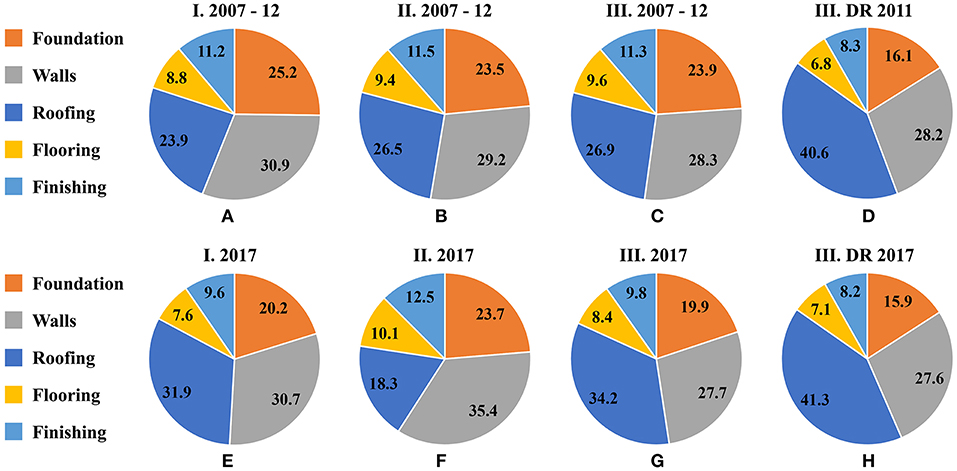
Figure 3. Cost distribution of main construction phases in different time frames for: (A,E) Group I, rubble stone in the hill areas; (B,F) Group II, cement blocks with steel roof in the plain areas; (C,D,G,H) Group III, cement blocks with wooden roof in the hill areas.
Comparisons of Full Estimates
In order to detect generalities and similarities in the overall distribution of costs, full estimates for the three types of school buildings (groups I, II, III) were analyzed and compared according to actually built rates, as well as according to the general District Rates for Kaski District. Also the effects of materials prices on the costing of separate construction elements were reviewed, such as for the roofs and the walls.
Eligibility Check and Grouping of Construction Types
To be included in the analyses and comparisons, first the eligibility of all projects was checked within the period 2007–2012. Estimates based on average figures of all 19 villages were prepared, and the total costs were divided over the 5 main construction phases being (a) foundation, (b) walls, (c) roof, (d) floor, and (e) finishing. These average estimates were then compared with the estimates of each individual school. Schools with phases that deviate more than 15% were deemed not eligible for the comparisons.
The eligibility check has resulted in a clear distinction of 3 groups, which are based on three different types of construction types. Group I consists of 13 villages that fall within the costing averages for rubble stone schools with a wooden roof, although only 4 villages actually decided to build with this technique in 2008 (of which one with a steel roof). Group II includes 6 villages with concrete block schools and a hollow steel tube roof, which is the most common technique in the plain area of Leknath Municipality (Figure 2, no. 1–5). And group III includes 10 out of 14 mountain villages that are eligible to build with concrete blocks and a wooden roof (of which 7 villages actually did so). The remaining 4 (out of 14) mountain villages are most remotely located (Figure 2, no. 8–11) and these are the ones that actually built with rubble stone (group I). To make the comparisons fair, the same grouping was used for the period 2017, minus two villages that had not returned the questionnaire about local costing. Final sets of estimates were prepared based on the new averages for each group and for both time frames, and these are used for the comparisons in the next sections.
Distribution of Costs
When comparing the cost distribution of the main construction phases, big differences are seen between the different time frames, as shown in Table 2 and Figure 3. Between 2007 and 2012 the distribution for all three construction groups is similar, where both foundation and roof roughly represent a quarter of the costs, the walls around 30%, and flooring and finishing together cover the remaining 20%. Also, the ratios for materials, labor, and transportation are nearly equal for all three contexts. In 2017 however, the distribution is very different for all 3 groups compared to 10 years before. For groups I and III the percentages of the foundation decreased and the roofing increased (Figures 3A,C vs. Figures 3E,G), whereas for group II an increase is visible for the walls while the percentage for roofing became less (Figure 3B vs. Figure 3F). Overall, the portion for the actual labor wages (cells ii) went up significantly in 2017, whereas the actual costs for transportation (cells iii) have decreased, possibly because the road networks have improved and goods can be delivered on site.
The data also shows a big difference between the costing based on actual local rates vs. the general District Rates. The DR are compared to the corresponding time frame in which the schools were actually built by SSF, which are 2008 for Group I, 2007 for group II, and 2007–2011 for Group III. In the period 2007–2008 the actual rates and District Rates are quite similar, but in the years 2011 and 2017 these differences are significant (Figures 3D,H). Furtherly, a big difference is visible between the 2017 DR data for groups I and III vs. the 2017 DR data of group II (marked with #), especially for the roofs. Overall, the roof portions show the largest deviations, but these charts do not indicate whether this is caused by (i) a steep change in the costing of the roof phase itself, (ii) by changes in other phases such as the walls or the foundation, or (iii) by the increase of a certain materials, for instance Sal wood or steel tubes. These factors are further investigated in the next sections.
Comparison of Material Rates and Labor Wages
This section reviews which materials or costs have the biggest impact on the overall costing of a construction project in Kaski District of Nepal. Figure 4 shows the fluctuation of material prices and labor wages according to the District Rates between 2007 and 2017. The charts indicate that prices of stones (+124.3%) and sands (+117.9%) have more than doubled in the last 10 years, with a large peak in 2010. This differs from the report by Amnesty International (2017) in Dholaka District, where these prices were reported to have doubled and even tripled in just 20 months between 2015 and 2017. A bag of cement on average increased between 0 and 10% each year, but in total went up with only +34.2%, from 585 Nepali Rupee (NRS) in 2007 to 785 NRS in 2017. The price of tin sheets has not changed at all in 9 years, and even slightly decreased in 2017 with −2.3%. Reinforcement steel (here expressed as cost per kg) fluctuated slightly, with a big hike in 2008 following global trends, but the 2017 rates are also lower than 2007, with −0.77%. On a positive note, the wages for labor have steadily increased between 7 and 15% each year. For skilled work the wages were raised from 375 NRS to 950 NRS (+153.3%). Unskilled labor went up even more, with an increase between 10 and 20% per year, and almost tripled from 230 to 650 NRS (+182.6%). This also explains the large increase for the price of mountain stones, as it is very labor-intensive to hack, haul and transport new stones from the mountains.
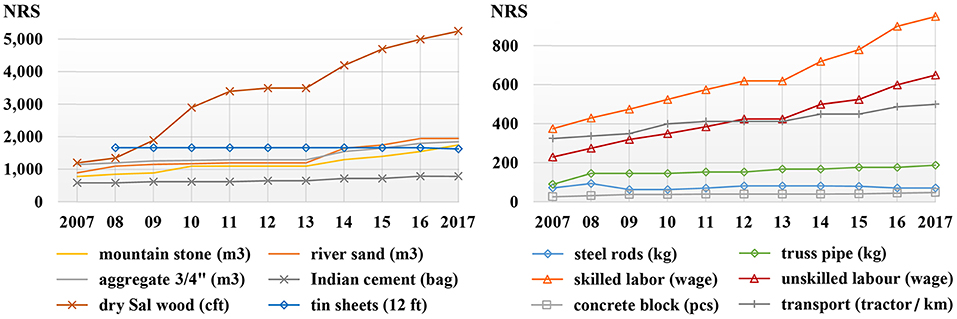
Figure 4. Increase of main material prices, wages and transportation cost between 2007 and 2017, according to the District Rates in Kaski.
The unit that really stands out is the price of 1 cubic foot of sawn and dried Sal wood, which spiked the most of all materials with over 40% increase in 2009 and another +52.6% in 2010. The price then stabilized for 2 years and gradually rose further to a total increase of +337.5%, from 1,200 NRS in 2007 to 5,250 NRS in 2017. The competing truss material of hollow steel pipes (in kg) increased much less, as these prices “merely” doubled in 10 years with +108.9%, from 90 NRS to 188 NRS.
The general DR prices were cross-checked with the going rates as obtained from the villages. This was done for the actually built schools with concrete blocks and wooden trusses (group III) for the years 2007 (4 schools) and 2011 (2 schools), as well as for the average village rates of 2017. Table 3 clearly indicates that there is no similarity between the two rate systems, as the rates fluctuate heavily and with large differences. This is mostly the case for the mountain stones, cement and steel, as well as for the skilled and unskilled labor wages. For instance, the differences per cft of mountain stones range from +215.3% in 2011 to −35.4% in 2017. Overall, the table shows that in 2007 the DR were significantly higher than the local rates, but that this situation has completely reversed in 2017 with the only exception of Sal wood.
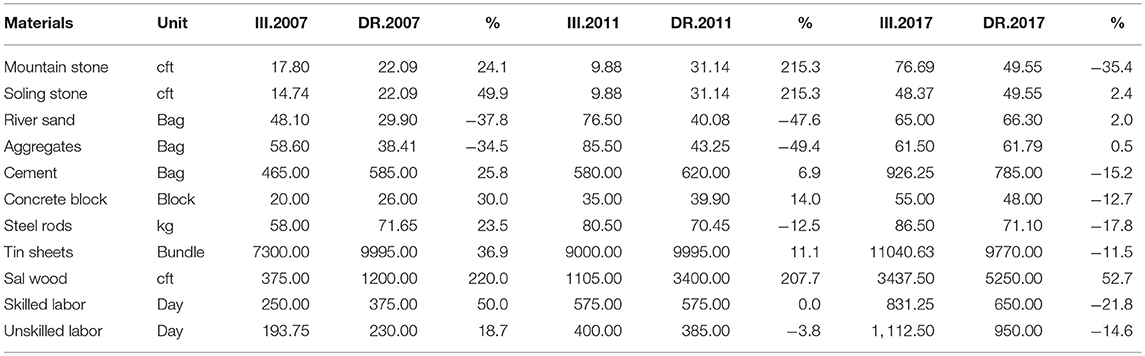
Table 3. Price differences of main materials between local village rates and District Rates for actually built schools of group III, in 2007 and 2011, and differences according to 2017 rates; all in Nepali Rupee (NRS).
Comparisons of Total Amounts
The differences between the actual village rates and the general District Rates are most clearly visible when comparing the total estimated amounts of fully constructed school buildings, for the corresponding years that SSF built a school in those particular villages (these are marked with *). Table 4 shows that for 14 out of 19 schools, the estimates made with the DR are much higher compared to the village rates, with percentages between +32.5 and +49.0%. It is noted that all these 14 projects are located in the hilly regions. In 2017 however, these differences have become less, especially for the projects in the plain areas that are built with blocks and steel roof (no. 01–05 of Figure 2), with differences ranging between −3.3 and +4.2%. Compared to the plain area, the DR are a lot higher for the remote villages that built with rubble stone, with the highest difference in Mugri (+37.4%).
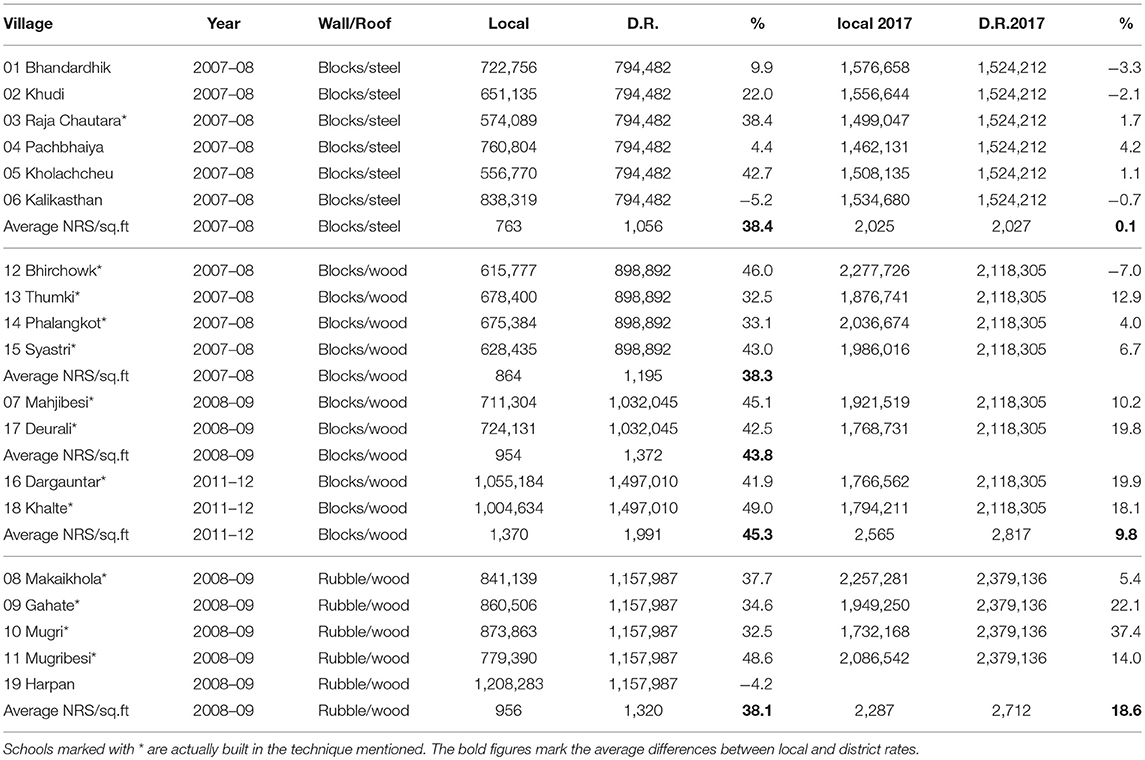
Table 4. Comparison of total amounts and amount per square foot, between actual rates and District Rates in different time frames.
Furtherly, the average amounts in NRS per square foot were calculated. The plinth area of the rubble stone schools (floor plan minus open veranda and aprons) is 877 vs. 752 sq.ft for the concrete block schools. In the period 2007–2012 the average D.R. rates per sq.ft are much higher than the local rates, between +38.1 and +45.3% for the actually built schools (marked with *). For 2017 the averages were taken for all villages, and now the differences are less, with an almost equal price per sq.ft in the plain area (only +0.1%), and differences between +9.8 and +18.6% in the hills. Overall, Table 4 indicates that in 2017 it is cheapest to build in the plains with blocks and steel roof, at an average rate of 2,025 NRS/sq.ft, and that the price in the remotely located villages is lower (2,712 NRS/sq.ft) than in the overall hill regions (2,817 NRS/sq.ft). A possible explanation is that these remote villages have better access to stones and wood. With that in mind it is interesting to notice the large cost differences between villages that have built with the same techniques. Even though some of these villages are located next to each other (for instance nos. 8–11), the situation at micro level often differs in such way that it creates a high impact on the overall costing. Therefore, the effects of local cost influences are further reviewed in the next sections. Lastly, it is noted that the average amount per square foot in 2017 is much higher than the predicted governmental rates in 2015, which were then set at 1,500 NRS/sq.ft for cement-mortared masonry.
Comparison of Different Roofing Systems
Important note: The following two sections about the roof and walls give no indication nor opinion about which type performs better during a seismic event; only about the differences in cost. As seen in Table 2 and Figure 3, the roof portions show the largest deviations in the cost distribution. To investigate possible causes, a comparison was made for the roof structure itself according to local village rates. Steel trussed roofs made with round hollow pipes are compared to wooden trusses that are made from locally harvested Sal wood. Due to the thicker rubble stone walls, these buildings and its roofs are slightly longer and wider, with a surface area of 1453 sq.ft for rubble stone schools vs. 1310 sq.ft for concrete block schools. The first comparison shows that between 2007 and 2012 the truss material of steel pipes is much more expensive in the mountains than Sal wood roofing members, with prices more than double for Group I and nearly double for group III (Table 5A). This situation has completely changed in 2017, where wood has become three times more expensive than steel tubes, for all three groups.
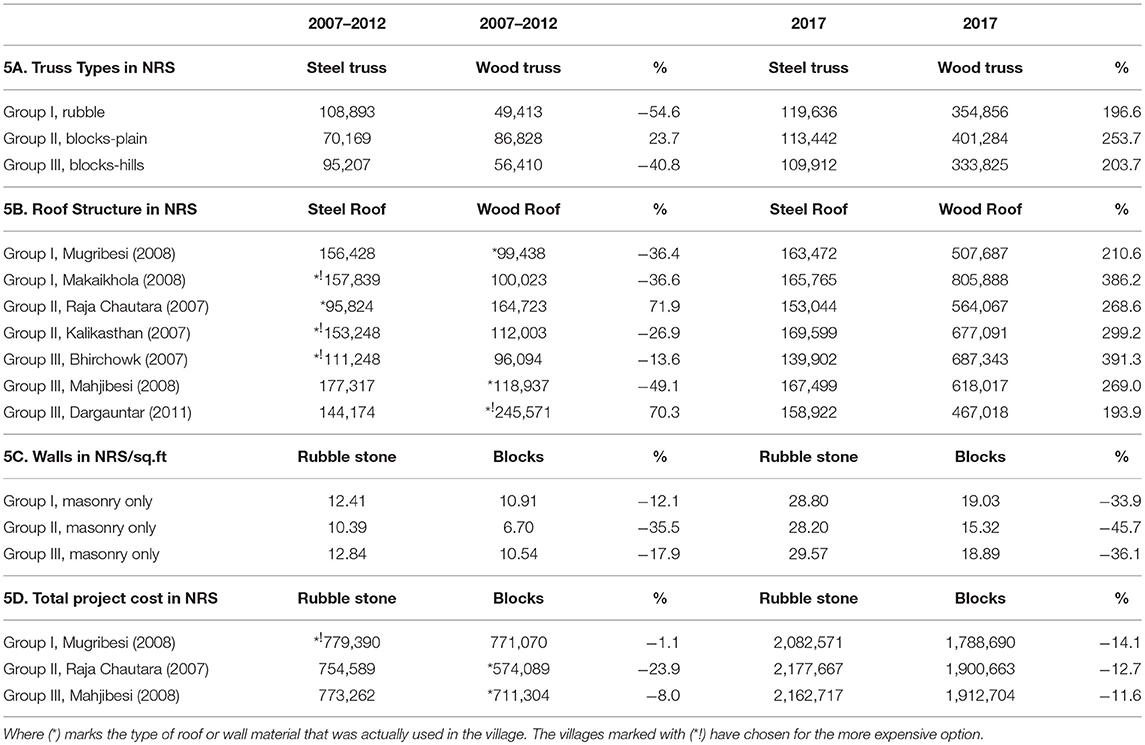
Table 5. Cost difference in % of different solutions for the roofing and walling systems, according to village rates prices in Nepali Rupee (NRS).
However, we cannot draw conclusions from the average costing of one single material alone. Therefore, a second comparison was made for completely finished roof types at different locations. Estimates were prepared for representative villages in both wood and steel, where (*) marks the type of roof that was actually built (Table 5B). Although the dimensions for the roof are the same for Group II and III (both have walls in concrete blocks), the detailing is different. The wooden roofs at group III consume a higher quantity of wood for closing up the gables, for finishing with valance boards and for installation of a stiff wooden ceiling. Whereas, at the steel roofs of group II, the gables are closed up with tin sheets instead, and the wooden ceiling is replaced by steel bracing. To emphasize the difference between the main materials wood and steel, the tin sheets on top of the roof are left out of the calculation.
Table 5B shows that between 2007 and 2012 a fully wooden roof was cheaper for groups I and III (hills), but more expensive for group II (plains). Interestingly, three villages have deviated from this which are marked with (*!) and for one case the reason is known to the authors. The village of Makaikhola does not own a community forest, and therefore has to buy woods from other villages. Even though they had quoted the going rates at the time, they were unable to obtain the wood for a good price and chose to go with steel tubes instead. Possible other reasons to deviate may be scarcity of wood, local preference, village politics, unawareness of actual prices, etcetera. The table further indicates that in 2011 a shift is noticed from wood to steel in the hills due to the rapidly increasing wood prices, and in 2017 it is very clear that steel roofs have become the cheapest option for all three contexts. Feedback from Mr. Damodar Bhakta Thapa of SEED Foundation confirms that indeed these days (2017–2018) most villages choose steel roofs over wooden roofs, simply for financial reasons.
Rubble Stone Masonry vs. Hollow Concrete Block Masonry
Also, the effect of different wall types was compared and added to Table 5. For all three groups I, II, and III, the price is analyzed for a unit of rubble stone masonry of 14″ (350 mm) thickness and a unit of concrete block masonry of 6″ (150 mm) thick, including costs for labor and transportation. It is interesting to note that bricks have never been popular in the Pokhara region due to high transportation costs, as good quality bricks are almost solely produced in Kathmandu Valley. To make the comparison most realistic, a unit wall surface of 100 sq.ft was taken, so that vertical reinforcements were included in the calculations as well. For the block walls this means the insertion of 4 steel rods, plus grouting in the block cavities around the steel bars. The rubble stone wall specimen with dimension of 10 × 10ft includes one buttress. This was then divided by 100 to determine the amount in NRS per square foot, and the cost differences are presented in Table 5C, showing that a sq.ft of block masonry already was cheaper around 2007, and over time became even more cheap than rubble stone masonry.
However, these figures are based on averages, and only part of the wall system is considered. Therefore, the estimates of fully completed projects in both blocks and stones were compared. From each group the village with the largest difference was selected (Table 5D), whereas (*) marks the technique in which the school was actually built in that village. This table indicates that between 2007 and 2012, construction with concrete blocks was cheaper than construction with rubble stone in all cases. Although the differences for group I are minimal, between −6.0% in Makaikhola (not in table) and −1.1% in Mugribesi. In 2017 it is most obvious that concrete blocks are significantly cheaper than rubble stones, for all groups. If the road networks continue to improve and if the cost difference between stones and blocks further increases, it is expected that concrete blocks will become the main choice for wall material in the hills and possibly for the mountain areas as well.
Impact of Local Factors
The previous sections indicate that some villages have chosen for a more expensive solution for their roof or wall system, most likely depending on local (un)availability of materials and preference. So does this mean that the remote villages made a wrong choice 10 years ago? Not necessarily, as in reality the difference may have been less than the figures show. To build with blocks, specially trained masons must be hired from Leknath area, and there the labor wages are higher. Besides, during those years the whole country of Nepal was subjected to massive electricity and petrol shortages, creating shortages of cement and machine-made products such as hollow concrete blocks, as well as transportation problems of materials into the hills and mountains (Housing Nepal, 2009). Another reason to choose rubble stone over blocks may simply have been that the villagers are more accustomed to the traditional technique with stones. As a positive side effect, the use of locally available materials stimulates the local economy and provides jobs within the village, rather than hiring people from outside. Such local restrictions and preferences have likely played a more important role in the selection of a particular technique, and such factors will vary from village to village.
From the above comparisons it can be derived that the District Rates do not represent the actual cost situation in the villages. A logical explanation is that the DR are general figures that apply to the whole district, whereas Kaski District includes 6 different altitude levels between 350 m (plains with tropical climate) and 8,091 m (trans-Himalayan with arctic climate), with populations ranging from Metropolitan city level to extremely remote and sparsely habited settlements (Central Bureau of Statistics, 2014). Local influences such as availability of materials and accessibility to the site, as well as local customs and preferences, have a high impact on the costing at village level. Such local factors however are not reflected in the general rates which are more representative for trends and fluctuations of national and global market prices. To address this impact of factors at the micro level, the last section before the conclusion includes a solution for rapid cost estimation and comparison of different techniques according to the local situation in the villages.
Post-earthquake Increase of Construction Costs
SSF only possesses actual and local construction data for the year 2017 and it was therefore not possible to analyze the post-earthquake trends since 2015 in Kaski District. An attempt was made to obtain post-disaster costing data from the 14 districts that are marked as “severely or crisis-hit” (National Planning Commission, 2015b), through a short survey in 2018 among 450 post-disaster relief workers and through the coordinating organization Global Shelter Cluster Nepal. This unfortunately did not receive much response, nor any useful data to construct a clear view on the fluctuation or increase of prices between 2015 and present times. Therefore, it was only possible to compare the general trends of the District Rates of Kaski vs. the DR of Gorkha (District Technical Office, 2015b, 2017b), which is the district where the 2015 earthquakes took place (“crisis hit”).
Figure 5A shows the cost of several main materials between 2013 and 2017. Generally, wood is more expensive in Kaski, whereas sand and aggregates are more expensive in Gorkha. In Kaski (dotted lines) the price of sand rose from 1,750 NRS in 2015 to 1950 NRS in 2017 (+11.4%), and aggregates increased +25.0%. In Gorkha these numbers are completely different with no price difference for sand at all, and a surprising decrease of −27.6% for aggregates. It is interesting to note that these prices increased the year before the earthquake, and not after. To evaluate the increase of total costs, Figure 5B shows the absolute amount per square foot of plinth area, for 10 years of building data from Kaski, and 5 years from Gorkha, calculated for all three techniques. Between 2013 and 2017 the yearly increase in Kaski ranges between 7 and 10% on average, and in Gorkha between 5 and 7%. More striking deviations were seen in Kaski in 2008 caused by a spike of global market steel prices (Reuters, 2008), another one around 2010, and a big rise in 2014 (Housing Nepal, 2014), which is the year before the earthquake.
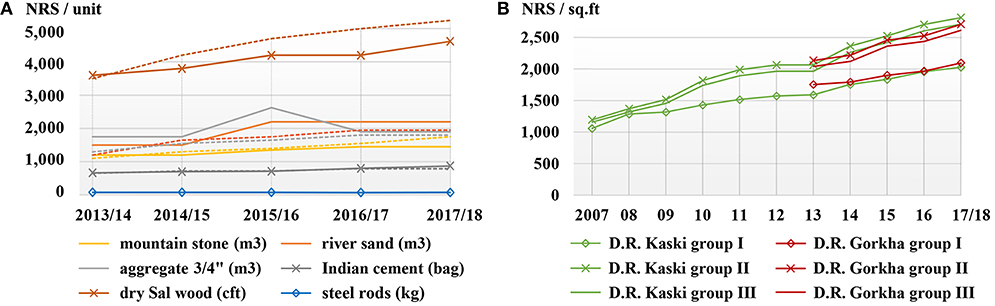
Figure 5. (A) Increase of main material prices, wages, and transportation cost between 2013 and 2017 in Gorkha District (and dotted lines for Kaski District). (B) Increase of amounts per square foot in Kaski and Gorkha Districts.
Even though the District Rates may not reflect the actual situation at village level, overall there are no indications of doubling or tripling of separate material or total construction costs after 2015. The highest increase of a single material in Kaski is for mountain stones (+25.0%), and in Gorkha for cement (+22.5%). This is in sharp contrast with the (only) report that was found (Amnesty International, 2017), where aggregate prices increased with +100% and sand with +200% in just 20 months. In Kaski it took nearly 10 years for these prices to double. It is hoped that the NGO's involved in reconstruction have documented and are willing to share the pricing of materials, so that an in-depth post-disaster cost analysis can be carried out at the national level.
Cost Comparisons of Seismic Features
This section focuses particularly on the costing of seismic reinforcing elements in rubble stone schools with a wooden roof (group I), and in cement block schools with a steel roof (group II). The price implications of adding or removing certain seismic features, such as better mortars, horizontal bands, and/or vertical reinforcements is reviewed according to the local village rates of 2017. Again, it is emphasized that this section gives no indication nor opinion about which construction type performs better during a seismic event. A step-by-step cost overview is added, where a traditional unreinforced school is seismically improved, strengthened and fully reinforced. This includes the addition of all non-structural elements such as flooring and finishing, in order to provide the total cost and cost distribution for a fully finished earthquake resistant school construction project. To make all information useful and applicable for the reader, the section ends with a solution for rapid cost estimation of different school designs.
Types of Mortar in Rubble Stone Masonry
The first comparison looks at the costing of different mortar types in rubble stone masonry, which is used for the foundation at all three groups, and for the walls at group I only. For the foundation, there is no clear answer in the literature which mortar type is best below ground level and therefore the following recommendations are based on personal experience of SSF. Mud mortar is the main choice in the villages but is not recommended by SSF, as the mud may wash out from the joints during the monsoon season. A possible alternative is stabilized mud mortar by adding 10% cement to the soil, but this type is also not recommended by SSF due to insufficient data about the effect of adding stabilizers to Nepali mountain soils. The use of lime-based mortars is uncommon in the hills and mountains of Nepal and therefore SSF builds their foundations with cement-sand mortar in the ratio 1:6.
Table 6A shows the price difference between mud mortar and cement-based mortar per 100 sq.ft of stone masonry of 14″ (350 mm) thickness, including costs for materials, labor and transportation. In group II the price of cement is lower and the price of mud is higher compared to the hills, which results in a (expected) percentual difference between the two areas. It is however important to realize that stone masonry with cement mortar is much stronger than stone masonry with mud, as well as to recognize that the price increase of stones is of more influence on the total costing than the price of the mortar, as seen in Table 3 and Figure 4.
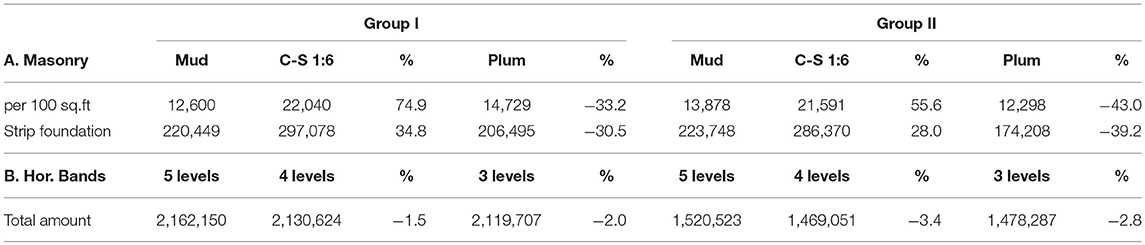
Table 6. Cost difference for different solutions for (A) the foundation, and (B) horizontal reinforcements in the walls, as per 2017 local village rates in Nepali Rupee (NRS).
Table 3 also indicates that soling stones, such as round boulders from the river, are cheaper than mountain stones. Therefore, the costing of a full stepped strip foundation in mountain stones is added to Table 6A, including costs for digging trenches, placement of stone soling with a top layer of plain cement concrete (pcc), and stone masonry in cement mortar above ground level. This type is then compared to a monolithic cast strip foundation called a “plum foundation,” or “cyclopean concrete foundation,” which consists of 50% round river boulders of maximum 10″ (250 mm) dimension in a plain concrete mixture of 1:3:6(3/4″). Table 6A shows that cost savings are possible between 30 and 40% for both groups. For walls this technique is not suitable since it needs specialized formwork, scaffolding and highly trained workmanship; if possible at all.
Horizontal Seismic Reinforcements
The second comparison analyzes the cost differences for removing horizontal seismic reinforcing elements. Smart Shelter Foundation built their schools with horizontal reinforcements at 5 levels, being from bottom to top: (1) plinth beam at foundation level; (2) sill beam under the windows; (3) in-between stitches in corners and t-sections; (4) lintel over all openings; and (5) top beam at roof level (Figure 6A). When reducing the number of reinforcements from 5 to 4 levels, there are three options: (i) keep the sill band and remove the in-between stitches; (ii) combine the sill band with the stitches at the same level; or (iii) remove sill band and keep just the stitches. The choice is made for the third option (Figure 6B), for which the cost saving is most favorable. A further reduction of horizontal reinforcements can be achieved by combining lintel and top beam, again with placement of stitches (Figure 6C).
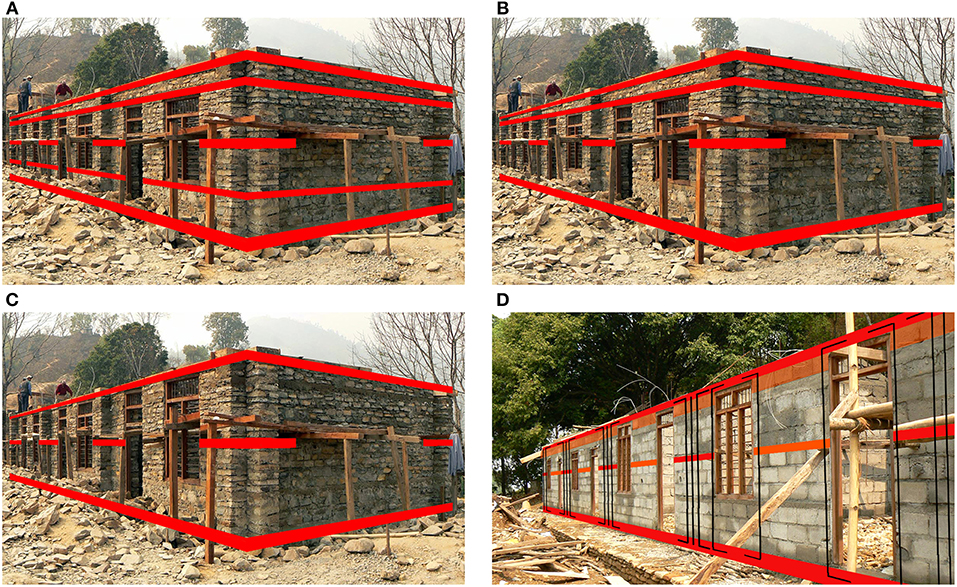
Figure 6. Horizontal reinforcements in rubble stone masonry walls, at (A) 5 levels; (B) 4 levels; (C) 3 levels. (D) Horizontal beams in concrete block masonry at 3 levels (all by courtesy of Smart Shelter Research).
The cost differences of removing one or two levels of reinforcements are shown in Table 6B, which indicates that the difference is −2.0% at best for group I for a completely built school. This relatively modest cost reduction in rubble stone buildings is caused by two things. Firstly, as the top level of the walls is fixed, the door and window frames become slightly higher for which the extra costs are adjusted in the estimates. Secondly, stitches are easily incorporated in rubble stone masonry, but when a beam is removed, this part is replaced by stone masonry which is a costly element in 2017. Also with the concrete block walls in group II two remarkable things happen (Figure 6D). Firstly, unreinforced concrete bands are cast between the stitches to avoid cutting of all blocks over the full length of the building. And secondly, when we remove horizontal beams the ceiling level becomes too low, and therefore an extra row of blocks must be added to the wall height. Due to these additions in the walls (shown in orange), together with extra wood for the higher door and window frames, the reduction from 4 to 3 bands is actually more expensive than removing only one reinforcement from 5 to 4 levels.
Overall, in the very best case a cost reduction is achieved of 42,443 NRS in the hills (group I) and 42,236 NRS in the plain areas (group II), which roughly translates to 375 US$ for each case (xe.com, December 2018).1 This may seem as very minimal cost savings, but this amount covers 2 full beams in a design of 3 classrooms, which translates to roughly 62 US$ per band per room, which is actually a very positive outcome; It means that the inclusion of these important seismic features is not that expensive, and that there is basically no financial obstacle to incorporate horizontal beams and stitches in new constructions of schools and houses.
From Unreinforced to Fully-Reinforced and Finished Rubble Stone Masonry
To further analyze the cost implications of adding seismic features to the school designs, the construction sequence is simulated of transforming a traditional non-reinforced building into a fully reinforced and fully finished school building. A set of drawings of a traditional unreinforced school building was prepared, based on pictures of rubble stone buildings that were taken all over Kaski District between 2006 and 2018, such as Figure 7A. It was especially this type of construction that suffered the most damage in the 2015 Gorkha Earthquakes. Although official numbers have still not been released by the Nepali government (as of December 2018), it is estimated that nearly 1,000,000 houses and 57,000 classrooms were destroyed and damaged throughout the country (The Post Disaster Recovery Framework, 2016). It is further estimated that 81% of all building damage took place in the rural areas, where 95% of all collapsed structures consisted of low-strength masonry; the majority being stone with mud mortar (National Planning Commission, 2015a). The unreinforced design has similar dimensions as the Master sets and is gradually improved as described below. Of each step the cost implications are shown in Table 7A, resulting in a total increase of additional costs of +55.4% for seismic improvements (step 1–5) added with +29.6% for valance boards, flooring and finishing (step 3b + step 6), amounting to +85.0% for a completed rubble stone school building, as compared to doing nothing at all (step 0).
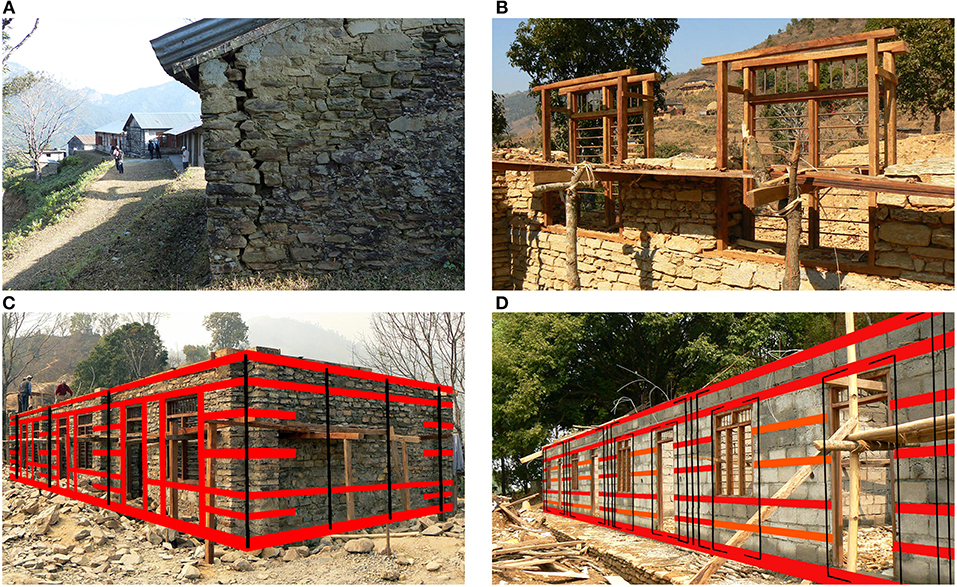
Figure 7. (A) Traditional school building without horizontal reinforcements. (B) Double frames for doors and windows. (C) Rubble stone walls with extra horizontal stitches, additional vertical steel, and boxed openings. (D) Concrete block walls extra stitches and unreinforced concrete fillers (all by courtesy of Smart Shelter Research).
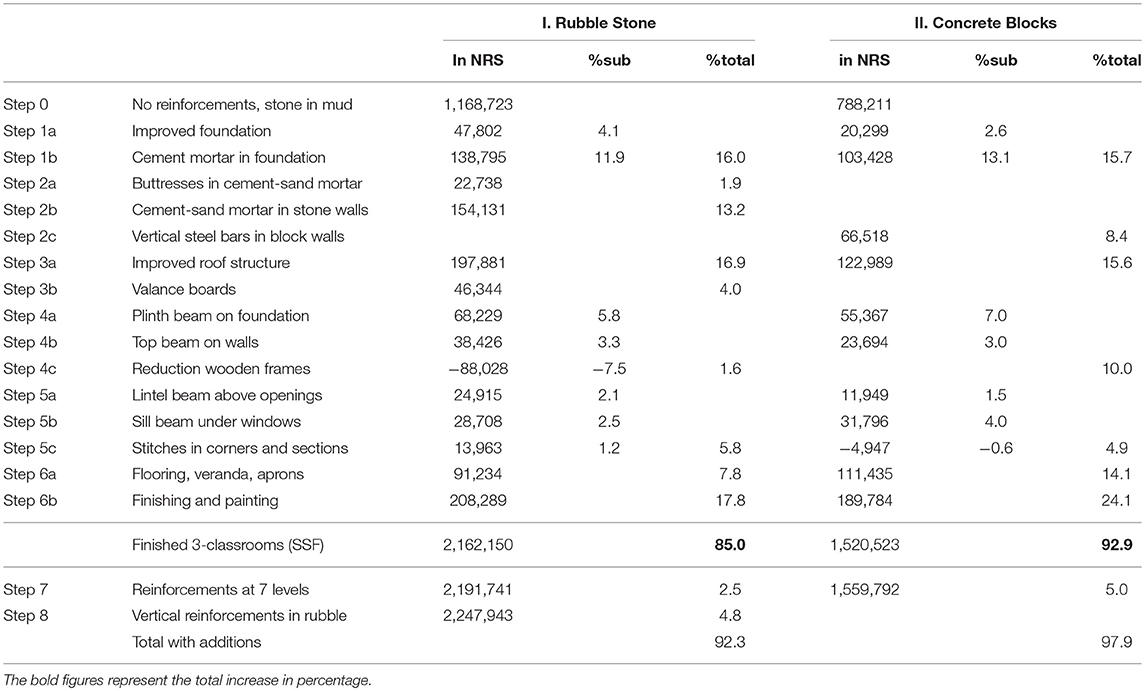
Table 7. Cost differences between unreinforced and fully-reinforced school buildings in (A) rubble stone masonry, and (B) hollow concrete block masonry, based on local village rates for 2017.
Step 0. The foundation and walls of traditional buildings are constructed with rubble stone in mud mortar, without any inclusion of horizontal bands or vertical reinforcements. Doors and windows are made with a double frame, each placed on the outsides of the wall thickness, with planks on top serving as a lintel for the masonry above (Figure 7B). The walls have stone gables and the roof consists of wooden rafters, purlins and low-quality tin sheets. The floors are made of tamped earth, and no finishing works are applied such as plastering of walls and painting of woodwork.
Step 1a. The improved foundation includes stone soling and a layer of plain cement concrete (pcc) in the bottom of the trenches, as well as additional measures for extra buttresses and the veranda. Step 1b. Replacing all mud mortar with cement-sand mortar, which causes the biggest cost increase of these two steps with nearly 12%.
Step 2a. Adding of extra buttresses in cement-sand mortar. Step 2b. Replacement of all mud mortar with cement-sand mortar for the rubble stone wall masonry walls. The replacement of mud in both foundation (step 1b) and walls (step 2b) together, roughly adds up to a third (+29.5%) of the total cost increase (including step 6).
Step 3a. Improving the roof structure by removal of the masonry gables and by adding full wooden trusses with cross-bracing, poles on the veranda, wooden gables and a stiff ceiling. These elements all contribute to the structural stability of the roof structure, in contrary to step 3b; Applying of valance boards, which has merely an esthetic function. This step represents a relatively high percentage of +4.0%, due to the high price of wood and the high labor-intensity.
Step 4. Addition of two continuous horizontal beams to the design, which is the bare minimum according to the Indian (IS 13828:1993, 2008) and Nepali (NBC 202:1994., 2007) seismic codes. At step 4a the plinth beam is added, and at step 4b the lintel which acts as a top beam. These beams are the thickest (6″ and 4″) and add around 9% to the cost increase. However, now that a lintel is installed above the openings, a huge cost saving of −7.5% can be made by installing single door and window frames. In dollars this means that the addition of 2 beams is just 235 U$ more expensive than doing nothing at all (xe.com, December 2018).1
Step 5. Addition of three more levels of 3″ (75 mm) thick horizontal reinforcements, being: Step 5a. Adding of top beam, thus placing the lintel at a lesser height within the wall, which also results in less height for all woodwork of doors and windows. Step 5b. Adding of sill beam below window level. Step 5c. Adding of stitches in all corners and t-sections of the walls. On average each step adds around 2% to the total increase of costs (200 U$ each) for 3 classrooms, which is in line with the previous findings about the general costing of horizontal beams.
Step 6. Fully-finished 3-classroom school as built by SSF, including: Step 6a. Flooring in the classrooms, on the veranda, and placing of aprons around the building. Although not part of the seismic strengthening of the building, this step is essential to make use of the school building, and therefore complements the total needed budget for a new construction project. This applies as well to Step 6b; Plastering of the walls and painting of the woodwork. These are also not part of the seismic requirements but will improve the quality, durability and lifetime of the building. Postponing of this step however may serve as a temporary cost-saving measure. It is remarkable to note that these non-structural actions combined are the costliest steps resembling nearly a third of the total cost increase. This is caused by the high price of stones in the floor and verandah, but also because finishing is very labor-intensive. For instance, the labor for plastering and painting (step 6b) represents half the total costs of this step (+49.8%).
Furthermore, two more steps were reviewed that are based on current practices in Nepal after the 2015 earthquakes. The Nepal Reconstruction Authority (NRA, 2018) has published a number of school designs that are approved by the Nepali Government. It must be clearly noted that the authors are not in agreement with the addition of these extra reinforcements, and that this review is done solely for purpose of reviewing the increase of costs, which are added to Table 7 as follows:
Step 7. Addition of 2 extra layers of stitches in the walls, resulting in reinforcements at 7 horizontal levels (Figure 7C). And step 8. Addition of vertical steel bars of 16 mm diameter that are inserted in all corners and t-sections, starting at the bottom of the foundation and bent into the top beam. A concrete core is cast around these bars against corrosion. All door and window openings are boxed by reinforced concrete posts, as also shown in Figure 7C.
As a final comparison, only the costing of the seismic improvements (step 1 to 5 minus the valance boards of step 3b) is considered. It shows that the biggest cost impact is made by the replacement of mortar in foundation and walls, representing more than half (+52.0%) of these additional costs, making this the most expensive intervention. The improved roof follows with +30.6%, addition of all 5 beams represents +13.3%, and the remaining +4.1% is for improving the foundation and adding of buttresses.
From Unreinforced to Fully-Reinforced and Finished Concrete Block Masonry
Similar to the review of stone masonry buildings, a set of drawings was prepared of an unreinforced building in hollow concrete blocks, which is then step-by-step improved, reinforced, and fully finished. The cost differences, based on average village rates for group II, are added to Table 7B and amount to +54.7% for all seismic improvements plus +38.2% for flooring and finishing, totaling +92.9% between unreinforced and fully-reinforced block masonry.
Step 0. The foundation is constructed with rubble stone in mud mortar, and the walls are built with 12 layers of low-quality hollow concrete blocks, in a cement-sand mortar mixture of 1:4, without any inclusion of horizontal bands or vertical reinforcements. Doors and windows are made with a single frame, on which blocks are directly placed without a lintel. The walls have block masonry gables and the roof consists of a steel tube at the top, connected with steel tube rafters and purlins, and low-quality tin sheets placed over it. The floors are made of tamped earth, and no finishing works are applied such as plastering of walls and painting of woodwork.
Steps 1a and 1b for improving the foundation are similar to the stone masonry school, with a percentual increase that is comparable as well. Step 2 (improvement of walls) differs, as no buttresses are added to the block walls. Instead the walls are reinforced with the inclusion of 3 vertical steel bars in all corners, 4 bars in the t-sections, and single bars next to all openings, that are all protected by filing the block cavities with a lean concrete mixture. This step 2c adds just over 8% to the overall cost increase.
Step 3a. The roof is improved by removing all masonry gables, adding steel poles on the veranda and by placing full steel tube trusses on the walls, which are inter-connected and closed-up at the sides with tin sheets. The structural stability is improved by installing cross-bracing elements at ceiling level. Together with improving the foundation (+15.7%), the strengthening of the roof is the most expensive seismic improvement (+15.6%).
Steps 4. Similar to the rubble stone walls, a plinth beam (step 4a) and a lintel beam at top level (step 4b) are added. As this is a stacking system of full-height blocks, the total height of the wall changes with each addition of horizontal reinforcing element. When adding the lintel, the number of blocks in height can be reduced from 12 to 11 rows. Both beams together increase the costs with 10%, whereas the addition of the 14″ (350 mm) wide plinth beam costs around 500U$ for 3 classrooms, vs. 200U$ for the 6″ (150 mm) wide lintel beam.
Step 5. Three more levels of horizontal reinforcements are added, being a top beam (step 5a) and a sill beam (step 5b). In both cases the number of blocks in the wall remains to be 11 rows high. The third level is the addition of stitches (step 5c), and to avoid hacking of blocks the horizontal space between the stitches is filled-up with a strip of unreinforced concrete as indicated in Figure 7D. Although step 5c includes all 5 levels of beams, this is actually cheaper than step 5b (4 levels), as at step 5c the walls plus beams need only 10 blocks in height. On average each of these 3 levels of reinforcement costs just 115U$ for 3 classrooms.
Step 6 is a fully-reinforced and fully-finished school building as built by SSF, split up in the non-structural additions of flooring (step 6a) and finishing (step 6b). These two non-structural phases combined (+38.2%) are almost equally expensive as seismically improving the foundation, walls, and roof (steps 1 to 3 amount to +39.7%). Again, this shows that the cost of including seismic strengthening measures is relatively low, in relation to the total cost of construction.
Step 7 adds two more levels of stitches as is currently practiced in Nepal. However, to incorporate all these extra layers means extra strips of unreinforced concrete (Figure 7D) and adds an extra wall height of 6″ (150 mm) since it is not possible to remove one row of blocks due to insufficient ceiling height. Step 8, vertical steel reinforcements, was already carried out at step 2c.
Lastly, for the concrete block schools the overall increase of +92.9% is divided in +54.7% for seismic improvements, and +38.2% for flooring and finishing. When only considering the costs for seismic interventions, the division is fairly equal for improvement of the foundation (+28.7%), improvement of roof (28.5%) and adding of all horizontal beams (+27.4%). The remainder (+15.4%) is used for strengthening of the walls.
Bills of Quantity
The previous chapters have compared the costing of different techniques, their separate elements and possible technical alternatives. In order to make all the comparisons useful and available to others, the Bills of Quantity (BoQ) for construction of one-story school buildings in the different contexts of Nepal are summed up in Table 8. These BoQ's list the needed quantities of materials, wages and transportation for 4 types of construction, being (i) rubble stone walls with wooden roof, (ii) rubble stone walls with steel roof, (iii) concrete block walls with wooden roof, and (iv) concrete block walls with steel roof. As a rule of thumb, building volumes should not exceed the maximum ratio of 1(length):3(width), which in practical terms means that a volume should not exceed three classrooms in a row. Therefore, the table includes the total quantities for buildings of each technique with 2 and with 3 classrooms, so that designs with four (2+2) or five (2+3) rooms can be estimated as well.
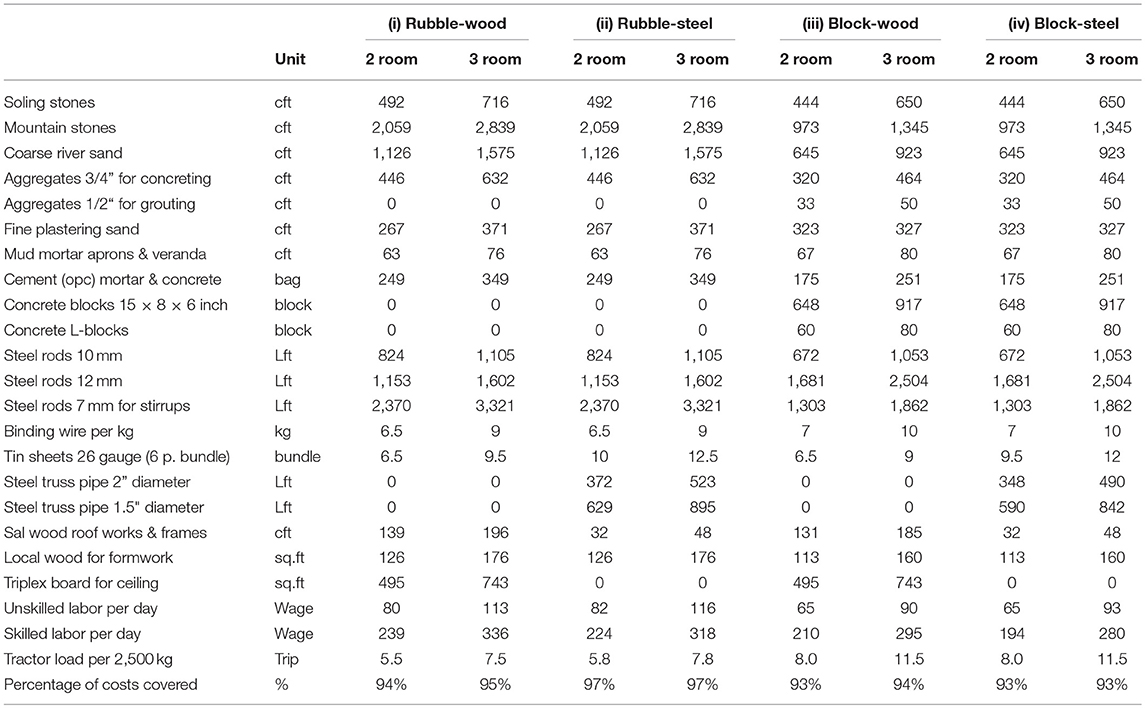
Table 8. Bills of Quantity of materials, labor wages and transport fees, for designs with 2 and 3 classrooms, for all four types of building techniques.
All elements are converted into separate materials and costs in such way, that it is just a matter of filling in the going prices and rates for each item. This way the villagers can compare which technique is cheapest to build in their village. Items can also be easily changed according to the needs and requirements of the project. For instance, the 7 mm Tor steel stirrups or the round steel truss pipes are expressed per total length, so that this can be simply changed to 6 mm plain steel or aluminum truss profiles, if locally preferred. The amounts in Table 8 make up for between 93 and 97% of all total costs for materials, labor and transportation, with the remaining percentages mainly for finishing such as paints and for local transportation on site. By adding 10% for contingencies, the estimations give a very accurate representation of the actual construction costs for these particular designs, at any given time. For other building dimensions a set of adjusted drawings and estimates must be prepared, but with the use of the existing Master sets this can be done rapidly. In case of adding or removing certain earthquake resistant measurements, these costs can easily be added or distracted by using the percentages as presented in the previous sections.
Conclusion
Detailed estimations of three different construction types of school buildings have been analyzed and compared based on local village rated costing data of 19 villages, as well as on generally applicable District Rates (DR) of Kaski District in Nepal, for the period between 2007 and 2017. Master Estimates were divided into the 5 main building phases of foundation, walls, roof, floor and finishing, and then further broken down into costs for materials, labor, and transportation, based on local material constants, labor outputs and transportation fees. These cost comparisons give a detailed insight in the distribution of the costs, the pricing of individual materials and construction elements, the effect of price fluctuation on the total costs, and the cost implications of different solutions for seismic measures; for different time frames and for the different geographical contexts of Kaski District. The following is concluded:
The distribution of costs, which is based on relative figures, only gives insights in the comparison of data within a specific area and during a limited period of time. For instance, in 2007 the wall portion had the highest influence on the costs, whereas in 2017 the roof construction plays a more prominent role. No general or useful pattern was detected that allows us to predict the situation 5 or 10 years ahead, as prices will continue to fluctuate due to changing markets or unforeseen impacts such as the 2015 Gorkha Earthquake. It means that current trends and their cost implications must be constantly analyzed and updated. In doing so, it was concluded that predicted exorbitant price hikes after the 2015 earthquakes, such as doubling or tripling of prices, were not noticeable in Kaski and Gorkha Districts.
Also, no similarities were found between the different costing approaches of the local village rates vs. the general District Rates. Overall, the DR were much higher compared to the local rates in 2007, and although the difference became less in 2017, this is no guarantee for any future scenario. Material rates deviate largely between the two costing systems, especially the prices for local materials such as mountain stones and Sal wood. Location has a massive impact on the sourcing and costing of such materials. For instance, the distance between Makaikhola and Gahate is only 4 kilometers, but since Gahate owns a community forest and Makaikhola does not, it results in a big cost difference for the roofing phase between these villages. The DR do not reflect such variations at the micro level, but follow national trends and fluctuations of the global market prices. They are not representative for the actual situation in the hills and mountain areas, as they insufficiently address local factors such as availability of materials, accessibility to the site, or preferences of the villagers.
In 2017, the figures indicate that a school building in cement blocks with a steel roof has become the cheapest construction type for all three different contexts (group I–III). However, this may not be the case further up into the mountains, or in other districts, where transportation and distance to resources may be the critical factor. To rapidly determine which type is cheapest to build with in any village or setting, the Bill of Quantities for 8 different school types is summarized in Table 8, by listing the needed quantities of materials, wages, and transportation. These estimations give a very accurate representation (93–97%) of the actual construction costs for these particular designs, at any given time. Ultimately, the choice of construction is up to the villagers, who besides costing may take a lot of consideration into other factors such as location, accessibility, availability, custom, and preference as well.
The last chapter analyzes the price implications of adding or removing certain seismic features, such as better mortars, horizontal bands, and/or vertical reinforcements. Based on the 2017 local village rates, the total cost increase from an unreinforced building into a fully reinforced school is 55.4% for seismic improvements, with an addition of 29.6% for flooring and finishing, which amounts to 85.0% for rubble stone masonry, and to 54.7 + 38.2% = 92.9% for cement block masonry. In terms of seismic reinforcements, upgrading of the mortar quality in foundation and walls, and upgrading of the roofing system have the biggest impact on the cost increase. Adding of horizontal bands however (step 5) represents just about 1.5% (for rubble stone) to 3% (for concrete blocks) of cost increase per band on average. This is a very positive outcome as it means that the inclusion of these important seismic features is not that expensive, and that there is basically no financial obstacle to incorporate horizontal beams and stitches in new constructions of schools and houses. To put this further in perspective, the cost of plastering and painting (step 6b), which does not contribute to the seismic performance of the building, is more expensive than all possible horizontal and vertical reinforcements combined.
In theory, significant cost savings can be made by replacing rubble stone foundations with plum concrete foundations, cement mortar with mud mortar (highest cost impact), and reducing of reinforcing elements. However, it must be explicitly noted that this paper only examined possible cost implications, and that this paper gives no indication nor opinion about which construction type performs better during a seismic event. The authors acknowledge the fact that a full assessment, validation, optimization, and complementation of the existing knowledge involves in-depth scientific research through multi-disciplinary collaborations, and that this cost analysis is just one step of a more complex process. To address this, the authors have started an initiative by the name of SMARTnet, which stands for Seismic Methodologies for Applied Research and Testing of non-engineered techniques. The aim is to update the knowledge of traditional techniques in general, for which the rubble stone schools of SSF in Nepal will serve as a test case. A second aim is to make this knowledge understandable and available for engineers and non-engineers all over the globe, which hopefully creates renewed interest in countries that currently prohibit the technique as well.
This paper is the second in a series, which further includes a literature review of the current state-of-the-art of rubble stone masonry in seismic areas (Schildkamp and Araki, 2019), determination of realistic material properties of locally built rubble stone specimens, development of reliable test procedures for stone masonry, and methods for calculation and modeling of traditional techniques in general. SMARTnet invites experts, professionals, academics as well as final-year students in these fields to exchange their knowledge and to support the project with their time and expertise.
Author Contributions
MS collected all data, developed all drawings and estimates, prepared the comparisons and wrote the paper. YA checked all data and reviewed, revised and restructured the manuscript.
Funding
This work is supported by the Grant-in-Aid for Scientific Research (KAKENHI) of Japan Society for the Promotion of Science (JSPS) under grant number (B) 17H04592, as well as by the Dutch organization ArchiScienza; Fund for Architecture and Science. Their support is greatly appreciated.
Conflict of Interest Statement
The authors declare that the research was conducted in the absence of any commercial or financial relationships that could be construed as a potential conflict of interest.
Acknowledgments
The authors wish to acknowledge Mr. Damodar Bhakta Thapa, chairman of SEED Foundation, Kaski, Nepal, for his ongoing assistance with all administration, communication, training, construction, and supervision activities. Without him it would not have been possible to successfully execute the projects. The authors would also like to acknowledge all village construction committees and representatives of the villages, for providing the necessary feedback and costing data. Furtherly, the authors thank L. McCarton and Dr. S. Azhar for their invaluable feedback on the draft of this paper.
Footnotes
1. ^Available online at: www.xe.com/currencyconverter/ (accessed December 19, 2018).
References
Amnesty International (2017). Nepal: “Building Inequality” - The Failure of the Nepali Government to Protect the Marginalised in Post-Earthquake Reconstruction Efforts. London: AmnestyInternational Ltd.
Arya, A. S. (1970). “Earthquake resistant construction features in low cost buildings,” in International Symposia on Low Cost Housing Problems. 47.
Central Bureau of Statistics (2014). National Population and Housing Census 2011, Volume 06. Village Development Committee/Municipality, Kaski. Kathmandu: Government of Nepal, National Planning Commission Secretariat.
District Technical Office (2009). District Rate of Kaski 066/067 (in Nepali). Pokhara: Office of District Coordination Committee.
District Technical Office (2012). District Rate of Kaski 069/070 (in Nepali). Pokhara: Office of District Coordination Committee.
District Technical Office (2015a). District Rate of Kaski 072/073 (in Nepali). Pokhara: Office of District Coordination Committee. Available online at: http://ddckaski.gov.np.
District Technical Office (2015b). Approved District Rate 2072-073 Gorkha (in Nepali). Gorkha: Office of District Coordination Committee. Available online at: http://ddcgorkha.gov.np.
District Technical Office (2017a). Kaski District Rate for 2074/075 (Excluding VAT) (in Nepali). Pokhara: Office of District Coordination Committee. Available online at: http://ddckaski.gov.np.
District Technical Office (2017b). Gorkha District Rate for 2074/075 (in Nepali). Gorkha: Office of District Coordination Committee. Available online at: http://ddcgorkha.gov.np.
GFDRR (2016). What Did We Learn? The Shelter Response and Housing Recovery in the First Two Years After the 2010 Haiti Earthquake. Washington: The World Bank.
GOA-15-517 (2015). Haiti Reconstruction: USAID Has Achieved Mixed Results and Should Enhance Sustainability Planning. Washington: United States Government Accountability Office.
Government of Nepal (1968). Standard Measurement and Weight Act, 2025 (1968). Kathmandu: Nepal Bureau of Standards and Metrology (in Nepali).
Hausler, E. (2004). “Housing Reconstruction and Retrofitting After The 2001 Kachch, Gujarat Earthquake,” in Proceedings of the 13th World Conference on Earthquake Engineering (Vancouver, BC).
Housing Nepal (2014). Available online at: housingnepal.com/articles/display/cost-to-build-a-house-goes-through-the-roof (accessed December 5, 2018).
Housing Nepal (2009). Available online at: www.housingnepal.com/articles/display/steel-cement-prices-go-up (accessed December 5, 2018).
IS 13828:1993 (2008). Improving Earthquake Resistance of Low Strength Masonry Buildings – Guidelines (Third Reprint 2008 incl. Amendments nos 1. 2 and 3, Reaffirmed). New Delhi: Bureau of Indian Standards.
IS:10067-1982 (2005). Material Constants in Building Works, First Reprint 1997 (Reaffirmed 2005). New Delhi: Bureau of Indian Standards.
IS:7272-1974. (2005). Recommendation for Labour Output Constants for Building Work, Part I North Zone, Edition 1.1 (Reaffirmed 2005). New Delhi: Bureau of Indian Standards.
Jafarzadeh, R., Ingham, J., Walsh, K, Hassani, N., and Ghodrati Amiri, G. (2015). Using statistical regression analysis to establish construction cost models for seismic retrofit of confined masonry buildings. J. Construc. Eng. Manage. 141:04014098. doi: 10.1061/(ASCE)CO.1943-7862.0000968
Jayasuriya, S., and McCawley, P. (2008). “Reconstruction After a Major Disaster: Lessons from the Post-Tsunami Experience in Indonesia, Sri Lanka, and Thailand,” in ADBI Working Paper Series, no. 125. Tokyo: Asian Development Bank Institute.
Joglekar, P. (1997). Practical Information for Quantity Surveyors, Property Valuers, Architects, Engineers and Builders. Pune: P. T. Joglekar.
National Planning Commission (2015a). Nepal Earthquake 2015, Post Disaster Needs Assessment, Vol. B: Sector Reports. Kathmandu. Government of Nepal.
National Planning Commission (2015b). Nepal Earthquake 2015, Post Disaster Needs Assessment, Vol. A: Key Findings. Kathmandu: Government of Nepal.
NBC 202:1994. (2007). Mandatory Rules of Thumb for Loadbearing Masonry (V2.RV7, reprint). Kathmandu: Department of Urban Development and Building Construction.
Nidhiprabha, B. (2007). Adjustment and Recovery in Thailand Two Years after the Tsunami. Tokyo: Asian Development Bank Institute.
NRA (2018). 12 Rubble Stone School Designs in Nepal After the 2015 Earthquake. Available online at: http://www.moepiu.gov.np/downloads.php?id=5, last (accessed August 19, 2018).
Office of District Development Committee (2007). Dolidar Norms Rate Analysis (063/064). Obtained from District Administration Office in Pokhara.
Reuters (2008). Available online at: reuters.com/article/businesspro-steel-prices-dc/global-steel-prices-the-sky-is-the-limit-idUSL0887074020080225 (accessed December 5, 2018).
Roy, S., Khan, S., and Ishtiaq, S. (2013). Comparative cost analysis of possible seismic retrofitting schemes for multi-story unreinforced masonry building. Proc. Eng. 54. 584–590. doi: 10.1016/j.proeng.2013.03.053
Ruddock, L., Amaratunga, D., Wanigaratne, N., and Palliyaguru, R. (2010). Post-tsunami reconstruction in sri lanka: assessing the economic impact. Int. J. Strategic Proper. Manage. 14, 217–230. doi: 10.3846/ijspm.2010.16
Schildkamp, M. (2015a). Rules of Thumb for Building Safe Non-Engineered Buildings With Random Rubble Stone Masonry. Alphen aan den Rijn: Smart Shelter Research.
Schildkamp, M. (2015b). Rules of Thumb for Building safe Non-Engineered Buildings With Hollow Concrete Block Masonry. Alphen aan den Rijn: Smart Shelter Research.
Schildkamp, M. (2015c). Choosing the Right Materials, and Quality Control for Non-Engineered Earthquake Resistant Construction. Alphen aan den Rijn: Smart Shelter Research.
Schildkamp, M., and Araki, Y. (2019). School buildings in rubble stone masonry with cement mortar in seismic areas: literature review of seismic codes, technical norms and practical manuals. Front. Built Environ. 5:13. doi: 10.3389/fbuil.2019.00013
Spence, R., and Coburn, A. (1987). Reducing Earthquake Losses in Rural Areas. Final Report of Project R3662: Vulnerability of Low-Income Houses in Earthquake Areas. Cambridge: The Martin Centre for Architectural and Urban Studies.
Subedi, B., Ghimire, P., Koontz, A., Khanal, S., Katwal, P., and Sthapit, K. (2014). Private Sector Involvement and Investment in Nepal's Forestry: Status, Prospects and Ways Forward. Kathmandu: Multi Stakeholder Forestry Programme.
Subedi, J., Ghimire, R., Neupane, R., and Amatya, S. (2016). Cost difference of buildings in kathmandu constructed with and without earthquake safer features. Int. J. Disaster Resil. Built Environ. 7, 444–459. doi: 10.1108/IJDRBE-10-2014-0073
Sustainable Safety Solutions (2016). Available online at: ohsnepal.wordpress.com/2016/05/05/part-1-of-3-impact-on-construction-sector-businesses-in-nepal-due-to-the-gorkha-earthquake-2015-and-its-potential-implications-on-reconstruction/ (accessed December 5, 2018).
The Awkward Pose (2012). Available online at: theawkwardpose.com/2012/11/12/the-cost-of-construction/ (accessed December 5, 2018).
The Himalayan Times (2015). Available online at: thehimalayantimes.com/business/price-of-construction-material-could-witness-significant-hike-next-fiscal/ (accessed December 5, 2018).
The Post Disaster Recovery Framework (2016). Sector Action Plan (SAP) Rural Housing and Community Infrastructure. Kathmandu: National Reconstruction Authority, Government of Nepal.
Keywords: cost analysis, cost comparison, earthquake resistant schools, rubble stone masonry, concrete block masonry, Nepal
Citation: Schildkamp M and Araki Y (2019) Cost Analysis of Mountain Schools in Nepal: Comparison of Earthquake Resistant Features in Rubble Stone Masonry vs. Concrete Block Masonry. Front. Built Environ. 5:55. doi: 10.3389/fbuil.2019.00055
Received: 21 January 2019; Accepted: 11 April 2019;
Published: 30 April 2019.
Edited by:
Panagiotis G. Asteris, School of Pedagogical & Technological Education, GreeceReviewed by:
Tao Wang, China Earthquake Administration, ChinaHossein Derakhshan, University of Adelaide, Australia
Copyright © 2019 Schildkamp and Araki. This is an open-access article distributed under the terms of the Creative Commons Attribution License (CC BY). The use, distribution or reproduction in other forums is permitted, provided the original author(s) and the copyright owner(s) are credited and that the original publication in this journal is cited, in accordance with accepted academic practice. No use, distribution or reproduction is permitted which does not comply with these terms.
*Correspondence: Yoshikazu Araki, eW9zaGlrYXp1LmFyYWtpQG5hZ295YS11Lmpw