 Brett Commander
- Bridge Diagnostics, Inc., Louisville, CO, United States
Driven by advancements in technology, along with the ever-growing demands of our aging infrastructure, structural evaluation through testing has progressed from a number of research endeavors to a full-fledged industry. Guidelines for Non-Destructive Evaluation (NDE) methods, diagnostic load testing, and proof load testing were published by the American Association of State Highway and Transportation Officials (AASHTO) in 2003 and were largely shaped by the technologies that were available in the 1990s. While specifications in subsequent AASHTO bridge evaluation manuals have remained relatively constant over the last 15 years, commercial applications have sprung forth in all areas of field-based bridge assessment. Much of the development has revolved around inexpensive high-speed data acquisition, high-speed wireless communications, and the surge of cloud-based data management. The market of equipment and services has developed around three main camps; NDE, Controlled Load Testing, and Structural Health Monitoring (SHM), with each field having a variety of subcategories. For example, Diagnostic Load Tests and Proof Load Tests are the two primary forms of controlled load testing. Selection of the appropriate tools and methods to solve any bridge assessment is a function of what information is available and the required functional serviceability of the structure. In many cases, a combination of methods must be employed to achieve a complete assessment. As such, the lines between NDE, Load Testing, and SHM have blurred and have become increasingly integral gears of a larger machine. This article provides a history of the primary field bridge evaluation techniques and includes the driving forces in commercial development. Focus is placed primarily on diagnostic load test methodology; however, a variety of testing methods are outlined to illustrate the best tool for the job, along with the several pros and cons of various testing and monitoring methods. Finally, a glimpse into the future of bridge evaluation is provided based on current trends and emerging technologies.
Introduction
The history of bridge testing specifically and bridge evaluation in general is one of failure. Bridges have been the linchpin to human mobility for thousands of years and today are scattered throughout our vast infrastructure, ranging from grand sculptures crossing major rivers to culverts that go unnoticed by the drivers who cross them daily. While everybody appreciates the ability to quickly cross the various obstacles between here and there, very few people appreciate the efforts required in bridge design, assessment, or maintenance. That is until an epic bridge failure occurs, and people are injured and killed, at which point bridge condition is on everybody's mind and things change. The most infamous failure in US history was the collapse of the Silver Bridge over the Ohio River in 1967, killing 46 people. This tragedy spawned the National Bridge Inspection Program as part of the “Federal Highway Act of 1968” and the National Bridge Inspection Standards (NBIS) were established in 1971. This established inspection procedures, inspection frequencies, personnel qualifications, and reporting methods at a federal level and also required that states had to maintain bridge inventories.
A wide range of failures have occurred over the decades, which continue to shape inspection and evaluation techniques, and in turn provide the impetus for bridge research. The Manual for Inspection of Fracture Critical Bridge Members was the result of Connecticut's Mianus River Bridge collapse in 1983. The collapse of New York's Schoharie Creek Bridge in 1987 turned the attention to underwater inspection and scour. While the failures of large structures catch national attention and result in significant code and policy changes, a big concern for bridge owners has been the sheer volume of deteriorating inventory and limited funds for maintenance, repair, or replacement. The failure to plan by the communities and their transportation officials means a lot of bridges must remain in service, or roads must be closed if they cannot remain in service. Closed routes have a significant economic impact on commercial and public transport, which can very quickly escalate into a political issue, so even the small fails can create motivation for progress. As a result, the Federal Highway Administration (FHWA) funded numerous research projects through various funding mechanisms in attempt to more accurately evaluate bridges using field test activities. Three core physical evaluation methods emerged from the efforts which are outlined in the current AASHTO Manual for Bridge Evaluation (MBE): NDE; Load Testing; and SHM.
Public and political interests in bridge evaluation increase with each disaster and the continual decay of our infrastructure. At the same time, the structural instrumentation and testing market is being driven by implementation of new technology. Technologies from other business sectors, such as aerospace, medical, oil and gas, and the explosion of the Internet-of-Things (IOT), are being utilized by clever engineers for a wide range of condition and load response assessment. With every successful research activity, additional fuel is thrown into the emerging market by bringing in new investors and commercial products to the table. Combined public, political, and commercial pressure is finally pushing physical bridge evaluation methods out of research and into an actual industry. This is evident by the flow of money from government agencies for load testing, structural monitoring, and a variety of NDE projects that are geared toward emergency assessment, predictive maintenance, and asset management, rather than purely university research. Also evident is the change of players in the game; the big engineering firms are now tooling up with the latest gadgets and testing personnel and competing for statewide testing and monitoring contracts.
This article provides a brief history of the bridge testing market and outlines the primary testing methods utilized today. A glimpse into the future is also provided based on the research activities currently being performed and the new tech that researchers are playing with.
Historical Methods of Bridge Examination
The concept of load rating bridges goes as far back as 1941, where the Standard Specification for Highway Bridges (AASHTO, 1941) included provisions for evaluating existing structures. Load rating was a method to compute safe load limits for a specific vehicle and was a simple rework of the standard design equation (Equation 1). Whereas, for a safe design, a bridge component's capacity must be greater than all applied dead-load and live-load effects on that component, a Rating Factor (RF) for a component was computed as the ratio of the capacity available for live-load and the applied live load (Equation 2). This ratio was essentially the scale factor for a particular load that would be considered allowable to cross the bridge within design tolerances. A load Rating Factor >1.0 indicated the vehicle could cross the bridge without restriction and vehicles with rating factors <1.0 should not cross. This equation is still in use today with additional load and resistance factors to be consistent with current Load and Resistance Factor Design (LRFD) principles (Equation 3).
Where:
Φ Capacity reduction factor (Design code or additional condition reduction)
C Component Capacity (i.e., Axial force, moment, shear, etc.)
A1 Load Factor applied to dead load
D Dead load effect
A2 Load Factor applied to live-load
LL Live-load effect
I Impact or dynamic effect
RF Rating Factor (vehicle weight multiplier that can satisfy design equation)
Where:
C Component Capacity (i.e., Axial force, moment, shear, etc) = ϕc ϕs ϕRn
ϕc Condition factor; ϕs System factor; ϕ design resistance factor
Rn Nominal resistance as inspected
γDC Load Factor applied to structural component dead load effects
DC Dead load effect due to structural components
γDW Load Factor applied to wearing surface dead load effects
DW Dead load effect due to wearing surface
γLL Load factor applied to live-load effects
IM Impact or dynamic effect.
While the principles are sound, inaccuracies of load rating calculations can occur with existing bridges for a variety of reasons. Primary issues include the inability to determine component capacities due to unknown material specifications, unknown component conditions, and/or inaccurate calculation of load effects due to unrealistic structural analyses.
Bridge load capacity is typically estimated by some level of structural analysis, design code provisions, and the material specifications. However, when dealing with older structures, design calculations, and material specifications are often lost or no longer applicable due to deterioration. Furthermore, design calculations for nearly all bridges built prior to 2,000 were based on simplified analysis methods that were intentionally conservative and often have little resemblance to a structure's actual load response behavior. For example, the AASHTO Bridge Design code has always proposed that a bridge girder can be analyzed as a single beamline with a distribution factor (DF), which accounts for the portion of truck or lane-load carried by the individual beam. DFs are generally a function of beam spacing and type of bridge deck and are intended to be a simple design tool that produces conservative results for a wide range of construction methods. While a handy and inexpensive design method, DFs are often not a realistic analysis method to evaluate actual load paths of an existing bridge. As highway loads increased over the years, bridges were often posted or load restricted based on original design loads at the time of construction and a potential reduction to account for visual condition without any further analyses. Due to the economic cost of restricting traffic and frequent discrepancies between apparent condition and allowable load limits, the need for more accurate assessment became a high priority. This need for improved load rating accuracy has led to the practice of load testing bridges to determine realistic load capacities.
Controlled Load Tests
Several notable load testing programs were carried out in the late 1980s. Two of them were completed at the University of Colorado: “Simple Load Capacity Tests for Bridges to Determine Safe Posting Levels” sponsored by FHWA and the Pennsylvania Department of Transportation (Goble et al., 1990), and “Load Prediction and Structural Response” sponsored by FHWA (Goble et al., 1992). These projects incorporated controlled load tests and response measurements to provide field verified analytical models. The process was considered Diagnostic Load Testing as the goal was to diagnose bridge performance during the application of normal service loads and validate the accuracy of the analyses. During roughly the same period, a number of research projects were completed where bridges were loaded to failure (Burdette and Goodpasture, 1988; Bakht and Jager, 1992). This data provided the basis for defining appropriate Proof Load Tests procedures and specifications. Much of this work was then summarized by A. G. Lichtenstein in the National Cooperative Highway Research Program (NCHRP) Project, “Bridge Rating Through Non-destructive Load Testing” (Lichtenstein, 1998). This work produced the “Manual for Bridge Rating Through Load Testing” which became a significant portion of the AASHTO Manual for Condition Evaluation of Bridges in 1994. Two and half decades later, procedures for the two primary load test methods, diagnostic and proof load, are still presented with minimal updates in the current AASHTO (2018).
Regardless of the testing method, the primary objective of any load test is to obtain a more accurate load capacity assessment. Improved load rating accuracy is usually beneficial to the bridge owner and bridge users because it will, in most cases, yield greater capacity than simplified analyses based on conservative assumptions. Figures 1, 2 illustrate a typical load test and instrumentation procedures on a small access road. While simple calculations indicate the bridge had deficient load capacity and required posting, the bridge was in good visual condition. The purpose of the test was to measure the actual bridge performance, validate a more accurate structural analysis from which to generate load rating, and determine if the load posting could be removed.
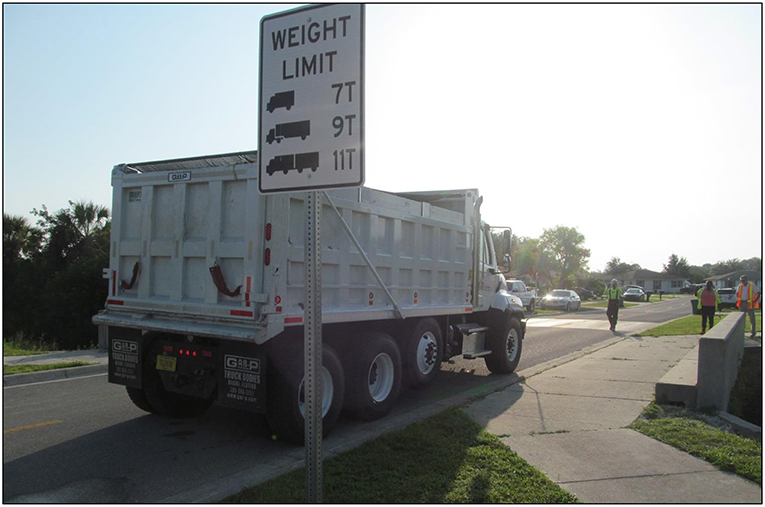
Figure 1. Controlled load test on a posted local access bridge.
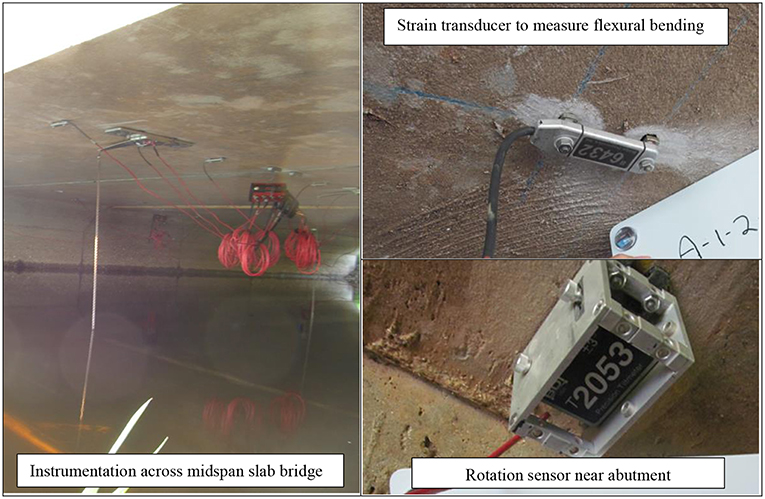
Figure 2. Instrumentation to capture displacement, rotation, and flexural strain.
Diagnostic Load Testing
Diagnostic Load Tests are described in the AASHTO MBE as a means to determine specific response characteristics of the bridge such as lateral load distribution and secondary stiffening effects and to validate the load rating analytical models. This type of test is generally performed with controlled load situations and a variety of sensors for measuring response performance, such as strain gages, accelerometers, displacement sensors, and highly sensitive rotation devices. Load applications are typically at legal loads or load levels known to be safe for a particular structure based on its observed history. The goal of a diagnostic test is not to test the load capacity directly, but to measure structural deformations for a set of applied load conditions. These measured responses are then compared with theoretical responses for the same applied load conditions. The data comparison is the basis for validating the theoretical model and defining how accurately the model simulates actual load paths.
A simple procedure is provided in the MBE to correlate diagnostic load test results with analytical results and thereby improve load rating results. This simplified method is commonly referred as the “K Factor” approach as it is based on an adjustment factor “K.” This factor is a function of the difference between measured and analytically predicted results. There are considerations for the magnitude of difference and the probable causes for the difference and to what extent those effects may be considered. While simple to apply, the approach is highly subjective and there are no real guidelines for verifying the cause for discrepancies between measured and calculated results. A major shortfall of this approach is that rating results are heavily skewed by how poorly the analysis represents the actual structure.
Integrated Approach
A more thorough diagnostic testing approach has been adopted by numerous agencies, researchers, and practitioners known as the Integrated Approach (Halfawy et al., 2002; Wipf et al., 2003). In this approach, the principal of diagnostic testing is the same in that the goal is to measure physical responses, compare responses with calculated values, and validate the analytical model. However, additional steps are taken to generate a realistic model through model calibration methods. The benefit of the Integrated Approach comes from the model calibration process, where the cause of the differences between measured and theory are identified and often quantified. For example, it may be observed that midspan moments are reduced by 30% due to the method of casting beam-ends into a concrete abutment. The rotational resistance of the beam end-conditions would be a parameter that is extracted from the structural identification. The engineer who must perform the load rating can then decide based on construction details and condition, if that end-condition should be utilized for load rating and to what extent it can be applied. As another example, load test and model calibration results may also show that steel guard rails attached to the edge of the bridge deck significantly influence lateral load distribution during the application of a relatively light test truck. Knowing that the influence of the guard rails could diminish with minor damage to the rails or that the rails could simply buckle with heavier load applications, the load rating engineer can simply choose to eliminate the effect within the model when load rating calculations are performed. Compared to the “K Factor,” the Integrated Approach gives the engineer additional information about the load response performance of the bridge and full control on how to apply load test results.
The ability to calibrate a structural model is the primary concept behind the Integrated Approach and this process is commonly referred to as Structural Identification (Yun et al., 2012). The goal is to obtain an accurate structure model that can be used to further evaluate the structure for a wide range of load conditions. The basis of comparison can be static and/or dynamic structural responses generated by a known loading condition. Static measurements are often global responses such as midspan displacement and girder rotation at an abutment or local member cross-section responses such as axial or flexural deformation obtained from strain measurements. Dynamic measurements usually consist of acceleration, which are further processed to generate structural mode shapes and natural frequencies.
Regardless of the method, the goal of structural identification is to solve numerous unknown structural parameters (variables) within a model until an acceptable match is obtained between the measured and model generated data sets. From the bridge engineer's perspective, the model parameters to be solved are those that influence transverse load distribution, longitudinal stiffness, and resistance of support conditions. However, the problem to be solved is usually one of uniqueness rather than simply accuracy. For example, if only a single displacement measurement were made at midspan of a bridge for a single load condition, it would be very easy to get an exact match from the model. The problem would be that an accurate match could be obtained from numerous combinations of model parameters. Modifications could be made to the beam stiffness, rotational resistance at the abutments, contribution of edge stiffening from parapets, or lateral load distribution from the deck. Any, or all of the parameters could be adjusted to the point of achieving the correct midspan displacement, hence the problem does not have a unique solution. In a perfect world of linear-algebra, the best-case scenario would be to have the same number of data comparison points as the number of optimization variables, then a unique solution would exist. With that concept in mind, instrumentation plans should be developed so that sensors are placed to specifically address every possible unknown structural stiffness parameter. However, everything involved in a structural load test has some level of uncertainty and error; the weight of the truck, the location of the truck, dimensions of the structure, and the precision of each measurement. Therefore, statistical measures must be employed rather than pure linear-algebra. The key to successful diagnostic load tests is to generate large data sets having a high-degree of relevance. The problem to be solved will therefore be an over determined set of equations, meaning there are more equations than unknowns. An exact solution is generally not possible, so advanced numeric methods are required to achieve a best fit. Much research has gone into this type of problem solving and there is a plethora of error-minimization tools available from numerous math libraries that can be applied to achieve best possible matches (Necati et al., 2013). Regardless if parameter adjustment is based on linear relationships, such as least squares, random selection through Monte Carlo simulations, or highly advanced machine learning algorithms, numerous analysis iterations will be required to achieve a model that accurately represents a real structure.
With the computational methods and processing horsepower readily available today, the method of solving structural identification parameters has become somewhat academic. The primary difficulty is generating a well-defined mathematical problem to start with. While generating a comparison or error minimization function, there are numerous modeling considerations including the need for realistic structure geometry, accurate load application (geometry, magnitude, and placement), realistic boundary conditions, and correct alignment between measurements and model response simulations. In addition, care must be taken with the selection of structural variables to identify. The variables must be relevant to the error function and multiple variables having identical influence cannot be assigned at the same time (Ziehl and Caicedo, 2012). As a simple example, solving for a beams material stiffness (E) and cross-sectional stiffness (I) would cause an error minimization routine to fail as the two variables have identical effects on the calculated results. An important limitation is that the analysis process must represent the actual responses. Only linear-elastic responses can be simulated by a linear-elastic model. In cases with one-directional supports or friction type resistance some level of error can be expected with a linear analysis method.
There are many different types of bridges with a wide range of construction techniques, so it is impossible to define set rules for instrumentation and diagnostic test procedures that cover all situations. Furthermore, the purpose of a load test can vary with each situation. A load test might be performed to evaluate whether a damaged section is still carrying load or to determine the performance of a repair. In most cases however, the goal is to obtain an accurate assessment of load transfer throughout the structure for the purpose of an accurate load rating. In these cases, it is important to first define whether a load test would likely be beneficial at all. For example, load testing a twin-girder bridge to assess the girder load rating would generally be of little benefit since very little is unknown about the load paths. Simple analysis of the girder loads should in most cases produce accurate results. The benefit of diagnostic load testing generally increases with the complexity of the structure geometry and the degree of static indeterminacy. The more load paths that exist, the more complex the analyses, and the more potential for a simple analysis to produce incorrect results. Bridges with many beam lines and substantial curbs have complex lateral load distribution and therefore often benefit from a load test. Even though simple reinforced concrete slabs are considered simple structures, load paths in a slab can be very complex so a load test and a refined analysis often result in significantly improved load ratings.
Complex support conditions, such as beam-ends embedded into a concrete abutment wall, present a case where load tests can be beneficial. The degree of end-restraint on a beam can have a dramatic influence on the midspan moment, therefore accurate assessment of the beam bearing conditions through a load test can significantly influence a bridge's load rating. A caveat to this, is whether any significant end-restraint can be considered from a load rating perspective. For example, if a beam's roller bearing is locked due to corrosion and debris, a load test may reveal a significant reduction in the beam's midspan moment due to the unintended end-restraint. However, this occurrence should be eliminated from any load rating analysis as it would not be considered a reliable or consistent resistance.
Span length is another consideration with regards to the load test benefit. In the case of load rating, diagnostic load tests are most applicable to short and medium span bridges where the weight of a single vehicle can have a significant influence on the structure. With exception to floor-system components such as stringers and floor-beams, load tests would be very impractical, and expensive to perform on a long-span bridge. Furthermore, there would be little gain as load ratings of long-span structures are generally not vehicle specific. Controlling live-load configurations for a long-span bridge are nearly always distributed lane-loads.
General procedures have been developed to define test specifications for a given bridge type and ensure accurate results. The first step is to identify the general load paths and unknown parameters associated with those paths. Load test plans are then developed with the intent to provide enough instrumentation to capture load distribution associated with those various parameters. This means it is necessary to examine all information available and determine what is known and what is not accurately known with regards to structural performance prior to defining instrumentation plans. For a typical slab on girder bridge composed of several beam-lines, the primary load rating concern is often flexural moment of the longitudinal girders near midspan. Following is a general description of the minimum instrumentation requirements to achieve an accurate and unique model using parameter identification techniques. This is further illustrated by the instrumentation plan in Figure 3 which depicts the plan and cross-section views of a reinforced concrete T-beam bridge with numerous beam lines and beam bearings embedded into the abutment wall.
• A pair of strain gages near midspan—Strain gages should be at different heights within the girder cross-section to measure flexure and locate the position of the neutral axis.
• Measure flexure from all girders—measurements should be made on all girders near the midspan cross-section to capture load distribution of the bridge deck.
• Flexure should be measured at two additional cross-sections along the span length. The other locations do not need to be at high moment regions, their purpose is to capture the flexural shape of the girder, or essentially the shape of the moment diagram.
• Rotation measurements are also very helpful in identifying the degree of continuity over a pier or the rotational resistance of a girder bearing.
• Global measurements such as midspan deflection are also useful when they can be feasibly obtained.
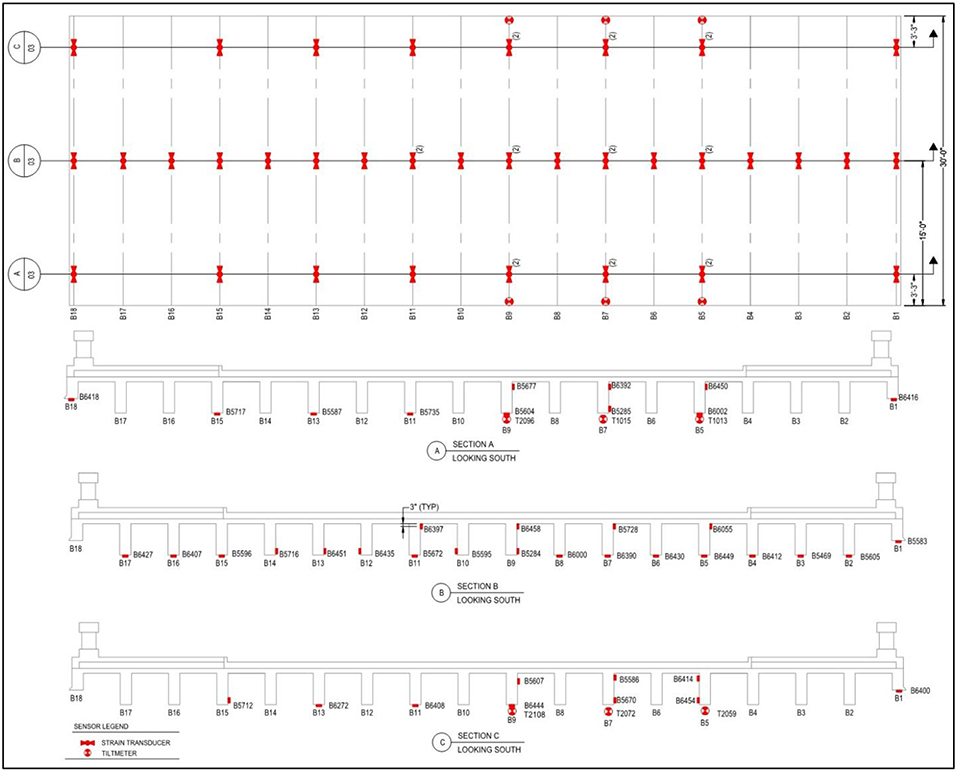
Figure 3. Instrumentation plan for a multi-beam RC T-Beam bridge.
Another way to improve data relevance is to provide measurements at each sensor for a wide range of applied load conditions. When responses are generated through multiple load paths, they help identify stiffness parameters of components between the sensor location and the applied load. The easiest way to obtain data for numerous load conditions is by measuring structure responses with moving loads rather than static truck positions. In addition, several different vehicle paths should be applied. Performing load tests with moving loads can be very efficient and minimize impact on traffic, but it requires that truck position be monitored and recorded along with all the structural responses. A very important concept of the Integrated Approach is an apples-to-apples comparison of data. Therefore, a convenient method for extracting field data for specific truck positions corresponding to the simulated load cases from the model must be available. The point of the load test is to provide direct comparison of responses for many sensor locations and many different load cases.
The result of the load test is a series of response histories that can be presented as a function of load position as shown in Figure 4. In the data plots the solid lines represent the measured data and the markers show the computed data resulting from discrete analyzed truck positions. Here measured and computed strain histories are shown from three locations on a single beam resulting from a single truck crossing. Through examination of the plot, it is easy to see the flexural relationship between the three locations and it is obvious that when maximum midspan moment is obtained, significant negative moment was generated at the beam ends. It is important for the engineer to use visual references to validate response comparisons and model calibration results. However, a best fit model can only be obtained when a computer can perform several thousand of these comparisons with numerous truck positions and numerous relevant instrumentation locations. This example is based on quasi-static data, a similar approach is often done by comparing mode shapes and frequency responses throughout the structure.
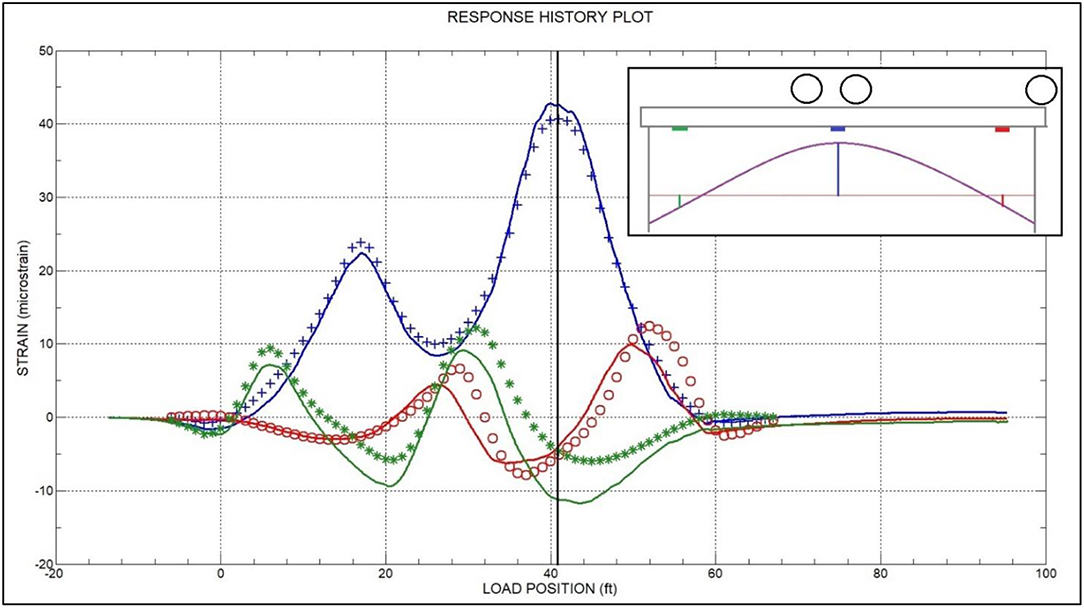
Figure 4. Measured and computed strain histories at three locations on a single beam-line.
While the concept of diagnostic load tests is simple, implementation can be a relatively complex process requiring specialized components and detailed procedures. Installation of numerous sensors on the bridge requires skilled technicians and engineers with proper safety training who can operate lifts or hang from ropes. The sensors and data acquisition must be rugged, completely weatherproof, and be easy to use in the field. Fast deployment of test equipment often requires wireless transmission in cases of moveable structures or difficult access. Beyond the field work, significant computer and software resources are required to perform the structural analysis and model calibration. Realistic modeling tools are required and there is an enormous amount of bookkeeping to correlate the vast amount of measured and computed data. In a properly defined optimization procedure, there are thousands of data points to be compared for each analysis run. The number of data points used in the apples-to-apples comparison can generally be considered as the number of sensors multiplied by the number of analytical truck positions (load cases). Computer run times can be significant because parameter optimization methods are an iterative process associated with each variable, so the number of analysis cycles can run into the hundreds or thousands depending on the number of variables to solve.
Beyond the load test and structural identification, the final step of the Integrated Approach is to transform results into a load rating. Prior to performing load rating analyses, the model calibration must be checked and validated against realistic values. Therefore, it is important to understand reasonable or allowable limits that a parameter could have. For example, it would not be reasonable to allow the elastic modulus of a concrete member to increase above a realistic value. In cases where best fit matches are obtained with unrealistic structural properties, it generally means additional parameters need to be accounted for in the model, or a modeling error needs to be eliminated. Knowledge of structural design, a high level of structural analysis expertise, and experience with load test data are therefore required along with a good selection of instrumentation tools.
The field portion of diagnostic load tests are relatively inexpensive to perform because they can be done quickly, with minimal impact on traffic, and with readily available vehicles. A legally loaded dump-truck is typically used as the test vehicle, and instrumentation is installed in temporary fashion which can usually be installed in a day with a small crew. Actual tests occur with brief road closures or moving blockades to minimize conflicts with the traveling public. Roughly half the cost of diagnostic load tests is in the engineering associated with the detailed FEA analyses and load rating calculations.
The primary limitation of a diagnostic load test is that it does not completely address all parameters of the aforementioned load rating equation. In general, diagnostic load tests provide the information to ensure a model realistically captures the live-load (LL) demand and in some cases dynamic studies can be performed to define impact (I). Dead-load (DL) effects must be calculated and the engineer must understand how the structural behavior may be different for resisting dead-load and live-load applications. The potential deficiency is that diagnostic load tests cannot directly deal with the component capacities (C). Typically, the capacity side of the equation is addressed through information in the design drawings, the material specifications, and the standard code provisions. However, this requires that the design or as-built structural and material details must be available, which is sometimes not the case with older bridges. Hence, while diagnostic load tests usually result in accurate structure models, it is only applicable to the end-goal of load rating when component capacity information is available.
Comparison With Proof Load Testing
Proof Load Testing is also outlined in the AASHTO MBE and is described as a test method for determining the maximum safe load capacity of a bridge. As the name implies, the load capacity is proved, or disproved by the physical test. The primary concept is based on incrementally increasing load on a structure until a target load is reached, or some form of distress or non-linear behavior is observed. Target loads are based on a desired allowable load limit and a required minimum factor of safety, which is a function of structure type, redundancy, condition, level of inspection and traffic volume. Other considerations are if the load test is to validate a permit load or determine posting limits.
Instrumentation and data acquisition equipment are similar to those used for diagnostic testing; however, placement of sensors is typically focused on points of maximum response or points of potential failure (Moussa and Shahawy, 1993). The goal is not to characterize the responses throughout the structure but determine if responses at controlling locations reach maximum limits or verify that they remain linear with respect to load magnitude.
A primary difference from diagnostic tests is the magnitude and application of loads. Load magnitudes are applied incrementally so that linear response behavior can be checked throughout the test procedure. By nature of the incremental loading, proof load tests are generally applied statically so that response stability can be observed during each phase of load. In addition, the final load conditions are generally well-above what a normal vehicle can carry. Load magnitudes are often more than 50 percent greater than design or legal loads because the target load must include a desired factor of safety and the effects of dynamic amplification. In some cases, test loads are applied with blocks, sandbags, water-bags, special loading vehicles, or custom load frames (Lantsoght et al., 2017).
Proof load tests have one significant benefit over diagnostic load testing in that a maximum load limit can be determined directly from the tests. A detailed analysis is not required, although they may be performed to provide estimated responses at each load stage. Capacity calculations are generally not performed either, as the reason for a proof load test is usually that capacity calculations cannot be completed due to lack of design, or as-built information.
Cost of proof load tests may be significant due the transportation and application of the test loads. However, since detailed analyses are not required, the overall cost may not be significantly more than a diagnostic test. Impact on traffic however will be considerably greater with a proof load test because the bridge will be closed for the duration of the test procedure and if the bridge crosses another road, the road below would also have to be closed.
Another consideration is the potential for damage and reduction of service life when performing proof load tests. Since the applied loads will very likely be much greater than the bridge has previously experienced, new cracks in concrete components are likely to occur and existing cracks will open wider. Termination of a proof test occurs when the target load has been reached or signs of distress or measurable non-linear behavior are observed. The very concept implies that the test may reach the non-linear range of the bridge and induce some level of distress. Observation of non-linear responses can only occur after the fact and it is not always easy to detect the early onset. Therefore, a higher risk is associated with proof tests compared to diagnostic load tests. For this reason, proof tests in the United States are usually performed by or supervised directly by the agency responsible for the bridge.
Related Services—Non-destructive Evaluation Methods and Structural Health Monitoring
While not the focus of this article, NDE techniques are another key component in bridge testing. A wide range of NDE technology is available to evaluate component and material conditions and are outlined in the NBI Bridge Inspection Manual (2012). As of 1971, visual and hands-on inspections have been the primary methods for bridge condition evaluation. This will continue to be the case for generations to come, however additional tools have emerged in bridge inspection to address what cannot be seen. A variety of energy wave or chemical based non-destructive evaluation tools are utilized to provide images of what is beyond the exterior surface of a material.
In general, the goals of most NDE procedures are to identify the material properties and condition so that component durability and capacity can be realistically defined. This is necessary for the cases where design information is not available, or the condition of the material has likely altered the material properties so that the design values are no longer valid. In the case of concrete structures, Ground Penetrating Radar (GPR) is frequently used to detect invisible defects such as voids and delaminations as well as to measure the location of reinforcing steel. Rebound hammers, impact echo devices, and pullout testing methods are geared toward providing reasonable estimates of, or at least consistency of, concrete strength. Identifying reinforcing details and concrete strength are vital to the computation of concrete member capacities. The majority of steel NDE methods are geared toward detection and measurement of cracks and thereby can have a significant impact on component strength and conditions factors. NDE results are paramount in identifying future repair and maintenance needs and solving for one of the key factors in the load rating equation. Inspection and NDE techniques often provide the information required to solve for component capacity (C) but they do not address structural response issues. Therefore, NDE procedures are often performed alongside diagnostic load testing applications to obtain information required to fully address all aspects of an accurate load rating.
Another onsite service that is closely related to load testing is SHM. As with NDE, SHM is not the focus of this paper but is mentioned here because there has been significant growth in the monitoring market, and it has driven much of the new technology implementation. While there are a wide range of monitoring methods and monitoring goals, the instrumentation and data acquisition equipment used for SHM is generally similar in concept to load test equipment. Both activities require measuring and capturing various forms of structural deformation. However, testing and monitoring are generally considered different activities. A primary difference is that load testing is usually based on controlled load application whereas SHM is designed to capture responses due to cyclic and random load events. The more significant difference is the duration SHM equipment is typically installed on a structure and the cost ramifications associated with long-term monitoring. Due to the need for permanent power, conduit for wiring, remote communications, and protection for sensors SHM projects tend to be many times more expensive than short-term load tests. Because of the cost factors, greater reliability requirements, and the need for more intelligent data collection, a lot of research and development has gone in to sensors and data acquisition for the SHM market. The result is an influx of durable and power efficient sensors as well as data logging equipment that work well as monitoring tools as well as load test equipment.
Even though SHM and load testing are considered different activities with significantly different goals and budgets, the lines between the two activities have blurred due to the similarities in measurement equipment. With improvements in electronic efficiency and intelligent data acquisition, load test equipment can now be left onsite for several weeks after a controlled test and collect data due to live traffic or other random dynamic events during that period. With this type of system, the best of both worlds can be achieved through short-duration monitoring without the cost associated with permanent installation. Depending on the monitoring goals, a few weeks may be enough time to address the questions at hand such as frequency responses or stress cycle counting for fatigue analyses.
New Technologies
New technologies have emerged in all areas of evaluation and testing methods including controlled testing, monitoring, and NDE. Improvements in the NDE arena are largely due to faster sampling and processing along with better sensing elements. Most NDE tools are based on the measurement of some form of energy moving through and reflecting within a material. Accuracy of time-based measurements continue to get better and the ability to translate return signals into images will continue to produce more clear and detailed pictures. Likewise, load testing and monitoring equipment is improving along the same lines with improved performance at a lower cost.
One emerging technology that is having a significant impact on instrumentation is digital imaging and it is likely that digital image correlation (DIC) equipment will be among the biggest game changers with regards to future instrumentation for controlled testing, long-term monitoring, and condition assessment. Improvements in camera resolution, frame speed, and the ability to process images faster will make DIC a serious competitor to nearly all discrete measurement devices. It has already become a major player in capturing large scale movements such as pier rotation, span deflection, and monitoring of crack movement and crack growth (Khatereh et al., 2012). At the smaller scale, technology already exists such that DIC can be used to capture deformation at the micro-strain level, however at this time it is relatively expensive compared to strain gages and the frequency response rate is limited.
Cameras will continue to get better and more affordable, but the greatest potential improvement of DIC is in software and ease of use. Digital imaging has the potential to replace numerous discrete sensors because it is possible to detect changes in rotation, displacement, and relative movement between points. But the ability to retrieve that information is currently very custom and requires a programmer with advanced knowledge of the DIC software and monitoring equipment software. As this software becomes more flexible and easier to use, power of image-based measurements will be in the hands of the user rather than the developer. This will greatly expand the ability to integrate digital image results with other monitoring data. As more people can utilize digital imaging technology, the DIC monitoring market share will greatly expand in the instrumentation world.
A Glimpse into Future Bridge Testing
Electronics, sensor technology, and software will continue to improve which will make various aspects of each bridge evaluation method easier, less expensive, and generally better. While arguments will continue as to which evaluation method is best for a certain set of conditions, the greatest benefit to overall bridge assessment will be the integration of multiple technologies. Combining features of NDE, diagnostic load testing, and proof load testing could potentially provide the best load capacity evaluation for a wide range of bridges. Take for example, a post-tensioned concrete box girder bridge where as-built plans are missing or there is concern the bridge was not built according to specification. While this seems to be an isolated case, it is relatively common in regions that have experienced severe flooding, agencies that have been victims of computer hacking, or regions that have been influenced by war and regime change. Even in the modern era, records get lost and things don't get built according to specifications. For this situation, realistic structural evaluation would rely on determination of structure condition, component strength, and accurate assessment of load distribution.
With missing or uncertain information regarding reinforcement and post-tension stressing details, there is no method to compute girder strength limits from which to derive truck weight limits. What could be reasonably determined however, are serviceability limits of the structure; essentially what loads can be applied to the structure without inducing damage or non-linear responses. Obtaining these limits would be beneficial because serviceability is defined by AASHTO as a valid limit state and in many cases a conservative estimate of strength capacity can be extrapolated once service limits are known. For pre-stressed and post-tension concrete bridges, serviceability-based load limits are defined so that the allowable truck loads would not induce cracks in the pre-stressed concrete members. Neither diagnostic or proof load tests would be suitable to determine the load limits for this situation. Conventional proof load testing would certainly induce cracks into the PS/C girders which would usually be considered an unacceptable method by the bridge owner. Diagnostic load testing would measure performance at the applied test loads but not provide any indication as to how the bridge would perform at higher loads or what the effective factor of safety would be for legal traffic loads. NDE procedures alone would also be inadequate to address load rating, as it is generally impossible to determine the amount of post-tension steel, or existing post-tension force. In general, NDE procedures do not address performance issues. However, using all of the technologies together could be utilized to obtain a realistic load capacity.
The futuristic solution would be a combination of diagnostic and proof testing procedures to load a bridge up to its serviceability limit without inducing any damage to the structure or cause any reduction to service life. New NDE techniques would also be employed prior to and during the load tests to estimate a serviceability limit and identify when the serviceability limit was being approached. To achieve this outcome, relatively minor improvements of NDE methods or improved utilization of existing techniques could be employed. One potential method would be to measure in-situ concrete stress at controlling locations. In the case of a PS/C box girder, the measured in-situ stress would include the initial post-tension stress, dead-load stress, and all elastic and inelastic losses in post-tension stress resulting from creep and shrinkage. If an in-situ stress could be accurately measured, this would provide a direct calculation of the serviceability stress-limit available for live-load. While a number of research projects have made headway on this concept (Ruan and Zhang, 2015; Michael and Pessiki, 2016), the effort has not been sufficient to generate standards such that the approach can be used on a routine basis with a quantifiable level of certainty. Thus, an area for further research and future standardization.
In addition to identifying in-situ stress, additional measurement techniques could be employed to determine when a serviceability limit was reached as the applied live-load was incrementally increased. The goal here would be to identify the onset of micro-cracking which would indicate the live-load stresses have overcome compression stresses due to post-tensioning and the concrete has approached its tensile stress limit. Theoretically, the onset of micro-cracking can be identified through a number of procedures. A few of the possible methods are acoustic emissions; high-resolution imaging; and measurable shifts in wave transmission speed. Micro-crack detection methods would be applied during the course of controlled load applications and conventional instrumentation procedures commonly used in diagnostic and proof load tests. The end goal of the procedure would be to obtain a realistic model of the bridge and determine the loading and component stress changes associated with a serviceability limit. The use of incremental load increases is a concept taken from proof load testing, while instrumentation throughout the bridge would be required for model calibration as is the basis of diagnostic load testing. The integration of NDE techniques to identify serviceability limit states during the test procedures would allow for a complete load rating solution without inducing damage to the structure.
While the above scenario would provide acceptable load limits, there would still be a lack of as-built plans and some level of uncertainty for long-term performance. Therefore, continued SHM may be warranted to examine performance over time. Parameters to track would typically be changes in stress in critical regions, changes in deflection, identification of crack activity, and identification of corrosion and steel strand breaks. Future technologies will increase the ability to perform these tasks at an acceptable price.
Conclusions
The primary point of this paper is that capabilities in instrumentation, electronics, and computing technology have improved exponentially in the last 30 years while the load testing specifications and largely the thought processes behind testing have remained unchanged. It is time to recognize that many of the codified procedures were based on the technologies available at the time and that there may be better ways to solve the problems at hand. The overall questions to be answered are still the same, “What is the load capacity of this bridge?” What has changed are the tools and methods for addressing the unknowns that make the question difficult to answer. Given that technology will continue to advance, attempting to update the MBE to today's technology, codify specific test methods, and analysis procedures would be a futile effort. Rather the code should provide a range of recommended options for a range of load rating issues along with defining required standards for qualifications, certifications, record keeping, and reporting. Results of any load tests must ultimately be certified by the Responsible Engineer which implies a sufficient level of care will be taken, however it does not mean that level of care will be consistent. While exact procedures will be specific to the load test and cannot be codified, minimum standards can be defined for processes and documentation. This exercise will fall upon the researchers and practitioners to work in the appropriate committees within the Transportation Research Board and other agencies to provide a workable document.
Another concept addressed is that a single technology, or testing process is often not sufficient to address the entire problem at hand. Combinations of load test methods, NDE, and monitoring may be required to characterize structural performance, define component capacities, and evaluate the long-term reliability of the assessment. Therefore, testing methods should not reside in isolated camps when all test methods are essentially part of the same industry. This again will require collaboration between the industry researchers and practitioners to provide manuals and instructions on how best to solve common bridge assessment problems.
Author Contributions
This manuscript was written entirely by BC and is based on his 30 years of load testing experience and his vision of the future load testing market.
Conflict of Interest Statement
BC was employed as a research assistant by the University of Colorado in 1988-1989 and has been employed by Bridge Diagnostics, Inc. from 1990 to 2019.
References
AASHTO (2018). The Manual for Bridge Evaluation, 3rd Edn., American Association of State Transportation Officials.
Bakht, B., Jager, L. G. (1992). Ultimate load test of slab-on-girder bridge. ASCE J. Struct. Eng. 118, 1608–1624.
Burdette, E. G., Goodpasture, D. W. (1988). Correlation of Bridge Load Capacity Estimates with Test Data. NCHRP Report.
Goble, G. G., Schulz, J. X., Commander, B. C. (1990). Simple Load Capacity Tests for Bridges to Determine Safe Posting Levels. Report to Pennsylvania Department of Transportation and Federal Highway Association, University of Colorado.
Goble, G. G., Schulz, J. X., Commander, B. C. (1992). Load Prediction and Structural Response. Final Report, University of Colorado and Federal Highway Administration.
Halfawy, M., Wipf, T., Wood, D., Ahmad, A.-H., Phares, B. (2002). “Bridge load rating using an integrated load testing and finite element analysis approach: a case study.” in 4th Structural Specialty Conference of the Canadian Society for Civil Engineering (Montréal, QC).
Khatereh, V., Oats, R. C., Harris, D. K., Ahlborn, T. M., Brooks, C. N., Endsley, K. A., et al. (2012). Evaluation of commercially available remote sensors for highway bridge condition assessment. J. Bridge Eng. 17, 886–895. doi: 10.1061/(ASCE)BE.1943-5592.0000303
Lantsoght, E., Cor, V., Ane, B., Dick, A. H. (2017). State-of-the-art on load testing of concrete bridges. Eng. Struct. 150, 231–241. doi: 10.1016/j.engstruct.2017.07.050.
Lichtenstein, A. G. (1998). Bridge Rating Through Non-destructive Load Testing. National Cooperative Highway Research Program (NCHRP) Project 12-28(13)A.
Michael, J. M., Pessiki, S. (2016). Experimental study of the core-drilling method for evaluating in situ stresses in concrete structures. J. Mater. Civil Eng. 28:2. doi: 10.1061/(ASCE)MT.1943-5533.0001294
Moussa, A. I., Shahawy, M. A. (1993). Dynamic and static tests of prestressed concrete girder bridges in Florida. Technical Report. Structural Research Center at the Florida Department of Transportation. Tallahassee, FL. Available online at: https://fdotwww.blob.core.windows.net/sitefinity/docs/default-source/content/structures/structuresresearchcenter/final-reports/dynamic-and-static-tests-prestressed-concrete-girder-bridges-in-florida.pdf?sfvrsn=35489a35_0
NBI Bridge Inspection Manual (2012). “NBI Bridge Inspector's Reference Manual,” in U.S. Department of Transportation - Federal Highway Administration, Publication No. FHWA NHI 12-049.
Necati, Ç., Kijewski-Correa, T., Aktan, A. E. (2013). Structural Identification of Constructed Systems: Approaches, Methods, and Technologies for Effective Practice of St-Id. American Society of Civil Engineers
Ruan, X., Zhang, Y. (2015). In-situ stress identification of bridge concrete components using core-drilling method. Struct. Infrastruct. Eng. 11, 210–222. doi: 10.1080/15732479.2013.862729
Wipf, T. J., Phares, B. M., Klaiber, F. W., Wood, D. L., Mellingen, E., Samuelson, A. (2003). Development of Bridge Load Testing Process for Load Evaluation, Iowa State University Final Report. Iowa DOT Project TR-445, CTRE Project 00–65.
Yun, Z., Prader, J., Weidner, J., Dubbs, N., Moon, F., Aktan, A. E. (2012). Structural Identification of a deteriorated reinforced concrete bridge. J. Bridge Eng. 17, 774–787. doi: 10.1061/(ASCE)BE.1943-5592.0000309
Keywords: diagnostic load test, proof load test, non-destructive evaluation, load rating, structural health monitoring
Citation: Commander B (2019) Evolution of Bridge Diagnostic Load Testing in the USA. Front. Built Environ. 5:57. doi: 10.3389/fbuil.2019.00057
Received: 15 November 2018; Accepted: 18 April 2019;
Published: 08 May 2019.
Edited by:
Joan Ramon Casas, Universitat Politecnica de Catalunya, SpainReviewed by:
Tianyou Tao, Southeast University, ChinaMatthew Yarnold, Texas A&M University, United States
Copyright © 2019 Commander. This is an open-access article distributed under the terms of the Creative Commons Attribution License (CC BY). The use, distribution or reproduction in other forums is permitted, provided the original author(s) and the copyright owner(s) are credited and that the original publication in this journal is cited, in accordance with accepted academic practice. No use, distribution or reproduction is permitted which does not comply with these terms.
*Correspondence: Brett Commander, Y29tbWFuZGVyQGJkaXRlc3QuY29t