- 1Applied Computing and Mechanics Laboratory (IMAC), School of Architecture, Civil and Environmental Engineering (ENAC), Swiss Federal Institute of Technology (EPFL), Lausanne, Switzerland
- 2ETH Zurich, Future Cities Laboratory, Singapore-ETH Centre, Singapore, Singapore
- 3Civil and Environmental Engineering, Carnegie Mellon University, Pittsburgh, PA, United States
Sensor-based occupant tracking has the potential to enhance knowledge of the utilization of buildings. Occupancy-tracking strategies using footstep-induced floor vibrations may be beneficial for thermal-load prediction, security enhancement, and care-giving without undermining privacy. Current floor-vibration-based occupant-tracking methodologies are based on data-driven techniques that do not include a physics-based model of the structural behavior of the floor slab. These techniques suffer from ambiguous interpretations when signals are affected by complex configurations of structural and non-structural elements such as beams and walls. Using a physics-based model for data-interpretation enables deployment of sparse number of sensors in contexts of non-uniform structural configurations. In this paper, an application of physics-based data interpretation using error-domain model falsification (EDMF) is presented to track an occupant within an office environment through footstep-induced floor vibrations. EDMF is a population-based approach that incorporates various sources of uncertainty, including bias, arising from measurements and modeling. EDMF involves the rejection of simulated model responses that contradict footstep-induced floor vibration measurements. Thus, EDMF provides a set of candidate locations from an initial population of possible occupant locations. A sequential analysis that accommodates information from previous footsteps is then used to enhance candidate locations and identify trajectories among candidates. In this way, incorporating structural behavior in interpreting vibration measurements induced by occupant footsteps has the potential to identify accurately the trajectory of an occupant in buildings with complex configurations, thereby providing tracking information without undermining privacy.
Introduction
Occupant-tracking applications using footstep-induced floor vibration measurements have the potential to increase the safety and comfort of building residents. For example, this approach provides knowledge of occupancy to enable optimal use of energy without undermining the privacy of occupants. Such sensor-based systems have promising applications in thermal-load prediction for energy management, hospital and old-age accommodation facilities, security enhancement, and fire rescue. In addition, occupant detection and localization can be used to improve a general understanding of occupant behavior and enhance utilization of buildings.
Current studies of sensor-based occupant detection and localization methodologies have involved costly equipment that required invasive deployment and regular maintenance. Commonly used approaches employed either radio-frequency devices or optical sensors. Radio-frequency systems, such as wearable devices, smartphones (Fierro et al., 2012; Lazik et al., 2015), and built-in radio frequency beacons (Alhmiedat et al., 2013; Purohit et al., 2013; Xu et al., 2013), have been used to localize and quantify indoor occupants. Radio-frequency devices require low levels of ambient acoustic noise and depend on a highly instrumented infrastructure (Bekkelien et al., 2012). In sparsely instrumented infrastructure, radio-frequency device-based approaches have not been able to accurately track occupants in buildings, owing to multi-path problems that are induced by the ambient environment and resulted in radio signals reaching the receiving antenna by more than one path (Lam et al., 2016). Wearable devices based on radio-frequency systems are intrusive and require occupants to carry permanently connected devices (Pan et al., 2014).
Many buildings have been equipped with optical sensors for occupancy detection and tracking. For instance, passive-infrared sensors are used as motion detectors for liveability control systems to detect human activities inside a room to control lighting and heating, ventilation and air-conditioning systems (Lu et al., 2010; Erickson et al., 2013). Near-infrared sensors are utilized for occupancy monitoring as well as medical diagnostics (Huang et al., 2003). Cameras are used to map the indoor environment (Henry et al., 2012) as well as to track occupants to estimate the level of occupancy and study the behavior of occupants (Kamthe et al., 2009; Bamis et al., 2010). Stochastic-process-based approaches using Markov chains have been proposed to enhance identification of occupant movements between sections of a simulated building (Kamthe et al., 2009; Erickson et al., 2011, 2013). Markov properties have also been used to assess the probability of the state of occupancy in several buildings (unoccupied or occupied and awake or sleeping residents; Lu et al., 2010). Localization using optical sensors requires clear lines of sight and large angles of coverage (Narayana et al., 2015). Video-recording devices and, to a lesser extent, motion sensors undermine the privacy of people (for example cameras in rooms of patients and offices). Moreover, these devices potentially influence the behavior of occupants in work environments.
Occupant detection and localization have been performed using floor vibrations induced by human footsteps (Richman et al., 2001). Using floor vibrations to detect and localize occupants does not undermine the privacy of occupants. Vibration-based occupant detection and localization has the potential to reduce the number of sensors and to overcome the limitations related to optical sensors, such as clear lines of sight and a large angle of coverage. Time-Difference-of-Arrivals (TDoAs) of footstep-induced floor vibrations at multiple sensors are utilized to provide an estimation of the occupant location (Pakhomov et al., 2003; Schloemann et al., 2015; Lam et al., 2016; Mirshekari et al., 2016). To date, the most common strategy has been to analyze signals in the absence of a structural behavior model. Such model-free approaches involve processing and analyzing vibration measurements and require at least three sensors with overlapping coverage where occupants could be localized (Mirshekari et al., 2018). In other studies, dispersion observed for wave propagation through the floor as well as low signal-to-noise ratio of footstep-induced floor vibrations have led to distorted signals and uncertain localization results. Thus, additional sensors were required to increase the accuracy of occupant detection and localization (Bahroun et al., 2014; Pan et al., 2014, 2015, 2016). Moreover, complex structural configurations that contained structural and non-structural elements such as walls and beams have limited the applicability of model-free occupant localization approaches (Mirshekari et al., 2018). Such obstructions affected the wave propagation, thus resulting in a source of ambiguity that compromised occupant localization.
This paper proposes an alternative strategy that is based on coupling measurement information from vibration sensors with structural-behavior models. Information from physics-based models can help overcome limitations of existing methodologies. However, combining structural simulations with measurement interpretation involves accommodating multiple sources of uncertainties such as model imperfection and sensor resolution and precision. Error-domain model-falsification (EDMF) (Goulet and Smith, 2013) is a population-based approach that is applied in this paper to account for such uncertainties. EDMF provides robustness for inverse problems in the presence of important uncertainties, including systematic modeling bias. EDMF is most useful when typical assumptions of traditional Bayesian model updating (independent zero-mean Gaussian distribution of uncertainties) cannot be made (Pai et al., 2018). EDMF has been successfully applied to more than fifteen full-scale systems (Smith, 2016) including structural identification (Goulet et al., 2013), leak detection in water-supply pipes (Moser et al., 2015), wind simulations (Vernay et al., 2015), fatigue life evaluation (Pasquier et al., 2014, 2016; Pai et al., 2018), and post-seismic building assessment (Reuland et al., 2019).
The paper starts with a description of the model-based data-interpretation methodology for occupant tracking in section Methodology. A full-scale case-study description for occupant tracking is presented in section Case-Study Description. Dynamic signal processing of footstep-induced floor vibration measurements is discussed in section Vibration-Measurement Analysis. System parameters for the finite element simulations of footstep impacts are described in section Numerical Simulation Using a Physics-Based-Model. EDMF and a sequential analysis that accommodates information from previous footsteps is then used for trajectory identification. Finally, this paper closes with a summary and discussion in section Summary and Discussion.
Methodology
Model-based occupant tracking incorporates information about structural behavior through physics-based models to infer occupant locations from footstep-induced floor vibration measurements. Using measurement data, the localization of the identified footstep events is treated as an inverse problem. Uncertainties such as variation in floor vibrations measured for footstep impacts at same locations lead to ambiguities that make occupant tracking through vibration measurements a challenging task. The proposed occupant-tracking strategy is composed of three parts: vibration-measurement processing to detect and process signals related to footstep events, generation, and processing of model predictions through simulations and model-based data-interpretation using error-domain model falsification to infer occupant trajectories.
A representation of the steps involved in occupant-tracking strategy is shown in Figure 1. To start, ambient-vibration measurements are recorded on the slab in absence of any occupant. Processing the ambient vibrations reveals the fundamental frequencies of the structure that are used afterwards for wavelet decomposition of footstep-event signals. Detection thresholds are defined as three standard deviations (3σ) of un-processed ambient vibrations (see Figure 1). Each footstep impact generates cyclic vibrations that do not overlap with the next footstep impact. Thus, each footstep-event signal is independent. When exceedance of the detection thresholds occurs at one sensor, a footstep event is detected and a signal window (length equal to duration of a single footstep) is extracted at all sensor locations. Each footstep event signal is processed using wavelet decomposition (Ford, 2003; Mirshekari et al., 2018) in order to explore their low-and-high frequency components. Morlet wavelet (Lin and Qu, 2000) is used as the mother wavelet in the continuous wavelet transform (CWT) due to its shape similarity to the footstep impact signal. CWT compares a recorded signal with the chosen mother wavelet through changing scaling factors in order to decompose the signal in the time domain. Subsequently, each scale contains signal information in this domain. Reconstruction of the signal corresponding to a specific frequency range is performed by combining information contained at the corresponding scales. In this study, the metric that is adopted for occupant localization is the delta amplitude (Δamp) at various frequency ranges, which is the difference between maximum and minimum amplitudes of a footstep-event signal (see Figure 1). Based on a pre-study of measurement data, Δamp provides better characterization of velocity data with impact locations than various other metrics such as maximum and minimum amplitudes, maximum and minimum amplitude ratios, and root-mean-square calculations of footstep-event signals.
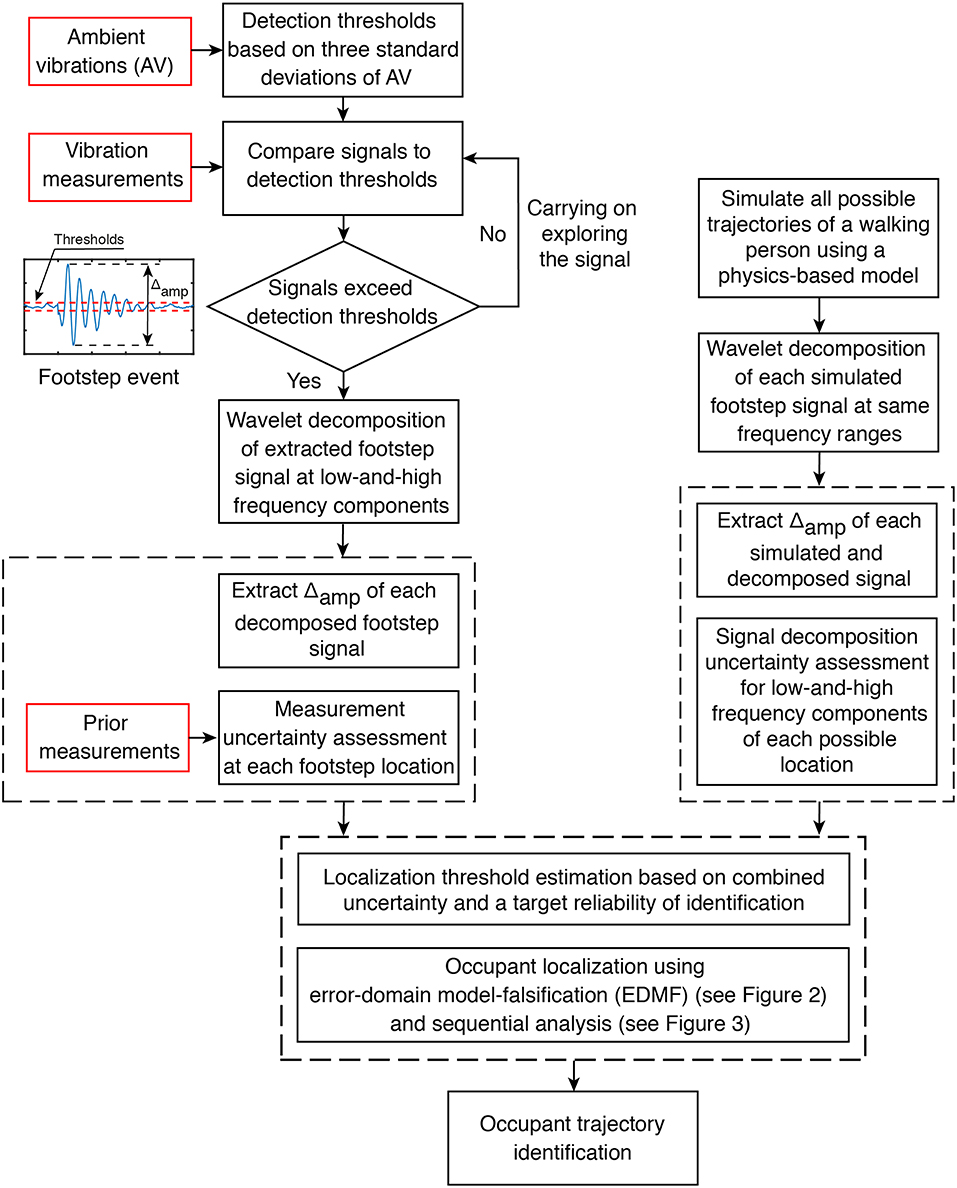
Figure 1. Footstep events are detected when measured vibration amplitudes exceed detection thresholds. Simulations are compared with measurements using error-domain model-falsification (see section Error-Domain Model-Falsification). Candidate locations are then tested for sequential analysis (see section Sequential Footstep-Localization Analysis). Finally, trajectory identification process is carried out to infer occupant trajectories from candidate location sets.
Occupant-tracking methodology uses a physics-based model of the slab to update the knowledge of the occupant locations from vibration measurements. Since footstep-event signals are found to be independent from the consecutive footstep event, each footstep-impact simulation is carried out separately at predefined possible locations. Similar to footstep-event vibration measurements, low-and-high frequency components of the simulated footstep signals are extracted using wavelet decomposition. In this paper, a finite-element model is used for predictions, as discussed in the case study section (see section Numerical Simulation Using a Physics-Based-Model).
Model predictions and measurement data are prone to various uncertainties. The model-based data-interpretation approach using error-domain model-falsification (EDMF) (see section Error-Domain Model-Falsification) explicitly incorporates uncertainties from various sources that include model simplifications and secondary parameters (such as material properties and stiffness of support conditions). Measurement uncertainties include sensor resolution and precision as well as variation in measured vibrations from a person walking along the same trajectory multiple times. Ten prior measurements of a walking person at all possible footstep locations are recorded in order to estimate measurement uncertainty at each possible location. Uncertainty estimation for both vibration measurements and model predictions is thoroughly discussed in section Uncertainty Estimation.
Uncertainty sources are subsequently combined using the Monte-Carlo sampling scheme. For each possible footstep-location, thresholds are computed based on the combined uncertainty and a target reliability of identification. Using EDMF (see section Error-Domain Model-Falsification) a set of candidate locations that are compatible with measured signals is obtained for each footstep event. Assuming that successive footstep events do not exceed a pre-fixed step length, a sequential analysis (see section Sequential Footstep-Localization Analysis) is applied in order to enhance the precision of the set of candidate locations of each footstep event. Finally, assuming that a person walks continuously until reaching destination without stopping or going backwards, trajectory identification is carried out based on candidate location set of each footstep event.
Error-Domain Model-Falsification
EDMF has been inspired by the logic of scientific discovery (Popper, 1959), which asserts that in science, models cannot be completely validated by data; they can only be falsified. Unlike traditional model-based data interpretation approaches such as residual minimization and Bayesian model updating, model falsification provides accurate solutions to inverse problems that are ill-conditioned due to the presence of important measurement uncertainties, including systematic modeling errors and unknown correlations between measured locations (Tarantola, 2006; Fernández-Martinez et al., 2013; Pasquier and Smith, 2015).
Model falsification involves the generation of multiple-model instances that are falsified when the prediction instances contradict measurement data. The initial model population is generated using possible ranges of parameter values. Simulated instances are compared with the structural response in order to identify candidate models among the initial population.
Assuming that gi(θ) is the predicted structural response at measurement location i where θ is the vector of model parameter values, corresponding to footstep location coordinates in this application. The model response (Δamp of footstep-impact simulation signal at various frequency ranges) is subjected to many sources of uncertainty including model fidelity, geometric simplifications, material properties, and boundary conditions. Most of these uncertainties are intrinsically systematic with unknown correlations between measurement locations. εmod, i denotes the combination of all these uncertainties at each measurement location. The vector of measured structural responses at sensor location i is denoted as yi. Measurement uncertainty εmeas, i is associated with each measurement location. As shown in Equation 1, the true (unknown) structural response Qi at a measurement location i equals either the sum of model prediction with true parameter values θ* conditioned by model uncertainty or the sum of measurement conditioned by measurement uncertainty.
In Equation 1 m denotes the total number of measurement locations. Equation 1 may be rearranged as:
where the residual between the model prediction and measurements is equal to the combined uncertainty at a measurement location, εc, i. In a probabilistic approach, these errors εmod, i, εmeas, i and εc, i are represented as random variables denoted as Umod, i, Umeas, i and Uc, i, respectively. Contribution from structural parameters that are not intended to be updated are incorporated as well in the combined uncertainty Uc.
Uncertainties are combined using Monte-Carlo sampling. Thresholds Thigh, i and Tlow, i are calculated using the combined uncertainty Uc, i and a target reliability of identification ϕ ∈ {0, 1}, as shown in Equation 3.
where fUc, i is the probability density function (PDF) of the combined uncertainty Uc, i at sensor location i. The target reliability of identification ϕ is adjusted using the term 1/m, called as Šidák correction (Šidák, 1967) to maintain a constant level of confidence when several sensors are used for measuring the structure response. In structural engineering, a target reliability of identification value of 0.95 is commonly used.
Regarding occupant-tracking applications, the residual at each measurement location is calculated as the difference between footstep-impact model simulations and footstep-induced floor vibration measurements. Based on an initial location set, model instances whose residuals lie outside the thresholds are falsified, as illustrated by Equation 4.
Figure 2 illustrates the error-domain model-falsification methodology, in which threshold boundaries are defined using the combined distribution of uncertainties and a target reliability of identification. Since the application of this paper is occupant tracking, the initial model instances correspond to all possible location coordinates of an occupant inside an office environment (see initial location set in Figure 2). Thus, all model instances whose residuals lie inside the thresholds at each sensor location are accepted and form the candidate model set (Goulet and Smith, 2013; Goulet et al., 2013). These candidate models correspond to the candidate location set that include the real location of a footstep event (see real footstep location in Figure 2). Candidate location sets are generated for each footstep event. Due to the lack of information of the true uncertainty distributions, all candidate models are treated as equally probable.
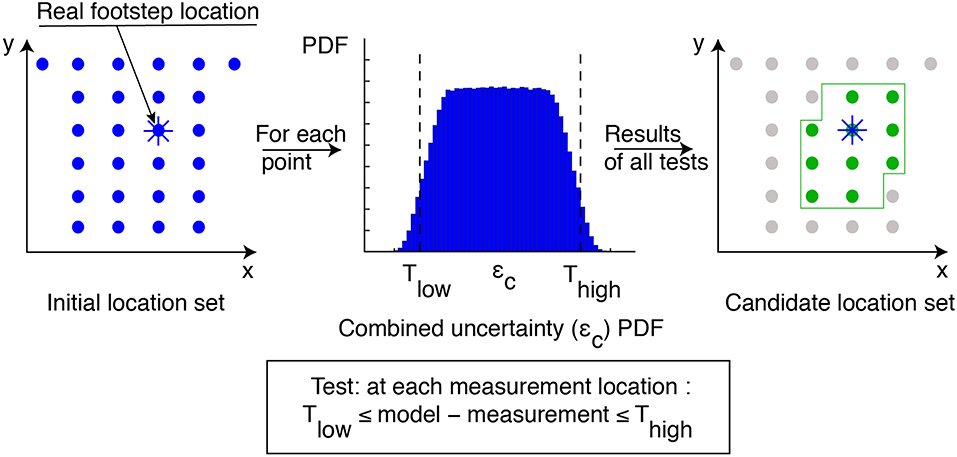
Figure 2. Trajectory identification using error-domain model-falsification starts with an initial location set. Model simulations are compared with measured response in order to identify candidate locations among the initial population. Threshold boundaries are derived from combined uncertainties. Model instances are falsified when the residual value between simulations and measurements exceeds thresholds at any sensor location.
Sequential Footstep-Localization Analysis
Sequential analysis for footstep localization assumes that a person walks continuously with a fixed step length without stopping or going back suddenly. These assumptions are tested for all candidate locations of each footstep event that result from model falsification. Thus, if the difference between candidate footstep locations for two consecutive footstep events exceed a pre-defined step-length, then those candidate locations are falsified.
Figure 3 contains an explanation of the sequential analysis. Candidate location set at each footstep event identified using EDMF (see section Error-Domain Model-Falsification) are further reduced using information from the previous footstep event. Each candidate location at footstep event k + 1 (squares and diamonds in Figure 3) is compared with all candidate locations at previous footstep event k (dots in Figure 3). If the minimum distance between a candidate location at position k + 1 and the candidate locations at position i is higher than the pre-defined maximum distance between two footsteps, the candidate location at position k + 1 is falsified (diamonds in Figure 3). Assuming that a person carries on walking until reaching their destination, information from previous footstep events reduces the size of the resulting candidate-location sets. Candidate-location set of each footstep event are subsequently used for identification of occupant trajectories (see section Model-Based Occupant-Tracking Results).
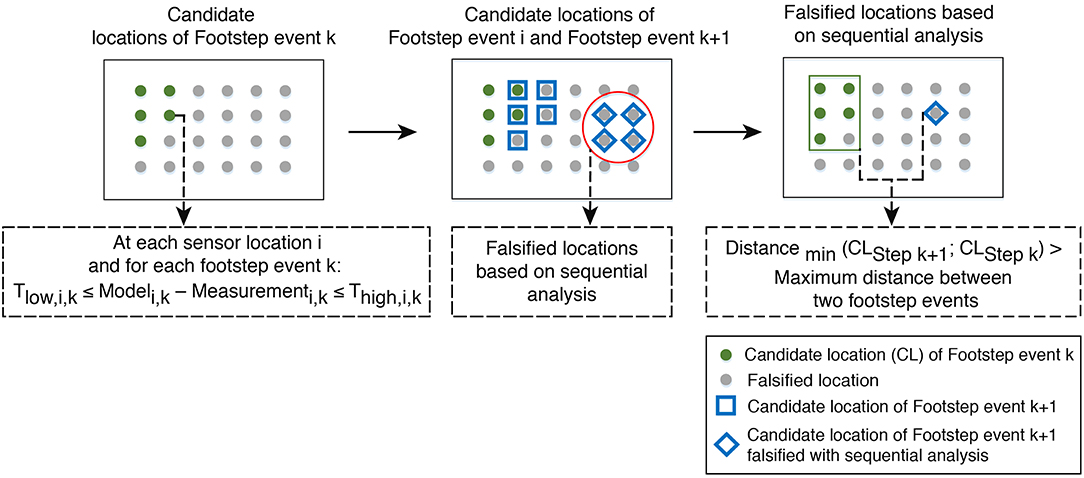
Figure 3. Sequential analysis is applied for each candidate location set of each footstep event resulting from EDMF. Based on information from the previous footstep event, sequential analysis reduces the population of the resulting candidate locations.
Case Study of Model-Based Occupant-Tracking
Case-Study Description
Model-based occupant tracking is applied to a continuous reinforced-concrete slab supported by steel beams. The slab is located in an office environment at the applied computing and mechanics laboratory (IMAC) on the EPFL campus. The initial occupant-location set includes a corridor and four offices (Offices A, B, C, and D in Figure 4), and covers a surface of ~100 m2.
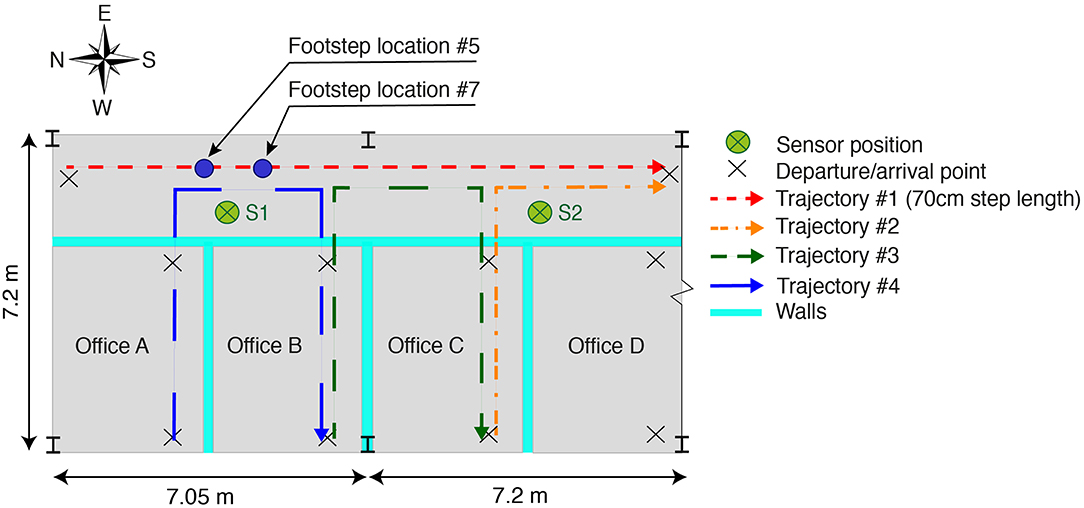
Figure 4. Offices A, B, C, and D as well as the corridor are considered for occupant tracking (~100 m2). The corridor and each office contain two departure/arrival points for trajectories. Trajectories #1, #2, and #3 are used for occupant tracking using model-based approaches (see Figures 9–11). Trajectory #4 is measured prior to the localization tests in order to assess measurement uncertainty (see Figure 8). Footsteps #5 and #7 are used to demonstrate the limitation of occupant localization using model-free approaches (see Figure 14).
The reinforced-concrete slab is 20 cm thick with linoleum-based floor covering. The steel frame at the structure boundaries of the tested part of the slab is composed of one H-beam (height of 330 mm) on the north end, two I-beams (height of 450 mm) on the west end, and one H-beam (height of 390 mm) on the east end. The slab rests on 11 I-beams (330 mm high). Six steel columns support the tested part of structure. Several non-structural walls made of plasterboard are underneath and above the structure. The west end of the slab is connected to prefabricated structural walls made of reinforced concrete with an unknown connection type. The east end is free. The south end of the slab is connected to the remaining part of the laboratory and the north end is joined to a structural masonry wall with an unknown connection type.
Measurements are taken using two vibration sensors (Geophones SM-24 by I/O Sensor Nederland bv) with a sampling rate of 3,000 Hz. Both sensors are placed above the slab with ~7 m spacing in the longitudinal direction. They are positioned close to the office walls (see Figure 4) in order to avoid a longitudinal beam that connects columns at the east end. Vertical velocity responses of the structure are recorded simultaneously through an acquisition unit (NI PCIe-6259).
The corridor and each office contains two potential departure/arrival points (see Figure 4), thus forming 82 possible trajectories (assuming that trajectories between points inside a same office are not considered). Model-based occupant tracking is tested on three trajectories #1, #2, and #3 in Figure 4. The first trajectory starts from the north end of the corridor and ends at the south end. The second trajectory starts from the west end of Office C and leads to the south end of the corridor. The third trajectory goes from the west end of Office B to the west end of Office C. One-person (~90 kg in mass) walked along trajectories #1, #2, and #3 (see Figure 4) three times at a walking frequency of 1.6 Hz to validate the proposed model-based occupant tracking strategy. Prior to the test walks, vibrations from various trajectories (for instance, trajectories #1 and #4 in Figure 4) are measured in order to have at least ten signals for all possible footstep locations. These prior measurements are used to quantify measurement uncertainty.
Vibration-Measurement Analysis
Footstep-induced floor vibrations are characterized as non-stationary signals (Mirshekari et al., 2018). Thus, CWT is proposed to compare footstep impact signals with a mother wavelet based on various scaling in order to decompose the signal in the time domain. The Morlet wavelet is used as mother wavelet due to its shape similarity with the footstep impact signal. Based on prior signal processing of ambient-vibration measurements, the dominant frequencies of vertical slab vibrations are found to be around 24 Hz. In order to capture the first modes of the structure, low-frequency components using wavelet decomposition of footstep-induced floor vibrations are extracted for the frequency range of [20, 40] Hz. High-frequency components have been used for impact localization on structural health monitoring applications (Park et al., 2012). Given the bandwidth of the vibration sensors, high-frequency components of footstep-induced floor vibrations are extracted in the frequency range [150, 200] Hz. Amplitudes in this range have empirically shown best sensitivity to footstep-impact locations.
Figure 5 presents the difference between maximum and minimum amplitudes (Δamp) at low-and-high frequency ranges for footstep-event signals at various impact locations. For each detected footstep, a data window with a length corresponding to the duration of one step (1/1.6Hz = 0.625s) is extracted. For each footstep-impact location of a walking person, following trajectory #1 as well as trajectory #4 (see Figure 4), the value of Δamp shown in Figure 5 corresponds to the mean value over 10 prior measurements (not used for localization). Figures 5A,C illustrate low-frequency components for trajectories #1 and #4, where Δamp values are found to be governed by the fundamental mode shapes of the structure. In Figure 5A, Δamp values show a growing trend until reaching a maximum at mid-span between columns for both sensors S1 and S2 (see Figure 4) and a decreasing trend in accordance with column positions close to footstep locations #1 and #20 as well as between footstep locations #10 and #11. In Figure 5C, Δamp values increase when footstep-impact locations are approach the corridor.
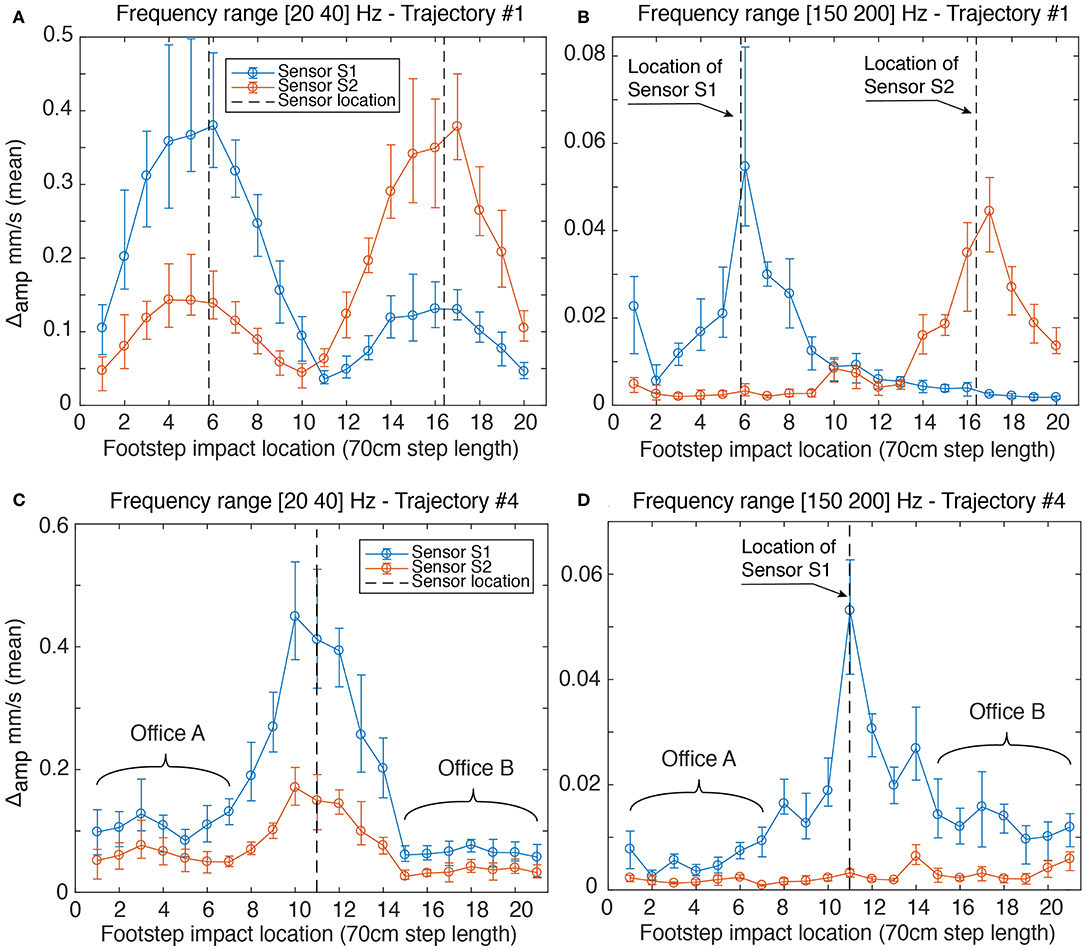
Figure 5. Wavelet decomposition of footstep signals between: (A) 20 and 40 Hz and (B) 150 and 200 Hz for trajectory #1 (see Figure 4) and between: (C) 20 and 40 Hz and (D) 150 and 200 Hz for trajectory #4 (see Figure 4). Bars represent the range between minimum and maximum values of 10 prior measurements and circles correspond to the mean values.
High-frequency components of footstep-impact locations are shown in Figures 5B,D for trajectories #1 and #4. Δamp values in Figure 5B contain peaks close to sensor locations (see Figure 4) and show a decreasing trend when the positions of footstep impacts move away from sensors. However, an exception in the trend is the footstep location #1, which can be due to stepping hard in the first step of the walk. In addition, high frequency components of impact signals inside Offices A and B in Figure 5D do not provide information of footstep impact positions. Thus, footstep-impact locations cannot be distinguished between offices. Such information can be due to local structural modes.
It is concluded that low-frequency components of impact signals are dominated by global structural effects and high-frequency components of impact signals are dominated by impact positions and local structural effects. As highlighted by Figures 5B,D, high-frequency components of a sensor configuration with two sensors in the corridor provide ambiguous and imprecise results for footstep-impact locations, specifically due to low signal amplitudes inside offices and close to columns. Therefore, in this situation, information from low-frequency components, which reflect the structural behavior are also taken into account for occupant localization.
Numerical Simulation Using a Physics-Based-Model
Model falsification involves using structural behavior of the slab to infer occupant positions from footstep-induced measurements. Unlike measurement-driven methods, EDMF explicitly includes physical principals that involve specific material properties, geometry and boundary conditions. As for footstep-induced measurements, each footstep-event signal is considered to be independent. Therefore, the possible footstep positions that define the initial model population are simulated separately. Each footstep-impact signal of a measured trajectory is then compared with model predictions in order to provide a set of candidate locations.
Model Predictions
In this study, model predictions are obtained using a finite-element model of the slab using ANSYS (APDL, 2010; total of 36,250 elements). The floor slab is modeled using shell elements (SHELL181) and beams are modeled as beam elements (BEAM188). Full connection between beams and slab is assumed. Due to incomplete knowledge of boundary conditions, the slab is modeled as simply supported in the north, south, and east ends. Also, columns are modeled as simple supports. Office walls (walls in Figure 4) are modeled using translational springs in the vertical direction (COMBIN14). The spring stiffness is estimated based on a prior sensitivity analysis, resulting in a s-shaped function of the fundamental frequency as a function of spring stiffness. Taking the average stiffness value between freely supported and completely fixed, the stiffness of the spring is 1,600 N/mm. The elastic moduli for the steel and the concrete slab are taken to be 210 and 35 GPa.
Linear modal superposition is used to calculate the dynamic response. The footstep-impact force is applied on a single node as a function of time. The footstep-impact load function is divided into two phases: contact phase during which the foot is in contact with the floor and swing phase during which the other leg is swinging for the next footstep impact (Racic et al., 2009). For the sake of simplicity, only the contact phase is considered in this paper. Within the contact phase, the first event initiates with a heel contact during which the full weight is applied to the ground and this is denoted as footstep full-weight duration for the purposes of this study. Afterwards, the second event of the contact phase ends with a toe-off of the foot. Therefore, the impact-load function is modeled as succession of two sine functions, reflecting the two contact phase events, that start with non-zero slope and ends with zero-slope as illustrated in Figure 6.
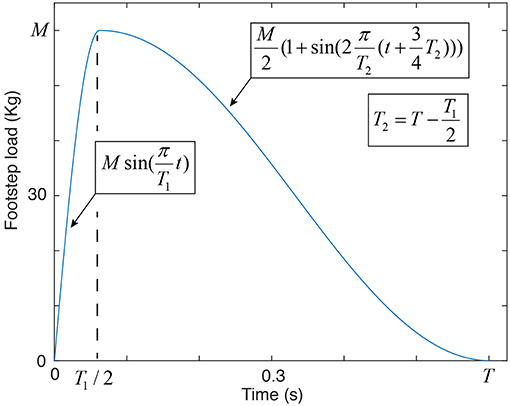
Figure 6. The footstep-impact load function is conceptualized as a succession of two sine functions. M describes the weight of a person. The first period T1 defines the contact phase, during which, the full weight is applied to the ground. The second period T2 is related to the toe-off of the foot.
Within this case study, the position of the person for each event is taken to be the parameter to be identified. In addition to primary parameters of footstep locations, ranges of values for footstep full-weight duration, person weight, and viscous damping are sources of secondary parameter uncertainty that are not identified and thus, contribute to the combined uncertainty calculations. In addition, due to lack of information on the nature and the influence of the floor-covering material ranges of values for person weight and viscous damping (implemented as constant stiffness-proportional damping ratio in the analysis) are estimated conservatively. Finally, modeling uncertainties are intended to cover this effect. Similar to footstep-induced floor vibration measurements, simulated footstep-impact signals are then processed using wavelet decomposition in order to extract low-and-high frequency components for frequency ranges of [20, 40] and [150, 200] Hz.
Uncertainty Estimation
Model predictions and measurements are prone to multiple sources of uncertainty. Model uncertainties include unknown secondary parameters and boundary conditions as well as global model fidelity. Model and measurement uncertainties are assumed to follow uniform distributions (instead of more informed probability distributions) due to the lack of information that is typical in occupancy detection and localization.
Model uncertainty due to secondary parameters is taken into account by varying values of parameters that are not updated: occupant weight [50–90] kg, footstep full-weight duration [0.02–0.08] s, and viscous damping ratio [1–7] %. The finite-element model involves multiple simplifications, such as modeling beams with one-dimensional elements and using shell elements for the concrete slab. Simulation simplifications also include idealized boundary conditions (rotation free) and the use of translational springs to model non-structural walls separating offices. In addition, the finite-element model contains multiple omissions such as office furniture and corridor railings. The footstep impact load-function is applied to a single node in simulations and thus, the uncertainty is further increased. The overall simplifications and omissions are estimated to result in a uniform model-uncertainty distribution of [−15, +25] % based on engineering judgement and heuristics (Pai et al., 2018; Proverbio et al., 2018; Reuland et al., 2019).
Low-frequency components are estimated to be more affected by global structural modes (see Figure 5) as well as by the applied load-function (having only low frequency components) than high-frequency components, where local modes are dominant. Since the applied load-function of a footstep impact is composed of two sine functions (see section Model Predictions) that are defined by a low frequency components, the interaction between applied load and structural response is more important at low-frequency ranges. This results in over-estimating velocity amplitudes at low-frequency components and under-estimating amplitudes of velocity at high-frequency components. In addition, the natural period of the structure falls within the range of values for the footstep impact duration, which increases velocity amplitudes at low-frequency components. Therefore, based on engineering judgment and observation of model simulations, additional uncertainties following a uniform distribution of up to [−50, 0] % for low-frequency components and up to [0, +40] % for high-frequency components increase the modeling uncertainty. As local structural modes are more prominent in high-frequency ranges, the position of the sensor and the footstep impact have a higher influence on prediction results. This increased uncertainty is accommodated by adding [−10, +10] % to the modeling uncertainty related to high-frequency components.
Physics-based model simulations contain additional uncertainties that are related to the exact frequency values used for wavelet decomposition when comparing footstep impact simulations with measurements. Signal decomposition uncertainty is estimated for all possible footstep impact locations and at each sensor position.
Figure 7A presents the absolute signal-decomposition uncertainties at low-and-high frequency components for Sensor S1 and corresponding to all possible footstep locations. The signal-decomposition uncertainties at low-and-high frequency components are estimated by taking the difference between simulated footstep signal components at various frequency ranges with the reference components at frequency ranges [20, 40] and [150, 200] Hz of the simulated signal. Each frequency range is taken in a way to preserve the same amount of scales that define the reference decomposition ([20, 40] and [150, 200] Hz). These frequency ranges lay between 16 and 48 Hz for low-frequency components (see Figure 8A) and between 126 and 271 Hz for high-frequency components (see Figure 8B).
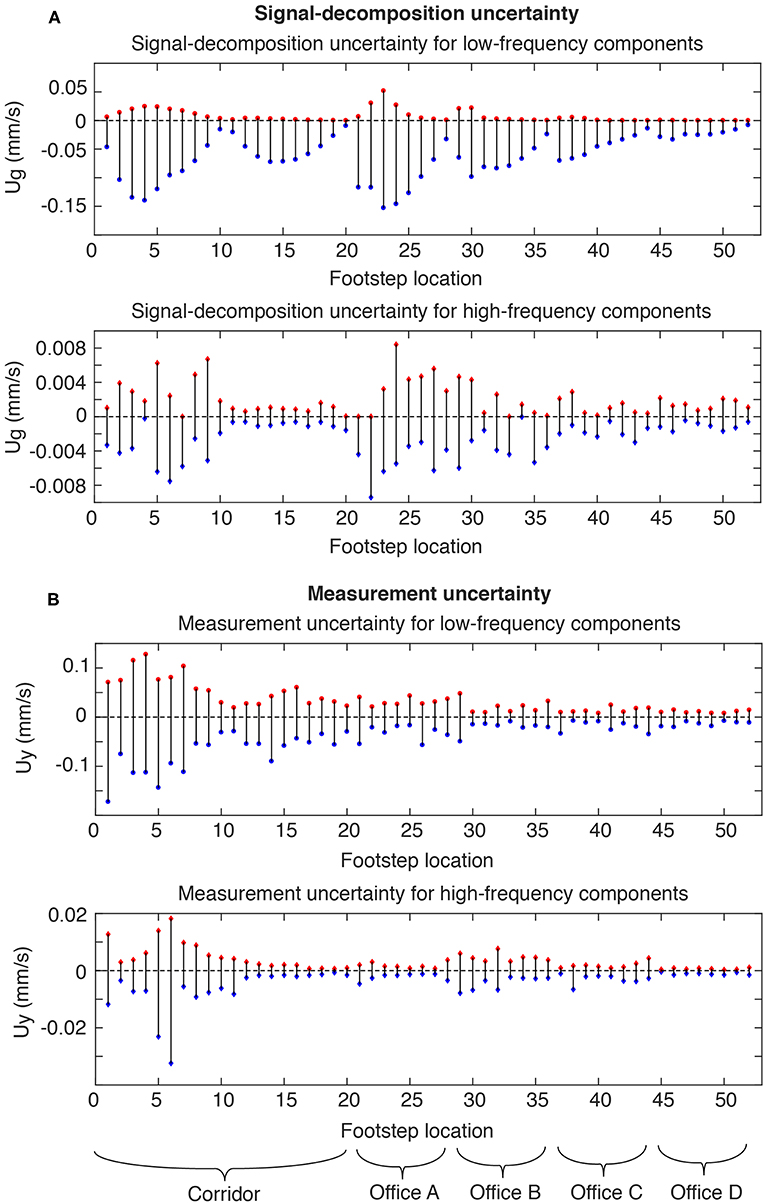
Figure 7. Model and measurement uncertainties for each potential footstep-impact location. (A) Presents signal-decomposition uncertainty for low-frequency components for Sensor S1 are estimated by taking the difference between simulated footstep-signal components at frequency ranges that lay between 16 and 48 Hz and components at frequency range [20, 40] Hz. Similarly, Signal-decomposition uncertainty for high-frequency components for Sensor S1 are estimated by taking the difference between simulated footstep signal components at frequency ranges that lay between 126 and 271 Hz and components at frequency range [150, 200] Hz. (B) Presents measurement uncertainty for Sensor S1 at each footstep location are estimated from 10 independent trajectory measurements conducted prior to location identification. Wavelet decomposition is carried out in the frequency range [20, 40] Hz for low-frequency components and [150, 200] Hz for high-frequency components.
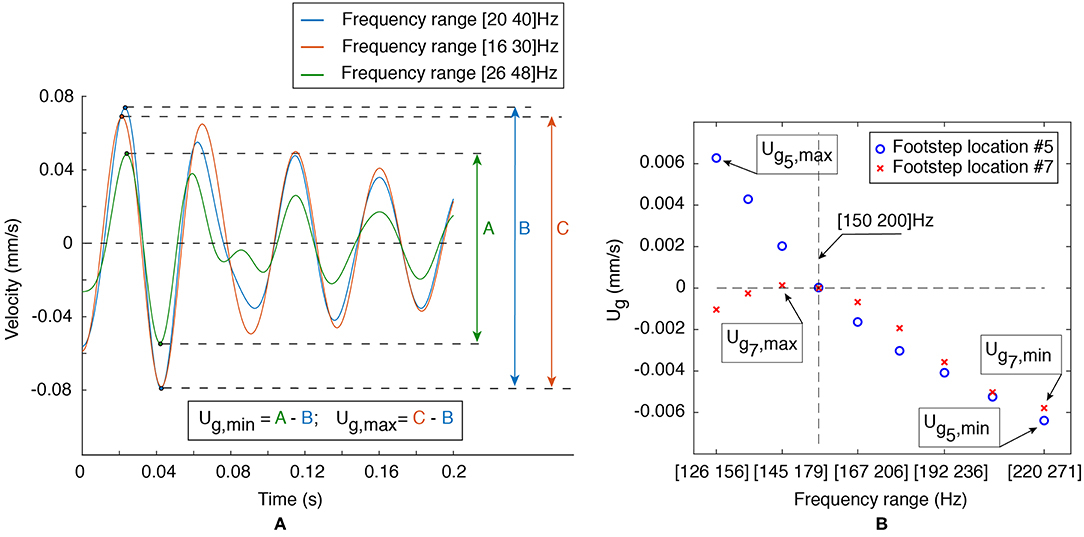
Figure 8. Estimation of signal-decomposition uncertainty at low-and-high frequency components is explained. (A) Presents signal-decomposition uncertainty for low-frequency components for Sensor S1 of a footstep signal that is estimated by taking the difference between simulated Δamp at frequency ranges {[16, 30] (C); [26, 48] (A)} Hz and components at frequency range [20, 40] Hz (B). (B) Presents signal decomposition uncertainty distributions for high-frequency components for Sensor S1 of footstep signals #5 and #7 (see Figure 4) that are estimated by taking the difference between simulated Δamp at frequency ranges within [126–271] Hz and components at frequency range [150, 200] Hz.
An example of signal-decomposition uncertainty assessment for a footstep-impact simulation is explained in Figure 8A. Upper and lower bounds defining a uniform distribution of the signal-decomposition uncertainty for low-frequency components are estimated by taking the difference between simulated Δamp at frequency ranges {[16, 30]; [26, 48]} Hz and components at frequency range [20, 40] Hz. These comparisons are performed for each simulated footstep signal at low-and-high frequency ranges separately (for instance, comparisons at high-frequency components of footstep locations #5 and #7 in Figure 8B). Thus, the minimum and maximum values resulting from the frequency-component comparisons define the upper and the lower bounds of the signal-decomposition uncertainty of a simulated footstep signal.
In addition to the modeling uncertainties, measurement uncertainty, including sensor resolution and precision as well as the variation of the signal related to a person walking along the same trajectory multiple times are incorporated in the combined uncertainty. Measurement uncertainties are estimated based on prior measurements at each impact footstep locations, which define the possible trajectories inside the office environment (for instance trajectories #1 and #4 in Figure 4). Ten prior measurements (not used for localization) at each footstep impact location are recorded to estimate measurement uncertainty.
Absolute measurement uncertainty (following a uniform distribution) of each footstep impact location are presented in Figure 7B. Measurement uncertainty at a specific footstep impact location is estimated based on comparing the values of 10 walks to the mean measurement value. Minimum and maximum bounds of measurement uncertainties are taken to define a uniform uncertainty distribution at each footstep location. Measurement uncertainties for low-frequency components present higher absolute values when footstep-impact locations are at mid-span of the corridor, close to sensor S1 (see Figure 5A) compared to footstep-impact locations inside offices (see Figure 8B). In addition to the variation of the signal related to a person walking on same locations and the resolution and precision of sensors, higher amplitudes of vibration result in higher absolute uncertainties. Measurement uncertainties for high-frequency components present higher absolute values when footstep-impact locations are close to Sensor S1 (see Figure 5B) for similar reasons.
Subsequently, model and measurement uncertainties related to each footstep location at low-and-high frequency ranges are combined using a Monte-Carlo sampling with 1 million samples. Based on a target reliability of identification of 99%, thresholds at each footstep location are derived from the corresponding combined uncertainty.
Model-Based Occupant-Tracking Results
The primary objective of this approach is the trajectory identification of an occupant. The first step toward this objective is localizing the occupant, which is performed separately for each captured footstep-event signal. Using EDMF, all model instances for which residuals between model predictions and footstep-induced floor vibration measurements lie outside the threshold bounds are falsified (see section Error-Domain Model-Falsification). Combining information at each sensor location, candidate location set (CLS) of each footstep event are generated. Since a person is assumed to walk continuously with a fixed step length until reaching their destination, without stopping or going backwards, the sequential analysis (see section Sequential Footstep-Localization Analysis) is performed for all CLS of each footstep event. When the distance between a candidate location of a footstep event with all candidate locations of the previous footstep event exceeds a pre-defined step length, the candidate location is falsified as shown in Figure 3. Trajectory identification is then carried out based on the resulting CLSs from the falsification process and sequential analysis. Measurement of one walking person following three trajectories (trajectories #1, #2, and #3 in Figure 4) are tested three times.
Examples of CLSs of various footstep events that correspond to trajectories #1, #2, and #3 (see Figure 4) are shown in Figures 9–11 with squares. These CLSs result from EDMF (see Figure 2) and sequential analysis (see Figure 3). Falsified location sets (circles) as well as walls delimitating offices are included for each footstep event. Furthermore, real footstep locations of each footstep event are presented with stars (see Figures 9–11).
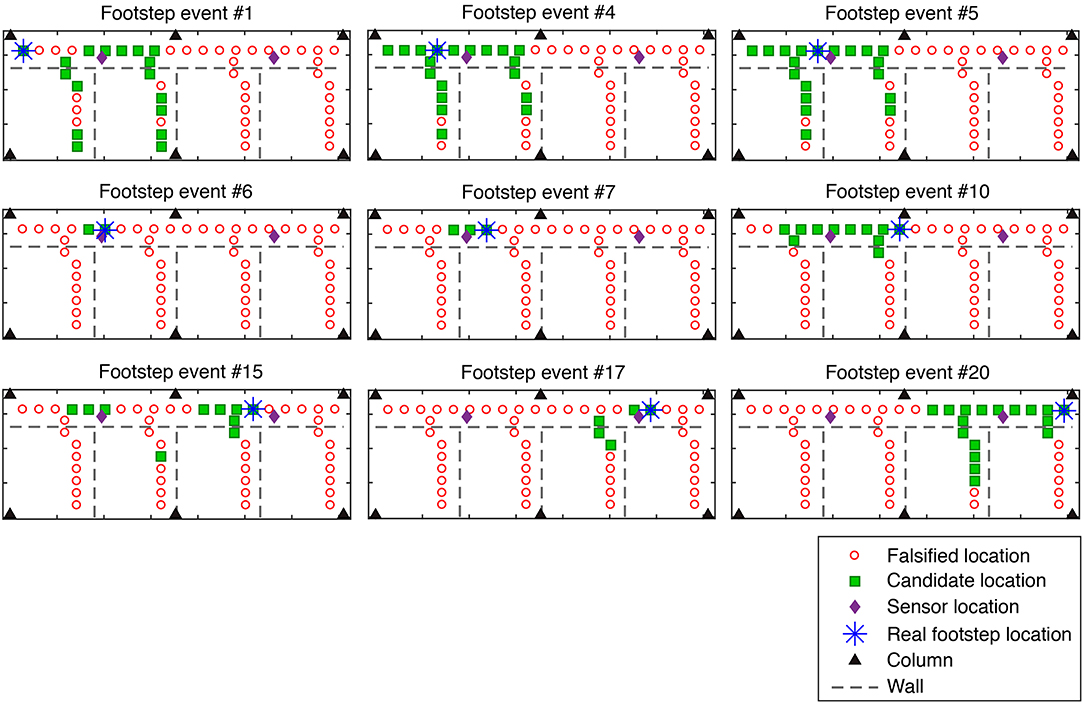
Figure 9. Candidate-location set that is obtained using EDMF and sequential analysis (see Figure 3) for each footstep event of trajectory #1.
Combining model predictions at low-and-high frequency ranges with footstep-event measurements using EDMF leads to binary information about presence or absence of an occupant at a set of locations. Since all CLSs contain the real footstep location, model-based occupant localization using EDMF provides accurate results for all measurements. As EDMF sacrifices precision to achieve accuracy (real footstep-impact location is part of the CLS), the precision of the candidate locations is found to be generally low across all footstep events. For instance, EDMF along with sequential analysis did not falsify any candidate location for the footstep event #4 of the trajectory #2. Also, the CLS of multiple footstep events contain more than 50% of all possible locations (see footstep events #1, #3, #5, #7, and #8 in trajectory #2 in Figure 10; footstep events #1, #4, #5, #11, #20, and #21 in trajectory #3 in Figure 11). The candidate locations of those footstep events are either located inside offices or close to column (located in the middle of the east end of the slab; see Figure 4). However, CLS of footstep events of trajectory #1 (walking in the corridor, see Figure 9) present better precision in most cases. Lack of precision of the CLSs inside the offices and close to column is due to the low amplitudes of the measured footstep-events based on the actual sensor positions (see Figure 4), which are placed in the corridor for privacy purposes (see section Vibration-Measurement Analysis). Thus, further study of the sensor layout might be useful in improving the precision of identifying candidate locations. Complete information of the size of CLSs for each footstep event illustrated in Figures 9–11 are presented in Table 1.
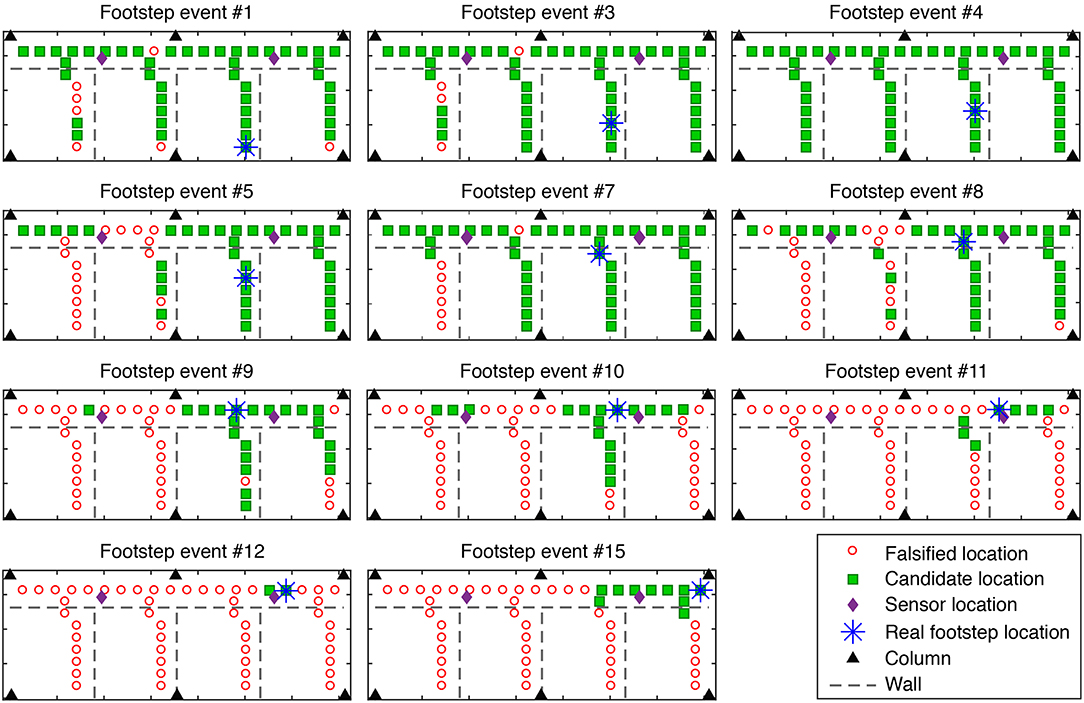
Figure 10. Candidate-location set that is obtained using EDMF and sequential analysis (see Figure 3) for each footstep event of trajectory #2.
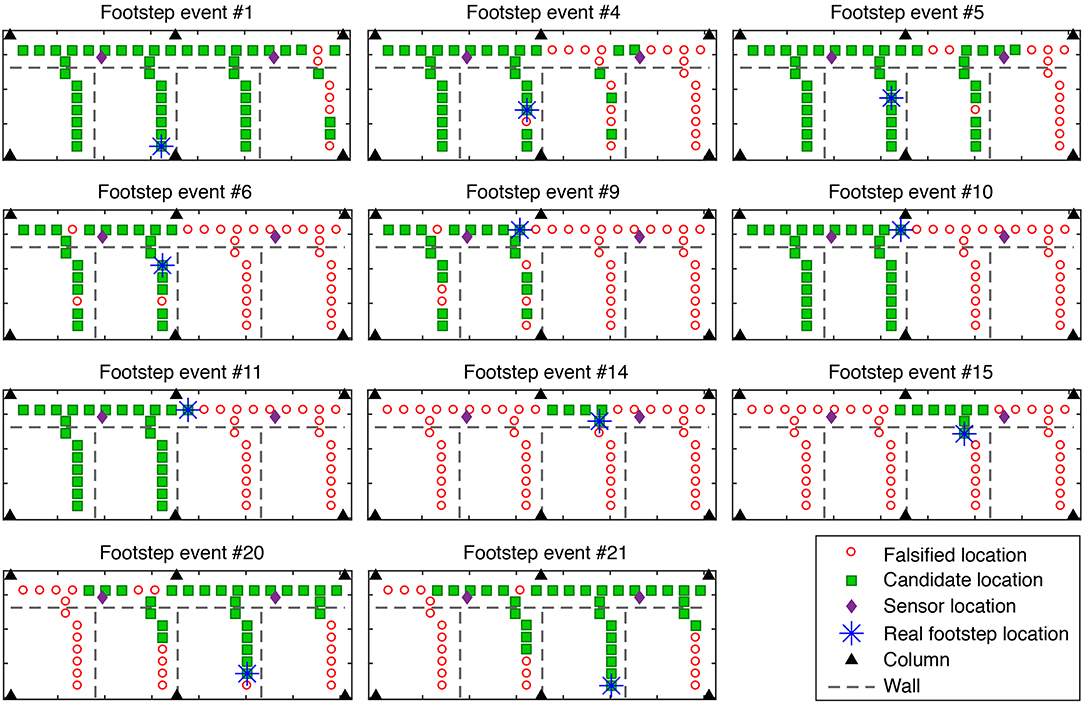
Figure 11. Candidate-location set that is obtained using EDMF and sequential analysis (see Figure 3) for each footstep event of trajectory #3.
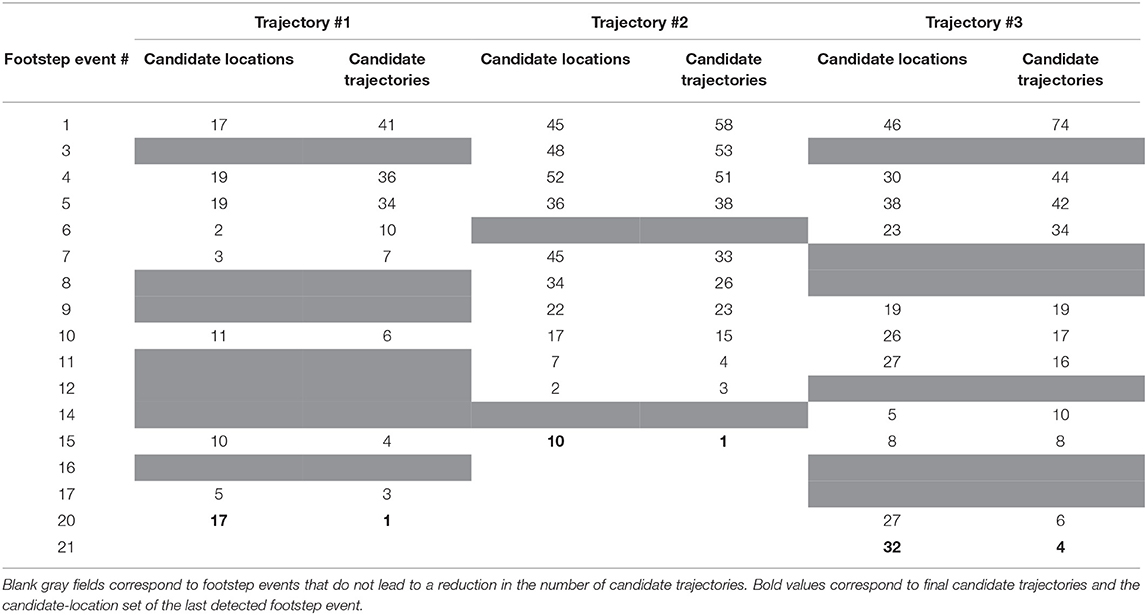
Table 1. Size of candidate location set and the remaining candidate trajectories after each footstep event are presented for all tested trajectories (see Figures 9–11).
Trajectory identification is then carried out based on the resulting CLSs from the falsification process and sequential analysis. The identification of the measured trajectory starts with considering all potential departure/arrival spots (see Figure 4) as possible departure points in the first CLS of the captured footstep event. If a possible departure point is a candidate location, all possible trajectories corresponding to this departure spot are taken into account. Candidate locations of the first footstep event provide all possible paths that a person can take. Additional footstep events provide further information about paths taken from the remaining departure spots. When a CLS of a footstep event does not satisfy the continuity of a path, the corresponding trajectory is rejected (see Figure 12). In addition, if a complete path is attained at a footstep event, whereas additional footstep events are captured in the following, the current trajectory is rejected. Finally, once all candidate locations of all footstep events are explored, the remaining paths are the candidate trajectories.
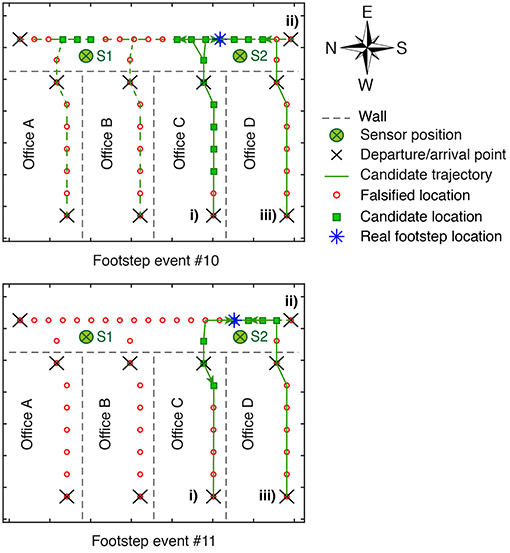
Figure 12. Candidate trajectory results of trajectory #2 are shown for footstep events #10 and #11. Arrows point out candidate locations #10 and #11 from departure points. The remaining trajectories that correspond to footstep event #10 is equal to 15. Based on trajectory identification process, only four trajectories remain at footstep event #11. Each additional footstep enhances trajectory identification.
A representation of trajectory identification is shown in Figure 12 for footstep events #10 and #11 of trajectory #2 (see Figure 10). Arrows point out candidate locations #10 and #11 from departure points. The remaining trajectories that correspond to footstep event #10 are equal to 15 (see Figure 12). These trajectories are not rejected based on the CLSs of the first 10 footstep events. The remaining departure points at footstep event #10 are: (i) the west end of Office C, (ii) the south end of corridor, and (iii) the east end of Office D (see Figure 12). All possible paths starting from the departure point (i), which presents the real departure spot, are not rejected. One path that starts from departure point (ii) to the west end of Office C, is not rejected. The remaining trajectories that start from departure point (iii), concern the arrival points at the north end of the corridor, Offices A and B and the west end of Office C.
Based on 15 trajectories that are not rejected from footstep event #10 and additional information from the CLS of the footstep event #11, only four possible trajectories remain. As the candidate location #11 among CLS of the footstep event #11 starting from the remaining possible departures from previous footstep event do not satisfy the continuity of 11 trajectories out of 15 are rejected (see footstep event #11 in Figure 12). The remaining candidate trajectories after exploring CLS of the footstep event #11 correspond to the departure point (iii), where the arrival point is the west end of Office C and the departure point (i), where the arrival points are the south end of the corridor and the ones inside Office D. Therefore, at each additional footstep event trajectory identification is refined.
Table 1 presents the size of the CLS of each footstep event that are shown in Figures 9–11 of each tested trajectory. The remaining candidate trajectories corresponding to each footstep event are also presented. For trajectory #1, after footstep event #7 only seven candidate trajectories remain. Thus, 75 of the 82 initial trajectories (see possible departure/arrival points in Figure 4) are falsified (~91% of initial trajectories) using information from events #1 to #7 out of the 20 captured footstep events.
For trajectory #2, 67 of the 82 initial trajectories (~82%) are falsified from events #1 to #10 out of the 15 captured footstep events. For trajectory #3, 74 of the 82 initial trajectories (~82%) are falsified from events #1 to #15 out of the 21 captured footstep events. Although reduction in uncertainty regarding the location of the occupant at most isolated footstep events is low, initial location set is composed of 52 possibilities, reduction in number of candidate trajectories is significant.
The correct trajectory followed by a person walking is precisely identified for all measurements (see last footstep event for each testes trajectory in Table 1). After exploring all footstep event results, the correct trajectory is determined with a precision of 100% for trajectories #1 and #2 and 95% for trajectory #3 in which only four trajectories out of 82 remain (see Figure 13).
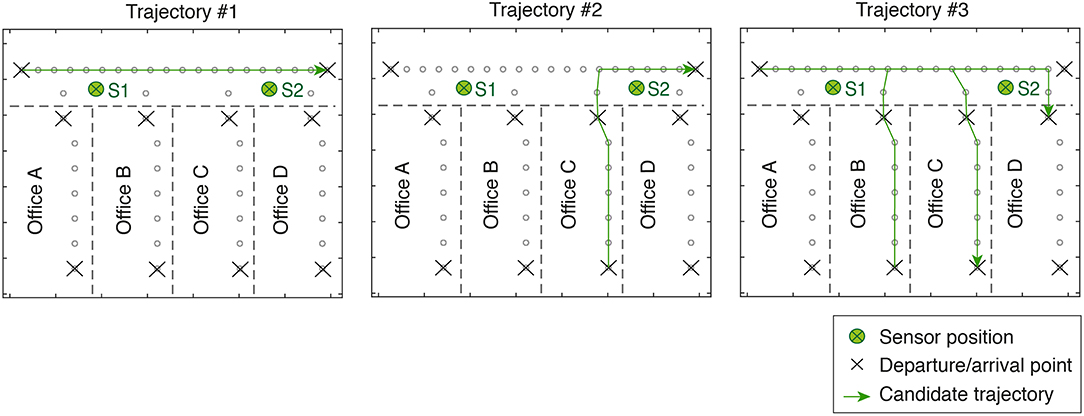
Figure 13. Candidate trajectories that result from identification for each tested trajectory (see Figure 4). EDMF and sequential analysis (see Figure 3) identify accurately and precisely tested trajectories. Four candidate trajectories remain after completing trajectory #3.
Regarding the trajectory identification step based on CLS of the captured footstep events, the number of candidate trajectories decrease to 1 out of 82 for trajectories #1 and #2. The number of candidate trajectories decreases to 4 out of 82 for trajectory #3. The real trajectory #3 (see Figure 4) that starts from the west end of Office B to the west end of Office C is part of the remaining candidate trajectories.
Occupant tracking using EDMF taking into account structural behavior and systematic uncertainties has the potential to reduce significantly the number of candidate occupant trajectories and provide accurate results. Using a two-sensor configuration, model-based occupant tracking provides accurate results across all cases.
Summary and Discussion
A multiple-model approach using EDMF and a sequential analysis have been carried out for occupant tracking inside a full-scale office environment. Unlike measurement-driven techniques, EDMF incorporates structural behavior and accommodates several sources of uncertainty. Model-free approaches using triangulation techniques provide estimates of the distance between the impact load position and sensors based on the time of arrival of the signal at sensor positions. Triangulation needs at least three sensors and a uniform structural configuration in order to provide accurate localization.
Based on the current full-scale study that contains multiple structural obstructions such as beams and walls, low frequency components of two footstep-impact signals are extracted using wavelet decomposition between 23 and 30 Hz (see Figure 14). These two footstep-impact signals are used to highlight the limitations of triangulation-based approach for occupant localization. The chosen frequency range covers the fundamental frequency of the structure in order to extract the highest energy components of the signal.
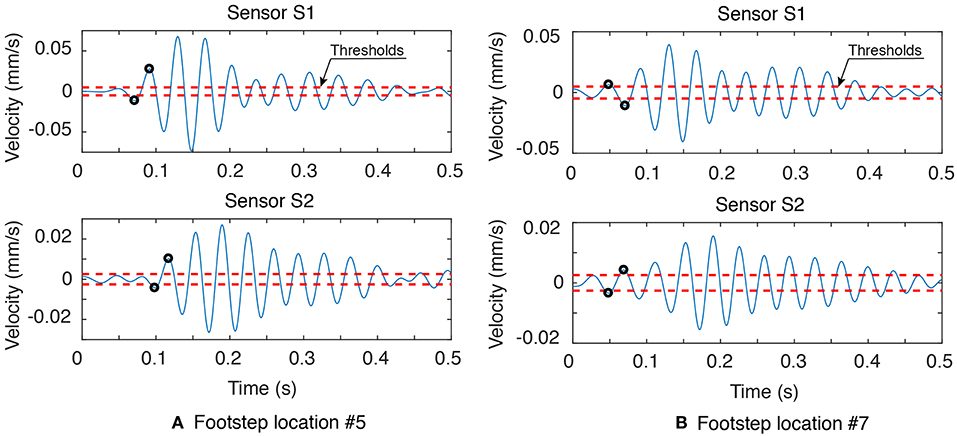
Figure 14. Low frequency components of two footstep signals are extracted using wavelet decomposition between 23 and 30 Hz. Footstep signals recorded at Sensors S1 and S2 are located at (A) Footstep location #5 and (B) Footstep location #7 (see Figure 4). Thresholds (Dashed-lines) correspond to three standard deviations of ambient vibrations for each sensor. Black dots illustrate the first peak exceeding thresholds for each sensor.
Figure 14 presents footstep impact signals located at (a) Footstep location #5 and (b) Footstep location #7 (see Figure 4) and recorded at Sensors S1 and S2. Thresholds (dashed-lines) correspond to three standard deviations of decomposed ambient vibrations for each sensor. The first peaks exceeding thresholds are presented by black dots, which correspond to the time of arrival of impact signature at a given sensor location. For footstep events #5 and #7, time corresponding to exceedance of thresholds in graphs (a) and (b) are not correlated with the distance between sensor positions and footstep impact locations. The time-difference of arrival (TDoA) of the footstep #5 is found to be 0.03 s whereas the TDoA of the footstep #7 is found to be 0.0002 s. As the TDoA value of the footstep #7 is very low, the impact location of the footstep #7 should be equidistant from both sensors, which does not reflect reality.
Vibration measurements of three trajectories have been studied to illustrate the potential for using a data interpretation approach that involves a physics-based model for occupant tracking (trajectories #1, #2, and #3 see Figure 4). Based on two vibration sensors (see Figure 4), each tested trajectory (see trajectories 1#, #2, and #3 in Figure 4) has been repeated three times. Based on vibration analysis of footstep-event measurements, low-and-high frequency components are used for occupant localization. Low-frequency components are governed by global structural effects, whereas, high-frequency components are mostly dominated by the location of the footstep impact and local structural effects.
Incorporating structural behavior and various sources of uncertainty in occupant tracking application using EDMF, all trajectories have been identified accurately, across all measurements. Based on a two-sensor configuration, model-based occupant-tracking approach provides precise results in most cases. Precision of 100% for trajectories #1 and #2 and 95% for trajectory #3 are obtained using the proposed occupant-tracking methodology.
CLSs of footstep events inside the offices and close to column provide low precision occupant-localization, which can be due to the sensor configuration. Thus, study of the sensor layout might be useful in improving precision of identified candidate locations. In addition, future work to improve the physics-based model is needed to reduce modeling uncertainties.
Since the application of occupant tracking using model-based approach has been carried out for one occupant only, testing multiple occupants walking along the same trajectories is planned. In addition, future work on other full-scale structures is needed to verify the general applicability of the approach.
Conclusions
The model-based data-interpretation strategy presented in this paper along with its evaluation through a full-scale case study, leads to the following conclusions:
– Occupant tracking using error-domain model-falsification, including structural information and taking into account systematic errors, has the potential to reduce significantly the number of candidate occupant trajectories and provide accurate results.
– Model-based occupant tracking using a two-sensor configuration has the ability to provide precise results in most cases.
– Low frequency components of impact signals are dominated by global structural effects. High-frequency components of impact signals are dominated by impact positions and local structural effects.
– Occupant localization using model-free approaches may reveal contradictions due to structural features.
Author Contributions
SD developed the application of occupant tracking using a model-based data-interpretation approach. Footstep-impact vibration measurements have been conducted by SD. YR assisted throughout the elaboration of the methodology and measurement acquisition. SP was involved in adapting the EDMF approach for occupant tracking as well as finite-element modeling. HN suggested wavelet decomposition into low-and-high frequency ranges. IS was actively involved in developing and adapting the data-interpretation methodology and interpreting results. All authors reviewed and accepted the final version of the manuscript.
Funding
This work was funded by the applied computing and mechanics laboratory EPFL, the Singapore-ETH centre (SEC) under contract no. FI 370074011-370074016 and the Swiss National Science Foundation (SNSF) under contract no. 200020-169026.
Conflict of Interest Statement
The authors declare that the research was conducted in the absence of any commercial or financial relationships that could be construed as a potential conflict of interest.
Acknowledgments
The authors acknowledge Prof. Nizar Bel Hadj Ali and Dr. Pierino Lestuzzi for fruitful discussions. The authors thank Charles Gilliard and laboratory technicians for their contributions to setting up the measurement equipment.
References
Alhmiedat, T., Samara, G., and Salem, A. O. A. (2013). An indoor fingerprinting localization approach for zigbee wireless sensor networks. Eur. J. Sci. Res. 105, 190–202. arXiv: 1308.1809
Bahroun, R., Michel, O., Frassati, F., Carmona, M., and Lacoume, J. L. (2014). New algorithm for footstep localization using seismic sensors in an indoor environment. J. Sound Vibrat. 333, 1046–1066. doi: 10.1016/j.jsv.2013.10.004
Bamis, A., Lymberopoulos, D., Teixeira, T., and Savvides, A. (2010). The BehaviorScope framework for enabling ambient assisted living. Pers. Ubiquitous Comput. 14, 473–487. doi: 10.1007/s00779-010-0282-z
Bekkelien, A., Deriaz, M., and Marchand-Maillet, S. (2012). Bluetooth Indoor Positioning. (Master's thesis), University of Geneva.
Erickson, V. L., Achleitner, S., and Cerpa, A. E. (2013). “POEM: Power-efficient occupancy-based energy management system,” in Proceedings of the 12th International Conference on Information Processing in Sensor Networks, Philadelphia, PA, 203–216. doi: 10.1145/2461381.2461407
Erickson, V. L., Carreira-Perpiñán, M. Á., and Cerpa, A. E. (2011). “OBSERVE: occupancy-based system for efficient reduction of HVAC energy,” in 10th International Conference on Information Processing in Sensor Networks (IPSN), Chicago, IL, 258–269.
Fernández-Martinez, J. L., Fernández-Muñiz, Z., Pallero, J. L. G., and Pedruelo-González, L. M. (2013). From Bayes to Tarantola: new insights to understand uncertainty in inverse problems. J. Appl. Geophys. 98, 62–72. doi: 10.1016/j.jappgeo.2013.07.005
Fierro, G., Rehmane, O., Krioukov, A., and Culler, D. (2012). “Zone-level occupancy counting with existing infrastructure,” in Proceedings of the Fourth ACM Workshop on Embedded Sensing Systems for Energy-Efficiency in Buildings, Toronto, ON, 205–206. doi: 10.1145/2422531.2422572
Ford, M. S. (2003). The illustrated wavelet transform handbook: introductory theory and applications in science. Health Phys. 84, 667–668. doi: 10.1097/00004032-200305000-00020
Goulet, J.-A., Michel, C., and Smith, I. F. C. (2013). Hybrid probabilities and error-domain structural identification using ambient vibration monitoring. Mech. Syst. Signal Process. 37, 199–212. doi: 10.1016/j.ymssp.2012.05.017
Goulet, J.-A., and Smith, I. F. C. (2013). Structural identification with systematic errors and unknown uncertainty dependencies. Comput. Struct. 128, 251–258. doi: 10.1016/j.compstruc.2013.07.009
Henry, P., Krainin, M., Herbst, E., Ren, X., and Fox, D. (2012). RGB-D mapping: using kinect-style depth cameras for dense 3D modeling of indoor environments. Int. J. Robot. Res. 31, 647–663. doi: 10.1177/0278364911434148
Huang, Z., McWilliams, A., Lui, H., McLean, D. I., Lam, S., and Zeng, H. (2003). Near-infrared Raman spectroscopy for optical diagnosis of lung cancer. Int. J. Cancer 107, 1047–1052. doi: 10.1002/ijc.11500
Kamthe, A., Jiang, L., Dudys, M., and Cerpa, A. (2009). “Scopes: smart cameras object position estimation system,” in European Conference on Wireless Sensor Networks, Cork, 279–295. doi: 10.1007/978-3-642-00224-3_18
Lam, M., Mirshekari, M., Pan, S., Zhang, P., and Noh, H. Y. (2016). Robust occupant detection through step-induced floor vibration by incorporating structural characteristics. Dyn. Coupled Struct. 4, 357–367. doi: 10.1007/978-3-319-29763-7_35
Lazik, P., Rajagopal, N., Shih, O., Sinopoli, B., and Rowe, A. (2015). “ALPS: A bluetooth and ultrasound platform for mapping and localization,” in Proceedings of the 13th ACM Conference on Embedded Networked Sensor Systems, Seoul, 73–84. doi: 10.1145/2809695.2809727
Lin, J., and Qu, L. (2000). Feature extraction based on Morlet wavelet and its application for mechanical fault diagnosis. J. Sound Vibrat. 234, 135–148. doi: 10.1006/jsvi.2000.2864
Lu, J., Sookoor, T., Srinivasan, V., Gao, G., Holben, B., Stankovic, J., et al. (2010). “The smart thermostat: using occupancy sensors to save energy in homes,” in Proceedings of the 8th ACM Conference on Embedded Networked Sensor Systems, Zürich, 211–224. doi: 10.1145/1869983.1870005
Mirshekari, M., Pan, S., Fagert, J., Schooler, E. M., Zhang, P., and Noh, H. Y. (2018). Occupant localization using footstep-induced structural vibration. Mech. Syst. Signal Process. 112, 77–97. doi: 10.1016/j.ymssp.2018.04.026
Mirshekari, M., Pan, S., Zhang, P., and Noh, H. Y. (2016). “Characterizing wave propagation to improve indoor step-level person localization using floor vibration,” in Sensors and Smart Structures Technologies for Civil, Mechanical, and Aerospace Systems 2016, Las Vegas, NV. doi: 10.1117/12.2222136
Moser, G., Paal, S. G., and Smith, I. F. C. (2015). Performance comparison of reduced models for leak detection in water distribution networks. Adv. Eng. Informatics 29, 714–726. doi: 10.1016/j.aei.2015.07.003
Narayana, S., Prasad, R. V., Rao, V. S., Prabhakar, T. V., Kowshik, S. S., and Iyer, M. S. (2015). “PIR sensors: characterization and novel localization technique,” in Proceedings of the 14th International Conference on Information Processing in Sensor Networks, Seattle, DC, 142–153. doi: 10.1145/2737095.2742561
Pai, S. G. S., Nussbaumer, A., and Smith, I. F. C. (2018). Comparing structural identification methodologies for fatigue life prediction of a highway bridge. Front. Built Environ. 3:73. doi: 10.3389/fbuil.2017.00073
Pakhomov, A., Sicignano, A., Sandy, M., and Goldburt, E. T. (2003). “Single-and three-axis geophone: footstep detection with bearing estimation, localization, and tracking,” in Proceedings of SPIE - The International Society for Optical Engineering (Orland, FL), 155–162. doi: 10.1117/12.487755
Pan, S., Bonde, A., Jing, J., Zhang, L., Zhang, P., and Noh, H. Y. (2014). “Boes: building occupancy estimation system using sparse ambient vibration monitoring,” in Sensors and Smart Structures Technologies for Civil, Mechanical, and Aerospace Systems 2014, San Diego, CA.
Pan, S., Mirshekari, M., Zhang, P., and Noh, H. Y. (2016). “Occupant traffic estimation through structural vibration sensing,” in Sensors and Smart Structures Technologies for Civil, Mechanical, and Aerospace Systems 2016, Las Vegas, NV.
Pan, S., Wang, N., Qian, Y., Velibeyoglu, I., Noh, H. Y., and Zhang, P. (2015). “Indoor person identification through footstep induced structural vibration,” in Proceedings of the 16th International Workshop on Mobile Computing Systems and Applications, Santa Fe, NM, 81–86. doi: 10.1145/2699343.2699364
Park, B., Sohn, H., Olson, S. E., DeSimio, M. P., Brown, K. S., and Derriso, M. M. (2012). Impact localization in complex structures using laser-based time reversal. Struct. Health Monitor. 11, 577–588. doi: 10.1177/1475921712449508
Pasquier, R., D'Angelo, L., Goulet, J.-A., Acevedo, C., Nussbaumer, A., and Smith, I. F. C. (2016). Measurement, data interpretation, and uncertainty propagation for fatigue assessments of structures. J. Bridge Eng. 21:4015087. doi: 10.1061/(ASCE)BE.1943-5592.0000861
Pasquier, R., Goulet, J.-A., Acevedo, C., and Smith, I. F. C. (2014). Improving fatigue evaluations of structures using in-service behavior measurement data. J. Bridge Eng. 19:4014045. doi: 10.1061/(ASCE)BE.1943-5592.0000619
Pasquier, R., and Smith, I. F. C. (2015). Robust system identification and model predictions in the presence of systematic uncertainty. Adv. Eng. Informatics 29, 1096–1109. doi: 10.1016/j.aei.2015.07.007
Proverbio, M., Costa, A., and Smith, I. F. C. (2018). Adaptive sampling methodology for structural identification using radial-basis functions. J. Comput. Civil Eng. 32:4018008. doi: 10.1061/(ASCE)CP.1943-5487.0000750
Purohit, A., Sun, Z., Pan, S., and Zhang, P. (2013). “SugarTrail: Indoor navigation in retail environments without surveys and maps,” in Sensor, Mesh and Ad Hoc Communications and Networks (SECON), 2013 10th Annual IEEE Communications Society Conference on, New Orleans, LA, 300–308. doi: 10.1109/SAHCN.2013.6644999
Racic, V., Pavic, A., and Brownjohn, J. M. W. (2009). Experimental identification and analytical modelling of human walking forces: literature review. J. Sound Vibrat. 326, 1–49. doi: 10.1016/j.jsv.2009.04.020
Reuland, Y., Lestuzzi, P., and Smith, I. F. C. (2019). A model-based data-interpretation framework for post-earthquake building assessment with scarce measurement data. Soil Dyn. Earthquake Eng. 116, 253–263. doi: 10.1016/j.soildyn.2018.10.008
Richman, M. S., Deadrick, D. S., Nation, R. J., and Whitney, S. (2001). “Personnel tracking using seismic sensors,” in Unattended Ground Sensor Technologies and Applications III (Orland, FL), 14–22. doi: 10.1117/12.441276
Schloemann, J., Malladi, V. V. N. S., Woolard, A. G., Hamilton, J. M., Buehrer, R. M., and Tarazaga, P. A. (2015). Vibration event localization in an instrumented building. Exp. Tech. Rotat. Machinery Acoust. 8, 265–271. doi: 10.1007/978-3-319-15236-3_24
Šidák, Z. (1967). Rectangular confidence regions for the means of multivariate normal distributions. J. Am. Stat. Assoc. 62, 626–633. doi: 10.1080/01621459.1967.10482935
Smith, I. F. C. (2016). Studies of sensor data interpretation for asset management of the built environment. Front. Built Environ. 2:8. doi: 10.3389/fbuil.2016.00008
Tarantola, A. (2006). Popper, bayes and the inverse problem. Nat. Phys. 2:492. doi: 10.1038/nphys375
Vernay, D. G., Raphael, B., and Smith, I. F. C. (2015). A model-based data-interpretation framework for improving wind predictions around buildings. J. Wind Eng. Indus. Aerodyn. 145, 219–228. doi: 10.1016/j.jweia.2015.06.016
Xu, C., Firner, B., Moore, R. S., Zhang, Y., Trappe, W., Howard, R., et al. (2013). “SCPL: indoor device-free multi-subject counting and localization using radio signal strength,” in Proceedings of the 12th International Conference on Information Processing in Sensor Networks, Philadelphia, PA, 79–90. doi: 10.1145/2461381.2461394
Keywords: occupant tracking, footstep-induced floor vibrations, physics-based model data-interpretation, error-domain model falsification, sequential analysis
Citation: Drira S, Reuland Y, Pai SGS, Noh HY and Smith IFC (2019) Model-Based Occupant Tracking Using Slab-Vibration Measurements. Front. Built Environ. 5:63. doi: 10.3389/fbuil.2019.00063
Received: 31 January 2019; Accepted: 29 April 2019;
Published: 16 May 2019.
Edited by:
Babak Moaveni, Tufts University, United StatesReviewed by:
Luigi Di Sarno, University of Sannio, ItalyShinta Yoshitomi, Ritsumeikan University, Japan
Copyright © 2019 Drira, Reuland, Pai, Noh and Smith. This is an open-access article distributed under the terms of the Creative Commons Attribution License (CC BY). The use, distribution or reproduction in other forums is permitted, provided the original author(s) and the copyright owner(s) are credited and that the original publication in this journal is cited, in accordance with accepted academic practice. No use, distribution or reproduction is permitted which does not comply with these terms.
*Correspondence: Slah Drira, c2xhaC5kcmlyYUBlcGZsLmNo
 Slah Drira
 Yves Reuland
 Sai G. S. Pai
 Hae Young Noh
 Ian F. C. Smith