 Raffaele Pucinotti1*
 Giovanni Fiordaliso2
- 1Department of PAU, Mediterranean University of Reggio Calabria, Reggio Calabria, Italy
- 2Structural Designer in Reggio Calabria, Reggio Calabria, Italy
Seismic protection for structures in general, and bridges in particular, is very complex. Indeed, any analysis of bridges with fluid viscous dampers and shock transmitting devices must be completed using a sophisticated finite element (FE) model. Furthermore, a large number of factors must be accurately considered and followed in order to effectively and efficiently protect human life. When dealing with complex structures, as is the case of the viaduct under examination, which contains numerous devices, the starting point is an assessment of the consistency of fluid-viscous dampers and shock transmitters integrated with bearings. This paper, a case study of design and static-dynamic testing procedures on multi-span steel–concrete viaduct provided with fluid viscous dampers and shock transmitters devices, deals directly with this process. To these ends, the FE modeling of the viaduct required an updating procedure model to ensure optimization. Those viaducts built during the “Caltagirone Project,” can be defined as works of great interest due both to the construction methods adopted and to the techniques of stress control during the seismic stage. The design process allowed a rectification of those seismic issues deriving from structural irregularities (altimetric and planimetric), as well as from the high seismicity of the area. The analyses were carried out using a Capacity Design approach, employing non-linear seismic dissipative devices integrated as supports while validating that the substructures are maintained substantially elastic. For this reason, the piers were modeled on their non-linear behavior using Takeda's hysteretic model. Moreover, fluid viscous dampers and shock transmitters integrated with bearings were designed in accordance with the substructures' different stiffness; this partially dissipates those stresses induced by earthquakes, in order to keep the deck and the substructures substantially elastic, establishing a Life-Safety Limit State condition (at the Ultimate Limit State—ULS). The verifications carried out demonstrated the capability of structures to withstand stresses under the Collapse Limit State (CLS) condition without damage and at the same time to ensure the curvature capability from the piers. The comparisons between experimental and numerical results together with the demanding qualification tests carried out by this study demonstrate that the hydraulic devices are an efficient solution to assess seismic stresses induced on the viaduct and in its substructures, confirming the reliability of the aforesaid devices, thus ensuring better structural safety.
Introduction
Steel–concrete composite bridges represent a design option whose use is increasing in areas subject to high-intensity seismic activity. In point of fact, this design option is spreading more and more in the railway and motorway sector. The rapid erection, long span capability, economics, and aesthetics of these girders make them more favorable than other structural systems in terms of stiffness, resistance, and ductility.
In Makris and Zhang (2004), the authors present a case study on the seismic response of an over-crossing motorway structure equipped with elastomeric bearings and fluid dampers at its end abutments. The paper details the seismic response of the bridge, which was equipped with response modification devices accounting for the effects of soil–structure interaction; the results were compared with a hypothetical bridge with integral abutments.
In Tian et al. (2016), the authors present a numerical evaluation of the effectiveness of shock absorber devices installed between the roller bearing and stopper with the aim of reducing viaduct damage. They detail the effectiveness of thickness and types of shock absorber devices on mitigating viaduct damage. The results showed that the devices play a very important role in reducing viaduct damage.
In De Domenico et al. (2019), the authors present an overview of the most popular methodologies from literature in the field of seismic protection of building structures. The key aspects and main characteristics of the different strategies that were identified were the optimal damping coefficients and the optimal placement of Fluid Viscous Dampers (FVDs), which were scrutinized in a comparative manner.
The Montevideo viaduct sets an interesting precedent within the relevant literature on this topic by analyzing retrofitting (Bursi et al., 2008) by means of external post-tensioning. It describes the development of a finite element (FE) 3D model of the bridge and a structural analysis by means of a modal response spectrum. This was followed by a dynamic analysis aimed at identifying in detail the characteristics of steel–concrete box-girder bridges. Notably, the FE model was validated through output-only ambient vibration tests.
This paper presents a case study of design and static-dynamic testing procedures on multi-span steel–concrete viaduct enhanced with fluid viscous dampers and shock transmitter devices. The case study describes both the construction methods adopted and the techniques of stress control under seismic activity. Moreover, an elevated number of devices were placed, at the same time, into the 15 continuous long spans of variable length that compose the viaduct.
Based on the previous considerations, this paper could also refer to the “Ippolito 1” viaduct, where both fluid viscous dampers and shock transmitters integrated with bearings, designed according to the different substructure stiffness, were applied, in order to limit and partially dissipate the stresses induced by earthquakes, so that both the deck and the substructures remain substantially elastic for Ultimate Limit State (ULS).
The viaduct was designed with the purpose of creating a stable dissipative mechanism when subjected to seismic activity. The design was defined using a high-ductility approach in accordance with the Italian code (Ministero delle Infrastrutture, 2008), which considers the dissipative behavior of the structural elements, the material inelasticity, and the geometric non-linearities. The dissipative areas were concentrated on seismic restraint devices, while non-dissipative elements were dimensioned using capacity design criterion (CEN, 2005; Ministero delle Infrastrutture, 2008, 2009).
The comparison between the overall ductility demand and ductility available was carried out on the basis of the instructions provided in Eurocode 8 (CEN, 2005). In line with the capacity design criterion, the deck, the vertical support devices, the foundation, and the abutments were designed to remain elastic. An “over-strength” factor was considered to verify the pier sections outside the plastic hinge region. The dissipative devices were designed to support, without collapsing, displacements induced by an earthquake at Collapse Limit State (CLS), while the fixed restraint devices were dimensioned according to the capacity design criterion.
Step 1: Design Assisted by Testing
Modern design codes give the possibility to apply design methodologies assisted by testing (Pucinotti et al., 2015); in fact, EN1990 (Section Comparisons and Annex D) and EN1993-1-3 (CEN, 2002, 2006) contain specific rules and guidance to the design assisted by testing. In the current case study, before the devices' installation, an accurate analysis of seismic behavior and the matching of functional curves with the design assumptions were conducted.
Structural Design
The “Ippolito 1” Viaduct (Figure 1A) is part of the “Caltagirone Variant” project and belongs to the fast-flowing road “Licodia Eubea” (Catania—Italy), where the morphological irregularities of soil required the construction of five large span (75 m) viaducts, including Paradiso 1 (L = 722 m), Ippolito 1 (L = 1,102 m), Ippolito 2 (L = 125 m), Ippolito 3 (L = 925 m), and Molona (L = 265 m), as schematized in the Figure 1B.
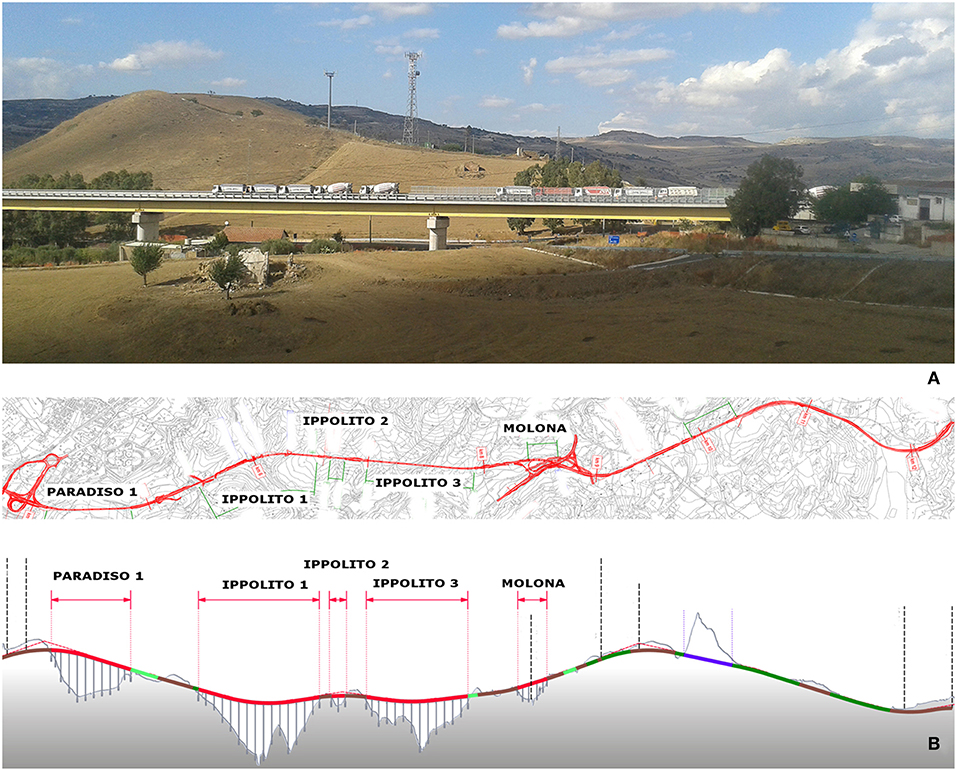
Figure 1. (A) The Ippolito1 Viaduct during the load test; (B) “Caltagirone Variant”: plant and longitudinal section of the fast-flowing road.
These elements were initially developed with consideration to the highly inhomogeneous soil, composed of different layers of blue-gray clays covered by layers of scattered yellow sand. Altimetric and geotechnical irregularities necessitated the use of piers with variable height, ranging from 10 m to a maximum of 60 m. Additionally, the project takes into account multiple planimetric curvatures along its extension, as shown in Figure 1 (Contin et al., 2015a,b).
The composite steel–concrete viaduct Ippolito 1 is 1,102 m long and 12 m wide and consists of 15 continuous spans of variable length, more specifically 68.0 + 75.0 × 13 + 59.0 m. The viaduct consists of a concrete slab supported by two steel girders (Figure 2A); the slab thickness is 28 cm. The girders, spaced 7.00 m, are 2.96 m high. Torsional bracings, at a distance of 6.5 m, are composed of a horizontal (L150 × 12) beam and two inclined (L150 × 12 + L150 × 12) beams. The torsional resistance was completed by a lower cross bracing system (2L150 × 12). The viaduct is located in Caltagirone, an area seismically classified as “zone 2,” according to the OPCM n.3274/2003 (OPCM 3274, 2003): a medium hazard area, where the expected ground acceleration ranges from 0.15 to 0.25 g.
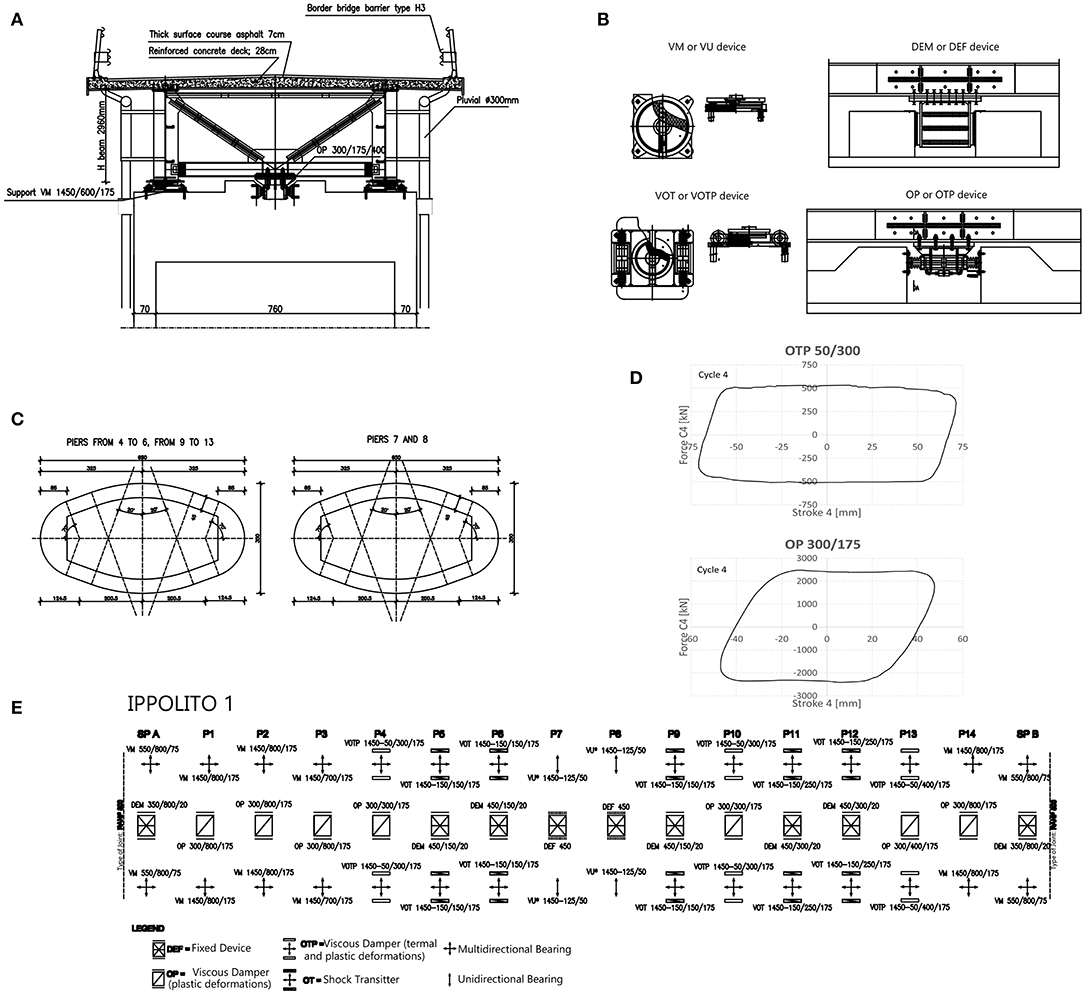
Figure 2. (A) Typological cross section of the viaduct. (B) Device types. (C) Basic cross sections of the piers. (D) Experimental curves of OTP50/300 and OP300/175 devices. (E) Restraint diagram.
The reference framework for seismic design structures in Italy is represented by the so-called New Code (Ministero delle Infrastrutture e dei Tasporti, 2018, 2019). While during both the design and the realization steps of the Viaduct, the reference framework for seismic designed structures were the NTC 2008 (Ministero delle Infrastrutture, 2008) and the Circular 617/2009 (Ministero delle Infrastrutture, 2009). According to both the Italian Code and Eurocode 8 (CEN, 2004; Ministero delle Infrastrutture, 2008, 2009), the seismic parameters for the case study are as follows: (i) longitude: 14.54350, latitude: 37.24318; (ii) soil type C, and (iii) return period of 950 years. The piers were made of reinforced concrete with pseudo-elliptical hollow section and have an average thickness variable between 0.30 and 0.45 m. The plinths are placed on bored piles of 1,500-mm diameter.
Class C28/35 concrete (Rck 35 MPa) was employed for piers and deck, while steel type B450C (with a yield strength of 391 Mpa) was adopted for reinforcing bars; structural steel S335J2 was used for beams and bracings. Bolts class was of 10.9 while Nelson stud connectors (S235J2G3 + C450) were employed for shear connection between concrete slab and steel beams.
Experimental tests carried out on-site showed a pile behavior in accordance with the project forecasts. The structure was dimensioned according to capacity design criterion in which dissipative zones must be concentrated on the restraint devices and at the base of piers, supporting the superstructure, the vertical support devices, and the foundations in the elastic field.
Due to the geometrical irregularities, it was necessary to couple the longitudinal oscillation of the deck with the oscillation of the piers by introducing Shock Transmitters (OT) at the top of the highest piers. These devices create a very stiff restraint against dynamic action while allowing slow movements of structures, for example, those produced by thermal variations. The lowest piers are free to oscillate, whereas the others are coupled with viscous damper devices (OTP) and thus able to control the forces directed on the underlying piers. In the transversal direction, viscous damper devices with plastic deformations (OP), and fixed restraints were employed. This allows the seismic energy to be dissipated through the possible formation of plastic hinges at the base of the piers or by means of the hysteretic behavior of the devices.
Figure 2 shows the typological cross section of the viaduct (Figure 2A), the device types adopted in the case study (Figure 2B), the basic cross sections of the piers (Figure 2C), the experimental curves of OTP50/300 and OP300/175 devices (Figure 2D), and the restraint diagram (Figure 2E). A classification scheme of the piers is reported in Figure 3. On the longitudinal direction, the fixed piers (P7–P8) absorb the static load due to the braking action of the vehicles and play the role of thermal center by transversal unidirectional restraint. With reference to the seismic actions, the shorter piers (P1, P2, P3, and P14 with height lower than 25 m) are free to oscillate, and the piers P3–P10–P13 (with high of about 30 m) are coupled with viscous damper devices (of OTP type) that are able to control the stress value imprinted from the deck; the remaining piers (taller than 35 m) are equipped with temporary restraining devices (shock transmitter OT). By the transversal direction, piers (P1, P2, P3, P4, P10, P13, and P14) are equipped with a multidirectional support equipped with a viscous-type damper device with plastic deformation properties (OP), while piers P5, P6, P9, P11, and P12 are equipped with a DEF-type fixed constraint (able to allow longitudinal movements). Piers P7 and P8 are equipped with a transversal unidirectional bearing device endowed with a DEF-type device. From a seismic point of view, only the piers shorter than 35 m are isolated (P1, P2, P3, P4, P10, P13, and P14).
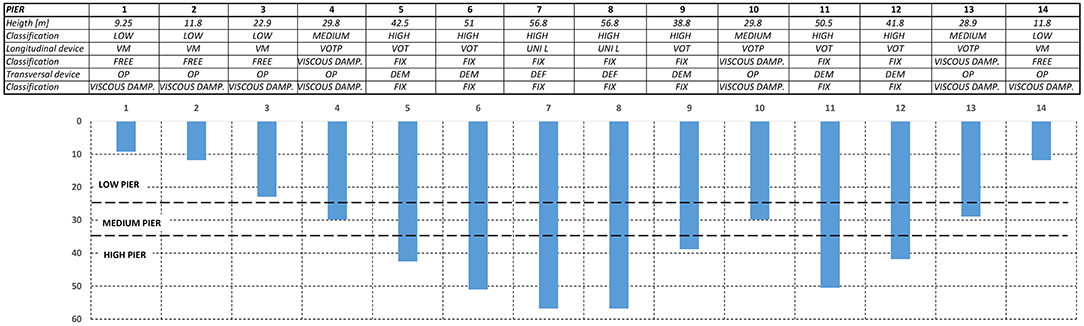
Figure 3. Classification of piers.
Viaduct Modeling and Analysis
A FE model of the viaduct was implemented in Strand71 (Strand7) that takes into account the geometric non-linearity of both the materials and the devices. The substructures were modeled with beam elements, characterized by a pseudo-elliptical hollow section with a thickness proportionally variable to height. Moreover, a moment–curvature hysteresis model (theorized by Takeda et al.) was adopted for the piers (Takeda et al., 1970) in which monotonic behavior is described through a trilinear curve (Figure 4A) that considers the cracking of the concrete and the yield of the rebar. Even though Takeda's hysteretic model was originally proposed for simulating the load–displacement relation of RC subassemblies, it was widely used in the description of hysteretic moment–curvature or moment–rotation relation of RC members. It is a specialized rule normally used to model reinforced concrete frame structures in non-linear transient dynamic analysis. Thus, it was possible to assess the stiffness modification of the substructures in the transitional regime by controlling the redistribution of stresses in the viaduct piers. From the model implemented, the restraint devices demonstrate the following properties:
1. Vertical supports or fixed longitudinal support; these have an almost unlimited stiffness.
2. Shock transmitters that create very stiff restraint against any dynamic action while allowing slow movements of structures, such as those produced by thermal changes without opposing significant resistance.
3. Fluid viscous dampers devices (OP/OTP) with a non-linear behavior; these are cylinder/piston devices that exploit the reaction force of silicon fluid forced to flow through an orifice and/or valve system. In detail, the applicable force–velocity law of (OP/OTP) is non-linear, i.e., (Figure 4B),
where α = 0.15, F is the force, C is the damping constant, and V is the velocity.
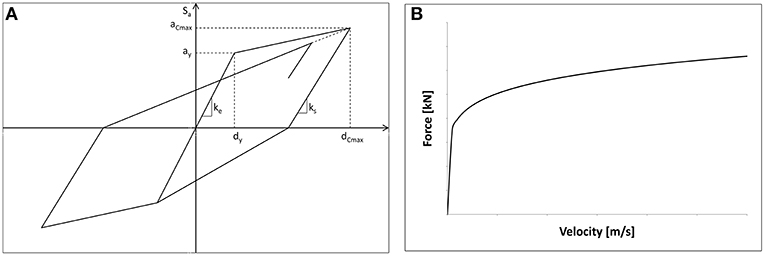
Figure 4. (A) Takeda hysteresis model. (B) Force–velocity curve (F = C.Vα).
The dissipative devices were modeled using spring-damper elements associated with the force–velocity law as of Equation 1. The shock transmitters were modeled as truss elements with high stiffness.
Figure 5 shows the moment–curvature diagram for the piers in the longitudinal direction.
Two types of viscous damper devices were adopted:
1. OP 300/175 in the transversal direction, and
2. Double devices OTP50/300 in the longitudinal direction.
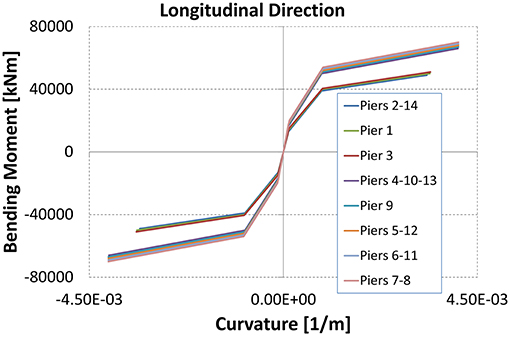
Figure 5. Piers: moment–curvature diagram.
In the application of Equation 1, the damping constant C is 3,524 kN/(mm/s)α for devices OP 300/175 and 212.5 kN/(mm/s)α for the OTP50/300. Due to the complex orography of the land, further assessments were conducted to select FVD device parameters, with the aim of achieving a greater balance for tall piles and to protect low piles from high shear forces. Moreover, the following parameters were assigned:
• OTP50/300: Maximum design load Fd = 500 kN; (ii) Maximum design velocity Vd = 300 mm/s;
• OP 300/175: Maximum design load Fd = 3,000 kN; (ii) Maximum design velocity Vd = 200 mm/s;
Figure 6 shows the force–velocity relationship for the OP 300/175 and OTP50/300 devices; in the same figure, the comparison between theoretical and experimental constitutive law for these devices (OP and OTP) is presented. Moreover, in order to obtain further control of the results and to provide useful information on the seismic behavior, both Incremental Dynamic Analyses (IDA) and Linear Modal Analyses (LMA) were carried out (Pucinotti et al., 2015). The non-linear dynamic analysis outcomes were compared with those from the modal analysis that used a design response spectrum, in order to analyze the differences in terms of global shear force at the base of the structures.
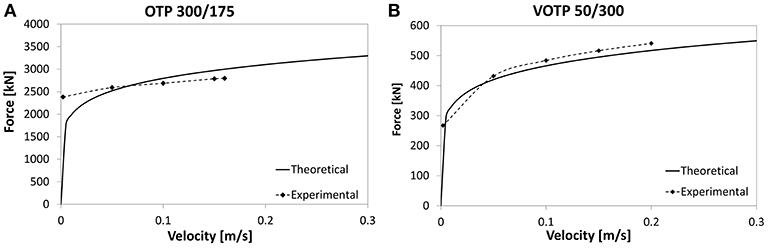
Figure 6. Comparison between theoretical and experimental constitutive law for devices. (A) OTP 300/175 devices. (B) VOTP 50/300 devices.
In accordance with the Italian Code (Ministero delle Infrastrutture, 2008), the following seismic parameters were adopted: (i) rated life of the work, VN = 50 years; (ii) use coefficient, CU = 2; (iii) reference life of the work, VR = 100 years; (iv) soil type C; and (v) topographic coefficient T1 = 1. Figures 7A,B shows the accelerograms and the spectra, respectively. In detail, the following steps were taken:
– Non-linear time history analysis: both the Italian code (Ministero delle Infrastrutture, 2008) and Eurocode 8 (CEN, 2004, 2005) highlight three groups of accelerograms consisting of pairs of simultaneous ground motions as input for seismic structural analysis. When using artificial accelerograms, the samples used must be adequately qualified with regard to both the seismogenetic features of the sources and the soil conditions; moreover, their values must be scaled for the zone of reference. In other words, in accordance with Eurocode 8 (CEN, 2004), the following rules must be followed:
(i) A minimum of three accelerograms should be used;
(ii) The mean of the zero period spectral response acceleration values (calculated from the individual time histories) should not be smaller than the value of ag.S for the site of interest, where ag is the design ground acceleration on type A ground and S is the soil factor;
(iii) In the range of periods between 0,2T1 and 2T1, where T1 is the fundamental period of the structure in the direction where the accelerogram will be applied, no value of the mean 5% damping elastic spectrum, calculated from all time histories, should be <90% of the corresponding value of the 5% damping elastic response spectrum.
– Linear time history analysis: the results of this analysis were compared with non-linear time history analysis outcomes with the objective of selecting the appropriate behavior factor. This behavior factor “q” has been subsequently used to calculate the over-strength coefficient to be used in the assessment of non-dissipative zones.
– Modal analysis with design response spectrum (with behavior factor “q”) and validation of non-linear time history analysis by comparison of the shear at the base of viaduct piers (Ministero delle Infrastrutture, 2009).
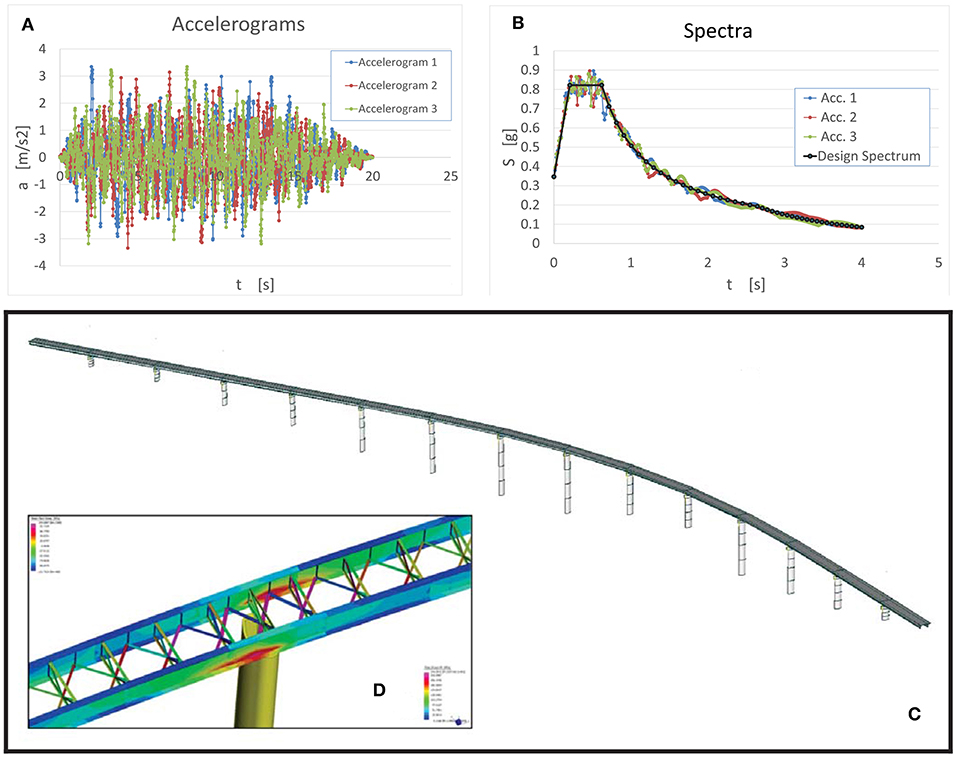
Figure 7. (A) Accelerograms. (B) Spectra. (C) Finite element model of the viaduct. (D) Strength in the steel elements of the superstructure.
According to section 7.9.2 of the Italian Code (Ministero delle Infrastrutture, 2008, 2009), the non-dissipative elements of a viaduct are as follows: deck, supports, foundation structures and the underlying soil, abutments if they support the deck through sliding bearings, or deformable devices.
After an earthquake, the superstructure must remain in the elastic range. To these ends, in the non-linear time history analysis, the most onerous transversal displacements at the top of the piers were considered.
These results were applied to a global FEM model with the following structural elements: (i) the principal longitudinal beams and the concrete slab, modeled by 4-node shell elements; (ii) the lattice beams and bracing, modeled by beam elements; (iii) the piers and the pier caps, represented with beam elements; (iv) the seismic devices, modeled by spring-damper elements; (v) beam-to-slab connections, represented with rigid-link elements.
The model of the bridge is shown in Figure 7C. The set of displacements used outcomes from the time history analysis, precisely at the step relative to 13.66 s, point in time registering the maximum displacement on pier seven, about 32.46 cm. The abovementioned displacements are reported in Table 1.
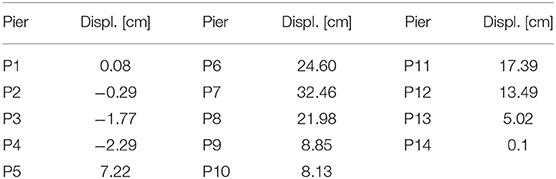
Table 1. Assigned displacements.
The results of calculations and assessments show that the metal deck elements remain inside the linear elastic range (Figure 7D).
Step 2: In Situ Static and Dynamic Testing after Construction
Static Loading Test
A static load test was performed to verify the actual structural behavior of the viaduct, compared with what was predicted under the theoretical point of view in the design step. The testing protocol envisaged the use of eight 40-ton trucks with 4 axles. The axle loads of the trucks were measured with newly calibrated, portable weighing scales. Multiple tests were carried out by loading the following spans: 1st test—spans 1, 2, and 3; 2nd test—spans 5, 6, and 7; 3rd test—spans 13, 14, and 15. Figure 8 shows the load patterns for the static tests with reference to the 1st and 2nd span.
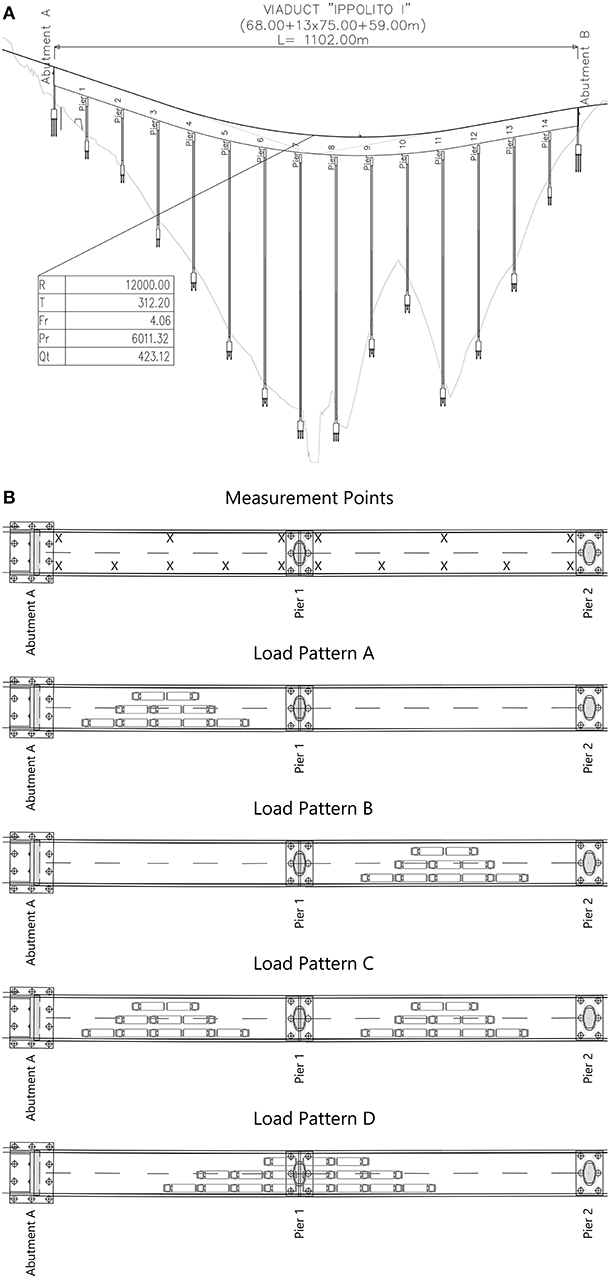
Figure 8. Viaduct “Ippolito 1”: (A) longitudinal section; (B) load combinations of the first and second span.
The measurement period for each load pattern was ~20 min. The overall time for the entire static load test was ~8 h. The vertical displacements of the bridge deck were measured using biaxial inclinometer and temperature recorders (Capetti WSD15TIIDRO); measurement points are shown as crosses (X) in Figure 8B.
The four main loading patterns A to D show truck positions on the bridge. As observed, the trucks were positioned back to back in order to provide symmetric loading and a maximum load effect. Table 2 shows the comparison between the theoretical (highlighted with a gray color) and experimental results for the case study.
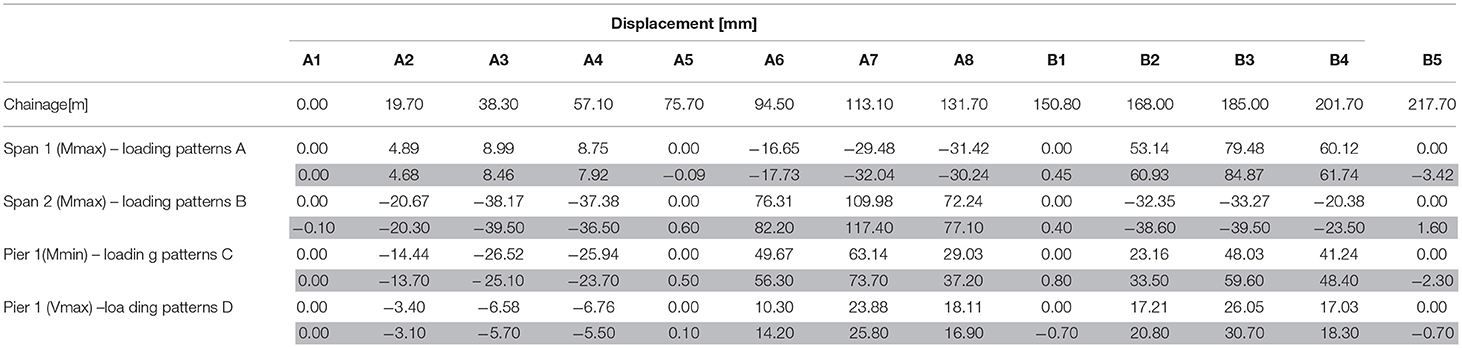
Table 2. Viaduct “Ippolito 1”—vertical displacement [experimental (white), numerical (gray)].
Dynamic Test
In order to validate the FEM model for the viaduct, a dynamic test was performed. The identification of the dynamic parameters (modal frequencies, damping ratios, mode shapes, and modal participation factors) actually provides an assessment of the global response of a system. In addition, experimental techniques for the dynamic identification provide a significant contribution in connecting assumptions and the actual behavior of a structure.
In the Identifying Structural Dynamics Analyses, techniques for experimental modal analysis (EMA) or, alternatively, operational modal analysis (OMA) can be used.
Traditional EMA uses excitation inputs while OMA aims to identify the modal properties of a structure excited by environmental sources.
Despite its usefulness, traditional EMA has some limitations; such as the following: (i) artificial excitation is normally conducted in order to measure frequency response functions (FRFs), or impulse response functions (IRFs). FRF or IRF would be very difficult or even impossible to measure using field tests and/or assessing large structures. (ii) Traditional EMA is normally conducted in a lab environment. This is at odds with real operational conditions in place in many industrial applications. (iii) Lab environments are generally suitable for individual component testing, instead of complete systems verification; furthermore, boundary conditions would need to be simulated. Therefore, the OMA technique (output only) is considered as the most suitable for important structures such as bridges or viaducts since evaluation can be performed without closing the viaduct to traffic. The campaign of dynamic surveys, which was carried out on all viaducts, were developed using 15 accelerometers (PCB 393A03, PCB393C) connected to a 24-bit data acquisition unit with Analogic/Digital Converter (N.I. C-Daq 9172 + 4 USB9234).
The acquisitions were recorded in two different conditions; i.e., with natural excitation in the absence of vehicular traffic (wind, microsystems, etc.) and during the passage of heavy vehicles. In the present case, where the number of available sensors (15) was lower than the desired number of DOFs, it was necessary to make more acquisitions by varying the position of the accelerometers to cover all desired measuring points. It was therefore necessary to use some reference sensors (maintaining the same position for each acquisition).
In the application of these techniques, operating in the hypothesis that the forcing (unknown) has the characteristics of a white noise, it is necessary to carefully select the total length of recordings. Generally, the duration of acquisitions is set equal to 1,000 ÷ 2,000 times for the first period of vibration on the structure. Another criterion is provided by the UNI 10985, which provides some guidelines to perform dynamic testing: the size (N) of each time sequence and the sampling step Δt must be fixed in order to obtain an adequate frequency resolution. Within the total registration period, the percent error in both auto-spectra and cross-spectra estimation is approximately equal to 1/√ Nd.
This means that in order to obtain an auto-spectra estimation with an error lower than 10%, it becomes necessary to set up a signal long enough to be divided in Nd = 100 temporal sequences; assuming an operation with Δt = 0.01 s (about 0.025 Hz), where no temporal sequences overlap, more than 68 min of acquisition is needed. If during the definition of the temporal sequences, we accept an overlap of 50% of the signal, the total duration of the registration can be reduced to 33 min.
In the case study, temporal histories of 2,400 s (40 min) with a sampling step of t = 0.005 s (200 Hz or freq. Nyquist 100 Hz) were chosen. Analysis was conducted as OMA, output only, as specified above. The identification of the modal parameters of the viaduct was developed using the frequency domain decomposition, enhanced frequency domain decomposition, and curve-fit frequency domain decomposition. This allowed us to validate the results obtained.
Step 3: Model Updating
The correlation between an initial FEM and experimental data is often poor. This is due to inadequate FEM or inaccurate experimental data. The factors that can determine low accuracy of FEMs are as follows: (i) poor modeling of the structural elements and (ii) poor modeling components, e.g., the omission of interaction among components like structural joints.
Another potential source of error is represented by changes in the values of physical parameters and material properties. These can significantly change FEM predictions. Model updating procedure can improve the correlation between the FEM modal analysis and experimental results. In this paper, model updating was used to minimize the “difference” between FEA and reference test data (UNI 10985, 2002; Bursi et al., 2008).
In the model updating, the following procedure was performed:
• estimation of initial parameters, Po, j
• computation of the sensitivity matrix [Sij] in order to construct the equation ΔRi = [Sij]ΔPj, where ΔRi is the residual difference between the ith predicted and experimental modal data, and ΔPj is the jth selected updating parameter;
• solving forΔPj: ΔPj = [Sij]+ΔRi, where [Sij]+ is the pseudo-inverse matrix of [Sij];
• introduction of the resulting parameter changes ΔPj into the model and re-computation of the modal parameters;
• procedure repetition until convergence criterion satisfaction.
In detail, as a first step, the first five experimental frequencies were considered as experimental modal data and the sensitivity matrix was numerically estimated as:
The parameters initially chosen for model updating were:
• Young's Modulus for concrete;
• Young's Modulus for steel;
• sidewalk thickness;
• span length;
• slab thickness;
• inferior plate thickness of the box girder.
The number of parameters to which the model is effectively sensitive corresponds to the rank of the sensitivity matrix. The valuation of this rank happens through the valuation of the single value decomposition of the sensitivity matrix. The rank of the sensitivity matrix is four. Afterwards, sensitivity analyses on the five parameters meant the following parameters could be adopted:
• Sidewalk thickness;
• Span length of the bridge;
• Slab thickness;
• Inferior plate thickness of the box girder.
At the same time, in the FEM, the experimental elastic modulus of the actual materials (steel and concrete) was introduced.
Comparisons
A summary of the acquisitions (setup), recorded in two different conditions (i.e., with natural excitation in the absence of vehicular traffic—wind, microsystems, etc.—and during the passage of heavy vehicles), were subsequently processed using a modal analysis software, as follows:
a) Acquisition in the absence of vehicular traffic—natural excitation:
— Number of spans investigated: 15;
— Number of setup: 16;
— Number of recorded signals: 240;
— Sampling step: 100 Hz;
— Acquisition time: 2,400 s.
b) Acquisition at the passage of heavy vehicles:
— Number of spans investigated: 15;
— Number of setup: 16;
— Number of recorded signals: 720;
— Sampling step: 100 Hz;
— Acquisition time: 120 s.
Table 3 shows the comparison between experimental frequencies and numerical frequencies obtained using Strand7 software. The second column reports the numerical frequencies, while column 3 reports the experimental frequencies after some iteration of the model updating procedure. It is easy to verify the effectiveness of the FE model (FEM).
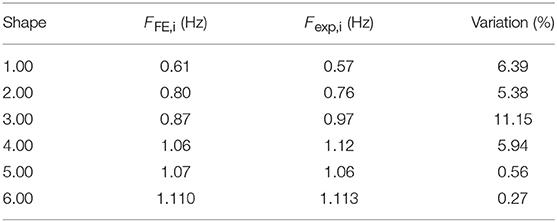
Table 3. Comparison between experimental and numerical frequencies.
Figure 9 refers to dissipation devices and shows the comparison between the results of the non-linear dynamic analysis (performed using the theoretical curves) and the experimental data (derived from the laboratory tests); in fact, the response of devices was assessed by experimental laboratory tests as shown in Figure 2D. In this context, the term experimental must be understood as a model in which the laboratory experimental curves of the devices were used with respect to the model with the nominal law. It is possible to appreciate the substantial congruence of the two analyses in terms of forces and displacements.
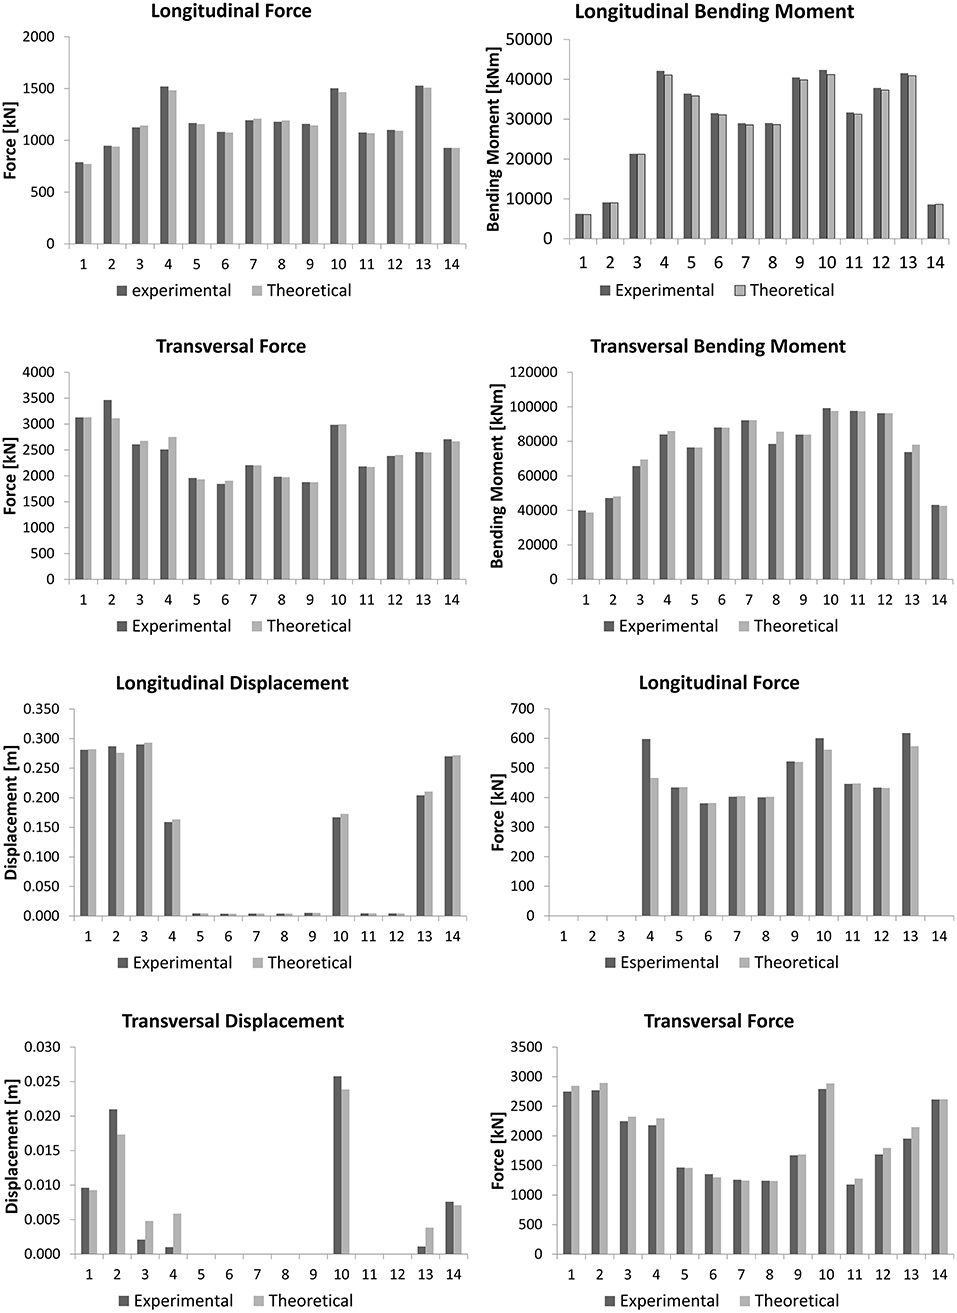
Figure 9. Strength at the base of the piers and force–displacement in the devices.
Figure 10 shows the previous comparison referred to in the time history analysis. From the moment–curvature diagrams (see Figure 11), it is possible to check how the piers remain within the linear range (energy dissipated by the concrete cracking avoiding yield on the rebar).
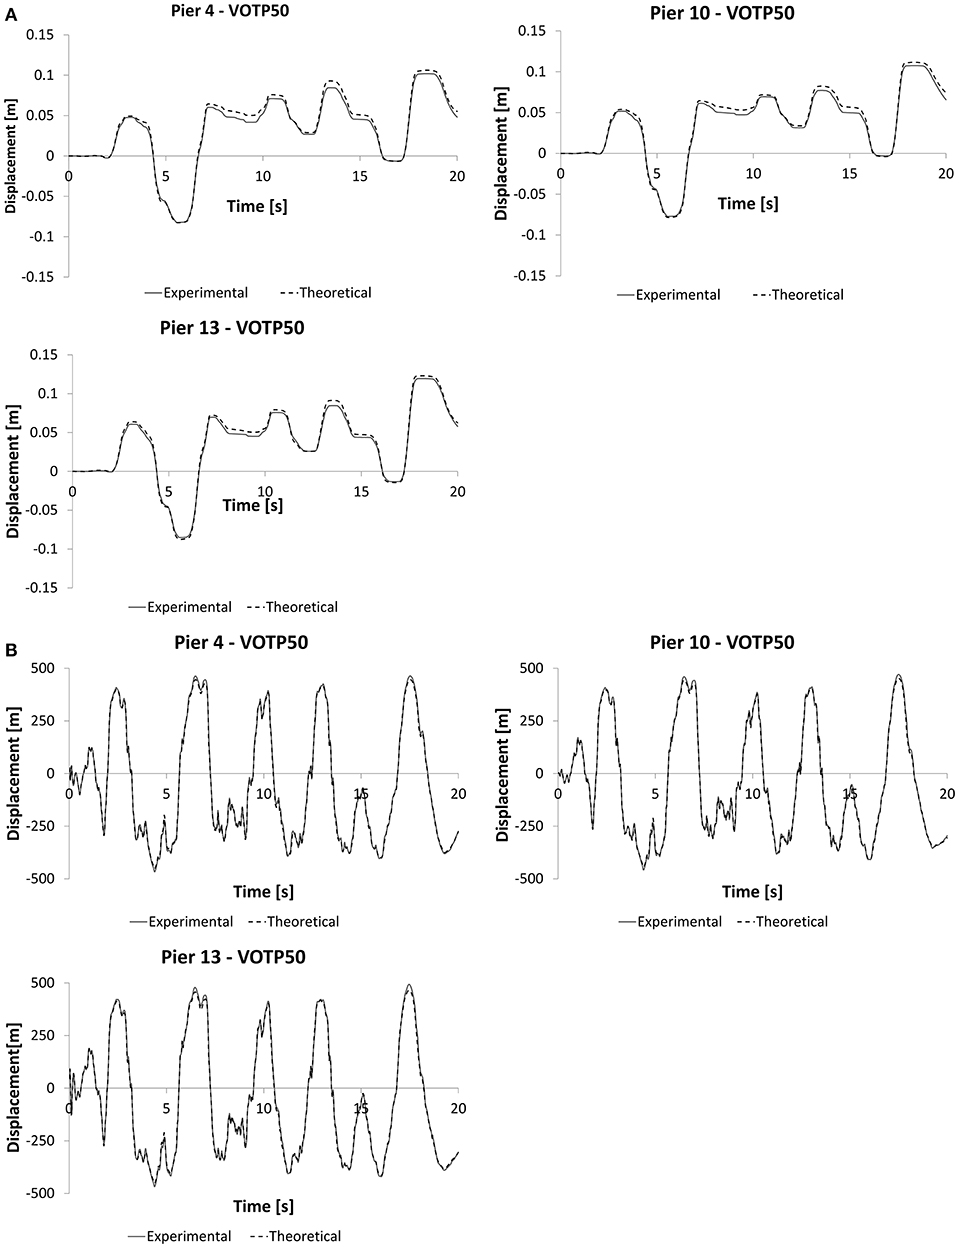
Figure 10. Comparison between experimental and numerical results: (A) displacement vs. time curves between OTP and OTP devices; (B) force vs. time curves of the OTP and OTP devices.
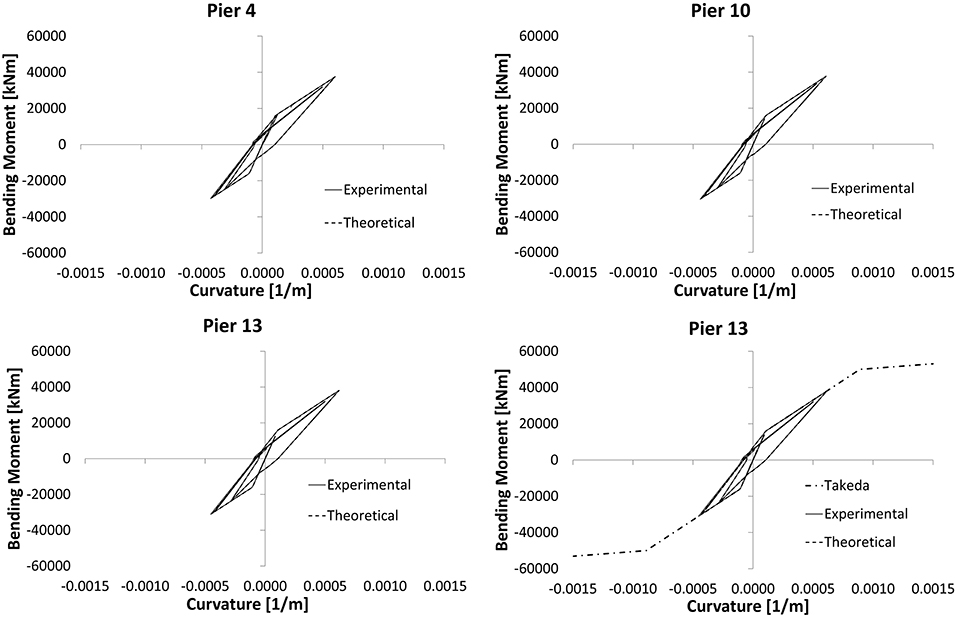
Figure 11. Longitudinal moment vs. curvature diagrams at the base of the piers: comparison between experimental and numerical results.
The devices used are not automatically re-centering. In fact, when external actions cease, the displacements return almost to zero. If excessive displacement occurs, the re-centering is still simple. It operates by connecting the circuit of the devices to a control unit. The device in this case acts as a jack for the re-centering of the bridge. Detail on re-centering capability can be found in Quaglini et al. (2017), where the re-centering capability is recognized as a fundamental function of any effective isolation system. Furthermore, in Figure 11, the term experimental must be understood as a model in which the laboratory experimental curves of the devices were used with respect to the model with the nominal law; moreover, Takeda's curve for pier 13 is shown in Figure 11.
In Table 4, the results of the two analyses (linear and non-linear) in terms of shear stress at the base of the piers are compared; moreover, it shows the estimation of the behavior factor q = 1.5.

Table 4. Shear stress at the base of the piers (in kN) and estimation of the behavior factor.
The behavior factor q shown in Table 4 was assessed from the IDA (Bursi et al., 2006); it is defined as follows:
where pgay is the peak ground acceleration corresponding to first design yielding and pgau is the peak ground acceleration corresponding to collapse.
Conclusions
Seismic protection of structures in general, and bridges in particular, is very complex. In particular, the analysis of bridges with fluid viscous dampers and shock transmitting devices must be performed using the best possible analytical model. Indeed, a large number of factors must be treated accurately in order to increase efficiency in the preservation of human life.
For complex structures, such as the viaduct under examination, which contains numerous devices, fluid-viscous dampers, and shock transmitters integrated with bearings, design assisted by testing is a necessary procedure.
Consequently, the FE modeling of the viaduct required a model updating procedure for its optimization. In fact, the viaducts built within the “Caltagirone Project,” can be fully defined as works of great interest for both the construction methods adopted and the techniques of stress control in the seismic stage.
The design process resolved seismic issues deriving from structural irregularities (altimetric and planimetric) as well as from the high seismicity of the area. The analyses were carried out using a Capacity Design approach, using non-linear seismic dissipative devices integrated to supports and checking that the substructures maintain substantial elasticity. For this reason, Takeda's model is used to simulate the hysteretic behavior of the piers.
In addition, fluid viscous dampers and shock transmitters integrated with bearings were designed in accordance with the different stiffness by the substructures, thus limiting and partially dissipating stresses induced by earthquakes, in order to keep the deck and the substructures substantially elastic for Life-Safety Limit State condition (at the ULS).
The verifications carried out have demonstrated the capability of structures to withstand the stresses under the CLS condition without damage, plus they ensure the curvature capability by piers.
The comparisons between experimental and numerical results together with the demanding qualification tests carried out in this study demonstrate that the hydraulic devices are an efficient solution to control the seismic stresses induced on the viaduct and in its substructures, confirming the reliability of the aforesaid devices that ensure greater structural safety.
Author Contributions
All authors listed have made a substantial, direct and intellectual contribution to the work, and approved it for publication.
Conflict of Interest Statement
The authors declare that the research was conducted in the absence of any commercial or financial relationships that could be construed as a potential conflict of interest.
Footnote
1. ^Strand7, Release 2.4. —Full-featured finite element analysis—Design and built for Windows.
References
Bursi, O. S., Bonelli, A., Mammino, A., Pucinotti, R., and Tondini, N. (2008). “External post-tensioning retrofitting and modelling of steel–concrete box-girder bridges,” in Proceedings of 7th International Conference on Steel Bridges Guimaraes Portugal 4-6 June, 1st Edn., eds. P. J. S. Cruz, L. S. da Silva, and F. Schroter (Guimaraes: Steel Bridges–Advanced Solutions and Technologies– published by ECCS, 425–34.
Bursi, O. S., Zandonini, R., Salvatore, W., Caramelli, S., and Haller, M. (2006). “Seismic behavior of a 3D full-scale steel–concrete composite moment resisting frame structure,” in Proceedings of Fifth International Conference on Composite Construction in Steel and Concrete (Kruger National Park), 641–52.
CEN (2004). EN 1998-1-1; Design of Structures for Earthquake Resistance. Part 1: General Rules, Seismic Actions and Rules for Buildings. Bruxelles.
CEN (2006). EN1993-1-3; Design of Steel Structures. Part 1–3: General Rules—Supplementary Rules for Cold-Formed Members and Sheeting. Bruxelles.
Contin, A., Fiordaliso, G., Pucinotti, R., and Soffiato, A. (2015a). “Fluid viscous dampers and shock transmitters in the realization of multi-span steel–concrete viaducts. Design, testing and commissioning according to the UNI EN 15129:2009 and Italian standard “DM14.01.2008”: GENERAL ASPECTS,” in Proceedings of The Italian Steel Days, CTA (Salero), 683–890.
Contin, A., Fiordaliso, G., Pucinotti, R., and Soffiato, A. (2015b). “Fluid viscous dampers and shock transmitters in the realization of multi-span steel–concrete viaducts: case study—The Ippolito 1 Viaduct—,” in Proceedings of The Italian Steel Days, CTA (Salero), pp. 691–698.
De Domenico, D., Ricciardi, G., and Takewaki, I. (2019). Design strategies of viscous dampers for seismic protection of building structures: a review. Soil Dyn. Earthquake Eng. 118, 144–165. doi: 10.1016/j.soildyn.2018.12.024
Makris, N., and Zhang, J. (2004). Seismic response analysis of a highway overcrossing equipped with elastomeric bearings and fluid dampers. J. Struct. Eng. 130, 830–45. doi: 10.1061/(ASCE)0733-9445(2004)130:6(830)
Ministero delle Infrastrutture (2008). DM 14 Gennaio 2008, Norme Tecniche per le Costruzioni. Suppl. Ord. n.30 alla G.U. n.29 del 4/2/2008.
Ministero delle Infrastrutture (2009). Circolare 2 Febbraio 2009, Istruzioni per L'applicazione DELLE NUOVE NORME Tecniche per le Costruzioni. Suppl. or. n.27 alla G.U. n.47 del 26/2/2009;.
Ministero delle Infrastrutture e dei Tasporti (2018). DM 17 Gennaio 2018, Aggiornamento delle ≪Norme tecniche per le Costruzioni≫. Suppl. Ord. alla G. U. n. 42 del 20/02/2018.
Ministero delle Infrastrutture e dei Tasporti (2019). Circolare 21 Gennaio 2019, Istruzioni per L'applicazione dell'≪Aggiornamento delle “Norme tecniche per le costruzioni”≫. di cui al DM 17 gennaio 2018; Supp. Ord. alla G.U. n. 35 del 11 febbraio 2019.
OPCM 3274 (2003). Ordinanza del Presidente del Consiglio dei Ministri del 20 marzo 2003 “Primi elementi in materia di criteri generali per la classificazione sismica del territorio nazionale e di normative tecniche per le costruzioni in zona sismica”. G.U. 8/5/2003 n 105.
Pucinotti, R., Tondini, N., Zanon, G., and Bursi, O. S. (2015). Tests and model calibration of high-strength steel tubular beam-to-column and column-base composite joints for moment-resisting structures. Earthquake Eng. Struct. Dyn. 44, 1471–1493. doi: 10.1002/eqe.2547
Quaglini, V., Gandelli, E., Dubini, P., Limongelli, M. P., et al. (2017). Total displacement of curved surface sliders under non-seismic and seismic actions: a parametric study. Struct. Control Health Monit. 24, 12:e2031. doi: 10.1002/stc.2031
Takeda, T., Sozen, M. A., and Norby Nielsen, N. (1970). Reinforced concrete response to simulated earthquakes. J. Struct. Division 96, 2557–2573.
Tian, Q., Hayashikawa, T., and Wei-Xin, R. (2016). Effectiveness of shock absorber device for damage mitigation of curved viaduct with steel bearing supports. Eng. Struct. 109, 61–74. doi: 10.1016/j.engstruct.2015.11.026
Keywords: steel–concrete bridges, viaduct, shock transmitter device, seismic devices, earthquake, fluid-viscous damper device, case study
Citation: Pucinotti R and Fiordaliso G (2019) Multi-Span Steel–Concrete Bridges With Anti-seismic Devices: A Case Study. Front. Built Environ. 5:72. doi: 10.3389/fbuil.2019.00072
Received: 10 February 2019; Accepted: 17 May 2019;
Published: 12 June 2019.
Edited by:
Dario De Domenico, University of Messina, ItalyCopyright © 2019 Pucinotti and Fiordaliso. This is an open-access article distributed under the terms of the Creative Commons Attribution License (CC BY). The use, distribution or reproduction in other forums is permitted, provided the original author(s) and the copyright owner(s) are credited and that the original publication in this journal is cited, in accordance with accepted academic practice. No use, distribution or reproduction is permitted which does not comply with these terms.
*Correspondence: Raffaele Pucinotti, cmFmZmFlbGUucHVjaW5vdHRpQHVuaXJjLml0