 Hamad Almujibah1,2*
 John Preston1
- 1Faculty of Engineering and Physical Sciences, University of Southampton, Southampton, United Kingdom
- 2College of Engineering, Taif University, Taif, Saudi Arabia
Constructing High-Speed Rail technology between the Saudi Arabian cities starts raising many challenging issues of a different nature ranging from technical to operational, which require huge investments in infrastructure, operations, and maintenance. However, this paper develops a new methodology to calculate the total social costs of building a new HSR worldwide and applies this using the case study of the Riyadh-Dammam corridor in Saudi Arabia. This is done through a Spreadsheet Cost Model mainly based on Microsoft Excel that includes operator cost, user cost, and external cost. In order to determine the total social costs of a Riyadh-Dammam HSR line, the annual travel demand is forecasted of 13,205,212 passengers in the first year of operation. In this case, the gravity demand model is used to forecast the demand, as a function of independent variables for the cities alongside with the proposed line such as the population, GDP per capita, the generalized journey time, unemployment rate, years since opening the corridor, and the dummy variable. As a result, the total social costs of constructing and operating the proposed HSR line is €1,090,106,913 per year resulting from the sum of the following categories. First, the total operator cost (OC) is €859,797,307 per year, which is mainly based on the total infrastructure and rolling stock costs of €750,852,759 per year and €108,944,548 per year, respectively. Second, the total user cost is €216,769,247 per year resulting from the sum of total annual passenger access/egress time, waiting time, and in-vehicle time. Finally, the total external environmental cost is €13,540,359 per year resulting from the sum of average costs of noise and air pollution, climate change, and accident.
Introduction
High-Speed Rail (HSR) is defined as a technical topic and complex reality, comprised of different various technical elements such as infrastructure (new lines designed to run at “a maximum speed of 250 km/h or more”), rolling stock (special designed train sets), and operations rules, maintenance systems, etc., using highly sophisticated technology (International Union of Railways, 2017a). HSR is also involved into three main characteristics, including safety, capacity, and sustainability that are offered to customers and society (Angoiti, 2010). In addition, HSR has become a significant technological achievement and a symbol of efficiency, besides being a new transportation mode for passengers in the twentieth century (Campos et al., 2007b).
The global HSR is rapidly expanding worldwide across continents, delivering fast and efficient mobility to numerous nations every day. Currently, HSR is in operation in more than 16 countries, including Japan, France, Germany, Spain, Belgium, United Kingdom, South Korea, Italy, Taiwan, China, Saudi Arabia, and the Netherlands. Additionally, HSR is in under construction in Iran, Morocco, USA, Switzerland, Mexico, and other countries in the world. As of January 2019, the total length of HSR networks in operation worldwide is 45,996 kilometers, divided between 14 Asian countries, 17 European countries, and 8 other countries. Table 1 shows the countries with an HSR in operation or under construction, with the total length of their network, while China has the largest network of HS services worldwide.
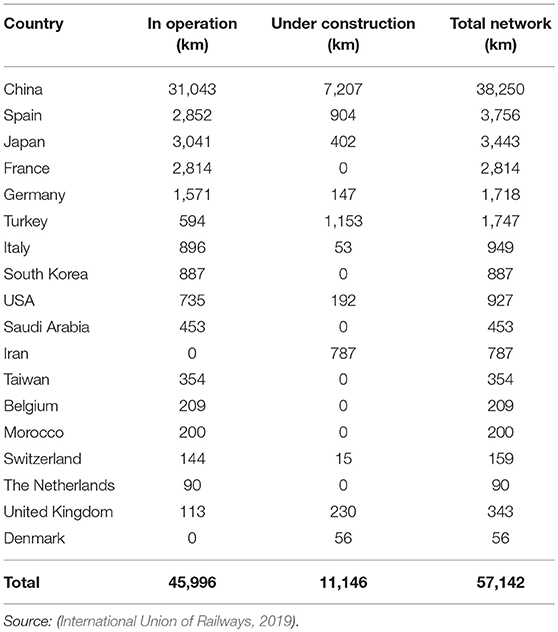
Table 1. Overview of HSR network by country in 2019.
In HSR projects, the investment may be one of the measures that leads passenger transport volume to shift from other transport modes such as road, air transport to rail, and that would help to reduce the congestion, balance the modal split and decrease environmental negative impacts. In this case, building high-speed lines requires high-quality infrastructure and that could cause more costly investments than conventional railways but a change in generalized travel costs when it comes to journey time can be considered (Gorlewski, 2011). However, the building, operating and maintaining HSR lines mainly involves an important total of costs that deal with the development plan of the transport sector and the transport policy of a country. In Europe, three different types of lines developed for high-speed infrastructure: building new high-speed lines, upgrading existing conventional lines for speeds of 200 km/h, and upgrading conventional lines for speed that must be adapted to each case same as in Germany of the fully mixed model. In this case, four different exploitation models have been identified as shown in Figure 1.
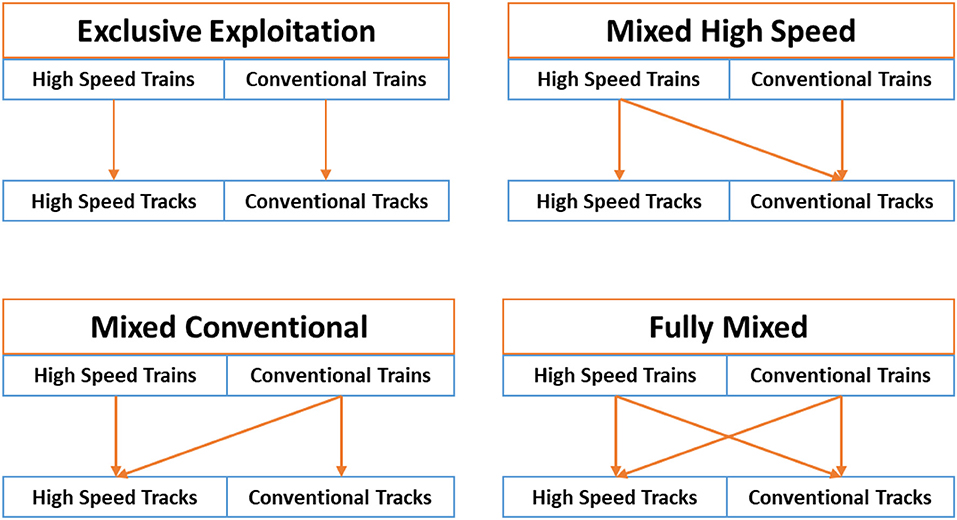
Figure 1. High-speed degrees of separation. Source: (Rutzen and Walton, 2011; De Rus, 2012).
First, the Japanese Shinkansen model is considered by a full division of infrastructure between HSR and conventional rail services. Shinkansen lines adopted this model since 1964 due to the increasing capacity constraints in the current classic rail lines that were constructed in narrow gauge (1,067 mm), as formed by the geological and geographic features of the country. On the other hand, the Japan National Railway (JNR), decided to design and build the new high-speed lines in standard gauge (1,435 mm), as well as the market of HSR and conventional rail services are completely independent (Campos et al., 2006). Second, France is a good example of the mixed high-speed model that has been operated by TGV (Train a Grande Vitesse) since 1981, where HS trains can run either on specific newly constructed lines or on upgraded conventional lines at lower speed.
In this case, a number of passengers will be switched from conventional trains as the HSR is servicing a larger network and more railway stations. Thirdly, the mixed conventional model is used in Spain, in which some conventional trains can use the high-speed tracks. In addition, this model has been operated by Spain AVE (Alta Velocidad Espanola), where some of the Spanish conventional trains were constructed in broad gauge (1,676 mm). For example, the Talgo trains have been developed, as a specific designed technology for rolling stock to accelerate the interoperability of worldwide services and use at the specific HSR infrastructure for a higher speed (De Rus, 2012). During the period between 1992 and 2008, the developed technology allows trains to transfer between different rail gauges. However, the new rolling stock can transfer from conventional lines to a high-speed line without stopping and expanding the mixed HSR services to include an increased number of places, especially cities where the HSR infrastructure has not yet been built (De Urena, 2016). As a result, the main advantage is the saving costs for the acquisition and maintenance of rolling stock, and providing a flexible high-speed services on existing lines. Lastly, the fully mixed model that is used in Germany and Italy for the maximum flexibility where both HSR and conventional trains can run on each type of infrastructure (De Rus, 2012). In Table 2, China high-speed rail network had carried about 464.1 billion of passengers per kilometer in 2016, as the highest number of traffic demand in the world whilst Taiwan HSR transported the lowest number of traffic demand of 10.5 464.1 billion of passengers per kilometer (International Union of Railways, 2019).
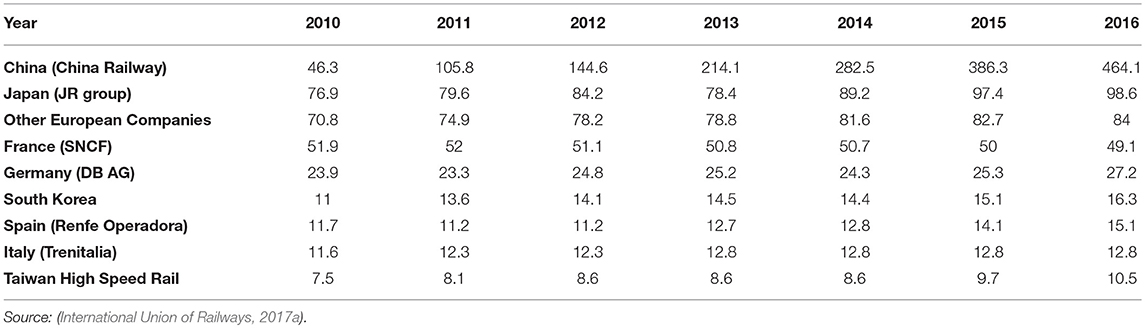
Table 2. High Speed traffic in the world (billion of passenger-km).
Overview of High-Speed Rail Technology
High Speed Rail in Various Countries
Japan
Japan is considered for large cities in terms of a densely populated country with a surface area of ~380,000 square kilometers and a total population of 128 million in 2015 (Statistics Bureau, 2016). In 2015, Japan was the third largest economy in the world, having a gross domestic product of €3.691 trillion and GDP per capita of €27,879 (International Union of Railways, 2017b). In the building of HSR, Japan was an inventor in the world and the decision in the development of the HSR network in Japan known as the Shinkansen was made after the conventional line (for both passenger and freight) had become very congested, meaning that more capacity was needed. However, the first line in its network came into service in October 1964 with a length of 515 kilometers, linking two largest cities in the country, Tokyo and Osaka for an operating a speed of 210 km/h (International Union of Railways, 2017b). In terms of ATC, it is a safety mechanism system used along the entire network of the Tokaido Shinkansen to display a maximum speed limit to the driver. It also automatically applies the brakes if the driver exceeds the speed to slow the train to its allowable speed (JR-Central, 2017). In this case, the Shinkansen has a perfect of safety record, with no train for more than 50 years since the first line commenced operation. It also has first-rate punctuality with an average delay of <1 min per train (0.2 min per train). For example, the Tokaido Shinkansen line links Tokyo, the capital of Japan with Osaka via Nagoya for a high-frequency service of 358 trains per day (10 trains at peak hours from Tokyo), carrying around 445,000 passengers per day in 2016 compared to 61,000 passengers in 1964 (JR-Central, 2017). Currently, the Japanese Shinkansen has nine high-speed lines with a total network of 3,041 kilometers in operation, and 402 kilometers under construction (International Union of Railways, 2019).
Due to the high rate of earthquakes in Japan, slope protection, seismic reinforcement of infrastructure, and wind barriers and erection of avalanche fences were used for the HSR infrastructure construction, including tunneling and technical challenges to reduce the risks of natural disasters (Palacin et al., 2014).
France
France is located in Western Europe, and with a gross domestic product of €1.815 trillion, it ranks 10th in the world and €28,688 of GDP per capita in 2015. The development of HSR system in Japan was watched closely by France, as the French National Railway (SNCF) needed to provide extra capacity on the main line connecting two largest cities, Paris and Lyon. Offering faster services was also considered and it decided to adopt the Japanese Shinkansen approach of building an HSR line on a new alignment. In 1981, France became the first country in Europe providing HSR service that was opening between Paris and Lyon known as TGV Sud-Est for a distance of 419 kilometers in about 2 h, followed by other HSR lines (TGV Atlantique, TGV Mediterranee and TGV Rhone-Alpes, TGV Nord, TGV Est) (Amos et al., 2010; International Union of Railways, 2010b). France has longer HSR corridors serving small cities with a lower demand; the population of the country is more distributed. In France, a dedicated line for passenger traffic, high-frequency operations with short travel times, and integrating HSR with existing railway network were three principles related to the defining concepts of the first HSR line, as it was the lowest in terms of the construction cost per kilometer. In this case, achieving high operating speeds, reducing the costs of constructing, operating, maintaining new HSR lines and rolling stock, and optimizing capacity are factors that are based on traffic growth and contributed to the increased profitably of HSR systems. For example, the TGV Mediterranee with seven long viaducts and one long tunnel of the length of 17 and 13 kilometers, respectively cost only €12.29 million per kilometer compared to the cost of the first TGV Sud-East line that was just €3.28 million per kilometer (Arduin and Ni, 2005).
Germany
Germany is located in Central Europe and maintains the largest economy in Europe, with a GDP of €2.53 trillion and €31,065 of GDP per capita per year. In Germany, the Ministry of Transport had a consideration with the Centre of Railway Management at the beginning, on a matter of whether building new lines should be following the Japanese and French Model on being dedicated only to passenger traffic or it would be best to mix passenger and freight traffic (Ebeling, 2005). HSR lines were developed by the German federal transportation in at the beginning of 1970, in order to increase the level of congestion on the current rail network and make the rail competing with other transport modes. However, the first HSR line in Germany was constructed to support the classic train service in order to reduce the traveling time by running at a speed of 200 km/h, while newer lines run at speed up to 300 km/h. In this case, the HSR Intercity Express (ICE) has a total of 1,475 kilometers in operation and 437 kilometers under construction (International Union of Railways, 2010c).
In Germany, the Deutsche Bahn (DB) holdings manage the operation of passenger and freight rail, which was found in 1994 and it operates ICE trains outside of Germany. On the other hand, most of the finance in constructing HSR lines comes from the federal government, as well as from local and state governments. The ICE is also designed to connect markets to the main cities inside and outside the country, as the ICE service is already provided to major European cities such as Paris, Brussels, and Amsterdam, and it intends to expand the service between Frankfurt and London (International Union of Railways, 2010c). In Table 3, the German ICE system has shown steady growth, as it was carrying about 74 million passengers in 2009, compared to 5,100 million passengers in the first year of its operation (1991).
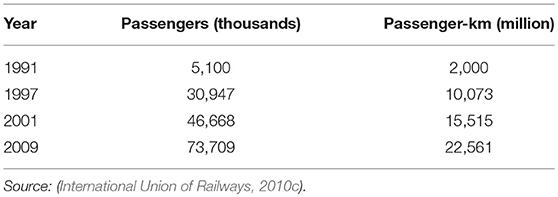
Table 3. Germany's High-Speed Rail Passenger Traffic.
In 1998, Germany had the worst HSR accident in the world close to the village of Eschede, as an HS train derailed and crashed into a road bridge with the impact of 101 fatalities and 88 injuries (Janic, 2017).
Spain
Spain is located in Southwestern Europe, with a GDP per capita of €25,966 in 2016 and 3% of an average annual growth (Hortelano et al., 2016). In Spain, the first HSR line was opened in 1992, connecting Madrid, Cordoba and Seville, stretching from the center of the country to the southern side of the Iberian Peninsula for a length of 471 kilometers, while Seville hosted the Universal Exposition in April 1992. The HSR service is called Alta Velocidad Espanola (AVE) and operated by Renfe Operadora, the state-owned railway company. On the other hand, the railway infrastructure is managed by another state-owned company called ADIF, as Spain has rapidly expanded its high-speed service network since the opening of the first HSR line. As shown in Table 7, Spain's HSR has a network length of 2,852 kilometers in operation and 904 kilometers under construction, and that makes Spanish HSR network the longest in Europe and operates at a maximum speed of 310 km/h (International Union of Railways, 2019).
In Spain, the development of a high-speed network has been largely financed and funded by government and European Union sources. In this case, Spain took advantage of European funds after joining the EU in 1986 to develop its HSR network. However, the first high-speed rail line was built based on the technical standards of the TGV network with a standard gauge of 1,435 mm (Hortelano et al., 2016). In 2013, there was an accident of HS train on the Madrid-Ferrol route due to doubling the allowed speed of 80 km/h at the entering of a bend. This accident took place about 4 kilometers outside the Santiago's station, which is located in the northwest of Spain with the impacts of 79 fatalities and 139 injuries (Janic, 2017). In Table 4, the Spain AVE system has shown steady growth, as it was carrying about 28,751 million passengers in 2009, compared to 1,314 million passengers in the first year (1992).
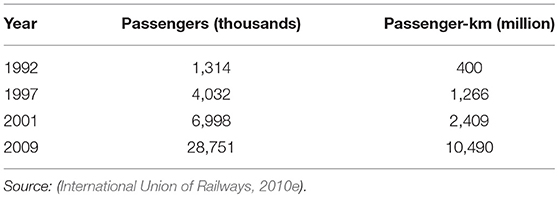
Table 4. Spain's High-Speed Rail Passenger Traffic.
United Kingdom
The United Kingdom is located in Western Europe on an island off the coast of Belgium and France, with a GDP of €1.84 trillion and €29,426 of GDP per capita per year. The idea of the HSR service in the UK was planned in 1998 to build the HSR line into one single project but it was changed and divided it into two sections due to financial difficulties. In 2003, the first HSR line was opened in the UK between the Channel Tunnel and London, called HS1, as its segment provides direct international service to Paris and Brussels. The first section runs from the Channel Tunnel to Fawkham Junction over a distance of 75 kilometers and has an operating speed of 300 km/h. Moreover, this section cost €2.16 billion and opened for public in 2003 on time and on budget. On the other hand, the second section was opened in 2007, connecting the Southfleet Junction into central London's St. Pancras Station with a cost of €3.75 billion (International Union of Railways, 2010f). This line is the most expensive HSR line ever built in the world due to its lengthy tunneling that was constructed to avoid environmental objections (Nash, 2010). With the opening of the HS1, travel times were mostly reduced, as it is only taking more than 2 h from London to Paris and fewer than 2 h from London to Brussels.
In 2009, HS2 was formed by the Department of Transport to develop plans for new HSR network, connecting London to Birmingham for a distance of 205 kilometers in the first section. In addition, two segments are included: one from London to Manchester and the other to Leeds in the second section for a distance of 335 kilometers, with an operating speed of 360 km/h for whole HS2 network (International Union of Railways, 2010f). In this case, HS2 will be used separately by high-speed passenger trains, as it will be possible to have 18 train paths per hour and each train will be designed to provide a capacity for 1,100 passengers. The costs for the first section of HS2 route would be between €17.9 billion and €19.8 billion whilst the second section would cost a total of about €34.1 billion in 2009 prices. In the second section connecting London to Manchester and Leeds, some unit rates per kilometer were used over undulating terrain (€19.9 million), over flat terrain (€18.5 million), in the tunnel (€90.8 million) and through urban areas (€28.4 million) (Preston, 2010).
China
China is located in Asia continent and determined to be the fourth largest country in the world in terms of area with a GDP of €9.25 trillion and €6,885 GDP per capita. In China, the Chinese HSR network is owned, developed and operated by the Ministry of Railways (MOR) whilst the first HSR line was opened in 2003 between Qinhuangdao and Shenyang for a length of 405 kilometers and operating at a speed of 250 km/h (International Union of Railways, 2010a). As shown previously in Table 1, China has the largest HSR network in the world with a total of 31,043 kilometers in operation and 7,207 under construction due to strong support from Chinese government and regular investment. Due to the rapidly growing HSR network in China, it is larger than the combined HSR networks of 17 European countries (8,948 kilometers) and accounts for nearly 65% of all HSR lines in the world (International Union of Railways, 2019). By 2020, the Chinese HSR lines will connect 192 of prefectural level cities with around 783 stations and more than one station is necessary to build on the network in many cities due to a very high passenger (Chen et al., 2014).
As China is the world's most populated country in the word, one of its main reasons of developing Chinese HSR (CHSR) is to reduce the gap between the limited capacity of the railway network and the large social transportation demand, especially during the holiday. On the other hand, the cost of constructing a high-speed line with a speed of 300 km/h is about three times higher than a conventional rail line. For example, the investment of actual total infrastructure building the intercity high-speed line between Beijing and Tianjin was €2.63 billion for a length of 118 kilometers, while the total investment of the Wuhan-Guangzhou high-speed line for a length of 1079 kilometers was €3.44 billion (Chen et al., 2014).
Saudi Arabia
The Kingdom of Saudi Arabia is one of the richest developing countries in the world, and its economic wealth primarily comes from revenues of oil, which changed the kingdom from a pre-industrial to a modern industrial country (Al-Ahmadi, 2006). It is located in the Middle East on the Arabian Peninsula between the Red Sea and the Persian Gulf, and ranks the 13th largest country in the world based on land area (2.15 million square kilometers). The Saudi Railway Master Plan (SRMP) related to the development of rail line projects are classified into three phases of development, with the first phase covering the years 2010 to 2025; the second phase covering the years 2026 to 2033; and the third phase covering the years 2034 to 2040 (International Union of Railways, 2010d). In this case, the project of the first high-speed rail in Saudi Arabia, Haramain High-Speed Rail (HHSR) was considered high priority, as it is linking the two holy cities, Mecca and Madina via Jeddah and King Abdullah Economic City (KAEC) in Rabigh with a distance of about 450 km and a maximum operating speed of 300 km/h. Moreover, each train has a total length of 215 m including 13 cars with two-power cars generating a combined output of 8 MW to provide 417 seats (Ferran, 2017).
The total construction costs of HHSR were about €13.5 billion, including civil works, construction of stations, railway systems and rolling stock, and project management (Arabnews, 2017b). One of the main reasons that led the Saudi government to build the HHSR is due to the growing number of yearly pilgrims, Umrah visitors and residents who come to Mecca and Medina during the year. Another reason is to relieve congestion and reduce air pollution from vehicle exhaust on roadways between the cities. The HHSR will reduce the travel time between Jeddah and Mecca to 30 min and between Mecca and Medina to 2 h. In addition, many European rail infrastructure companies and rolling stock manufacturers had been involved in this project in a result to transport approximately of 11 million pilgrims, plus to the number of visitors traveling between the two holy cities (Railway Technology, 2008).
Moreover, this project will link the cities' centres, boosting local business and tourism along the line, as there are 35 Talgo350 high-speed trains designed and manufactured by Spanish Talgo to serve the HHSR line with the most advanced safety systems and there is an option of supplying 20 more. In addition, these trains are expected to reach a maximum speed of 330 km/h with a capacity of 417 seats per train (Aguinaldo, 2017; Llie, 2017). On 25th of September 2018, Saudi Arabia's King Salman has officially inaugurated the HHSR with initially operating eight trips per day in both directions for a fleet of 35 trains. In this case, the first train will depart on fourth of October from Mecca to Medina via Jeddah center station and King Abdullah Economic City whilst the service to Jeddah Airport is scheduled to commence by the end of March 2019 (Aldroubi, 2018).
Advantages and Disadvantages of High-Speed Rail
According to Rutzen and Walton (2011), there are direct social advantages of HSR systems, such as time savings for passengers, reduction in accidents, increase in comfort, reduce the delays and congestion in airports and roads, and reduction in environmental impacts.
Time savings are one of the main factors when considering competition between other modes. The perceived value of the benefits will depend on a number of elements, including whether the trip is for work or leisure, and the mode used to access the HSR station. Furthermore, time saving is related to mean journey length, value placed on travel time saving and relative door-to-door speeds, and the value of time is usually higher for business journeys than leisure or commuting journeys. In this case, the proportions of HSR travelers that are business users and trips that are generated can be determined as important variables (Preston, 2009).
The value of time of passengers is a dominant factor, and the convenience influences appear to be larger for business travel than for commuting. However, neighborhoods around major urban centres that are served by HSR can enjoy the accessibility benefits of HSR and transfer easily to and from the conventional railway network, while places along a HSR line might suffer lower accessibility levels by being avoided (Brunello, 2011). For example, in Spain, the advantage of HSR makes some cities such as Madrid, Cordoba, Toledo, Seville, and Barcelona more accessible and much easier for tourists to visit (Loukaitou-Sideris and Deike, 2015). However, the largest deviations come from conventional trains and planes, while the access, waiting, in-vehicle and egress times are distinguished beside time savings (Albalate and Bel, 2017). For example, around 42% of the main social benefits come from time savings, and most of the deviation traffic was from conventional trains for Madrid-Barcelona corridor (1998), Madrid-Seville (1987), Madrid-East Coast (2003) and Madrid-North (2002) (Albalate and Bel, 2017).
A second key benefit of HSR is safety. Although there have been some HSR accidents, and only few of them reported fatalities; HSR is the safest transportation mode of passenger fatalities per billion passenger-kilometers (Rutzen and Walton, 2011). Japan is the clear leader with no fatalities since the HSR services began in 1964, while France also has had no fatalities except two at stations on conventional lines of TGV trains. In general, HSR is much better than road transport and compares positively with air transport in terms of safety (Amos et al., 2010).
A third key benefit of HSR is that a greater level of comfort can be offered by HSR than other modes such as conventional rail, road or air travel. Factors affecting comfort include noise, space, acceleration, and other services that can be provided by HSR operators such as catering services, unlimited use of electronic devices, and even a nursery for children, in some cases.
Congestion and delays in road and airports can also be reduced by HSR. However, a higher capacity of transport is offered by HSR which is up to 400,000 passengers per day, and it is achieved on the Tokaido Shinkansen (Tokyo to Osaka, 515 km) (Angoiti, 2010; Rutzen and Walton, 2011).
When it comes to environmental impacts, HSR is known to be a lower polluting mode, although the quantity of polluting gases used by HSR depends on the amount of electricity consumed and the pollution arising from its generation. HSR also generates social benefits mostly reducing the accident rate through attracting road passengers to HSR (Pourreza, 2011; Albalate and Bel, 2017). Other indirect benefits achieved with HSR are related to economic development. For example, the Shinkansen has increased the employment rate in the city of Kakogawa located 230 kilometers away from the capital Tokyo by 8% (Pourreza, 2011). Increasing capacity on the route was the main reason for constructing the major HSR lines worldwide such as the first Shinkansen and TGV lines. For example, the spare capacity was one of the main reasons for not considering HSR development in the UK in the 1970s and 1980s when other European countries such as Italy started building their HSR lines (Givoni, 2006). However, there is a plan toward the attraction of economic activities to the major regional cities connected through HSR while systems can help contain urban sprawl and promote a more logical territorial structure (Rutzen and Walton, 2011). The key factor in the successful development of HSR is identification of priority corridors and that has been measured in terms of passenger demand, revenue and economic development. For example, the development of the Shinkansen HSR network has existed since its operation on 1964 and that has brought benefits to the regional and national economy while the local communities might contribute a proportion of the funding (Rutzen and Walton, 2011).
On the other hand, HSR also brings some economic, social and environmental disadvantages. First, land occupation and environmental damages, as the designers always try to avoid curved tracks for HSR that can cause accidents whilst trains operate at high speed over 250 km/h. In this case, the process of constructing infrastructure for HSR will take up many different lands such as residential areas, forestland, farmland, etc. In order to operate in straight lines, HSR has a high proportion of track on structures (viaducts, bridges, embankments) and in tunnels and cuttings. This leads to problems of visual intrusion, severance and ecological disturbances, Second, the huge investment necessary to build an HSR line that is mainly due to “the high maintenance costs and the low demand in many corridors,” which might make it difficult to justify some investments from a socioeconomic point of view (Lusvter, 2015). Third, the high fares mean that HSR users are largely from high-income groups, leading to concerns about social exclusion. In this case, the majority of low income riders use the conventional train or road transport (Chen et al., 2014).
Methodology
Literature Review
Operator Cost of High-Speed Rail Technology
Building an HSR infrastructure worldwide usually requires a specific design in order eliminate all technical issues that might limit the commercial speed, including the roadway-level crossings, and frequent sharp curves unsuitable for higher speed. In this case, it is difficult to compare the construction costs of different HSR projects to each other because of implementing a technical solution for each case (De Rus, 2012). In many HSR projects that are in service or under construction, the land and planning costs, and the cost of main stations are commonly excluded in the infrastructure construction costs, as the average cost of an HSR line per kilometers ranges from €10 to 40 million in 2009 prices (De Rus, 2012). Preston (2013) found out that the average of construction costs of HSR lines and the lowest costs were being attained in France and Spain as shown in Table 5 for costs range from €5.5 to 22.0 million and €9.7 to 24.9 million, respectively in 2017 prices. The low construction cost in Spain and France compared to Japan and Germany is due to the design high-speed lines in these countries for passenger trains only (Preston, 2013).
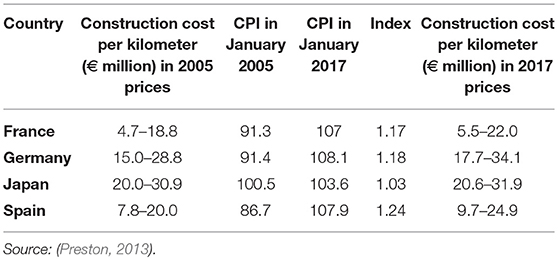
Table 5. Construction Costs per route km of new high-speed lines.
Moreover, lower construction costs in France and Spain are due to the construction procedures, including the existence of the less populated areas that are located outside the major urban centres and the similar geography. For example, the cost of construction an HSR line in France is minimized by adopting steeper grades rather than building viaducts and tunnels, as well as acquiring more expensive land in order to construct straighter lines and that leads to a reduction in operating and maintenance costs. In Germany and Japan, the construction costs are more expensive because of building HSR lines over more densely populated areas and involving blasting tunnels through mountains, respectively (Campos et al., 2006). The HSR's energy consumption is accounted of 5% lower in France than Germany because of being directly developed by the rail operator rather than included in the infrastructure same as in other countries, as well as its cheaper nuclear source (De Rus Mendoza, 2012). In Europe, experience of the infrastructure costs (ICs) of building, maintaining and operating HSR for a 500 km are presented in Table 6, as the construction cost varies from case to case and it usually depends on different major contributors such as land prices, amount of tunneling involved, and costs of entering large cities (Nash, 2010).
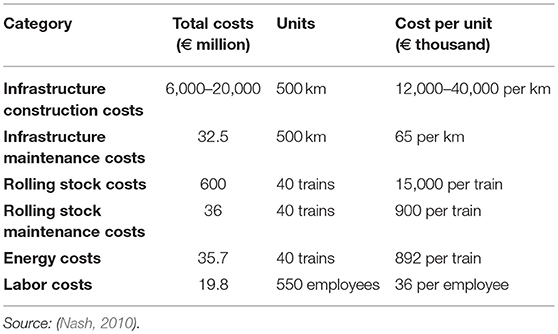
Table 6. Estimated costs of a 500 km HSR line in Europe in 2004 prices.
In terms of the social discount rate, it is the financial return expected by investing in a project and it usually depends on the length of the project's lifespan. In Europe, the discount rate ranges between 3 and 6%, while it is generally higher in the three of the Asian developing countries (India, Pakistan, and Philippines), in the range of 12–15% (Zhuang et al., 2007). As recommended by the European Commission, the social discount rate is 5% in real terms for the evaluation of infrastructure projects (de Rus, 2009). In this case, the same percentage of the social discount rate (i) of the cost of infrastructure and other facilities and equipment costs will be used in this section whilst the average construction cost per kilometer of a given HSR line (cc) dependent on the length of the line (L). In addition, the operation period of time for any HSR project in the world is usually estimated to start after finishing the infrastructure building (t) and the proportion of the construction costs spent on planning usually reaches up to 10% (ρ). However, the rest of the total infrastructure construction costs (90%) count for the infrastructure construction costs and superstructure costs (Almujibah and Preston, 2018). The unit costs of infrastructure construction and maintenance, and the acquisition, maintenance and operating of rolling stocks used in this paper are shown in Table 7.
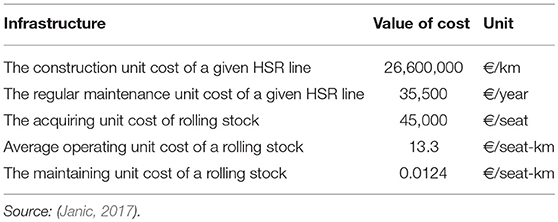
Table 7. Characteristics of the HSR costs in 2017 prices.
During 1 year of HSR's life cycle, construction and maintenance costs of HSR infrastructure are expressed per unit of length of the HSR line, as the unit cost of regular maintenance of a given HSR line is assumed by using the Table 7. Under assumptions on train capacity, initial demand, line length and train commercial speed, 5% of social discounting rate is considered and applied in this paper for both project infrastructure and acquiring rolling stock (Campos et al., 2007a). Regarding the acquiring of rolling stock, the total number of trains needed for the HSR corridor is mainly related to the number of passengers and frequency. However, the risk of failing has a value of 1.5 that is associated to provide services vs. the costs of acquiring, operating and maintaining an over-sized fleet, and it is ranged between 1.25 and 1.6 in the real world (Campos et al., 2007a). However, the average unit cost of acquiring a train during a given period of time is ranged between €45,000 per seat and €50,000 per seat, as it is dependent on the number of trains and an average of €47,500 per seat is applied in this paper (Janic, 2017).
In France, the energy consumption of the South-East new line is 16.5 kWh per kilometer at a speed of 300 km/h (Levinson et al., 1997). On the other hand, the value of energy unit price is assumed €0.024 kWh-h using the rate of electricity costs for industrial use in Saudi Arabia in 2015 prices (U. S. Commercial Service, 2015).
The costs of administration and sales are mainly dependant on the number of employees and automated ticketing machines needed for a given level of forecasted traffic demand. In this case, the costs can be assumed as 10% of the passenger revenue in Saudi Arabia, while the annual initial demand was forecast to be 13.2 million passengers. It is critical to decide which kind of pricing should be followed for the calculation of high-speed rail's fares, as the average fare is an important element of the generalized cost of travel (De Rus, 2011). In Spain, the revenue data that was published by Spanish government in 2014 is usually used by the number of passengers to compute the average price of tickets, as the price during the span of investment is kept constant for most lines and it reflects the competition between HSR and air transport (Albalate and Bel, 2017).
The average unit maintenance cost of a train during the observed period is assumed of 0.0124 €/seat-kilometer, and it is dependent on the features of trains and their seat capacity. On the other hand, the annual utilization of a train is also assumed to be 500,000 km per seat (Janic, 2017).
User Cost of High-Speed Rail Technology
The user travel time in transportation studies is involved into many categories such as the access/egress time, waiting time, and the in-vehicle travel time. In this case, the access/egress time is defined as the time taken from one's door (e.g., school, work, home, etc.) to the first transportation infrastructure used in the city (A) (Allard and Moura, 2013). Moreover, the access time is sometimes the time spent in walking, on metro, bus, or car (e.g., taxi or private car) in order to reach the origin railway station as shown in Table 8.
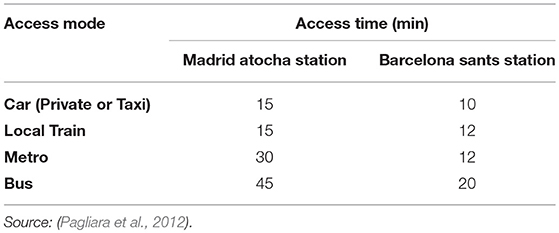
Table 8. Average access time to get to HSR stations in Madrid and Barcelona by different modes.
On the other hand, the egress time is defined as the time taken from the first transportation infrastructure used in the city (B) to the final destination. In this case, the main difference between access and egress time is mostly for travel to/from HSR station and the egress time was found to be 32% higher than access time, which may be due to greater familiarity at one's origin with the transportation options rather than at the destination for a long distance trip. In some studies, the coefficient for walking time has valued as almost twice that of in-vehicle travel time. The access/egress time is also indicated the amount of time required to get to/from the Lisbon Portela International Airport, the Oriente Rail Station, and the Sete Rios Bus Terminal during morning rush hour, as the walking time was estimated from a walking speed of 4 km/h (1.1 m/s) (Allard and Moura, 2013).
In Saudi Arabia, car travel (e.g., private or taxi) the only choice transport mode to access and egress from the HSR stations in Riyadh and Dammam, the two main cities along the corridor. According to DeNicola et al. (2016), the speed limit in the urban area is normally 45 km/h and ranges from 80 to 120 km/h on highways between cities. The locations of HSR stations in the cities of Riyadh and Dammam are assumed the same as the existing stations of conventional rail line managed by Saudi Railway Organization (SRO). However, the distances from the cities' centres and railway stations are measured by using Google Map as shown in Figure 2. According to the Google Map, there are three different ways to reach the HSR station in Riyadh by car with different distances: 15.8, 23.3, and 16.7 km. In this case, the average distance to/from can be calculated by adding these three distances and divided by 3 to get an estimated distance of 18.6 km. For Dammam City, there are also three different ways to/from the HSR station within different distances of 31.7, 28.6, and 33.1 km, as the estimated average distance is 31.1 km. In addition, the average access/egress distance is 24.9 km that can be applied in this section resulted from the average of both distances to/from the two HSR stations in Riyadh and Dammam.
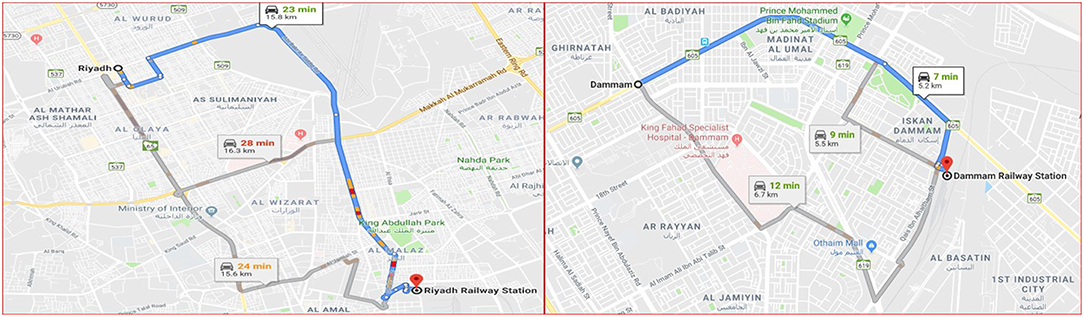
Figure 2. Driving to/from Riyadh Railway Station (Left) and to/from Dammam Railway Station (Right). Source: Google Map.
The waiting time is determined as one of the most important factors of the total user cost for all public transport modes, as it starts counting when a passenger arrives at the rail station when the passenger boards the train. However, the waiting time is a very critical element for judging the service of the passenger, as a railway passenger usually faces different types of waiting due to different reasons. For example, the waiting time might be longer if trains running behind schedule and most trains meet with some delay during rush hours. The value of time is almost expressed relative to the driving time in the case of waiting for trains, which it means passengers rate 1 min of waiting as equivalent to 2.5 min of driving (Vansteenwegen and Vanoudheusden, 2007).
The value of time (VOT) is identified as one component in the total equation of user cost and it can be calculated by multiplying an hourly wage rate by an average ridership component (Daniels et al., 1999). It also is assumed to be €8.2/h, as it depends on many aspects such as trip purpose, socioeconomic and demographic characteristics, the total duration of the trip, etc. (Levinson et al., 1997). For example, the VOT was estimated for private trips in Swedish national forecasting model level in 2008 to be €6.5/h, €12/h, and €10/h for coach, car, and rail, respectively, which was based on using of Stated Choice data (Borjesson, 2014). However, the VOT is mainly related to the wage rate in terms of cost to employer, which is accounted of 1.33 and two-third of the wage rate per hour for work and business trips, and longer commuting trips (Gwilliam, 1997; Small et al., 2007).
However, the weighting perception of walking time is mainly dependant on the easiness to find the direction, and the easiness of walking control of flow, while comfort, safety, security, type of trips, and amount of time to wait is the main factors of weighting perception of waiting time. In this case, the values of weighting perception for access/egress and waiting times are worth two and three times in-vehicle time, respectively, and will be used in this model (Wardman, 2004).
External Environmental Cost of High-Speed Rail Technology
Maout and Kato (2016) defined the external costs as the costs generated by transport users but paid by surroundings, the environment, people, and the society as a whole, including air pollution, noise, accidents and climate change. The external costs associated with society and the transport user cannot be considered without policy intervention, as they usually refer to the difference between internal costs and social costs (Maibach et al., 2008).
All of the transport modes emit significant quantities of air pollutants with different percentages, as this category harms human health, reduces visibility, damaged materials, and stresses forests and crops (Igor and Howaida, 2014). However, the most effect of air pollution on human health is due to the particulate matter such as PM10, PM2.5, Ozone (O3), and other air pollutants. On buildings and materials damages, there are mainly two air pollutants effects. Soiling of building surfaces through dust and particles, and the degradation due to acid air pollutants mainly through corrosive processes, including NOx and SO2 (Maibach et al., 2008). In order to generate the electricity of the HSR trains, the primary fuel is used such as coal, oil and gas. Due to the high possibly diversity of energy sources are primary used in each country, it is more complex to make comparison about air pollution emissions by HSR (Campos et al., 2007b). In the rail transport, the main key cost drivers are vehicle speed, the load factors, fuel type, geographical location of power plants, etc. (Maibach et al., 2008). The marginal cost from air pollution of HSR is 0.368 €/1,000 pkm (Albalate and Bel, 2017). Meanwhile, a value of energy consumption of 567 kJ/passenger-kilometer was reported for a load factor of 50% for the Japanese Shinkansen, a 440 kJ/passenger-kilometer for the French TGV, and a 1,702 kJ/passenger-kilometer for the TVE (Wayson and Bowlby, 1989). The electromagnetic radiation and catenary arcing problems have been considered from HSR electric operation, as an environmental hazard to induce high voltage near the wayside on electrical components that causes a potential hazard, to cause radio frequency interference, and certain health problems (Wayson and Bowlby, 1989).
The noise generated by HSR depends on each country's specific technology and track characteristics, and the generating level by the source such as the moving HS train and the distance (Janic, 2017). Other features of noise generated by HSR can be categorized in pantograph noise, wheel and rail noise, and aerodynamic noise. However, the noise usually relates to the speed of the train passing, as the faster speed can generate the higher noise (Pourreza, 2011). For example, the aerodynamic noise is a type of direct airborne noise as shown in Figure 3, which is generally generated from airflow around the body of train and the pantograph and wheel area, which is prevalent at the highest speed over 300 km/h (Temple-ERM, 2013).
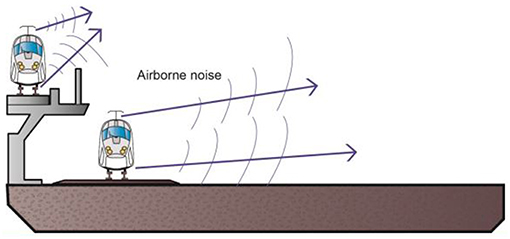
Figure 3. Direct environmental airborne noise from HSR. Source: (Temple-ERM, 2013).
In contrast to airborne noise, the ground-borne vibration generated by trains can have a major environmental impact on neighbors located nearby of a train corridor, and it includes feelable movement of the building floor, shaking of items on shelves, ratting of windows, etc. (Hunt and Hussein, 2007).
In this case, noise costs contain two categories of costs, which are the costs of health and annoyance. First, transport noise can cause health damages, including hearing damage at the level of noise above 85 dB(A) and nervous stress reactions such as change of heartbeat frequency, hormonal changes and the increase of blood pressure. Second, the annoyance costs that are caused by transport noise and result in economic and social costs such as discomfort, limitations on the enjoyment of desired leisure activities (Maibach et al., 2008). The HSR noise will be measured in dB(A) scale (decibels), as the values of noise levels that have been made, ranging from 80 to 90 dB(A) (Campos et al., 2007b). The noise on-board HS trains is an important element of internal comfort, as trains operating at high speeds usually generate noise that consists of rolling, aerodynamic, propulsion, and equipment sound. Moreover, the main component in the noise pollutions of electric trains is the rolling surface of the steel wheel on the steel track, as these pollutions mainly dependent on the type of track, train speed, surface conditions of both rail and wheel. However, the type of brakes, the presence of noise wall, and the length of the train are the main cost drivers, as there is a significant impact of the type of brake on the noise costs (Maibach et al., 2008). This noise generally can affect three groups of land use activities: land with residence buildings, quiet land with planned outdoor use and land with daytime activities such as schools, businesses, libraries, etc. It is usually considered to avoid noise to the population located close to railway lines by providing the noise-mitigating barriers and that will help in absorbing the maximum noise levels by around 20 dB(A) for using single barrier and 25 dB(A) for the double barrier (Janic, 2017). In this case, the noise levels are a major concern in HSR that needs to reduce its emissions. For example, the noise level for the French TGV is reported as a 97 dB(A) at 25 m from the track and a speed of 272 km/h and a 93 dB(A) for the German ICE at speed of 300 km/h (Profillidis, 2014).
Levinson et al. (1999) evaluated the full cost of three intercity transport modes, including air, road, and HSR in terms of the economic investment for the California corridor, linking Los Angeles with San Francisco. In addition, HSR produces less noise pollution for a given transport task than other existing transport modes, while the noise external cost of HSR was estimated e0.01803 /1,000 pkm (Hume Regional Development, 2014).
The external accident cost is mainly related to traffic accidents and dependent on the accident level and the insurance system. However, there are many categories of the accident cost such as the costs of medical and administrative, damage of materials, and the production losses. In addition, the most impacts of accidents in rail transport are weather condition, traffic volume, and level of separation between transport systems, especially between different types of trains (Maibach et al., 2008). The high-speed rail system is mainly designed to reduce the possibility of accidents, as it is the safest form of transportation in the world proven by decades of safe operations. In this case, the Japanese Shinkansen have been known as safest HS services worldwide since the first line opened in 1964 with free of accidents due to collisions or derailment of trains. In general, the only fatal HSR accidents with injuries and deaths of staff and passengers have recorded in Spain, China, and Germany in years of 2013, 2011, and 1998, respectively, as shown in Table 9.
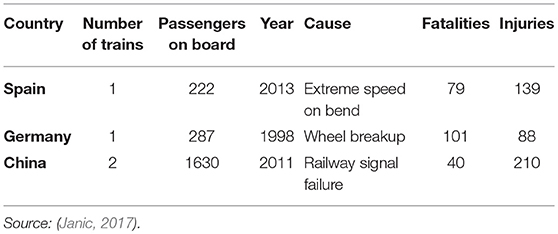
Table 9. The main characteristics of the fatal HSR accidents.
In Saudi Arabia, a train was collided by a stray camel 40 kilometers away from Qassim station in 2017 as shown in Figure 4, causing no injuries in passengers (Gulf Daily News, 2017).
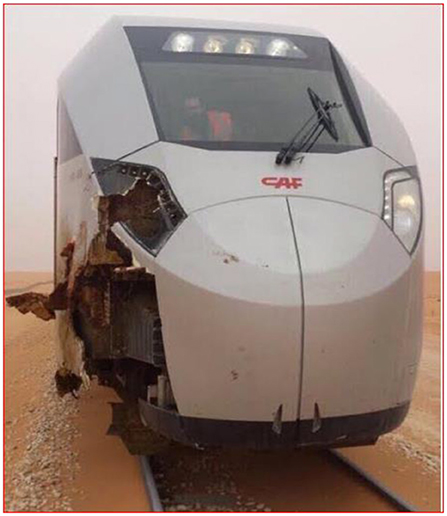
Figure 4. A passenger train collided with a stray camel on Riyadh-Qassim corridor. Source: (Gulf Daily News, 2017).
The average of external accident costs are usually calculated based on UIC accident statistics up to date, which range between €0.08/train-km and €0.30/train-km in European countries in 2007 prices (Maibach et al., 2008). The average for the Australian proposed HSR line connecting Melbourne to Canberra, the accident costs is estimated to be €1.23 per 1,000 passenger kilometer by 2036 compared to the total cost of passenger vehicle accidents in Australia, which was estimated between €14.09 billion (2009) and €22.95 billion (2011) (Edwards, 2012). The impacts of climate change of transport are mainly caused by emissions of the greenhouse gases such as carbon dioxide (CO2), methane (CH4) and nitrous oxide (N2O) (Maibach et al., 2008). However, all transport modes, including HSR emit pollutants that can affect global climate, and induced by worldwide Greenhouse GAS (GHG) emissions, which is counted as one of the key topics of global research output (Albalate and Bel, 2017). In this case, the energy use impacts are mainly dependent on average temperature, especially for summer air conditioning (Maibach et al., 2008).
In terms of the energy consumption and emissions, Table 10 shows the emission intensity based on years 2000, 2001, and 2002 for the Madrid-Seville HSR corridor.
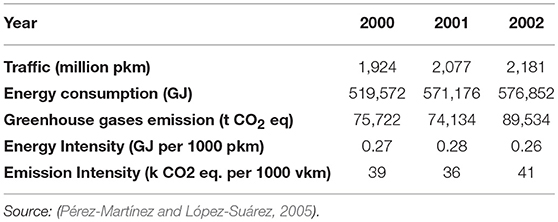
Table 10. Energy and emission of the Madrid-Seville corridor.
The emission of GHGs is planned to decrease in Europe to an average of 5.9 gCO2/s-km, 1.5 gCO2/s-km, and 0.9 gCO2/s-km by the years of 2025, 2040, and 2055, respectively (Janić, 2016). Meanwhile, the increasing in temperature is an apart of climate change that can cause a hazard to the rail network, and a track expansion increases. Due to climate change, the ability of rail operators is challenged by the expected increases in temperature to maintain existing operating practices and avoid any delays especially during summer (Chinowsky et al., 2017). As a part of the climate change, a conventional train derailed after flooding from heavy rains in Saudi Arabia on February 2017 near the eastern city of Dammam city that caused the rail to drift and carriages were separated from each other as shown in Figure 5, while one train car overturned (Arabnews, 2017a).
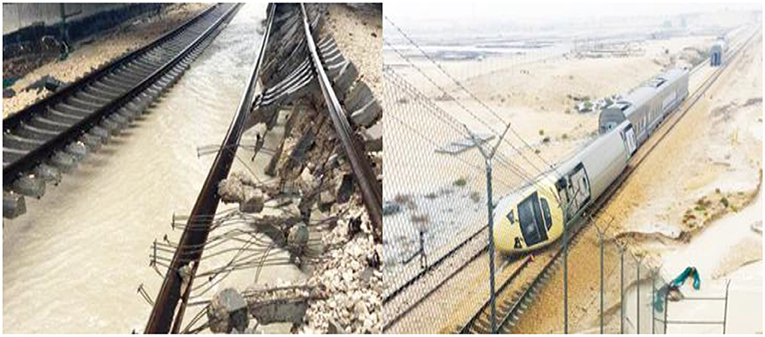
Figure 5. Railway track inundated by water (left) and a train derailment near Dammam (right). Source: (Arabnews, 2017a).
The marginal cost of climate change of HSR is equal to €0.824/1,000 pkm and used in this section (Albalate and Bel, 2017).
Spreadsheet Cost Model
In this paper, the methodology is to determine the estimated total social costs of a new HSR line worldwide and apply it to the case study of Saudi Arabia for the Riyadh and Dammam corridor, using a Spreadsheet Cost Model mainly based on Microsoft Excel. However, estimating the total annual volume of passenger demand for the proposed HSR corridor is acquired, which it is mainly based on the results of the gravity demand model. In addition, the demand model is used as a function of independent variables for the cities alongside with the proposed line such as the population, GDP per capita, the generalized journey time, unemployment rate, years since opening the corridor, and the dummy variable. With regard to the total social costs, there are three categories included such as the operator costs, user costs, and the external environmental costs. The operator cost (OC) can be divided into the infrastructure costs and the rolling stock costs. First, the infrastructure cost (IC) is mainly based on the construction costs and maintenance costs, which can be expressed in Equation (1).
where:
L = The length of a given HSR line (km)
cc = The construction unit cost of a given HSR (€/km)
ρ = The proportion of the construction costs spent on planning (%)
P = The present value of costs of the HSR line (€)
A = The annual value costs (€/year)
i = The interest rate (%/year)
n = The life span of infrastructure element (year)
cm = The regular maintenance unit cost of a given HSR (€/km)
In this case, the percentage of the planning cost and the length of the corridor are taken into account to calculate the infrastructure construction cost. In addition, the OC of the HSR infrastructure construction cost is given by the annual value, using the capital recovery factor (Rogers and Duffy, 2012).
Second, the acquisition (RSCA), operation (RSCO), and maintenance (RSCM) of the rolling stocks are the main categories of the rolling stock cost in order to run the services for the proposed route, as they are expressed in Equation (2).
where:
= The average seat capacity of a rolling stock (seat)
Ct = The number of rolling stocks acquired in the t-th year of the observed period
(trains)
cA = The unit cost of acquiring a rolling stock (€/seat)
cO = Average unit cost of operating a rolling stock (€/seat-km)
Ft = The transport service frequency on the corridor during time (train/hour)
cM = The unit cost of maintaining rolling stock (€/seat-km)
ut = The average utilization of a rolling stock in the t-th year of the observed period
(km/seat)
In this case, the acquisition cost is given by the annual value that is calculated by multiplying the number of trains by their average capacity, and the average unit cost of acquiring rolling stock per seat as presented in Equation (2). The number total number of acquired trains (RSt) is determined by the multiplication of the estimated number of passengers and frequency as shown in Equation (3).
where:
τ = The operation cycle time of the train (hour/train)
Qt = The projections of the (one-way) daily demand (passenger)
Od = Operating daily hours (hour)
Qe = The effective occupation (seats)
The daily number of passengers demand (Qt) can be determined by the division of the initial annual demand by the number of direction that is normally has a value of 2, while the effective occupation of capacity and the operating daily hours are determined of 75% and 18 h, respectively.
The operation cycle time of the train along the corridor (τ) is estimated by adding the average turnaround time of a train at the begin and end stations, and the operating time in a single direction as shown in Equation (4).
In terms of the user cost, the access/egress time, waiting time, and in-vehicle travel time are the main components. In this case, the access time is the time spent by the travelers from the origin point (e.g., home, school, shop, etc.) to the HSR station, while the egress time is known as the time spent to get to their final destination from the HSR station. On the other hand, the waiting time is determined as one of the most components of the user time and it is counted from the time that a passenger arrives at the HSR station until the train leaves. The in-vehicle time is mainly dependent on the length of the corridor and the operating speed of the train. As a result, the user travel time (UT) is calculated as shown in Equation (5).
where:
DAE = The average access/egress distance to/from the HSR station (km)
VAE = Average travel speed (km/hour)
L = The average length of a given HSR line (km)
v = The average operating speed (km/h)
In order to calculate the total annual user time, the annual number of passenger demand per direction is needed for both access/egress and in-vehicle components, while total annual number of passenger in the time period is required. In this case, the total annual passenger time is expressed in Equation (6).
where:
TAE = The average access/egress time per passenger (hour)
Qt = Passenger demand in the time period t per direction (passenger/year)
Q = Passenger demand in the time period t (passenger/year)
TWT = The average waiting time per passenger (hour)
TIV = The average in-vehicle time per passenger (hour)
It is commonly known that the total user cost is mainly related to the generalized travel time including the access/egress time, waiting time, and the in-vehicle time. However, this value needs to convert to generalized travel cost by multiplying each component by the weighting perception factor and the value of time as presented in Equation (7).
where:
TUC = The annual total user costs (€/year)
wAE = The representing factor of the weighting perception of access/egress time vs.
in- vehicle time (number)
wwt = The representing factor of the weighting perception of waiting time vs. in-
vehicle time (number)
VOT = Value of in-vehicle time for HSR (€/hour)
In this section, the value of time is considered as the average hourly wage rate that can be calculated through the division of average monthly wage rate and the working hours per month.
Finally, the external environmental costs can be calculated by multiplying the unit costs of different components such as air and noise pollution, accident and climate change by the total passengers-kilometers and expressed in Equation (8).
where:
UAPc= Unit air pollution costs per passenger-kilometer (€/pkm)
UNPc= Unit noise pollution costs per passenger-kilometer (€/pkm)
UAc= Unit accident costs per passenger-kilometer (€/pkm)
UCCc= Unit climate change costs per passenger-kilometer (€/pkm)
PKM= Total Passenger per kilometers
In this case, the Purchasing Power Parity (PPP) rate of different countries is necessary needed to determine the unit cost for the external costs per vehicle—kilometer, which is mainly based on the values of currency rates.
Results and Discussion
In order to estimate the total social costs of proposed HSR lines worldwide, the forecasting of travel demand is needed. However, the gravity regression model was used to calculate the expected demand for the first year of an HSR operation (2040) for the proposed Riyadh-Dammam corridor to serve two large cities in Saudi Arabia within a length of 412 kilometers. In this case, the forecasting travel demand was estimated from 13,205,212 trips in the first year, based on different parameters including population, GDP per capita, generalized journey time, unemployment rate, years since opening, and country specific dummy variables.
The results of total social costs of constructing and operating an HSR line worldwide are divided into three categories:
First, the total OCs which include the infrastructure construction and maintenance costs, rolling stock acquisition, and operating and maintenance costs. In this case, the main different parameters included in the calculation are the length of corridor (L) of 412 kilometers, the estimated project timeline (n) of 35 years, the capacity of train (c) of 417 seats, the capacity load factor (l) of 75%, the average commercial speed (s) of 300 km/h, and the 18 daily operating hours (06:00–24:00).
The infrastructure cost is mainly based on both construction and maintenance costs of the HSR line. In this case, the infrastructure construction cost of €736,226,759 per year results from the multiplication of the capital recovery factor, length of the line, the annual infrastructure construction unit cost of €26,600,000 per km, and the estimated proportion cost on planning (ρ) of 10%. The capital recovery factor is resulted of 6%, as it is dependent on the estimated project timeline and the social discount rate (i) of 5%.
On the other hand, the infrastructure maintenance cost is €14,626,000 per year, which was calculated through the multiplication of length of the corridor and the infrastructure maintenance unit cost of €35,500 per year.
As a result, the total infrastructure construction and maintenance costs are presented in Table 11 for a value of €750,852,759 per year.
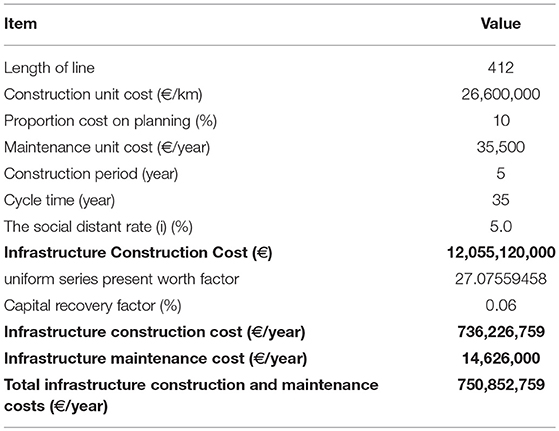
Table 11. The total infrastructure construction and maintenance costs (€/year).
The effective occupation is mainly based on the estimated load factor of 75% and the rain capacity of 417 seats to get a result of 313 seats. In addition, the total projection of on-way daily demand is 18,089 passengers that is mainly dependent on the initial annual demand of 13,205,212 that was determined through the output of gravity model and the number of direction.
The number of services (trains) is resulted of 58 daily trains as shown in Table 12, which is mainly based on the daily projection demand and the effective occupation. However, the frequency is calculated of 3.21 ≈ 4 trains per hour, which is based on the number of daily passengers per direction, the effective occupation, and the daily operating hours. In addition, there is a train running every 20 min by dividing 60 min by the service frequency, which will increase with the growing of demand and might reach a reasonable value of one train every 15 min or less.
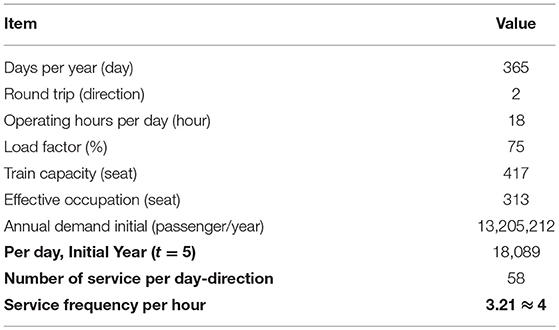
Table 12. The service frequency per hour.
The number of trains acquired for the proposed corridor was resulted of 21 trains, which is mainly based on the train operation cycle time of 3.41 h/train, the value to the risk of failing of 1.5, and the service frequency mentioned previously. Based on multiplication of the number of trains needed of 21 trains, the average seat capacity of train of 417 seats, and the unit cost of acquiring a rolling stock of €47,500 per seat, the acquisition costs of rolling stock resulted of €25,403,235 per year as shown in Table 13. In addition, the value was converted to an annual value by multiplying it by the value of capital recovery factor of 0.06 resulted from Equation (1).
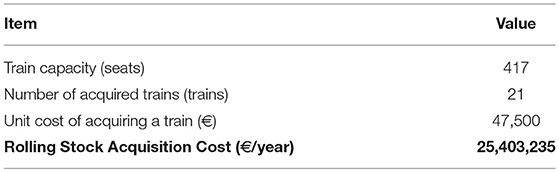
Table 13. The rolling stock acquisition Cost (€/year).
The operating costs of rolling stock resulted of €29,247,913 per year as shown in Table 14, which is mainly based on the average unit cost of operating a rolling stock of €13.3 per seat-kilometer, the length of the corridor of 412 kilometers, the train capacity, and the transport service frequency.
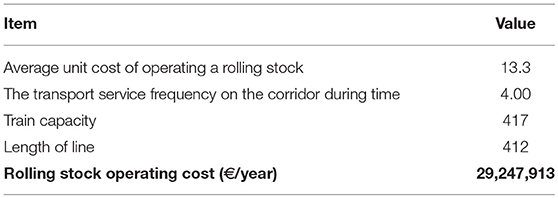
Table 14. The rolling stock operating cost (€/year).
A multiplication of the unit cost of maintaining a rolling stock of €0.0124 per seat-kilometer, the number of acquired trains, train capacity, and the annual utilization of 500,000 kilometers-seat is needed to achieve a value of €54,293,300 per year for the rolling stock maintenance cost as shown in Table 15.
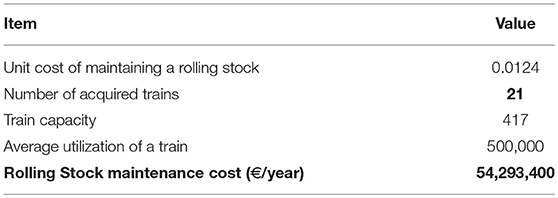
Table 15. The rolling stock maintenance cost (€/year).
The total OC is resulted of €859,797,307 per year as shown in Table 16, which is mainly based on the total infrastructure and rolling stock costs of €750,852,759 per year and €108,944,548 per year, respectively.
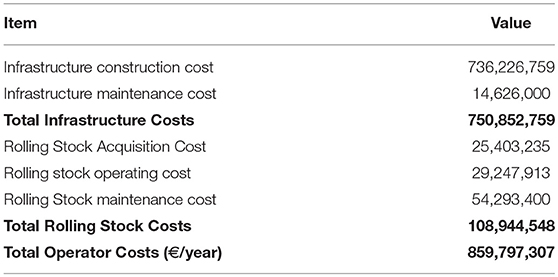
Table 16. The total operator costs (€/year).
Second, the total user cost of proposed HSR line includes the access/egress time, waiting time, and in-vehicle travel time from the origin to destination.
The average access and egress times are mainly based on the average travel distances to/from rail stations of 24.9 kilometers and the average travel speed of 45 km/h, and resulted of 0.55 h per passenger. In this case, the annual total access and egress times is 7,297,102 h as shown in Table 17, resulted from the multiplication of the factor of 2 represents both directions to/from the HSR station, the annual number of passengers per direction and the average access and egress time per passenger.
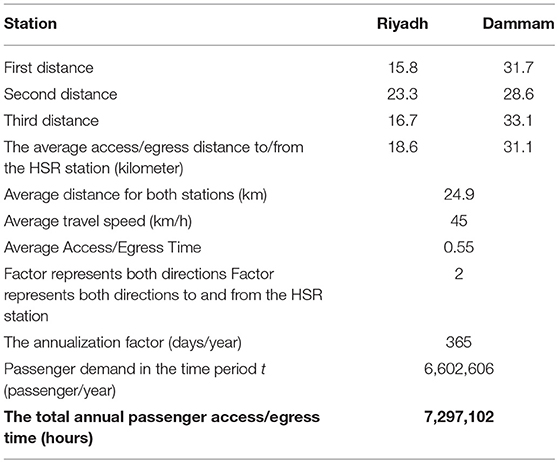
Table 17. The total annual passenger access/egress time (hours).
The average passenger waiting time is 0.06 h resulted from the half of headway, as the headway is mainly equal to half of the service frequency on the corridor during time of about 4 trains per hour. In this case, the total annual passenger's waiting time is 412,663 h as shown in Table 18, resulting from the multiplication of the average waiting time per passenger and the annual projection demand per direction of 6,602,606 passengers.
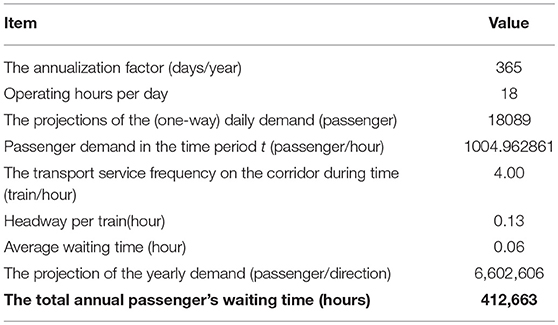
Table 18. The total annual passenger's waiting time (hours).
The average in-vehicle travel time is 1.37 h and it is mainly resulted from the dividing of the length of corridor by the average operating speed. In this case, the total annual passenger in-vehicle travel time is 9,067,579 h as shown in Table 19, resulting from the multiplication of the average in-vehicle time and the annual projection demand per direction.
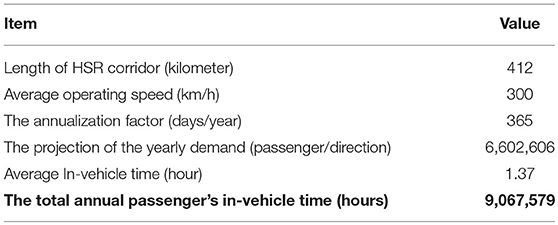
Table 19. The total annual passenger's in-vehicle time (hours).
The average value of time is necessary required in order to calculate the annual total user costs. First, the average hourly wage rate is €8.72 per hour resulted from the dividing of the average monthly wage rate of €1,395 by the working hours per week 160 h. In this case, the value of time for business and commuting travelers are resulted of €11.6/h and €5.82/h, respectively, from the multiplication of the average hourly rate and the coefficients (1.33 and 0.667) shown in the literature review of value of time. As a result, the value of time in this paper is €8.71/h resulted from the average of values of time for business and commuting travelers as shown in Table 20.
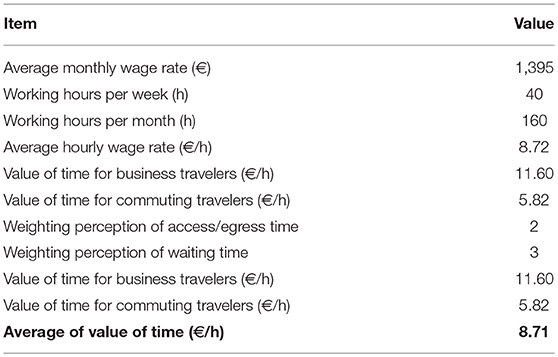
Table 20. The average of value of time (€/h).
The total user cost is €216,769,247 per year as shown in Table 21, resulting from the sum of total annual passenger access/egress time, waiting time, and in-vehicle time. In addition, the weighting perceptions of 2 and 3 that were presented in the literature review of value of time for access/egress time and waiting time, respectively, are used, and multiplying them by the value of time.
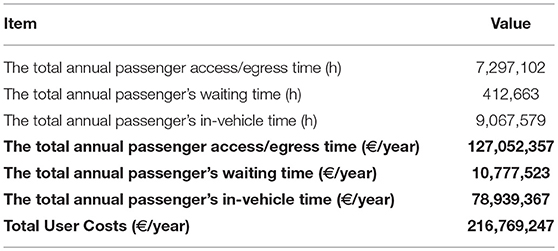
Table 21. The total user Costs (€/year).
Third, the total external environmental costs of proposed HSR line include air pollution, noise pollution, accident and climate change. In this case, the conversion of Purchasing Power Parity (PPP) rates from $ to €, which was based on 2016 prices between UK and Saudi Arabia. In addition, the total passenger-kilometer was calculated of multiplying the forecasting travel demand of 13,205,212 by the length of corridor (412 kilometers).
The average air pollution cost was calculated of €1,954,034 per year resulted from the multiplication of the unit air pollution cost of €0.359 per vehicle-kilometer and the total annual demand of 5,440,547, 344 passenger-kilometer.
On the other hand, the result of noise pollution was calculated of €95,758 per year and it is mainly based on the unit noise pollution cost of €0.018 per vehicle-kilometer and the total passenger-kilometer of 5,440,547.
In addition, the average external accident cost was calculated of €7,115,231 per year and that was resulted from the multiplication of the unit accident cost of €1.31 per vehicle-kilometer and the total of 5,440,547 passenger-kilometer.
The average external climate change cost was calculated of €4,375,336 per year, which was resulted from the multiplication of the unit climate change cost of €0.82 per vehicle-kilometer and the total passenger –kilometer of 5,440,547.
As a result, the total external environmental cost is €13,540,359 per year as shown in Table 22, resulting from the sum of average costs of air pollution, noise pollution, accident, and climate change that was based on the values of unit costs presented in the section of external environmental cost of HSR technology.
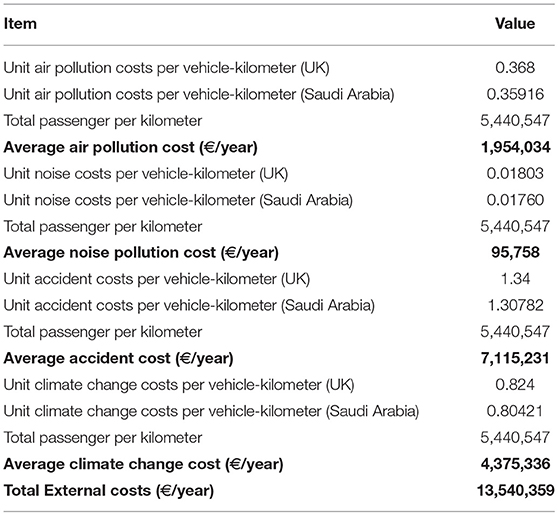
Table 22. The total external costs (€/year).
Conclusion
In conclusion, connecting these two large cities by an HSR system will bring new competition into the intercity market in Saudi Arabia. However, the total infrastructure construction cost for the proposed HSR line worldwide is likely to be the most important cost category, followed by the rolling stock operating and maintaining costs. In this paper, the calculation of the cost categories is mainly based on the unit costs of infrastructure and rolling stock used in Table 7 mentioned in the literature review. However, 86% of the total OCs of the proposed HSR line result from the infrastructure construction cost. In addition, the rest of the cost values are the result of the rolling stock maintenance cost, rolling stock acquisition cost, rolling stock operating cost, and the infrastructure maintenance costs of 6, 3, 3, and 2%, respectively.
In terms of the total user costs, 59% resulted from total annual passenger access/egress costs, followed by the total annual passenger in-vehicle and waiting costs within 36 and 5%, respectively. For the total external environmental costs, 53% of the cost was due to the average accident cost, following by 32, 14, and 1% that were the result of the average climate change cost, average air pollution cost, and average noise pollution cost, respectively. As a result, the total social costs of constructing and operating a high-Speed rail line between Riyadh and Dammam, two large cities in Saudi Arabia, is €1,090,106,913 per year, resulting from the total operator cost, user cost, and the environmental cost with values of €859,797,307 per year, €216,769,247 per year, and €13,540,359 per year, respectively. In terms of limitations, the cost data was based on the Janic (2017)'s paper on averaged rather than the most efficient. In this case, data envelopment analysis and stochastic frontier analysis would be needed to do the latter. This data may be inconsistent with the Saudi Arabian data for the Haramain High-Speed line construction costs, as well as with the data of other presented such as Campos et al. (2007b)'s paper. Moreover, the user costs were based on engineering data rather than real data, and the forecast of users from a global HSR model may not be appropriate to Saudi Arabia.
Author's Note
This paper builds on an earlier paper by the authors on the potential for “The total social costs of constructing and operating a maglev line using a case study of the Riyadh- Dammam corridor, Saudi Arabia” (Almujibah and Preston, 2018) by examining High-Speed Rail.
Author Contributions
JP is the Head of the Transportation Research Group. He was previously Head of the Civil, Maritime, and Environmental Engineering and Science Academic Unit (2011–2014), Director of the Transportation Research Group (2008–2011) and Head of the School of Civil Engineering and the Environment (2010–2011). HA is a Postgraduate research student for Engineering and Physical Sciences at the University of Southampton. He received his Master degree on 2015 in Transportation Engineering from New Jersey Institute of Technology, United States, as well as a bachelor in Civil Engineering from California State University, Northridge, United States. From June 2015–Present, he is a Lecturer in Department of Civil Engineering, Taif University, Saudi Arabia. HA undertook this research as part of his PhD studies, supervised by JP. The HSR transport mode is one of the high-speed ground transportation systems included in the HA's thesis beside the Hyperloop and Magnetic levitation systems. The thesis describes the development of the comparative assessment of these three intercity transport technologies, in terms of their service characteristics.
Conflict of Interest Statement
The authors declare that the research was conducted in the absence of any commercial or financial relationships that could be construed as a potential conflict of interest.
Footnotes
1. ^Convert rates used in this paper 1€=1.22$ and 1£=1.13€
References
Aguinaldo, J. (2017). Saudi Arabia Conducts Second High-Speed Rail Test. Available online at: https://www.meed.com/saudi-arabia-conducts-second-high-speed-rail-test/ (accessed October 19, 2017).
Al-Ahmadi, H. M. (2006). Development of intercity mode choice models for Saudi Arabia. Eng. Sci. 17, 3–4. doi: 10.4197/Eng.17-1.1
Albalate, D., and Bel, G. (2017). Evaluating High Speed Rail. Interdisciplinary Perspectives. New York, NY: Routledge.
Aldroubi, M. (2018). Saudi King Inaugurates Kingdom's First High-Speed Train. Available online at: https://www.thenational.ae/world/mena/saudi-king-inaugurates-kingdom-s-first-high-speed-train-1.773904 (accessed September 25, 2018).
Allard, R. F., and Moura, F. (2013). Analysis of Accessibility Distributions for Inter-city Travel by Public Transport.
Almujibah, H., and Preston, J. (2018). The total social costs of constructing and operating a maglev line using a case study of the riyadh-dammam corridor, Saudi Arabia. Transp. Syst. Technol. 4(Suppl. 1), 298–327. doi: 10.17816/transsyst201843s1298-327
Amos, P., Bullock, D., and Sondhi, J. (2010). High-Speed Rail: The Fast Track to Economic Development. World Bank, 1–28. doi: 10.1596/27812
Angoiti, I. B. (2010). High-Speed Rail-Fast Track to Sustainable Mobility. Brochure of the International Union of Railways. UIC.
Arabnews, (2017a) Train Derails Near Dammam Due to Heavy Floods. Available online at: http://www.arabnews.com/node/1055751/saudi-arabia (accessed February 17, 2017).
Arabnews, S. A. (2017b). Haramain High-Speed Train Arrives in Jeddah for First Time. Available online at: http://www.arabnews.com/node/1131811/saudi-arabia (accessed July 19, 2017).
Arduin, J.-P., and Ni, J. (2005). French TGV network development. Jap. Railway Transp. Rev. 40, 22–28.
Borjesson, M. (2014). Forecasting demand for high speed rail. Transport. Res. Part A Policy Pract. 70, 81–92. doi: 10.1016/j.tra.2014.10.010
Brunello, L. R. (2011). Investigation to Enhance High Speed Rail Accessibility. Queensland University of Technology.
Campos, J., De Rus, G., and Barron, I. (2006). 4th Annual Conference on Railroad Industry Structure, Competition and Investment. Universidad Carlos III de Madrid.
Campos, J., De Rus, G., and Barron, I. (2007a). “The cost of building and operating a new high speed rail line,” in MPRA Paper 12396, University Library of Munich.
Campos, J., de Rus, G., and Barron, I. (2007b). A Review of HSR Experiences Around the World. MPRA Paper, University Library of Munich. Available online at: https://EconPapers.repec.org/RePEc:pra:mprapa:12397
Chen, M., Tang, H.-L., and Zhang, K. (2014). Some critical issues in the development of chinese high-speed rail: challenges and coping strategies. J. Transp. Technol. 4, 164–174. doi: 10.4236/jtts.2014.42017
Chinowsky, P., Helman, J., Gulati, S., Neumann, J., and Martinich, J. (2017). Impacts of climate change on operation of the US rail network. Transp. Policy 75, 183–191. doi: 10.1016/j.tranpol.2017.05.007
Daniels, G., Ellis, D. R., and Stockton, W. R. (1999). Techniques for Manually Estimating Road User Costs Associated With Construction Projects. Texas Transportation Institute, Texas.
de Rus, G. (2009). Economic Analysis of High Speed Rail in Europe. The BBVA Foundation, Plaza de San Nicolas.
De Rus, G. (2011). The BCA of HSR: should the government invest in high speed rail infrastructure? J. Benefit Cost Anal. 2, 1–28. doi: 10.2202/2152-2812.1058
De Rus, G. (2012). Economic Evaluation of the High Speed Rail. Expertgruppen för studier i offentlig ekonomi.
De Urena, J. M. (2016). Territorial Implications of High Speed Rail. A Spanish Perspective. Routledge.
DeNicola, E., Aburizaize, O. S., Siddique, A., Khwaja, H., and Carpenter, D. O. (2016). Road traffic injury as a major public health issue in the Kingdom of Saudi Arabia: a review. Front. Public Health 4:215. doi: 10.3389/fpubh.2016.00215
Edwards, N. (2012). High Speed Rail: Benefits That Add Up: A Report for the Australian Greens. Available online at: https://adam-bandt.greensmps.org.au/sites/default/files/hsrbenefitsreport.pdf (accessed June 12, 2012).
Ferran, T. (2017). Haramain High-Speed Crawls Towards the Start of Operations. Available online at: https://www.railjournal.com/in_depth/haramain-high-speed-crawls-towards-the-start-of-operations (accessed Feburary 14, 2017).
Givoni, M. (2006). Development and impact of the modern high-speed train: a review. Transp. Rev. 26,593–611. doi: 10.1080/01441640600589319
Gorlewski, B. (2011). Travel cost reduction as a factor of economic appraisal of high-speed rail project. Logist. Sci. J. Trans. Logist. 2, 16–26.
Gulf Daily News, K. (2017). Train Collides With Stray Camel. Available online at: http://www.gdnonline.com/Details/193859/Train-collides-with-stray-camel (accessed March 11, 2017).
Gwilliam, K. M. (1997). The Value of Time in Economic Evaluation of Transport Projects: Lessons From Recent Research. World Bank. Washington, DC.
Hortelano, A. O., Guzman, A. F., Preston, J., and Vassallo, J. M. (2016). Price elasticity of demand on the high-speed rail lines of Spain: impact of the new pricing scheme. J. Transport. Res. Board 2597, 90–98. doi: 10.3141/2597-12
Hume Regional Development, A. (2014). High Speed Rail Economic and Social Benefits for the Hume Region. Available online at: https://www.rdv.vic.gov.au/_data/assets/pdf_file/0010/1166428/Hume-HSR-Final-Report-Dec-14-r1.pdf (accessed December 12, 2014).
Hunt, H. E., and Hussein, M. F. (2007). “Ground-borne vibration transmission from road and rail systems-prediction and control,” Handbook of Noise and Vibration Control, ed M. J. Crocker (New York, NY: Crocker, Malcolm J.), 1458–1469.
Igor, J., and Howaida, K. (2014). Methods for estimation of external costs of transport. Zbornik Radova Gradevinskog Fakulteta 2014, 149–158. doi: 10.14415/zbornikGFS26.15
International Union of Railways (2019). High Speed Lines in the World. Available online at: https://uic.org/IMG/pdf/20171101_high_speed_lines_in_the_world.pdf
International Union of Railways, H. (2017a). High Speed Traffic in the World. Available online at: https://uic.org/IMG/pdf/high_speed_passenger-km_20171130_.pdf
International Union of Railways, H. S. (2010a). International System Summary: China. Available online at: https://ftp.dot.state.tx.us/pub/txdot-info/rail/high_speed/system-summaries/china.pdf
International Union of Railways, H. S. (2010b). International System Summary: France. Available online at: https://ftp.dot.state.tx.us/pub/txdot-info/rail/high_speed/system-summaries/france.pdf
International Union of Railways, H. S. (2010c). International System Summary: Germany. Available online at: https://ftp.dot.state.tx.us/pub/txdot-info/rail/high_speed/system-summaries/germany.pdf
International Union of Railways, H. S. (2010d). International System Summary: Saudi Arabia. Available online at: https://ftp.txdot.gov/pub/txdot-info/rail/high_speed/system-summaries/saudi-arabia.pdf
International Union of Railways, H. S. (2010e). International System Summary: Spain. Available online at: https://ftp.dot.state.tx.us/pub/txdot-info/rail/high_speed/system-summaries/spain.pdf
International Union of Railways, H. S. (2010f). International System Summary: United Kingdom. Available online at: https://ftp.dot.state.tx.us/pub/txdot-info/rail/high_speed/system-summaries/united-kingdom.pdf
International Union of Railways, H. S. (2017b). International System Summary: Japan. Available online at: https://ftp.dot.state.tx.us/pub/txdot-info/rail/high_speed/system-summaries/japan.pdf
Janić, M. (2016). A multidimensional examination of performances of HSR (High-Speed Rail) systems. J Modern Transport. 24, 1–21. doi: 10.1007/s40534-015-0094-y
JR-Central (2017). Central Japan Railway Company Guide. Available online at: http://english.jr-central.co.jp/company/company/others/data-book/_pdf/2016.pdf
Levinson, D., Kanafani, A., and Gillen, D. (1999). Air, high-speed rail, or highway: a cost comparison in the California corridor. Transport. Q. 53, 123–131.
Levinson, D., Mathieu, J. M., Gillen, D., and Kanafani, J. (1997). The full cost of high-speed rail: an engineering approach. Ann. Reg. Sci. 31, 189–215. doi: 10.1007/s001680050045
Llie, E. (2017). Haramain Train Project Nears Completion. Available online at: https://www.railwaypro.com/wp/haramain-train-project-nears-completion/ (accessed August 16, 2017).
Loukaitou-Sideris, A., and Deike, P. (2015). Promoting Connectivity at HSR Stations: Lessons from Germany and Spain.
Lusvter, (2015) The Disadvantages of HSR (High-Speed Rail). Available online at: https://zhangjin881001.wordpress.com/2015/03/07/the-disadvantages-of-hsr-high-speed-rail-going-to-a-wrong-way/.
Maibach, M., Schreyer, C., Sutter, D., van Essen, H. P., Boon, B. H., Smokers, R., et al. (2008). Handbook on Estimation of External Costs in the Transport Sector. Delf: CE Delft.
Maout, E. L., and Kato, H. (2016). Life cycle cost-estimation model for building, operating, and maintaining high-speed rail systems. Asian Transp. Stud. 4, 245–260. doi: 10.11175/eastsats.4.245
Nash, C. (2010). Environmental and Other Co-benefits of Developing a High Speed Rail System in California: A Prospective Vision 2010–2050. Center for Environmental Public Policy.
Pagliara, F., Vassallo, J., and Román, C. (2012). High-speed rail versus air transportation: case study of Madrid-Barcelona, Spain. Transport. Res. Rec. J. Transport. Res. Board 2289, 10–17. doi: 10.3141/2289-02
Palacin, R., Raif, L., Deniz, O., and Yan, N. (2014). High speed rail trends, technologies and operational patterns: a comparison of established and emerging networks. Transp. Prob. 9, 123–129.
Pérez-Martínez, P., and López-Suárez, E. (2005). 9th Conference on Competition and Ownership in Land Transport Performance of the High Speed Rail in Spain in the Context of the New Regulation Framework. Evidence From the Madrid-Seville HSR Corridor.
Pourreza, S. (2011). Economic Analysis of High Speed Rail. NTNU Norwegian University of Science and Technology, Trondheim.
Preston, J. (2009). The Case for High Speed Rail: A Review of Recent Evidence. The National Academics of Sciences Engineering Medicine, 29.
Railway Technology, S. A. (2008). Haramain High-Speed Rail Project. Available online at: https://www.railway-technology.com/projects/haramain-high-speed/
Rutzen, B., and Walton, C. M. (2011). High Speed Rail: A Study of International Best Practices and Identification of Opportunities in the US. The University of Texas at Austin.
Small, K. A., Verhoef, E. T., and Lindsey, R. (2007). The Economics of Urban Transportation. London: Routledge.
Temple-ERM (2013). High Speed Rail: Consultation on the Route From the West Midlands to Manchester, Leeds and beyond Sustainability Statement.
U. S. Commercial Service (2015). Doing Business in Saudi Arabia: 2015 Country Commercial Guide for U.S. Companies. Available online at: https://photos.state.gov/libraries/saudi-arabia/231771/public/2015%20CCG%20Saudi%20Arabia.pdf
Vansteenwegen, P., and Vanoudheusden, D. (2007). Decreasing the passenger waiting time for an intercity rail network. Transport. Res. Part B Methodol. 41, 478–492. doi: 10.1016/j.trb.2006.06.006
Wardman, M. (2004). Public transport values of time. Transport Policy 11, 363–377. doi: 10.1016/j.tranpol.2004.05.001
Wayson, R., and Bowlby, W. (1989). Noise and air pollution of high-speed rail systems. J. Transport. Eng. 115, 20–36. doi: 10.1061/(ASCE)0733-947X(1989)115:1(20)
Keywords: high-speed rail, total social costs, operator cost, user cost, external cost, Saudi Arabia
Citation: Almujibah H and Preston J (2019) The Total Social Costs of Constructing and Operating a High-Speed Rail Line Using a Case Study of the Riyadh-Dammam Corridor, Saudi Arabia. Front. Built Environ. 5:79. doi: 10.3389/fbuil.2019.00079
Received: 18 January 2019; Accepted: 28 May 2019;
Published: 27 June 2019.
Edited by:
Hua Chen, Railway Technical Research Institute (RTRI), JapanReviewed by:
Anna Granà, University of Palermo, ItalyPing Liu, Jiangsu University of Science and Technology, China
Copyright © 2019 Almujibah and Preston. This is an open-access article distributed under the terms of the Creative Commons Attribution License (CC BY). The use, distribution or reproduction in other forums is permitted, provided the original author(s) and the copyright owner(s) are credited and that the original publication in this journal is cited, in accordance with accepted academic practice. No use, distribution or reproduction is permitted which does not comply with these terms.
*Correspondence: Hamad Almujibah, aHJhMW0xNUBzb3Rvbi5hYy51aw==