 Rezaur Rahman
 Kamol C. Roy
 Samiul Hasan
- Civil, Environmental and Construction Engineering Department, University of Central Florida, Orlando, FL, United States
Ubiquitous smartphone technologies and virtual social networks offer us a unique opportunity to instantly share information to a large number of people. Online social media platforms facilitate easy and rapid communication of real-time information by producing a huge amount of digital content. In this paper, we present an analysis of the data collected from 14 Florida Department of Transportation (FDOT) Twitter accounts created for sharing real-time traffic information. We analyze the activities, influence, attention received, and the effectiveness of gaining attention by these accounts. We propose several metrics in disseminating real-time traffic information. Using topic models, we also analyze the content of the shared information given in the tweets. Finally, we estimate an ordered logit model to determine the information value of a shared content based on its chance of getting retweeted. Based on the study, we propose a framework called Social Media-based Adaptive Real-time Traffic feed (SMART-Feed) that will significantly improve the effectiveness of real-time traffic information sharing through social media. Moreover, it will help to assess the value of real-time traffic information to travelers and developing social media strategies for sharing information.
Introduction
Ubiquitous use of smartphones and online social networks offers us a unique opportunity to instantly share information to a large number of people. Online social media platforms enable fast and easy communication of information at a mass scale, producing a huge amount of digital content. The number of active users of social media such as Facebook, Twitter, Reddit, Instagram etc. outnumbers regular viewers of conventional news sources such as newspapers, television, and online portals. Social media platforms provide news to certain population groups who otherwise might have been out of reach (Mitchell and Page, 2013). Social signals, from messages posted on social networking sites, record our daily activities and create large amounts of data for traffic and transportation analysis (He et al., 2016). In the USA, social media are already being used by newspapers with more than 100,000 weekday circulations to distribute their content online (Kümpel et al., 2015). Transportation agencies can potentially use social media to share traffic-related information among travelers (Eirikis and Eirikis, 2010; Transportation Research Board and National Academies of Sciences, Engineering, and Medicine, 2012). Agencies such as the State Department of Transportation (DOT) have been increasingly using social media platforms to disseminate real-time information to travelers (NASCIO, 2010; AASHTO, 2014).
With 67 million active users, Twitter is one of the most widely used social media platforms in the USA (Twitter by the Numbers: Stats, Demographics and Fun Facts, 2017). It is a microblogging service used to share views, activities, and thoughts through a 280-character message known as a “tweet.” Most of the state DOTs are using Twitter accounts to share critical information regarding traffic jams, crashes, incidents, and planned road work. Apart from the text portion of a tweet, there are a number of features that carry important clues to various attributes of social media activities, influence, and effectiveness. To efficiently use Twitter, sharing information with travelers, we need to understand what makes a Twitter account and its messages more effective. Furthermore, we need to understand to what extent the information shared by those accounts are being spread.
In this study, we analyze data collected from 14 Florida Department of Transportation (FDOT) Twitter accounts. We have analyzed the tweets made by these accounts and the effectiveness of sharing real-time information. Using topic model, we have analyzed the content of the shared information given in the tweets. We have measured the influence and attention received by these accounts. We have also proposed several metrics to measure the effectiveness of Twitter accounts in disseminating traffic information.
Among the various features of a Twitter account, previous studies considered follower count, number of retweets, number of mentions, geographical extent of the followers etc. to measure the performance of an account (Anger and Kittl, 2011; Kocatepe et al., 2015). But as most of the state DOT accounts are used for disseminating information, the applied techniques may fall short to measure the exact effectiveness of these accounts (Kocatepe et al., 2015). Therefore, more advanced metrics with reliable features are required to find out the influence of Twitter accounts.
When real-time traffic information is shared on Twitter, users may retweet it or not. The choice is influenced by several factors such as a number of followers, users favorite count, time of day (day or night), weekday or weekend, and characteristics of the shared content (incident related post, general traffic update etc.). To better understand the impact of these factors on retweeting behavior, we have adopted an ordered response modeling approach. The implemented model is used to evaluate the value of shared information to the user. Thus, we can filter out the less important information based on this information value and avoid overcrowding the newsfeed with random updates. Eventually, this framework would improve the effectiveness of these accounts in real-time information sharing. We present a framework to disseminate real-time traffic information connected with a social media platform (e.g., Twitter). The system will be known as Social Media-based Adaptive Real-time Traffic Feed (SMART-Feed).
This study has several contributions to the effectiveness of information sharing techniques using social media. First, by analyzing large-scale data from Twitter it investigates how effectively social media have been used to disseminate information to travelers. Second, this study presents several key metrics to measure the influence and effectiveness of social media accounts in disseminating information. Third, it uncovers the relationship between the topic of a message and the attention received by it. Finally, it develops a framework for a SMART-Feed. Thus, this research work makes a significant contribution toward adopting social media for disseminating real-time traffic information to travelers.
Related Work
Real-time traffic information under different traffic scenarios is helpful to predict travel time and thereby to choose the optimum route before and during a trip. Jou and Chen (2013) found that in freeways the most significant real-time traffic information demanded by the drivers was the dynamic travel time under non-recurring situations. Advanced Traveler Information Systems (ATIS) technologies such as dynamic message signs, in-vehicle navigation systems, wireless communications, Highway Advisory Radio, TV, and radio reports of route conditions etc. (Jou and Chen, 2013) are some of the mediums to broadcast real-time traffic information, which has been found to reduce travel time and increase the transportation system performance (Srinivasan and Krishnamurthy, 2004; Jou et al., 2005). Researchers found that ATIS applications can reduce the uncertainty in non-recurrent congestion.
Along with conventional ATIS methods, social media can be used as promising platforms to disseminate real-time traffic information. Transportation agencies have been using social media platforms to spread and gather information during both normal situations and disaster events (Transportation Research Board and National Academies of Sciences, Engineering, and Medicine, 2012). Timely updates, citizen involvement, marketing, research opportunities, and customer satisfaction etc. are attracting more service providers/agencies to use social media platforms as a networking tool (Bregman and Watkins, 2013). Misra et al. (2014) studied the best practices of using social media data and found that almost every state department of transportation, many public transit agencies, and airports have a social media presence, indicating a dramatic shift on how agencies interact with its customers. Tweets posted during various disasters have been analyzed to extract useful information about the disaster (Imran et al., 2013; Roy, 2018; Roy and Hasan, 2018), individual user behavior (Rashidi et al., 2017; Roy et al., 2019), address the reliability of posted messages (Mendoza et al., 2010), relate with established statistics (Culotta, 2010), increase awareness (Huang et al., 2010), assess damage (Kryvasheyeu et al., 2016), and even to detect earthquake (Earle et al., 2011). Recent studies have investigated on how to understand the interplay among user activities, network properties, and the attention received in social media and to identify factors for successful crisis communication in emergency situations (Sadri et al., 2017a,b).
In the transportation domain, social media data have been used to find mobility and activity choices (Chen, 2017), classifying activity patterns (Hasan and Ukkusuri, 2014, 2015), estimating urban travel demand (Lee et al., 2017), studying traffic flow (Liu et al., 2014), forecasting transit passenger flow (Ni et al., 2016), transit rider satisfaction metric (Collins et al., 2013), and many others. Pender et al. (2014) found that the real-time information shared in social media can reduce disrupted travel demand. Even though a large number of transportation agencies use social media to share information to travelers, few studies have focused on finding the effectiveness of using social media as a real-time information sharing platform. Kocatepe et al. (2015) determined the influence of Twitter accounts based on a case study of FDOT District-3 Twitter accounts. They proposed a GIS-based approach to find out the reach of the followers of the Twitter accounts. Cha et al. (2010) presented an empirical approach to find the influence of Twitter users in spreading popular news topics based on the number of followers, re-tweets, and mentions. Anger and Kittl (2011) calculated the “interaction ratio” (number of individual users who re-tweet content or mention a user divided by the total number of followers of the user) and “re-tweet and mention ratio” and took the average of these two values to represent social network potential of any user. Some online rating systems such as (Klout Score, 2018) and (Website Grader, 2006) rank user profiles based on their characteristics.
Most of the studies on social media are focused on developing different metrics based on user attributes to determine which users are more effective in information sharing and developed models for the number of retweets and retweeting patterns. For instance, Zaman et al. (2014) used a Bayesian approach to predict the total number of retweets. Peng et al. (2011) proposed a method to model the retweet patterns using conditional random fields with three types of user-tweet features: content influence, network influence, and a temporal decay factor. Zhu et al. (2017) proposed a Markov Random Field model for predicting user retweet behaviors. In the proposed method, they used energy function which incorporates user's attributes, microblog contents, the constraints between user's behaviors, and thus can globally predict user retweet behaviors.
Although sharing real-time traffic information through social media holds tremendous potential, its use can be resource intensive (Pender et al., 2014). Studies need to determine an efficient way to spread information to a large group of users within a shorter time. In addition, it is important to find the appropriate features of social media accounts to ensure an effective sharing of real-time traffic information without overburdening users with information.
Methodology
We collect data from Twitter accounts broadcasting 511 traffic information service. We mainly focus on four aspects of a Twitter account:
• Activity: measured by the total number of tweets posted by an account
• Influence: measured by the total number of followers and lists an account has been added to
• Attention: measured by new followers received, re-tweets posted, and list added. New followers and list added indicate the attention gained by a specific account while the number of re-tweets posted indicates the attention gained by a tweet revealing a specific type of traffic information
• Effectiveness: measured by the amount of attention received per unit activity
Effectiveness Metrics for a Twitter Account
Effectiveness η of a user account u for a specific period (ti to tf) is defined as the ratio between total attention received and total activity performed within specific time frame as shown in Equation (1)
where, attt(u) is the amount of attention received by the account u during the time period t and actt(u) is the total activities or tweets posted by the account u in the time period t. Using Equation (1), we calculate the overall effectiveness of the accounts based on three variables (new followers received, re-tweets posted, and lists added).
Generalized Topic Model
To recognize the patterns of posted tweets giving information to travelers, we have applied Latent Dirichlet Allocation (LDA) or topic modeling approach (Blei et al., 2003). LDA model specifies a probabilistic procedure of generating documents (Steyvers and Griffiths, 2007). The process starts choosing a distribution over topics. And for each word in the document, a topic is randomly selected from the chosen distribution. Finally, a word is randomly drawn from that topic (Steyvers and Griffiths, 2007). The process can be used to infer the set of topics responsible for generating a collection of documents (i.e., tweets) by applying standard statistical techniques inverting the process. The topic model has been widely used in machine learning; it has been recently used in transportation studies (Farrahi and Gatica-Perez, 2011; Hasan and Ukkusuri, 2014). The generative process can be explained this way, for each document d of the D documents:
• Pick a topic distribution, θd ~ P(θ|α)
• For each of the Nd words
- Pick a topic Zd, n ~P(z| θd) and pick word Wd, n ~P(z|φd)
From the graphical model (see Figure 1), we can write the joint distribution:
φi and θd do not depend on any other parameters but Wd, n depends on Zd, n and φk.Compute the conditional distribution of the topic structure given the observed documents can be written as:
For marginalization, P(φ1 : k, θ1 : D, Z1 : D, W1 : D) is divided by P(W1 : D) which can be obtained by integrating P(φ1 : k, θ1 : D, Z1 : D, W1 : D) over φk, θd, and Zd. But this is not feasible because there could be billions of topics structure possible for different words. In this study, we have approximated this term adopting a sampling-based approach (Steyvers and Griffiths, 2007).
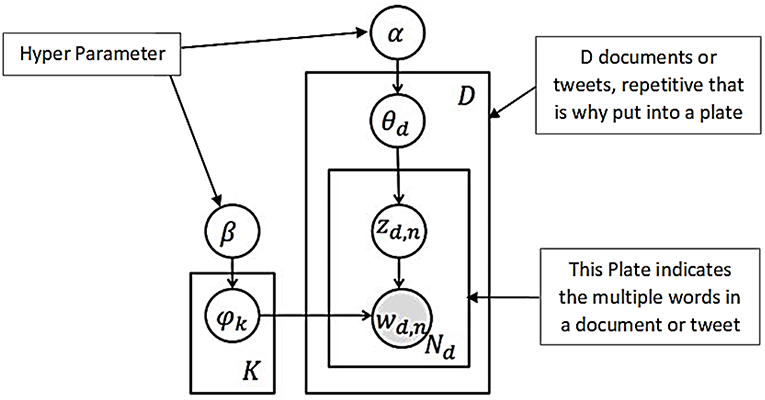
Figure 1. Graphical Representation of an LDA Model.
User Specific Topic Model for Content Analysis
We have also applied a user-specific version of the topic model (Hasan and Ukkusuri, 2014, 2015) that determines the distribution of different topics in the compiled tweets posted by all user accounts and the distribution of different words in each topic. The details on how to estimate model parameters can be found in Hasan and Ukkusuri (2014). Given U user accounts' tweets containing traffic information, K topics over W unique traffic-related words, the objectives of the user-specific model are:
• to find the probability of a word w given each topic k, P(w|z = k )
where P(w|z = k) represents K multinomial distributions over words of size W.
• to find the probability of a user account u given each topic k, P(u|z = k )
where P(u|z = k) represents K multinomial distributions over users of size U.
The above model views a topic as a probability distribution over words and an account's posts as a mixture of these topics. Intuitively, P(w|z) determines the importance of a word to a topic and P(u|z) determines the prevalence of an account's posts to a topic. Thus, P(w|z) and P(u|z) can be used to find top words in a topic and top accounts for a topic, respectively.
Ordered Logit Model for Analyzing Retweet Behavior
In this study, we are modeling the retweet behavior (chances of shared content getting retweeted) based on several attributes related to each of the FDOT twitter accounts which can be easily extracted from the account's information. However, retweeting behavior is more complex than it seems, especially when considering the follower behavior related to a specific account. For example, it is highly unlikely that all followers will be active at the same time of the day and focus on the same content, different users might be active at different time of the day and their preference will differ. Thus, it may appear that unobserved heterogeneity caused by user behavior may affect our results. Researchers have implemented several statistical methods to address such unobserved heterogeneity (Washington et al., 2010; Mannering et al., 2016; Fountas et al., 2018). However, in this study, we are not modeling individual behavior. Instead, we are investigating what features of a tweet—posted by a system-level account—would allow the tweet to be shared more. In this case, we are not dealing with user-level heterogeneity. As such, unobserved heterogeneity should not be of a major concern here.
Another related issue is the presence of selectivity biases of Twitter users. However, we are not focusing on the influence of an individual traveler (specific user account) on information sharing; rather we are estimating which system-generated message gets more attention. As such, we are not analyzing the data generated by the users, instead we are analyzing the data generated by the system. We selected only the FDOT maintained Twitter accounts and the features are directly related to these accounts and their posts. Thus, our data collection is not directly affected by the selectivity biases present among Twitter users. However, the attention received by each post might be affected by selection biases of Twitter users. In this case, since our results are implying information sharing of FDOT Twitter accounts within Twitter's ecosystem, we do not anticipate such biases should be of any major concern.
Thus, we choose ordered logit model to estimate the information value of a particular tweet based on its chances of getting attention. In particular, we use the ordered response model to determine the factors that contributes for a tweet to be retweeted.
In the ordered response model, we assume that there is a uni-dimensional index function (latent propensity) that determines the choice process (Eluru and Yasmin, 2015). We assume that the choice of retweeting (yi) is associated with an underlying continuous latent variable that can be specified as a linear function:
where, Xi is a vector of independent variables for tweet i, β is the vector of unknown parameters to be estimated, and εi is the random disturbance term assumed to be logistic.
Let j (j = 1, 2, 3…………J) denotes the level reflecting the number of times a content has been retweeted (0, 1, 2+) and τj denotes the thresholds associated with these levels. These unknown thresholds supposed to divide the propensity into j − 1 intervals. Thresholdτi relates the unobservable latent variable with the observable ordinal variable yi through a response mechanism of the following form:
In order to ensure well-defined intervals and natural ordering of the observed level of retweets, the thresholds are assumed to be ascending in order, such that τ0 < τ1 < τ2 < ……….τj, for j = 0, 1, 2……J where τ0 = -∞ and τ0 = +∞. The probability equation can be written as follows:
∧(.) represents the standard logistic cumulative distribution function and πij is the probability that a shared content i will be retweeted up to certain level j. The standard logistic distribution function (CDF), applying the transformation in Equation (6), the probability takes the following form:
In Equation (7), the parameter β is constrained to be same across all alternatives, resulting a monotonic impact of independent variables on probability levels (Eluru and Yasmin, 2015).
Data Description and Preprocessing
Florida Department of Transportation (FDOT) 511 service manages 14 Twitter accounts to share incidents and real-time traffic information throughout the state. Each account provides traffic information for specific regions and/or facilities maintained by FDOT. Among these accounts, tweets have been collected from 13 accounts which use English language (Table 1) except the account named “FL511_Estatal” which uses the Spanish language?. We have also collected data from the account “I4-Ultimate” which provides real-time updates about incidents and traffic disruptions in different segments of I-4 caused by the I-4 Ultimate construction project. Using Twitter's REST API (Twitter Developer Documentation: REST API, 2006) we have collected 100,527 tweets for the 14 FDOT accounts. For collecting user specific tweets there is a limitation which imparts that an API can collect only the latest 3,200 tweets of any user account. We ran the search for each user account once every 2 weeks starting from April 08, 2017 to July 21, 2017. Table 1 provides a short description of the accounts considered in this study and the total number of tweets collected during the data collection period.
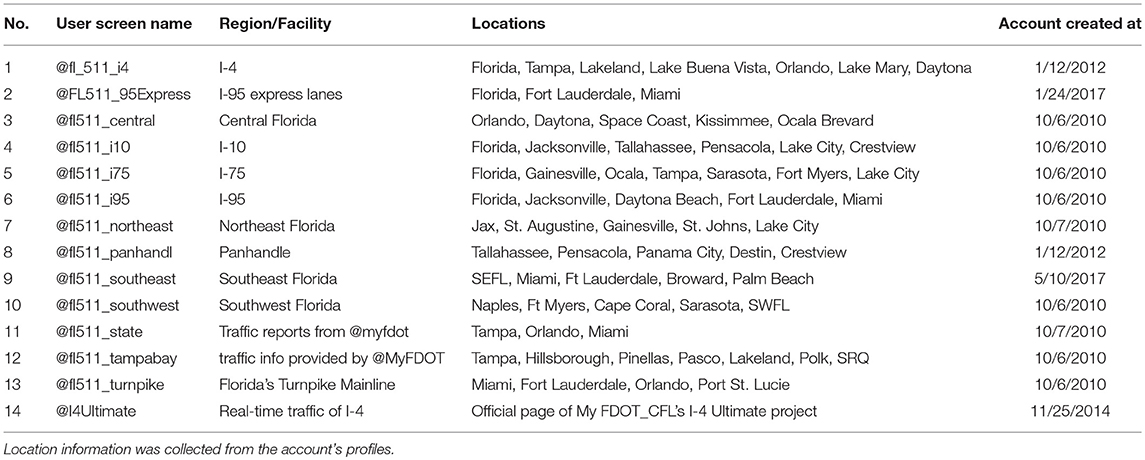
Table 1. Twitter data from FDOT accounts.
Data Analysis
A Twitter account with more followers is likely to spread information to more people and hence has a greater influence. Similarly, the influence of an account to other users can be measured from the list count, assuming that other users will only consider putting this account into a separate list among its friends as far as they find the account giving useful information. Thus, the number of followers and lists added indicate the influence or importance of an account.
Whether people consider the information shared in a tweet as important or not can be measured from the number of times it has been shared by others (known as a re-tweet to Twitter users). Table 2 shows some of the important features extracted from data collected of FDOT Twitter accounts. Figure 2 shows the activity, influence, and attentions gained by these 14 accounts.
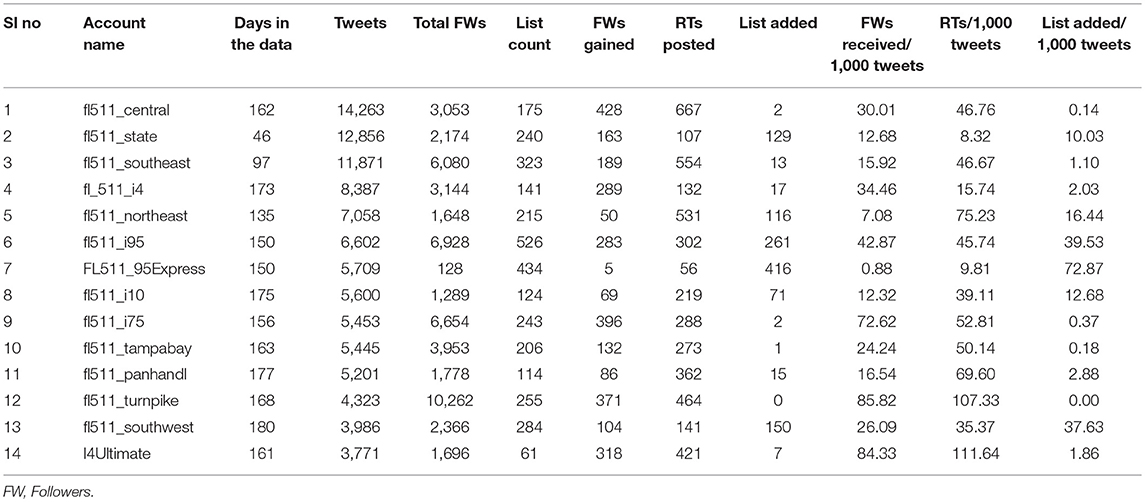
Table 2. Total days, followers (FWs), re-tweets (RTs), lists, and effectiveness of FDOT accounts.
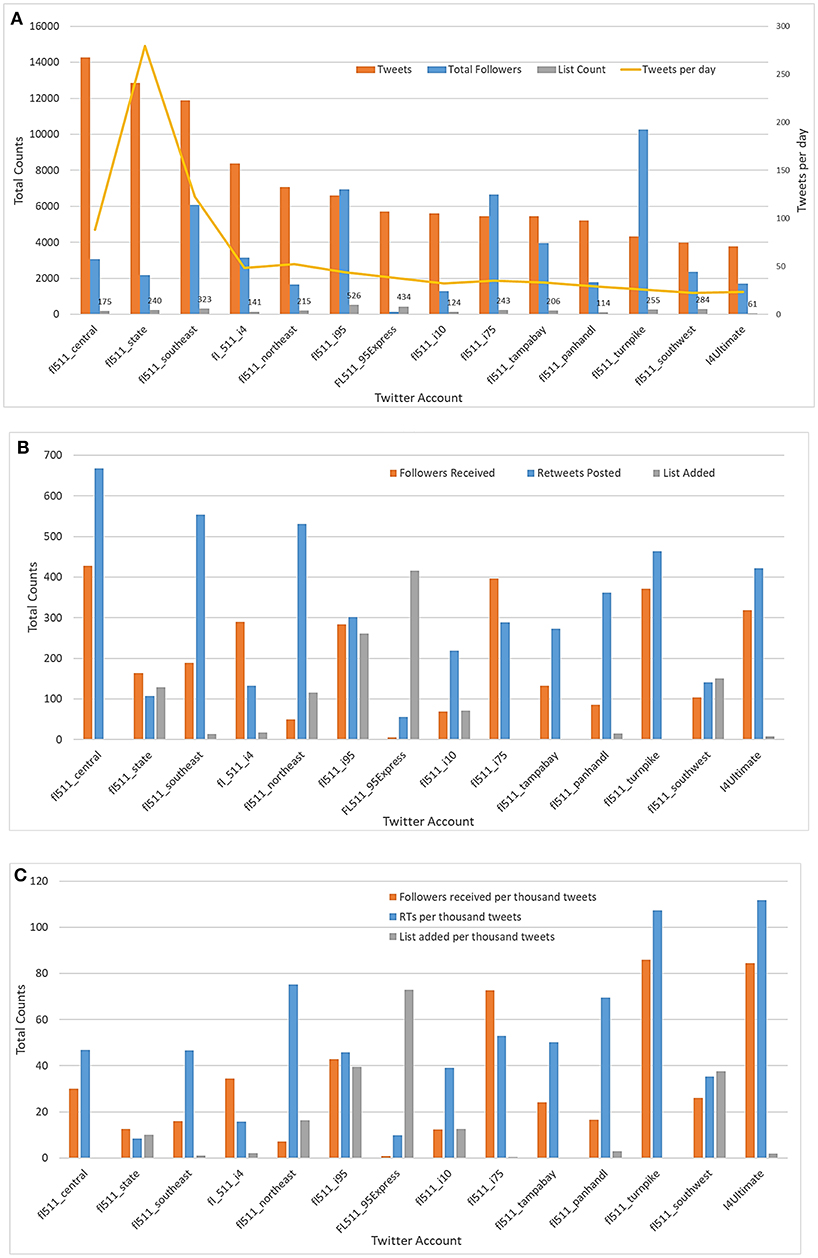
Figure 2. Activity, Influence, Attention by FDOT Twitter accounts: (A) Activity and influence metrics, (B) Attention gained, and (C) Attention gained per thousand tweets.
Figure 2A shows the total number tweets posted starting from the earliest to the latest tweets collected during the data collection period and the total number of followers and list count during the same time frame for each account. It is seen that “fl_511_central” (the account responsible for broadcasting information about Orlando, Daytona, Space Coast, Kissimmee, Ocala, and Brevard) posted the maximum number of tweets (14,263) and “fl_511_state” posted the highest number of tweets per day. “fl511_turnpike” has the highest number of followers showing its overall influence in disseminating information to travelers.
Figure 2B shows that “fl_511_central” received the maximum number of followers (428) during the data collection period and its tweets have been re-tweeted for the highest number of times (667). This indicates that usefulness of the information shared by this account is increasing. To normalize the attention received over account activities, we have plotted the number of followers received, re-tweets posted, and lists added per thousand of tweets posted. “fl511_turnpike” is the most efficient account for gaining new followers per thousand tweets (85.82). On the other hand, “I4Ultimate” is the most efficient account for receiving most re-tweets per thousand tweets (111.64) (see Figure 2C) indicating the relative relevance of information posted by this account. “FL511_95Express” is a relatively new account starting from January 2017 and had the highest rate of list added with lower numbers of re-tweets posted and followers added per thousand tweets. Although established later, “I4Ultimate” is proving to be more efficient in spreading information than “fl_511_i4” with real time traffic updates.
Effectiveness Analysis
To better understand the dynamics of real-time information sharing, we have plotted daily activity and effectiveness metrics for all the accounts. Figure 3A presents the daily activities of the 14 accounts and Figures 3B–D present the daily efficiencies of the accounts in terms of follower gain, re-tweet count, and listed count, respectively. The highest daily activity can be found for the accounts “fl511_stste” and “fl511_central” with daily activity of 400+ tweets. The white portion of the heatmap in Figure 3A represents the days with zero or missing information (data not collected or exceeded the limit of 3,200 tweets during the search process). Up to the last part of February 2017 most of the account had activity of 55–148 (4–5 in natural logarithm scale). “fl511_central,” “fl511_i4,” “FL511_95Express” had constant trend of daily activity.
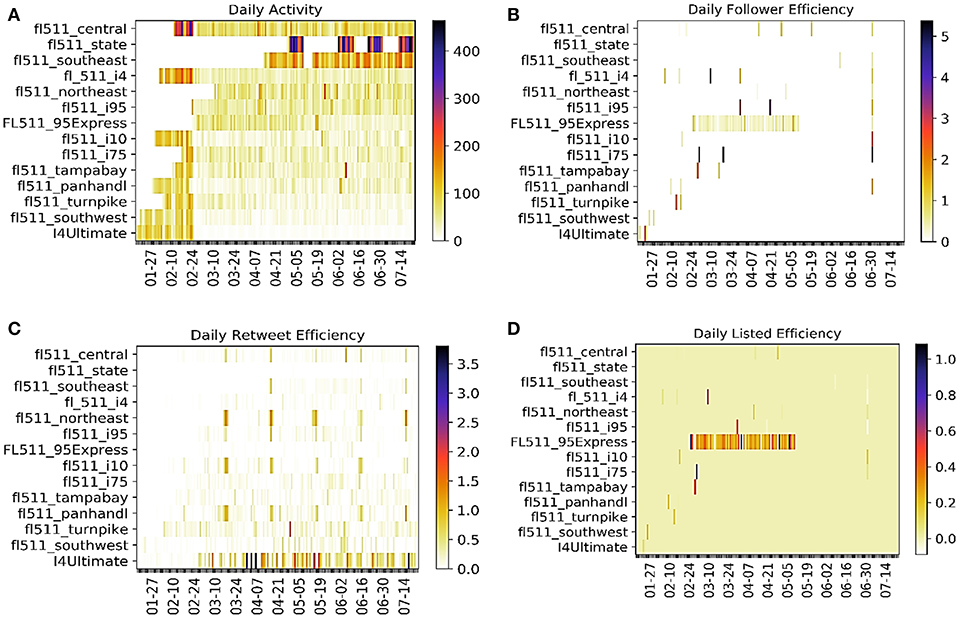
Figure 3. Daily Activity and Effectiveness of FDOT Twitter Accounts. (A) Daily Activity, (B) Daily Effectiveness in terms of Follower Gain, (C) Effectiveness in terms of Re-tweet Count, and (D) Effectiveness in terms of Listed Count.
From Figure 3B it can be found that most of the time the daily effectiveness is zero or close to zero, meaning the number of followers gained is zero or very low compared to the daily activities. Interesting pattern can be seen for the account “Fl511_95Express” as it has a continuous growth in number of followers from the end of February till mid of May 2017, whereas from the beginning till the end of data collection period this account has gained only 5 followers (Table 2). The result is not misleading as this account has lost some of the followers (negative effectiveness) which are not shown in the Figure 3B. The daily re-tweet effectiveness (Figure 3C) is higher for “I4Ultimate,” “fl511_pandhandl,” “fl511_i10,” and “fl511_northeast” etc. “i4Ultimate” is consistent in re-tweet counts, meaning its posted tweets have been re-tweeted more often than the tweets of other accounts. “fl511_state” with high activity has low effectiveness for both followers gain and re-tweet count. From the listed count effectiveness (Figure 3D) it is found that “Fl511_95Express” has similar kind of trend in listed count effectiveness as its follower gain effectiveness. From Table 2 we can see that this account has the highest list added count (equal to 416), that means more user in its follower list have added this account into a separate list among their friends.
Content Analysis for User Specific Data
Previous studies pointed out that the content studies is a critical issues in order to understand the spatial reach of FDOT accounts (Kocatepe et al., 2015). We have applied topic models to find out the probability distribution of certain words in the posted messages or Tweets of FDOT user accounts. We run topic models on two sets of tweet texts: (i) tweets that were re-tweeted at least once and (ii) tweets that were not re-tweeted. Before running the topic model, we carefully filtered out the time stamps from the tweet texts. Figures 4, 5 show the results of topic model runs. The top panels of both figures show the probability distribution of each user account in the corresponding topics. The bottom panel of the figures show the probability distributions of words in a given topic.
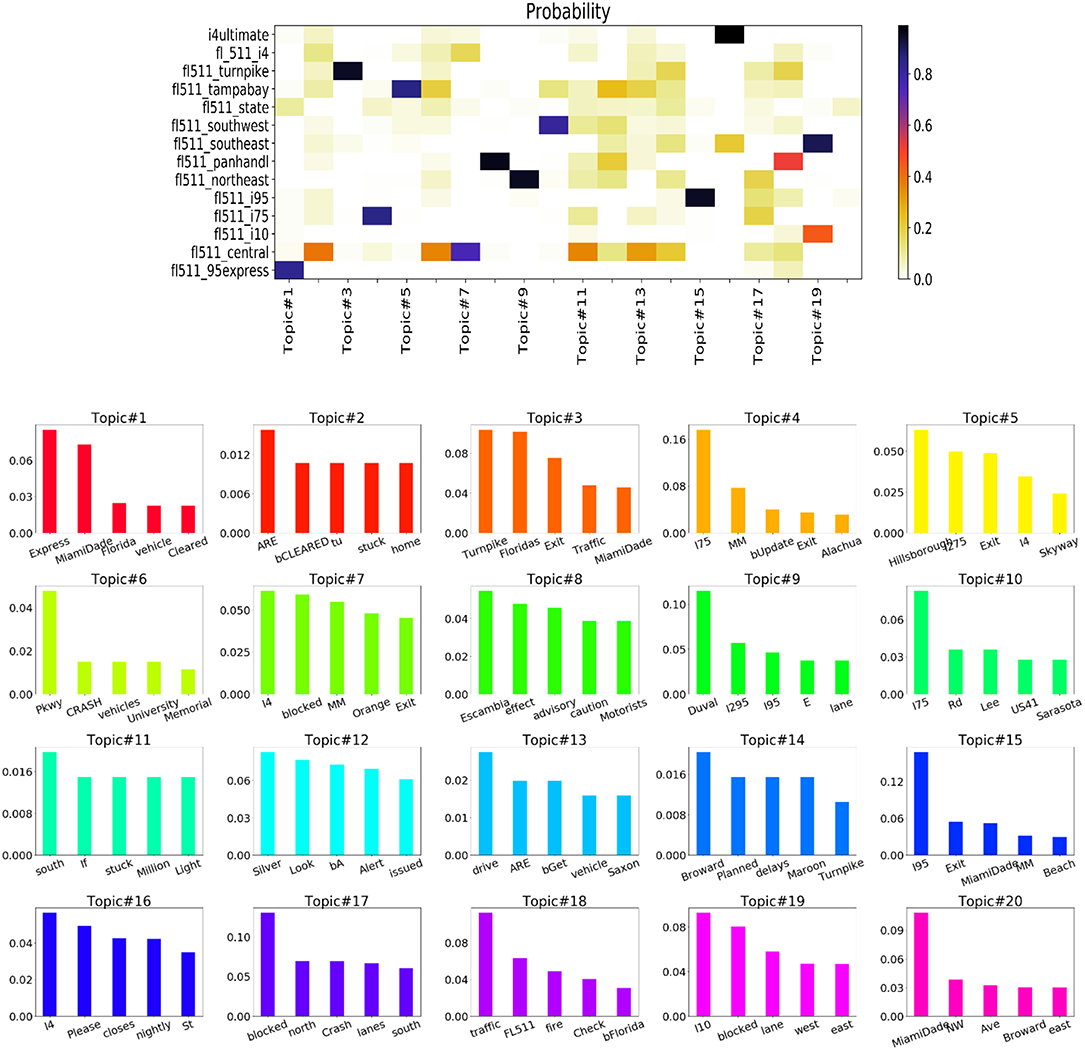
Figure 4. For re-tweeted posts, (top) probability of each user in a topic (the color bar shows the probability scale) and (bottom) probability of each word in a topic.
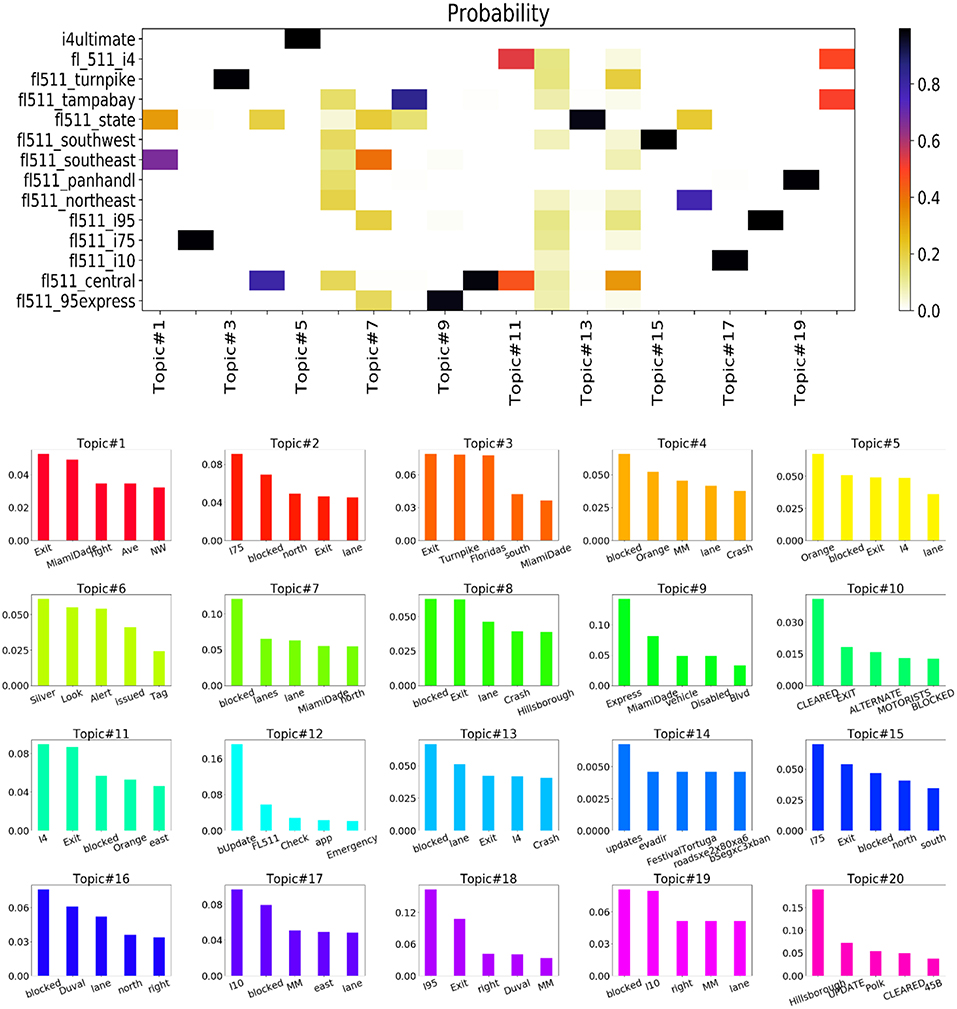
Figure 5. For non-re-tweeted posts, (top) probability of each user in a topic (the color bar shows the probability scale) and (bottom) probability of each word in a topic.
In Figure 4, the top user account for topic #3 is “fl511_turnpike” (the account with the highest effectiveness in follower gains) and the top 5 words of topic #3 include: Turnpike, Floridas, Exit, Traffic, MiamiDade. From Table 2, we found that “fl511_central” has the highest number of re-tweeted posts. From the topic distribution, we can see that “fl511_central” highly contributes to topics #2, #4, #6, #7, #11, #12, #13, #14, and #18. The top words of these topics include, cleared, stuck, Crash, vehicle, Planned, I4, I75, Delays, Pkwy, drive, traffic etc. These topics refer that “fl511_central” received more attention when it broadcasted information about Interstate I-4 and I-75 freeways. We can also interpret the results going over a specific topic. For instance, topic #17 is about the tweets informing travelers about the lane blockages due to crashes. From the top panel, we see that majority of accounts have contributed this topic. This means that tweets related to crashes from most of the accounts are more likely to re-tweeted.
All the topics in Figure 4 indicate the types of information that are more relevant to travelers as the tweets considered in this analysis have been re-tweeted. However, the words found in the word-topic distribution shown in Figure 5 are mostly related to roadway directions (i.e., west, north etc.), locations (i.e., MiamiDade, Duval etc.), dates (i.e., July 4th), and other less informative words (i.e., lane, shoulder etc.). Although it has some similar words like the topics in Figure 4, but the amount is much lower. This indicates that tweets posted about regular updates are less likely to propagate among other users. By Manual checking of the tweets it has been clear that most of the tweets of this set is about different types of updates such as crash, construction, congestion, weather condition (e.g., fog), emergency information and other traffic related information (e.g., lane blocked, lane cleared). Given below are the sample tweets of these kinds:
• Cleared: Off ramp backup Brevard I-95 south Exit 173 SR-514 right lanes blocked. Last updated 06:31:41 p.m.
• Cleared: Planned construction Martin I-95 north Mile Marker 89 right lanes blocked. Last updated 12:57:21 a.m.
• Update: Planned construction Volusia I-95 south MM 262 left lane blocked. Last updated 12:28:06 p.m.
We have removed the time stamps (i.e., Last updated 06:31:41 p.m.) before running the topic models. The first tweet has been posted three times and the second and third tweets have been posted twice. These repeated updates however do not carry any new information, hence are less likely to be relayed by travelers.
Context Wise Tweet Classification
Using LDA model we have generated 20 topics having 10 words in each topic among which only a few were meaningful words such as a crash, updated, disabled, flooding, Traffic, emergency etc. Based on the contexts we have categorized them as crash related updates, traffic congestion related updates, information regarding disabled vehicle, roadway and lane condition, emergency situation or police activity on roadway, weather related updates. There was few other information such as information related to starting of holidays, preparedness alert ahead of hurricane season etc. which cannot be classified into a specific category. So, we have added them to another category which contains other information except these seven categories. So, in total, we have created seven categories of the shared content (Table 3).
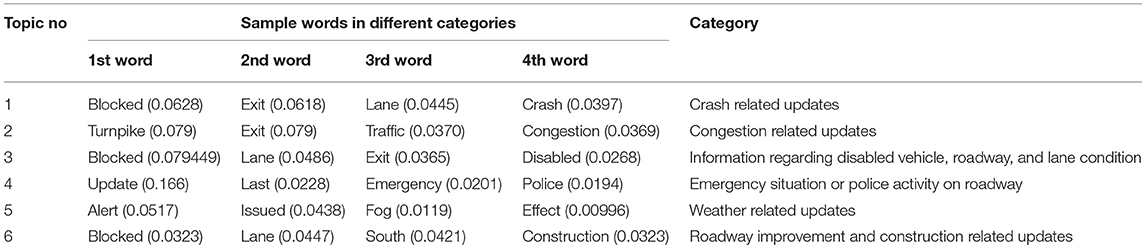
Table 3. Categories based on word distribution in different topics.
Among the 100,527 tweets, about 35% of the tweet are crash related and only 0.5% of the tweets contain weather alerts. About 9% of the tweets have not been classified into any category containing random unusual information.
Prediction Model Results
In this task, we develop a model to determine the effects of different variables on retweeting behavior. We randomly choose 20% of the data for developing the model. In our sample, 3.8% of the data was retweeted, among which 3.4% of the data sample was retweeted once, and 0.4% of the data sample was retweeted more than once. The proportion of the sample in the third category (retweeted more than once) is quite low (<1%), so we do not divide this category further. In our final model we have three outcomes. In Table 4 we added the descriptive statistics of the key variables. In Figure 2A we have already shown the variation of these variables for different accounts. We estimated an ordered logit model (Table 5) that gives us the probability of an information content being retweeted considering whether a tweet has been retweeted or not as a dependent variable and the following predictor variables:
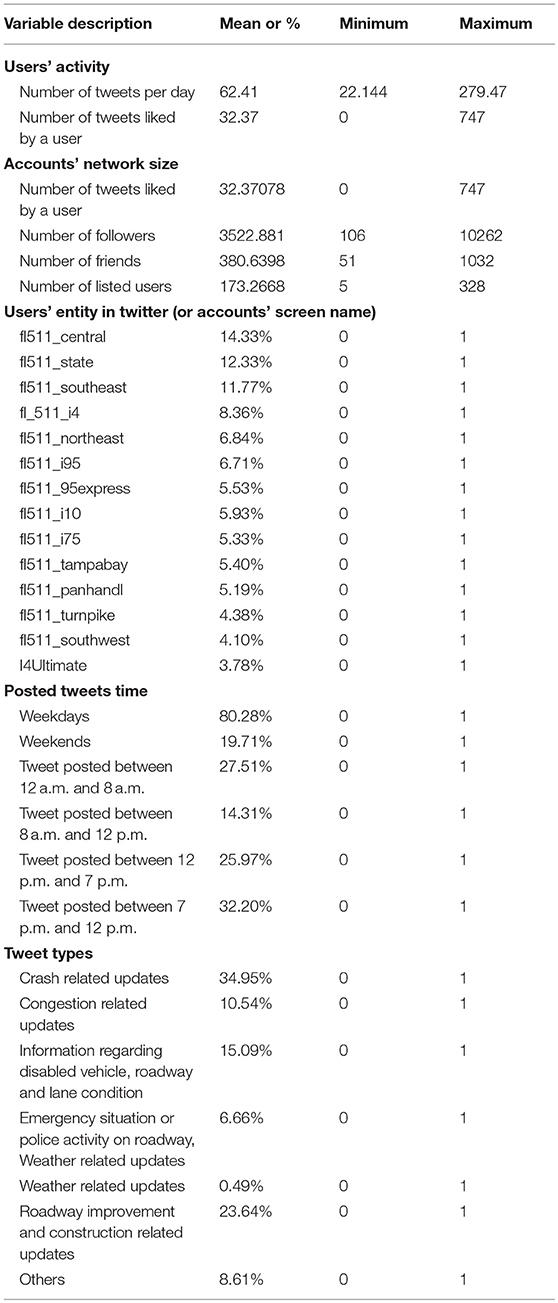
Table 4. Descriptive statistics of key variables.
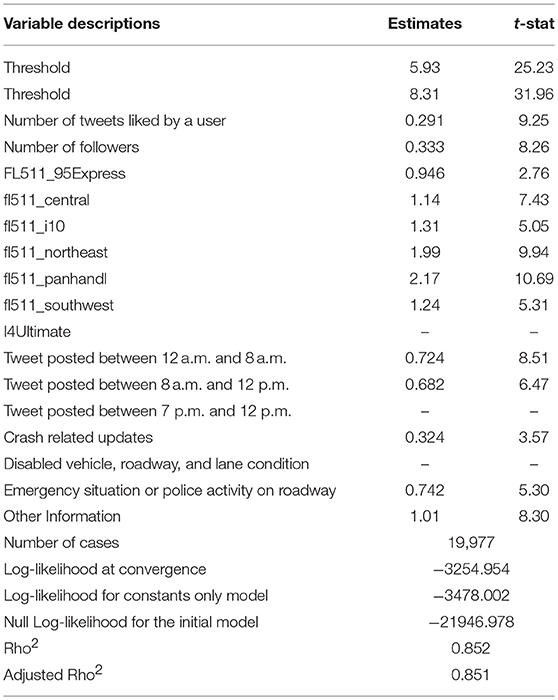
Table 5. Ordered logit model results.
User Favorites Count
User favorites count indicates the number of Tweets a particular user has liked in the account's lifetime. The coefficient corresponding to this variable is positive which means that if all others remain same, the probability of an account's posts getting retweeted increases with the increase of its favorite counts. The possible reason is that if an account likes the content shared by other users then it will get more attention and those people will follow his post. So, the chances of getting retweeted increases.
Network Size
Network size of a user account is indicated by the number of followers and friends connected with the account. After controlling all other variables, the likelihood of getting retweeted increases with increased number of followers. If an account has higher number of followers, its content will get more attention and the chances of being retweeted will be higher.
Users Entity
The tweet posted by a particular user account has a significant influence on getting attention. From Table 4, we can observe that while tweets are posted by FL511_95Express, fl511_central, fl511_i10, fl511_northeast, fl511_panhandl, fl511_southwest user entity there is a higher chance of getting attention from the people hence chances of being retweeted is higher. Moreover, we can conclude that fl511_central, ffl511_northeast, fl511_panhandl are the most influential user entity in case of getting attention from the people.
Time of the Day
If a tweet is posted after midnight (12–8 a.m.) and in morning hour (8 p.m. to 12 a.m.) then the chances of getting retweeted increases. The reason is that normally morning hour is important to time period for the people and they prepare for their work trip, so they are more likely to check the overall condition what is going outside, whether there is any blockage or congestion on the way to the office etc. that is why tweets posted during this period get more attention and chances of getting retweeted increases.
Tweet Type
Controlling other parameters, if the shared content contains crash related updates then the chances of getting retweeted increases. This is reasonable because people are more concerned about traffic incidents and post-incident roadway condition while preparing for their trips. Moreover, the information such as whether there is any emergency alert or police activity on the roadway, such an information gets more attention from users and is more likely to be shared. Compared to these two types of updates, construction related updates are less likely to be retweeted.
SMART-Feed Framework
To share information related to regular traffic updates, roadway management, and emergency alerts, many transportation agencies in the USA manage 511 service Twitter accounts. These accounts may overburden users with repetitive information and thus discourage users to follow. In this regard, we propose a framework (see Figure 6) to effectively use social media as traffic information sharing platforms. We developed a filtering process that computes the potential value of the shared information based on past trends on user response to such information. If the value is less than a threshold value, then the content will be discarded from being shared.
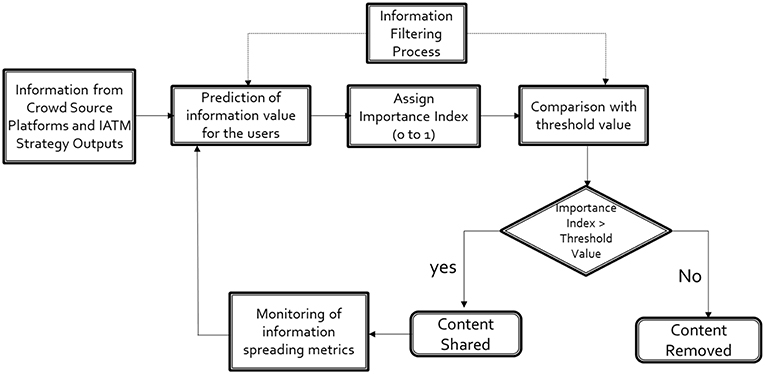
Figure 6. SMART-Feed Framework.
The value of a shared information depends on its chances of getting attention from users. If an information content is shared by more users, it will be more spread to other users. In the proposed framework, we are computing the importance value for a shared content based on the probability of it being retweeted. So, the estimated information value will vary between 0 and 1. For the information filtering process, we will select an initial threshold value which will be updated based on monitoring the improvement in effectiveness metrics for a particular account. The proposed framework includes some information spreading metrics for monitoring the effectiveness of the information sharing.
The proposed framework can potentially be integrated with traffic decision-making tools (e.g., Integrated Active Traffic Management, IATM), to support their information dissemination functions. Through this framework, IATM strategies will be shared with users of social media platforms (e.g., Twitter). We can measure the effectiveness of this information to users analyzing their responses. Moreover, there will be some informative updates which will require maximum attention. The proposed method will help us to share the information more effectively (through specific users, time of day etc.) so that they get maximum attention.
Conclusions
Real-time information sharing has been a critical component of successful traffic operations and management and intelligent transportation systems. Most transportation agencies in the USA have adopted Twitter, one of the most widely used social media platforms, as a medium to instantly share traffic information to travelers. Although Twitter is freely available for information sharing, assessing the attention and effectiveness of information sharing needs further analysis. In addition, with an increasing network size, users served, and diversity of services provided, agencies have to be efficient in spreading real-time traffic updates to as many users as possible.
The primary focus of this study is to understand the effectiveness of real-time information sharing using Twitter. For this purpose, we have gathered and analyzed about 100,525 tweets posted by 14 FDOT operated Twitter accounts. We have considered several indicator variables such as the number of followers, the number of times a tweet has been shared and the number of times an account has been added to a list. Using these variables, we have proposed several metrics to measure influence, attention, and effectiveness in gaining attention by these accounts. We have developed LDA models to infer the underlying topic of a tweet in real-time. We also developed an ordered logit model to determine the information value of a tweet to a traveler based on the chances of getting attention. Finally, we propose a framework known as SMART-Feed to improve the effectiveness of real-time information sharing using Twitter.
The results from our analysis indicate that FDOT Twitter accounts have significant number of followers ranging from 128 to 10,262 and the messages posted by these accounts have gained reasonable attention. We also find that a higher number of activities is not necessarily associated with a higher effectiveness value. “I4Ultimate,” the account posting the least number of updates about the recent I-4 construction project, has received the highest number of retweets per thousand tweets. To understand the content of the posted messages that are more likely to be shared again, we have used a text mining technique known as a topic model. Our results indicate that tweets repeatedly posted about regular updates are less likely to be shared by users. On the other hand, tweets with contents like congestion, roadway blockage, clearing updates with specific route mention gain more attentions. Thus, it can be concluded that FDOT's Twitter accounts are highly engaged and their activities have received varied attentions as found by our metrics; however, these metrics can be significantly improved to reach a larger number of Florida residents.
The result from our retweeting prediction model shows that user entities like fl511_central, ffl511_northeast, fl511_panhandl get more attention, hence more effective in sharing information. The type of the content shared to the viewers is also an important factor. If the shared information contains crash related updates, the chances of getting retweeted increases. Moreover, the information like whether there is any emergency alert or police activity on the roadway, which are quite unusual news and sometimes this news get more attention from the users and they are more likely to share this information.
Our analysis shows that Twitter has a substantial potential to become a part of successful active traffic management systems by delivering relevant timely updates to travelers in a cost-effective way. Though we have developed a filtering technique to determine relevant posts and avoid information overloading for users, we need further refinements of the proposed models to be implemented in a real-world setting.
In future research, one should consider different modeling frameworks to better capture information sharing and investigate the effects of unobserved heterogeneity and selectivity biases of Twitter users on model results. In this study, we have excluded the account posting tweets in the Spanish language to make the sample homogenous. We can include the data from this account to check the stability of model results across population groups. Finally, to be deployable, the proposed SMART-Feed framework should be implemented and validated with real-world data.
Author Contributions
SH and RR: study conception and design. RR, KR, and SH: analysis and interpretation of data and results. RR: drafting of Manuscript. SH and MA-A: revision and editing and supervision. MA-A: funding acquisition.
Conflict of Interest Statement
The authors declare that the research was conducted in the absence of any commercial or financial relationships that could be construed as a potential conflict of interest.
Acknowledgments
The authors are grateful to the Florida Department of Transportation (FDOT) for supporting this study.
References
Anger, I., and Kittl, C. (2011). “Measuring influence on Twitter,” in Proceedings of the 11th International Conference on Knowledge Management and Knowledge Technologies - i-KNOW'11 (Graz), 31. doi: 10.1145/2024288.2024326
Blei, D. M., Edu, B. B., Ng, A. Y., Edu, A. S., Jordan, M. I., and Edu, J. B. (2003). Latent dirichlet allocation. J. Mach. Learn. Res. 3, 993–1022. doi: 10.1162/jmlr.2003.3.4-5.993
Bregman, S., and Watkins, K. E.. (eds.) (2013). Best Practices for Transportation Agency Use of Social Media, 1st Edn. Boca Raton, FL: CRC Press.
Cha, M., Haddai, H., Benevenuto, F., and Gummadi, K. P. (2010). “Measuring user influence in twitter: the million follower fallacy,” in Proceedings of the Fourth International Conference on Weblogs and Social Media, ICWSM 2010 (Washington, DC).
Chen, Y. (2017). “Twitter or chatter? Involving social media data analysis in traffic incident management,” in Transportation Research Board 96th Annual Meeting (Washington DC), 1–20.
Collins, C., Hasan, S., and Ukkusuri, S. (2013). A novel transit rider satisfaction metric: rider sentiments measured from online social media data. J. Public Transp. 16, 21–45. doi: 10.5038/2375-0901.16.2.2
Culotta, A. (2010). “Towards detecting influenza epidemics by analyzing Twitter messages,” in Proceedings of the First Workshop on Social Media Analytics (Washington, DC), 115–122.
Earle, P. S., Bowden, D. C., and Guy, M. (2011). Twitter earthquake detection: earthquake monitoring in a social world. Ann. Geophys. 54, 708–715. doi: 10.4401/ag-5364
Eirikis, D., and Eirikis, M. (2010). Friending transit: how public transit agencies are uisng social media to expand their reach and imrove their image. Mass Transit 2, 32–37. Available online at: https://trid.trb.org/view/913607
Eluru, N., and Yasmin, S. (2015). A note on generalized ordered outcome models. Anal. Methods Accid. Res. 8, 1–6. doi: 10.1016/j.amar.2015.04.002
Farrahi, K., and Gatica-Perez, D. (2011). Discovering routines from large-scale human locations using probabilistic topic models. ACM Trans. Intell. Syst. Technol. 2, 1–27. doi: 10.1145/1889681.1889684
Fountas, G., Anastasopoulos, P. C., and Mannering, F. L. (2018). Analysis of vehicle accident-injury severities: a comparison of segment- versus accident-based latent class ordered probit models with class-probability functions. Anal. Methods Accid. Res. 18, 15–32. doi: 10.1016/j.amar.2018.03.003
Hasan, S., and Ukkusuri, S. V. (2014). Urban activity pattern classification using topic models from online geo-location data. Transp. Res. C Emerg. Technol. 44, 363–381. doi: 10.1016/j.trc.2014.04.003
Hasan, S., and Ukkusuri, S. V. (2015). Location contexts of user check-ins to model urban geo life-style patterns. PLoS ONE 10:e0124819. doi: 10.1371/journal.pone.0124819
He, K., Xu, Z., Wang, P., Deng, L., and Tu, L. (2016). Congestion avoidance routing based on large-scale social signals. IEEE Trans. Intell. Transp. Syst. 17, 2613–2626. doi: 10.1109/TITS.2015.2498186
Huang, C.-M., Chan, E., and Hyder, A. (2010). Web 2. 0 and internet social networking: a new tool for disaster management? - Lessons from Taiwan. BMC Med. Inform. Decis. Mak. 10:57. doi: 10.1186/1472-6947-10-57
Imran, M., Elbassuoni, S., Castillo, C., Diaz, F., and Meier, P. (2013). “Extracting information nuggets from disaster-related messages in social media,” in The 10th International Conference on Information Systems for Crisis Response and Management (ISCRAAM) (Baden-Baden), 791–800. doi: 10.1145/2534732.2534741
Jou, R. C., and Chen, K. H. (2013). A study of freeway drivers' demand for real-time traffic information along main freeways and alternative routes. Transp. Res. C Emerg. Technol. 31, 62–72. doi: 10.1016/j.trc.2013.02.011
Jou, R. C., Lam, S. H., Liu, Y. H., and Chen, K. H. (2005). Route switching behavior on freeways with the provision of different types of real-time traffic information. Transp. Res. A Policy Pract. 39, 445–461. doi: 10.1016/j.tra.2005.02.004
Klout Score (2018). Klout Is Now Kaput [WWW Document]. www.lithium.com. Available online at: https://klout.com/home
Kocatepe, A., Lores, J., Ozguven, E. E., and Yazici, A. (2015). “The reach and influence of DOT Twitter accounts: a case study in Florida,” in Proceedings of the 2015 IEEE 18th International Conference on Intelligent Transportation Systems, ITSC 2015–October (Washington, DC), 330–335.
Kryvasheyeu, Y., Chen, H., Obradovich, N., Moro, E., Hentenryck, P., Van, F., owler, J., et al. (2016). Rapid assessment of disaster damage using social media activity. Sci. Adv. 2:e1500779. doi: 10.1126/sciadv.1500779
Kümpel, A. S., Karnowski, V., and Keyling, T. (2015). News sharing in social media: a review of current research on news sharing users, content, and networks. Soc. Media Soc. 1, 1–14. doi: 10.1177/2056305115610141
Lee, J. H., Mcbride, E., Mcbride, E., and Goulias, K. G. (2017). “Exploring social media data for travel demand analysis: a comparison of Twitter, household travel survey and synthetic population data in California,” in Transportation Research Board 96th Annual Meeting (Washington, DC).
Liu, Y., Sui, Z., Kang, C., and Gao, Y. (2014). Uncovering patterns of inter-urban trip and spatial interaction from social media check-in data. PLoS ONE 9:e86026. doi: 10.1371/journal.pone.0086026
Mannering, F. L., Shankar, V., and Bhat, C. R. (2016). Unobserved heterogeneity and the statistical analysis of highway accident data. Anal. Methods Accid. Res. 11, 1–16. doi: 10.1016/j.amar.2016.04.001
Mendoza, M., Poblete, B., and Castillo, C. (2010). Twitter under crisis: can we trust what we RT? Work. Soc. Media Anal. 9, 71–79. doi: 10.1145/1964858.1964869
Misra, A., Gooze, A., Watkins, K., Asad, M., and Le Dantec, C. (2014). Crowdsourcing and its application to transportation data collection and management. Transp. Res. Rec. J. Transp. Res. Board 2414, 1–8. doi: 10.3141/2414-01
Mitchell, A., and Page, D. (2013).The role of news on facebook. Pew Res. J. Proj. 1–24. Available online at: http://mediaimpact.issuelab.org/resources/16225/16225.pdf
NASCIO (2010). Friends, Followers and Feeds. A National Survey of Social Media use in State Government, 37.
Ni, M., He, Q., and Gao, J. (2016). Forecasting the subway passenger flow under event occurrences with social media. IEEE Trans. Intell. Transp. Syst. 18, 1623–1632. doi: 10.1109/TITS.2016.2611644
Pender, B., Currie, G., Delbosc, A., and Shiwakoti, N. (2014). Social media use during unplanned transit network disruptions: a review of literature. Transp. Rev. A Transnatl. Transdiscipl. J. 34, 501–521. doi: 10.1080/01441647.2014.915442
Peng, H.-K., Zhu, J., Piao, D., Yan, R., and Zhang, Y. (2011). “Retweet modeling using conditional random fields,” in Data Mining Workshops (ICDMW), 2011 IEEE 11th International Conference (Vancouver, BC), 336–343.
Rashidi, T. H., Abbasi, A., Maghrebi, M., Hasan, S., and Waller, T. S. (2017). Exploring the capacity of social media data for modelling travel behaviour: opportunities and challenges. Transp. Res. C Emerg. Technol. 75, 197–211. doi: 10.1016/j.trc.2016.12.008
Roy, K. (2018). Understanding crisis communication and mobility resilience during disasters from social media STARS citation. (Electronic theses and dissertations). University of Central Florida, Orlando, FL, United States.
Roy, K. C., Cebrian, M., and Hasan, S. (2019). Quantifying human mobility resilience to extreme events using geo-located social media data. EPJ Data Sci. 8:18. doi: 10.1140/epjds/s13688-019-0196-6
Roy, K. C., and Hasan, S. (2018). “Quantifying human mobility resilience to extreme events using geo-located social media data,” in Transportation Research Board 97th Annual Meeting.
Sadri, A. M., Hasan, S., Ukkusuri, S. V., and Cebrian, M. (2017). Understanding information spreading in social media during Hurricane Sandy: user activity and network properties. arXiv[Preprint].arXiv:1706.03019.
Sadri, A. M., Hasan, S., Ukkusuri, S. V., and Lopez, J. E. S. (2017). Analyzing social interaction networks from twitter for planned special events. arXiv[Preprint].arXiv:1704.02489.
Srinivasan, K. K., and Krishnamurthy, A. (2004). “Investigating the role of mixed real-time information strategies in network performance,” in Transportation Research Board, 83rd Annual Meeting (Washington, DC).
Steyvers, M., and Griffiths, T. (2007). “Probabilistic topic models,” in Handbook of Latent Semantic Analysis, eds T. Landauer, D McNamara, S. Dennis, and W. Kintsch (Mahwah, NJ: Lawrence Erlbaum Associates Publishers), 427–448.
Transportation Research Board and National Academies of Sciences Engineering, and Medicine. (2012). Uses of Social Media in Public Transportation. Washington, DC: The National Academies Press. doi: 10.17226/14666
Twitter by the Numbers: Stats, Demographics and Fun Facts (2017). Omnicore [WWW Document]. Available online at: https://www.omnicoreagency.com/twitter-statistics/
Twitter Developer Documentation: REST API (2006). Available online at: https://developer.twitter.com/en/docs; https://dev.twitter.com/rest/public (accessed December 30, 2017).
Washington, S. P., Karlaftis, M. G., and Mannering, F. (2010). Statistical and Econometric Methods for Transportation Data Analysis, 2nd Edn. Boca Raton, FL: Chapman and Hall/CRC.
Website Grader (2006). Available online at: https://website.grader.com/ (accessed December 25, 2017).
Zaman, T., Fox, E. B., and Bradlow, E. T. (2014). A bayesian approach for predicting the popularity of tweets. Ann. Appl. Stat. 8, 1583–1611. doi: 10.1214/14-AOAS741
Keywords: real-time traffic information, social media, twitter, topic model, information value, retweeted
Citation: Rahman R, Roy KC, Abdel-Aty M and Hasan S (2019) Sharing Real-Time Traffic Information With Travelers Using Twitter: An Analysis of Effectiveness and Information Content. Front. Built Environ. 5:83. doi: 10.3389/fbuil.2019.00083
Received: 04 January 2019; Accepted: 06 June 2019;
Published: 26 June 2019.
Edited by:
Panagiotis Ch. Anastasopoulos, University at Buffalo, United StatesReviewed by:
Grigorios Fountas, Edinburgh Napier University, United KingdomAli Behnood, Purdue University, United States
Copyright © 2019 Rahman, Roy, Abdel-Aty and Hasan. This is an open-access article distributed under the terms of the Creative Commons Attribution License (CC BY). The use, distribution or reproduction in other forums is permitted, provided the original author(s) and the copyright owner(s) are credited and that the original publication in this journal is cited, in accordance with accepted academic practice. No use, distribution or reproduction is permitted which does not comply with these terms.
*Correspondence: Samiul Hasan, c2FtaXVsLmhhc2FuQHVjZi5lZHU=