 Atieh Al-Issa1
 Ayman M. El Ansary
 Haitham Aboshosha
 Moustafa Aboutabikh
 Tarek Ghazal
- 1Department of Civil and Environmental Engineering, Western University, London, ON, Canada
- 2Faculty of Engineering, Alexandria University, Alexandria, Egypt
- 3Civil Engineering Department, Ryerson University, Toronto, ON, Canada
Transmission line structures, though designed per code provisions, have suffered several failures worldwide in the past. As reported in the body of the available literature, more than 80% of those failures are due to severe localized wind events such as downbursts. Several recent studies have emphasized the importance of the conductor loads and how their forces contribute to the failure of the towers. The velocity profile and loads associated with a downburst wind field vary significantly with the change in the downburst configuration. Previous studies have focused on identifying the critical transmission tower members that are likely to fail during a downburst event and the associated critical downburst configurations. In all these studies, a smooth terrain was assumed where the effect of terrain roughness is not considered. In the current study, an evolutionary optimization algorithm is coupled with a semi-closed form solution technique to predict the maximum conductor reactions under downburst wind field and the associated critical downburst configurations. A Large Eddy Simulation (LES) model of downbursts impinging on various exposure conditions, developed in a previous study, has been incorporated to predict wind forces acting on the conductor line. It is believed that the current study is the first of its kind to provide critical downburst configurations that lead to maximum conductor's reactions while considering the effect of terrain exposure (open, countryside, suburban, and urban). Based on the optimal downburst configuration identified for each type of terrain roughness, a simple and practical approach in the form of simple equations and a set of charts to evaluate maximum reactions has been developed and validated. The simplified approach is suitable for practicing engineers to accurately and rapidly evaluate maximum conductor reactions under downburst events considering multiple terrain conditions.
Introduction
The transmission line system (TL) has a significant importance as it undertakes the task of transmitting electricity from source of production to end users.
Despite the importance of guaranteeing structural safety of a transmission tower-line system during its service life, a large number of failures has been reported in the past due to weather conditions (Dempsey and White, 1996; Li, 2000). These include High Intensity Wind (HIW) events in the form of downbursts and tornadoes which emphasize the importance of accurate design wind loads. Investigations of failure records of transmission towers in several countries showed that downbursts are responsible for more than 80% of the failure of transmission line towers worldwide (Dempsey and White, 1996). In September 1996, Manitoba Hydro company in Canada reported a failure of 19 transmission line towers due to downburst events across the province (McCarthy and Melsness, 1996). The Ontario Hydro company also reported that five out of every six weather related transmission line failures are due to HIW events (Behncke and White, 2006). In Australia, Li (2000) reported that HIW in the form of downbursts are responsible for more than 90% of weather-related failures of structures. This highlights the need to furtherly investigate the behavior of transmission lines during these events and subsequently develop accurate and effective design procedures that can be easily applied by practitioners. Figure 1 shows typical transmission line components and longitudinal reactions on the conductors.
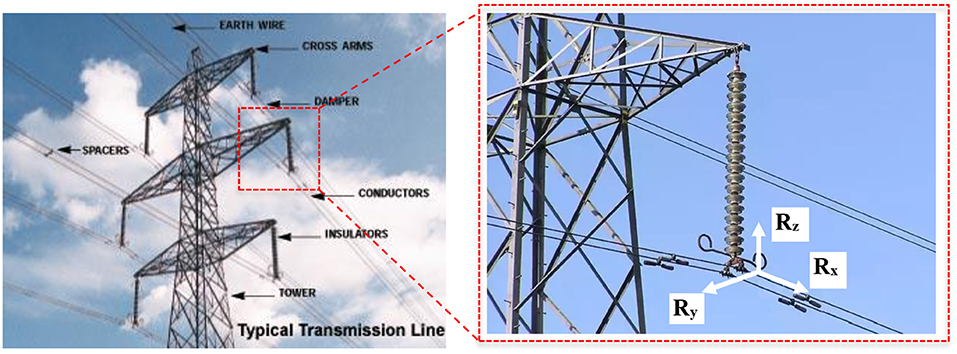
Figure 1. Components of transmission line system and longitudinal reactions “http://electrical-power-system.blogspot.ca”.
Previous studies on the failure of TLs under downburst winds showed the importance of the loads applied to the conductors and transmitted to the towers. For instance, a study of downbursts and tornadoes effect on isolated towers was presented by Savory et al. (2001). Their study highlighted the importance of studying the entire structural system instead of isolated structure due to the unequal distribution of loads that occurred as a result of these events. The studies conducted by Shehata et al. (2008) and Aboshosha and El Damatty (2012) showed that the longitudinal forces transferred from the conductors to the towers is responsible for the most critical failure modes of the towers. Similar findings were also obtained by the experimental wind tunnel test conducted by Elawady et al. (2017). All of this proves the importance of accounting for the conductor loads transferred to the towers. In order to predict the behavior or failure of transmission lines under downbursts, finite Element Analysis (FEA) was utilized (Shehata et al., 2005; Shehata and El Damatty, 2007). It was shown that these analyses are time consuming when evaluating the critical longitudinal forces transmitted to the towers due to high flexibility of the conductors and the localized behavior of downbursts leading to altering the loads acting on the conductors and consequently the transmitted forces from the conductors to the towers. Other than FEA, Irvine (1981) and Yu et al. (1995) proposed a closed-form solution to obtain the reaction for a single spanned conductor. However, they did not consider the flexibility of the insulators, which has a significant effect on the forces transmitted to the towers. Winkelman (1959) proposed a method that accounts for insulator flexibility, however, it neglected the difference between the conductors' tensile forces in the adjacent spans and failed to predict the longitudinal forces transmitted to the tower. Aboshosha and El Damatty (2014a) developed an efficient technique to analyze transmission line conductors subjected to spatially variable loads corresponding to downbursts and tornadoes. Later, Aboshosha and El Damatty (2014b) developed a semi-closed form solution for the conductor reaction when subjected to downburst winds. In this semi-closed form solution, a factor characterizing the spatial variation of the downburst loads was extracted from the Computational Fluid Dynamic (CFD) simulation of a downburst in open terrain (Kim and Hangan, 2007). A recent experimental study by Elawady et al. (2018) has shown that terrain exposures and cable weight influence downburst location and loads that lead to the maximum conductor reaction. To evaluate the maximum conductor reaction transmitted to the towers, an intensive parametric study should be conducted followed by a non-linear analysis to evaluate the reactions for each combination of those parameters. The parameters include the relative location of the downburst with respect to the tower of interest (defined by the polar coordinates R and θ) as well as the size of the downburst.
Due to the importance of accounting for the conductor reactions and the challenge in conducting computationally intensive analyses to evaluate those reactions, the current study sought to develop an easy-to-apply method suitable for practicing engineers to predict peak conductor reactions for different terrain exposures under downburst loads.
The layout of the evaluated cases is based on a study by Shehata et al. (2005, 2008). In their study they concluded that 6 spans (3 on each side of the tower of interest) is the minimum number required for accurate evaluation of the conductor reactions (Figure 2).
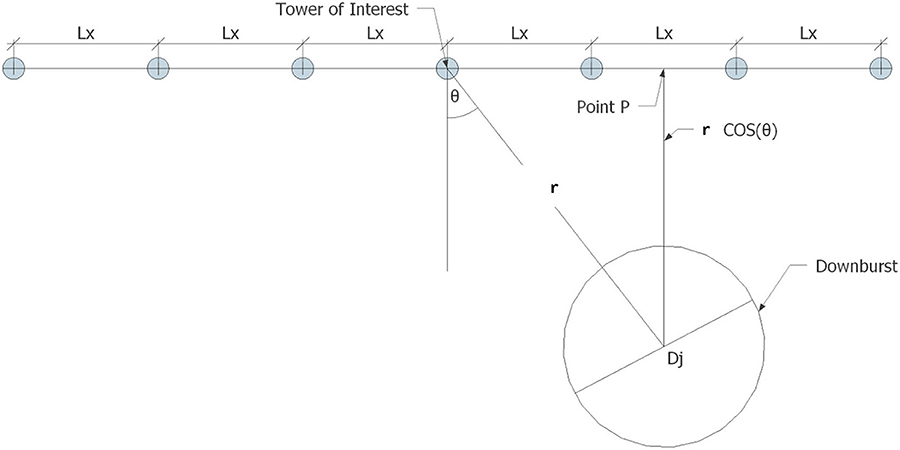
Figure 2. Downburst parameters for a six-spanned transmission line system.
This method is based on CFD downburst wind profiles provided by Aboshosha et al. (2015) for various terrain exposures. This is linked with the semi-closed form technique by Aboshosha and El Damatty (2014b), coupled with Genetic Algorithm (GA) optimization to predict the most critical downburst configuration and associated conductor reactions. Genetic Algorithms have proven to have superior efficiency over other random search methods in solving complex structural engineering applications (Shehata et al., 2008; El Ansary et al., 2010, 2011a,b; Elshaer et al., 2015).
Coupling the CFD data, with semi-closed form analysis and GA techniques allows one to: (i) Identify the critical downburst configurations that produce maximum conductor's reactions for four different exposures (open, countryside, suburban, and urban), and (ii) develop an easy-to-apply approach to evaluate maximum unbalanced longitudinal and transverse reactions based on the critical downburst configurations identified in (i). This approach is in the form of simple equations and a set of charts.
The outline of this paper is as follows. In section Introduction (this section), an introduction and a review for the literature related to downburst and TL conductor reaction is provided. Section Downburst wind field focuses on downburst modeling while section Technique to Analyze Transmission Line Conductors Under HIW focuses on a description of the semi-closed form analysis technique. Section GA Optimization Technique shows details of the GA optimization and its coupling with both the CFD data from section Downburst Wind Field and the analysis technique from section Technique to Analyze Transmission Line Conductors Under HIW. Section Results and Discussion presents the main findings of this study and the proposed simplified approach to evaluate the maximum unbalanced longitudinal and transverse conductor's reactions. A Numerical example is provided in section Simplified Approach and Numerical Example, to explain detailed steps required to apply the proposed set of charts. Finally, in section Conclusions, the main conclusions drawn from the study are presented.
Downburst Wind Field
Although field studies can provide the actual velocity measurements of downbursts, acquiring these data is a challenging task due to the uncertainty of the event occurrence location and time (localized effect). Such challenges motivated many researchers in the past to study downbursts either experimentally (Oseguera and Bowles, 1988; Lundgren et al., 1992; Alahyari and Longmire, 1994; Yao and Lundgren, 1996; Wood et al., 2001; Chay and Letchford, 2002) or computationally (Chay et al., 2006; Hadziabdic, 2006; Kim and Hangan, 2007; Sengupta and Sarkar, 2008; Mason et al., 2009). In the computational studies of downburst, different methods are used including: Impinging jet (IJ) method, implemented by Kim and Hangan (2007), Cooling Source (CS) method, proposed by Anderson et al. (1992) and utilized by Mason et al. (2009, 2010) and Vermeire et al. (2011a,b), and the method of simulating the downburst producing-thunderstorm developed by Orf et al. (2012). It can be concluded from these studies that the method of simulating downburst producing-thunderstorm is computationally expensive and that both IJ and CS methods are computationally more efficient. While simulating many mean characteristics of downbursts, none of the above-mentioned studies simulated turbulent characteristics of the flow near the ground such as: turbulence intensities, length scales, spectra, and peak factors. However, these characteristics are essential to quantify the peak loads on the structure as stated by Chen and Letchford (2004a,b); Chay and Albermani (2005); Chay et al. (2006); Holmes et al. (2008), and Kwon and Kareem (2009). To address this gap Aboshosha et al. (2015) recently proposed a computational model using the IJ method and employing transient LES turbulence model on various exposure conditions. In their study, a three-dimensional cylindrical domain is used, as illustrated in Figure 3. In this computational model, the jet diameter, Dj, is assumed equal to 1 km to represent a typical size of a downburst as suggested by Holmes et al. (2008). As shown in Figure 3A, the computational domain is chosen to be 8 Dj ×4 Dj for the radial and vertical dimensions, respectively. The model resulted in a wind field that has both a running-mean and a turbulent component. Decomposition of the mean component out of the overall field was conducted through both spatial and temporal averaging. More details about the averaging can be found in Aboshosha et al. (2015).
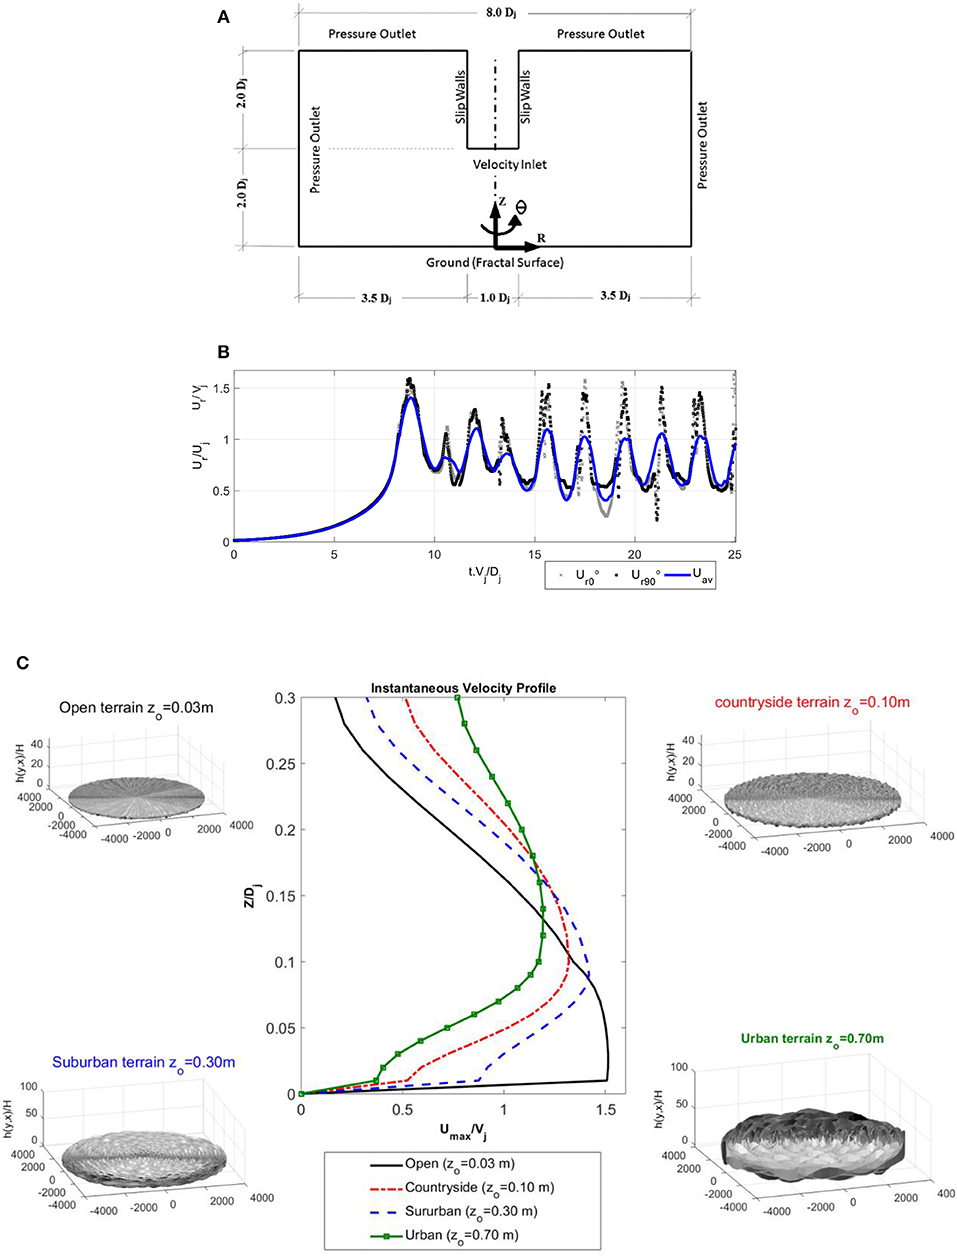
Figure 3. CFD model developed by Aboshosha et al. (2015). (A) Computational Model with sample velocities and their averaging. (B) Sample Decomposition of running-mean wind speed. (C) Profile of maximum radial velocities.
Figure 3B shows sample radial velocities and the resulting velocity in which Ur0 is located at R = 1.25Dj, Z = 0.05Dj and θ = 0° and the velocity Ur90 is located at R = 1.25Dj, Z = 0.05Dj and θ = 90°. Such an averaged velocity Uav depends on the radial distance from the jet center and the vertical elevation (r, Z). Maximum averaged radial velocity profiles Uavmax were identified and plotted against the vertical elevation for the generated four fractal terrain exposures following the study by Aboshosha et al. (2015) as shown in Figure 3C. Those four terrain exposures are based on the Engineering Sciences Data Unit (ESDU) [Engineering Sciences Data Unit (ESDU), 2010].
The figure indicates that maximum radial velocities occurs at lower elevations for smoother terrains than those for rougher terrains. Radial velocities resulting from that computational model will be used in section Technique to Analyze Transmission Line Conductors Under HIW (next section) to evaluate the conductor reaction, and in section GA Optimization Technique to predict the critical downburst configurations (r/Dj and θ) leading to the maximum unbalanced longitudinal and transverse conductor reaction forces.
Technique to Analyze Transmission Line Conductors Under HIW
As previously mentioned, spatially and temporally averaged radial downburst velocities for four terrain exposures adopted from the CFD simulation conducted by Aboshosha et al. (2015) are utilized to evaluate conductor reactions. Studies by Kim and Hangan (2007) and Aboshosha and El Damatty (2014b) indicate that the radial component of the velocity is dominant, while the vertical component is negligible when calculating conductor forces.
Consequently, as indicated in Figure 4, the conductor systems will be subjected to a downburst wind load gy acting in the transverse direction Y in addition to the conductor weight W acting in the vertical direction Z. The intensity of the distributed load, gy(s), is calculated using Equation (1) as a function of the mean wind velocity at a general location s, Uav(s).
Where ρ is the air density which is taken equal to 1.25 kg/m3; Cd is the drag coefficient of the conductor which is taken equal to 1.0, according to the American Society of Civil Engineers guidelines ASCE-74 (ASCE-74, 2010), D is the conductor projected area in the transverse direction per unit length. For a single bundled conductor, D is equal to the conductor diameter.
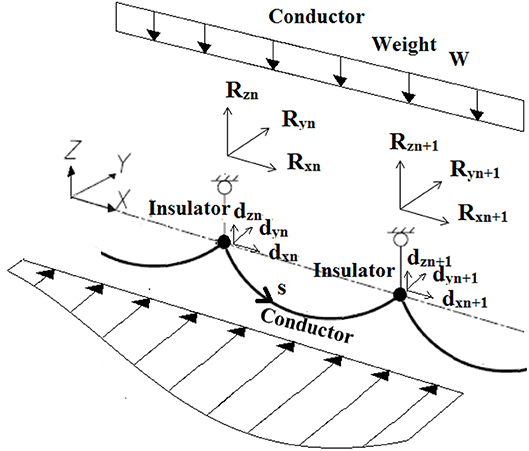
Figure 4. Iterative solving technique. Conductor system and unknown reactions and displacements.
Non-linear static analyses under downburst wind load (gy) and the conductor weight (W) are conducted using the technique developed and validated by Aboshosha and El Damatty (2014b). Aboshosha and El Damatty (2014b) have shown that this technique is 185 times faster than non-linear analyses conducted using the FEM. This is because the technique relies on treating each conductor span as one element and reduces the unknown degrees of freedom by limiting them at the connections between the insulators and the conductors. This technique is used to evaluate the reactions, Rxi, Ryi, and Rzi at the supports and the displacements dxi, dyi, and dzi at the conductor-insulator connecting points as illustrated in Figure 5, (where i is the number of the insulator) and indicated by Equations (2)–(4). Those equations are solved iteratively as indicated in the flow chart in Figure 5.
Where, are vectors of y and z reactions considering no displacements at the connection between the conductors and the insulators (i.e., insulator fixed end forces), and represent the initial conditions considered in the analysis; [Kyz] is the stiffness matrix to account for the p-delta effect; {fx} is the unbalanced load vector in x-direction; [Kx] is the tangential stiffness matrix for x-displacements; the superscript (i) represents the iteration number; {Rres} is the vector of the resultant forces in the insulators, , ν is the insulator length. Considering 6 conductor spans, ; {fx}, {dx}, {dy} and {dz} are 7 ×1 vectors while the square matrices [Kyz] and [Kx] are 7 ×7. The matrices dimensions reflect the seven insulator points supporting the conductor along the six spans. Detailed description of, , [Kyz] and [Kx] can be found in Aboshosha and El Damatty (2014b).
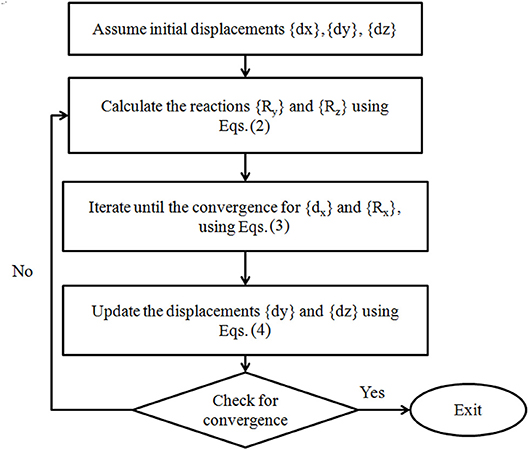
Figure 5. Schematic illustration of the conductor-system by Aboshosha and El Damatty (2014b).
As indicated in the flow chart, initial displacement vectors {dx}, {dy}, and {dz} are assumed and the corresponding reaction vectors {Ry} and {Rz} are calculated using Equations (2). The horizontal displacement and reaction vectors {dx} and {Rx} are calculated by iterating through Equations (3) until no change in the results takes place between two subsequent iterations, i.e., iterations no. i and i+1. This is followed by calculating the displacement vectors {dy} and {dz} using Equation (4), which satisfy insulator equilibrium conditions. The solution is checked for convergence by comparing displacement vectors calculated at time-step i+1 to the displacement vectors obtained at time-step i. If a difference greater than a chosen tolerance is found, the whole procure is repeated as indicated in Figure 5, until convergence is achieved.
GA Optimization Technique
An optimization code utilizing the GA was developed in-house to obtain critical downburst configuration (size Dj and location r, θ defined in Figure 2) that leads to the maximum conductor reactions as described in Equation (5).
The optimization code is integrated with the conductor analysis technique, described in section Technique to Analyze Transmission Line Conductors Under HIW and the CFD data described in section Downburst Wind Field, to allow for evaluating and maximizing the conductor reaction Ri at the intermediate tower of interest as shown in Figure 2. Three types of reaction Ri are included in the optimization (unbalanced longitudinal, transverse, and resultant) for each of the four types of terrain roughness. This leads to 12 different optimization cases, as shown in Table 1.
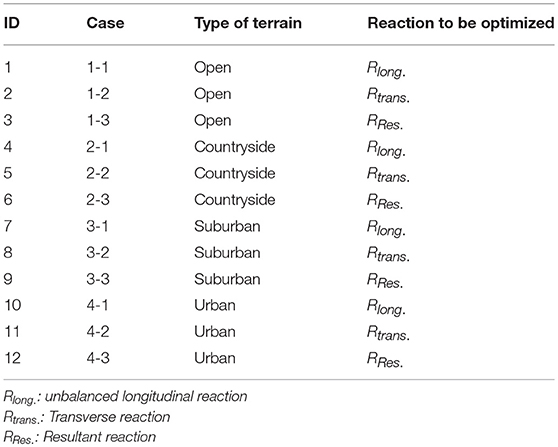
Table 1. Cases considered for optimization.
It is worth mentioning that the jet velocity Vj is not considered an independent variable since it is obvious that the conductors reactions increase with an increase in Vj. Therefore, the jet velocity in this study is set at a constant value of 40 m/s, which produces a maximum radial velocity of approximately 70 m/s compatible with peak recorded speed (Savory et al., 2001; Aboshosha et al., 2015).
Real-coded genetic algorithm is used to explore the search space to identify critical downburst configurations leading to maximum conductor reactions. This optimization technique is considered because of its efficiency in achieving global optimal solution for a continuous-domain. Details about the GA applied in this study are provided in Figure 6, while Figure 7 shows a flow chart summarizing the steps of integrating the GA with the analysis code.
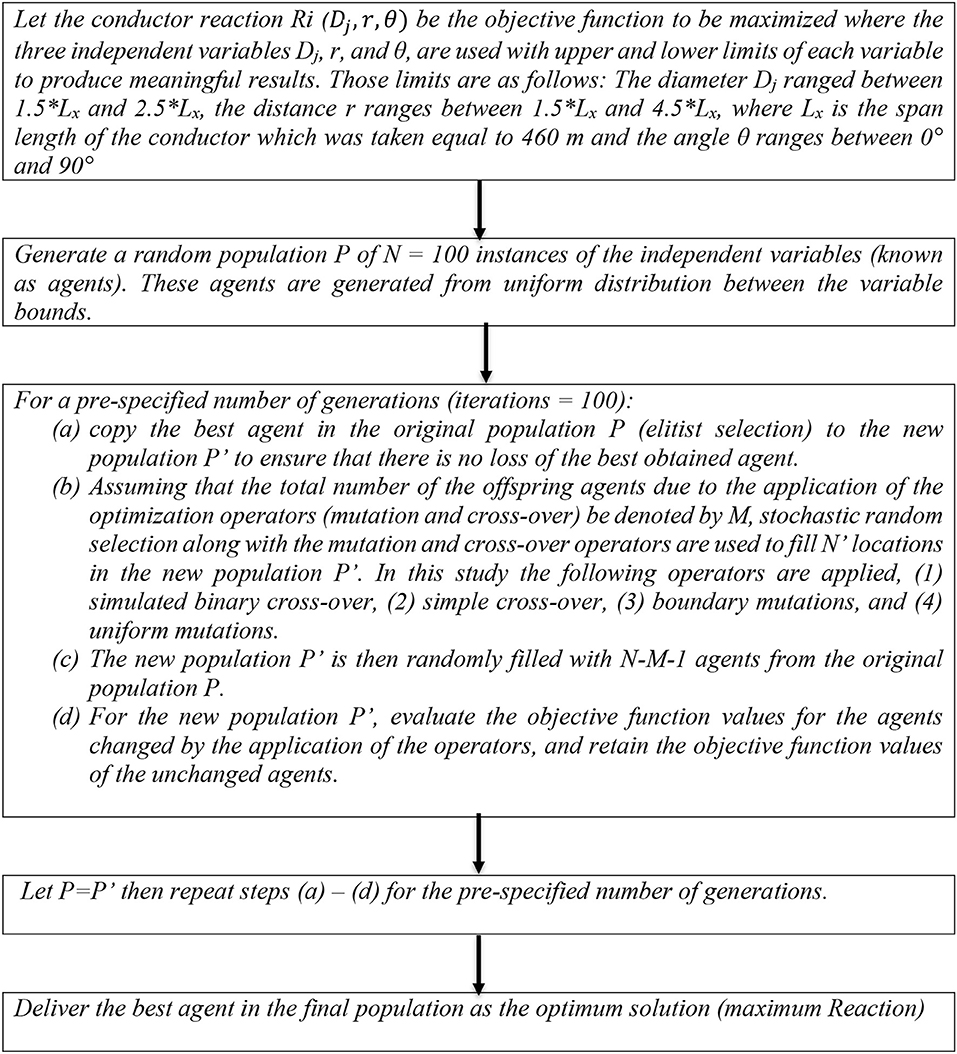
Figure 6. Details of the genetic algorithm.
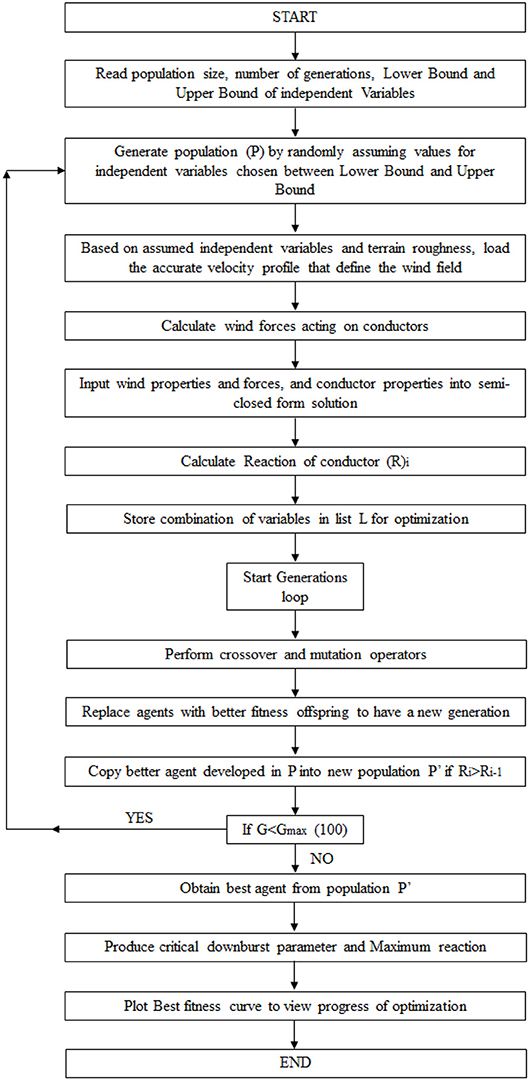
Figure 7. Flowchart describing the steps involved in the GA within the analysis technique.
Results and Discussion
As discussed earlier, the optimization code was utilized to identify critical downburst parameters (Dj and location r, θ) leading to the maximum reactions. The resulting critical downburst parameters that leads to maximum reactions are shown in Table 2.
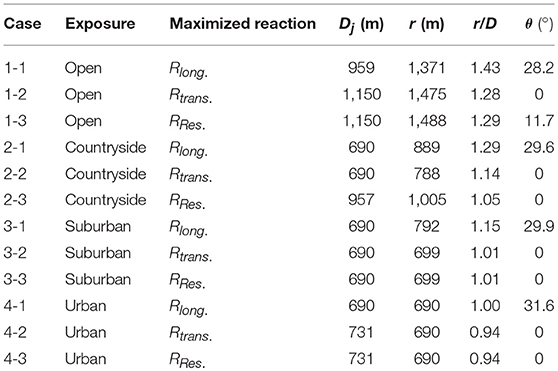
Table 2. Critical Downburst parameters configuration.
The results shown in Table 2 reveal that for calculating the critical angle between the center of the downburst and the center of the tower (θ) when considering the maximum longitudinal reaction (Rx) of the conductor, a critical angle θ in the order of 30° was obtained regardless of the terrain roughness. It can be viewed from Table 2 that the maximum transverse reaction (Ry) of a conductor will occur when the downburst is at an angle θ = 0°. By comparing cases 1-1 and 1-2, 4-1 and 4-2 it can be noticed that the critical diameter of the downburst Dj for the calculation of Rx is usually smaller than the critical Dj that results for the calculation of maximum Ry by 15% when considering the cases of a six-spanned transmission line system in Open and Urban terrains only. Whereas, the critical diameter of the downburst Dj for the calculation of Rx and Ry of the conductors in countryside and suburban terrains is equal to 690 m. This implies that the relation between Dj and Rx and Ry cannot be related to the exposure. Table 2 shows that as the terrain becomes rougher, the r/D (relative location between the center of the downburst and the center of the tower/Diameter of Downburst) value for the calculation of both the Rx and Ry decreases. However, no typical trend can be found for the critical diameter as the terrain roughness increases.
The following section provides a simplified approach which is developed to generalize a set of charts based on the practical situations of downbursts. The approach is developed using the critical downburst configurations obtained from the optimization and listed in Table 2.
Simplified Approach and Numerical Example
The optimization code developed in sections GA Optimization Technique and Results and Discussion is capable of predicting the critical downburst configuration associated with maximum conductor reactions for different types of terrain roughness. However, this technique is computationally expensive. Therefore, a simplified procedure in the form of charts and simple equations is suggested here. It is worth mentioning that Aboshosha and El Damatty (2014b) developed a rapid engineering method to evaluate conductor reaction for any downburst configuration, but the method was limited to open terrain exposure. The current simplified approach focuses on predicting the maximum reactions only for four terrain exposures. This section is divided into three sections, where section Simplified Approach Development shows how the approach is developed, section Practical Example provides a practical example using the developed approach, and section Accuracy of the Simplified Approach illustrates the accuracy of the simplified approach.
Simplified Approach Development
The simplified approach is based on utilizing the general expression given in Equation (6) to predict maximum conductor reaction Rmax, where Lx is the conductor span length, gpymax is the maximum intensity of the downburst wind load and fmax is a factor that depends on the reaction type, terrain exposure and other factors as will be described later.
This maximum intensity gpymax is a function of the maximum mean radial velocity (Vpmax) measured at point p shown in Figure 2 and can be expressed by Equation (7) as a function of the ratio. Such a ratio is obtained from the CFD data and summarized in Table 3.
where the drag coefficient (Cd) is taken as 1, air density (ρ = 1.25 Kg/m3), the diameter of the conductor (D) is assumed as 0.022 m, and the jet velocity (Vj) is 40 m/s. These values are assumed considering real downburst events, and practical conductor and wind-field properties. The gpymax values calculated for each case of terrain roughness are listed in Table 4.
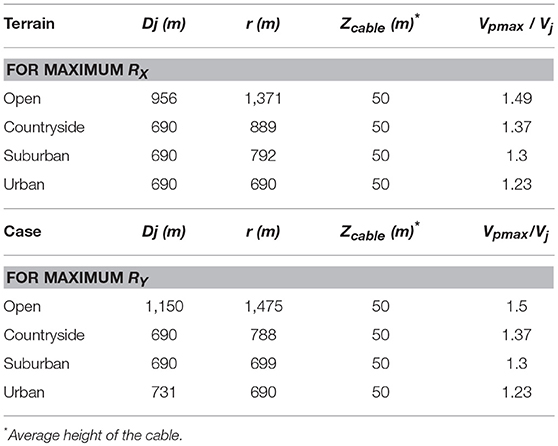
Table 3. Vpmax/Vj ratios.
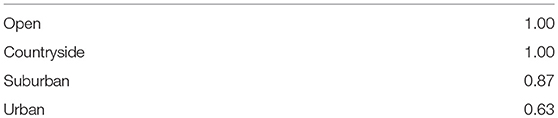
Table 4. fmax value for maximum Ry reaction.
According to Equations (6) and (7), one can evaluate the max reaction under a known value of the jet speed Vj if the fmax factor is known. Such a factor accounts for the various conductor parameters affecting the reaction, which are represented in the following: Sag/Lx, Lx/v and the terrain exposure, where (Sag) is the conductor sag, (Lx) is the conductor span, and (v) is the insulator length. Figure 8 shows values of the fmax variable for the longitudinal reaction Rx.
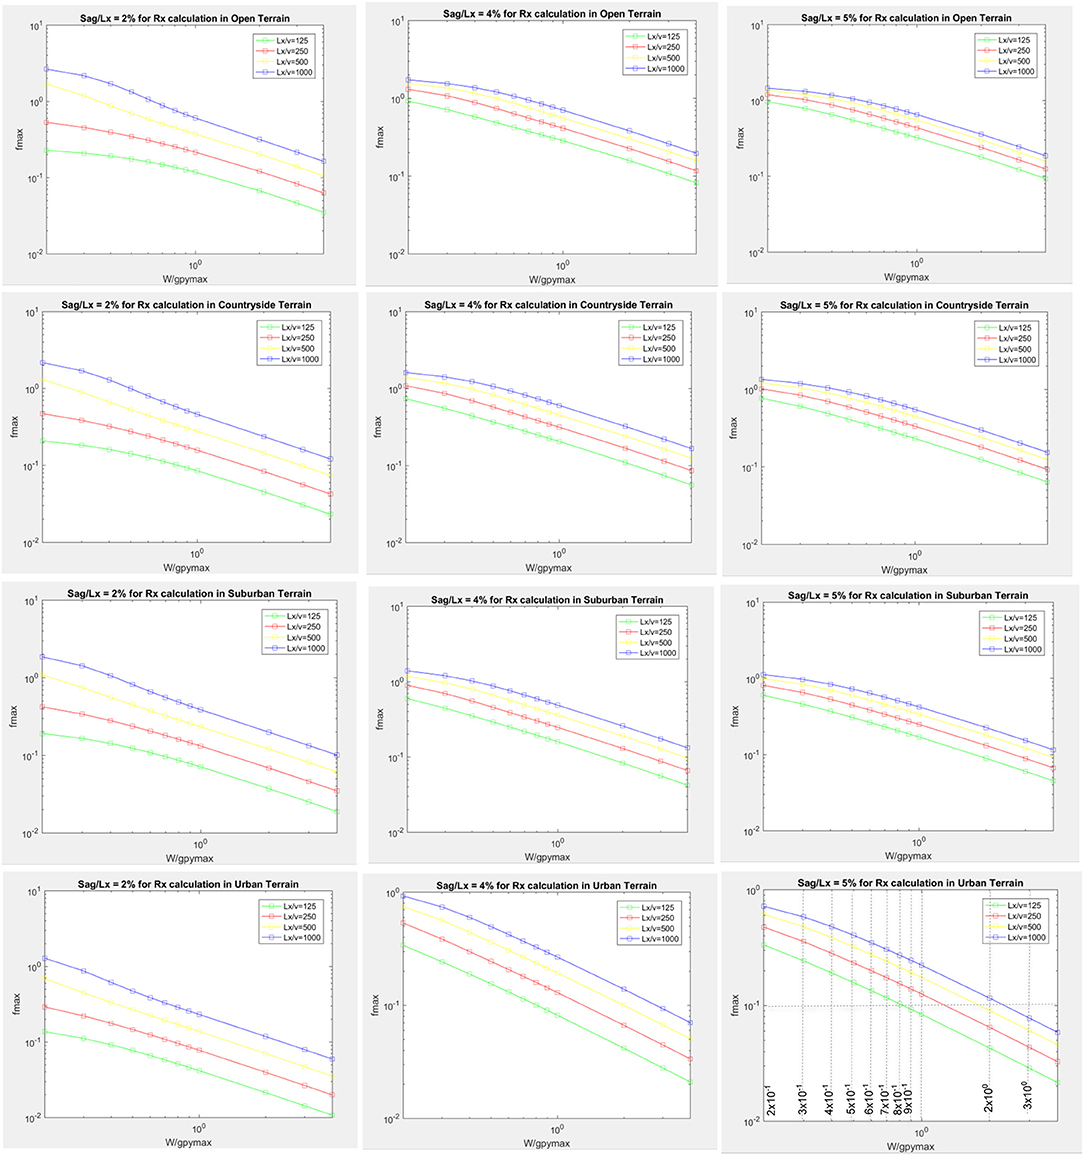
Figure 8. fmax for Rx reaction.
Each row of Figure 8 represents a consistent terrain exposure (e.g., first row is for open terrain), while each column of the subplots represents the same Sag/Lx value (e.g., first column is for sag/Lx = 2%). With respect to the transverse reaction, Ry, it is found that fmax is almost independent of the Sag/Lx and Lx/v parameters as shown in Figure 9 (where fmax varies between 0.988 and 1.002 assuming an Open terrain and sag/Lx of 2%), therefore, it is decided to present fmax for Ry as a function of the terrain exposure only as summarized in Table 4.
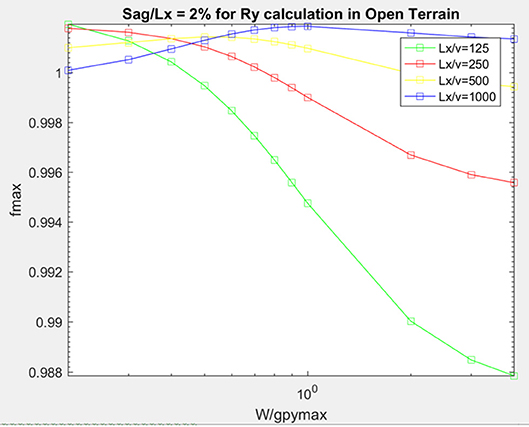
Figure 9. fmax for Ry reaction.
It is worth mentioning that the maximum reactions can be evaluated using the simplified method in Equations (7) and (8) and Figure 8 for Rx or Table 4 for Ry under a given jet velocity Vj or peak velocity Vpmax. A practical example to evaluate maximum reactions for a TL conductor in Southwestern Ontario region is provided in the next subsection.
Practical Example
A TL conductor with a length span Lx of 460 m and properties listed in Table 5 is considered. The conductor is located near Windsor, Ontario, Canada. Analysis of thunderstorm events at southwestern Ontario has been conducted by Aboshosha et al. (2017a,b) and the resulting 50-year peak design speeds are shown in Figure 10.
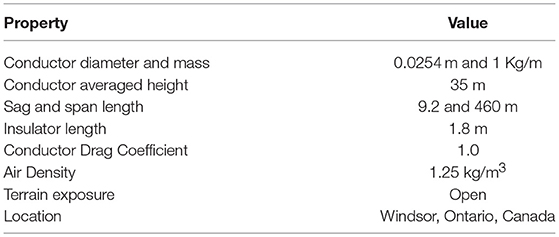
Table 5. Conductor properties.
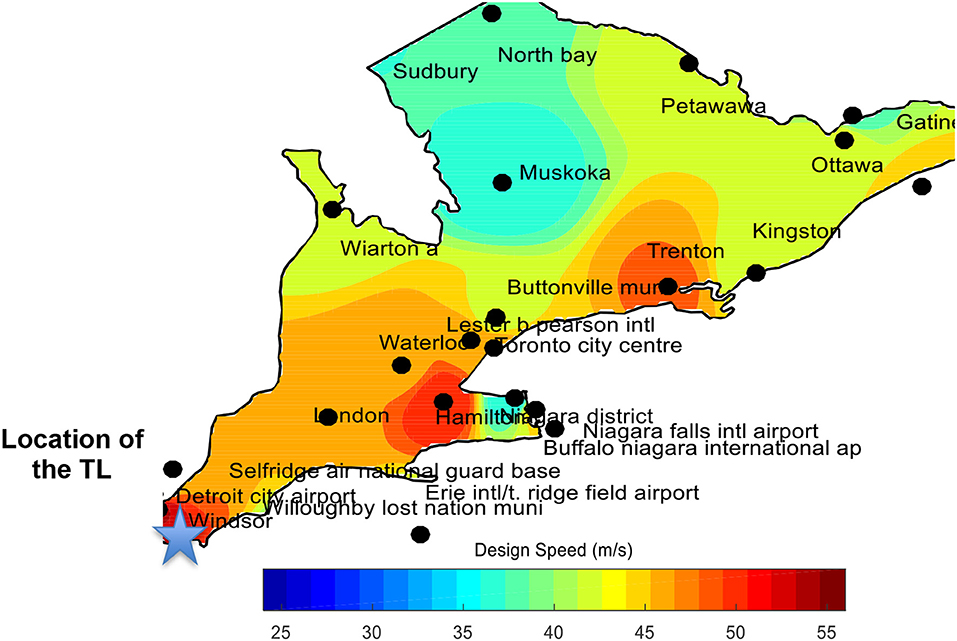
Figure 10. 50-year return period peak thunderstorm wind speed (Aboshosha et al., 2017a,b).
As shown in the figure, peak downburst speed Vpmax at Windsor region is in the order of 55 m/s.
The simplified approach is utilized as follows:
1. - Calculate the weight of the conductor per unit length:
W = m × g = 1 ×9.81 = 9.81 N/m
2. - Knowing peak downburst speed Vpmax = 55 m/s, gpmax is evaluated from Equation (7) as
gpymax = 0.5 ×1.25 ×1 ×0.0254 ×552 = 48.0 N/m
3. - Determine the following parameters:
Sag/Lx = 0.02 = 2%
Lx/v = 250
W/ gpymax = 0.2
4. - Refer to Figure 7 and Table 4 to evaluate fmax for Rx and Ry
fmax = 0.53 for Rx and fmax = 1.00 for Ry
5. - Evaluate maximum reactions using Equation (6)
Rx = Lx × fmax × gpymax = 11,713 N, Ry = Lx × fmax × gpymax = 22,120 N
Accuracy of the Simplified Approach
The accuracy of the proposed simplified approach is assessed by running the percent difference test for the conductor case summarized in Table 5 for the maximum Rx and Ry reactions evaluated using the simplified approach and using the optimization code discussed in section GA Optimization Technique.
The optimization code is employed to find optimum downburst parameters leading to maximum Rx and Ry for the conductor properties listed in Table 5. Table 6 summarizes the resulting optimum downburst parameters as well as the maximum reactions. Table 6 also lists the maximum reactions evaluated using the simplified approach. A minor discrepancy between the maximum reactions (<5%) obtained using the simplified approach and those using the optimization was found.
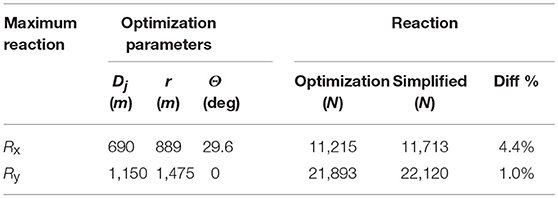
Table 6. Conductor properties.
The simplified approach presented in sections Simplified Approach Development and Practical Example allows practitioner engineers to accurately evaluate maximum conductor reactions under downburst events considering multiple terrain conditions.
Conclusions
An optimization code based on Genetic Algorithm is coupled with an effective conductor analysis technique and CFD data to find downburst parameters leading to maximum TL conductor reactions. Maximum reactions and associated downburst parameters are evaluated for four different terrain exposures. The resulting critical downburst configurations are then utilized to develop a simplified approach to evaluate maximum conductor reactions through a set of equations and charts.
An example considering a practical conductor is provided for illustration of the proposed approach, where maximum conductor reactions are evaluated using both the simplified approach and the detailed optimization technique. A comparison between the results obtained from both approaches is conducted and proved good agreement which confirms the accuracy of the simplified approach proposed in the current study.
This study provides an efficient and simple approach that is suitable for practitioner engineers or for adoption in design codes to accurately and rapidly evaluate maximum conductor reactions under downburst events considering multiple terrain conditions. It should be noted that the simplified approach provided in this study has been validated within the range of parameters shown in Figure 8. Further research is required to extrapolate the simplified approach beyond the defined range.
Author Contributions
AA-I conducted the analysis and developed the first draft under the supervision of AE and HA who structured the main frame and methodology of this research study. MA and TG were responsible for validation and developing figures and tables in the results section. They also contributed in writing the final version of the paper under the supervision of AE and HA.
Conflict of Interest Statement
The authors declare that the research was conducted in the absence of any commercial or financial relationships that could be construed as a potential conflict of interest.
Acknowledgments
The authors would like to thank the generous financial support received from Engineering Research Council of Canada (NSERC). A large number of computations were made in a reasonable time with the help of the Shared Hierarchical Academic Research Computing Network, SHARCNET, and Compute Canada. The authors deeply acknowledge Western University and Ryerson University.
References
Aboshosha, H., Bitsuamlak, G., and El Damatty, A. (2015). Turbulence characterization of downbursts using LES. J. Wind Eng. Industr. Aerodyn. 136, 44–61. doi: 10.1016/j.jweia.2014.10.020
Aboshosha, H., and El Damatty, A. (2012). Capacity of electrical transmission towers under downburst loading,” in The First Australasia and South-East Asia Structural Engineering and Construction Conference (Perth, WA).
Aboshosha, H., and El Damatty, A. (2014a). Span reduction factor of transmission line conductors under downburst winds. J. Wind Eng. 11, 13–22. doi: 10.3850/978-981-07-8012-8_P11
Aboshosha, H., and El Damatty, A. (2014b). Effective Technique to Analyze Transmission Line Conductors under High Intensity Winds. Wind Struct. 18, 235–252. doi: 10.12989/was.2014.18.3.235
Aboshosha, H., Mara, T., and Case, P. (2017a). “New framework for estimating design wind speeds of Thunderstorms,” in 2017 Americas Conference of Wind Engineering ACWE (Gainesville, Fl).
Aboshosha, H., Mara, T., and Case, P. (2017b). “Thunderstorm design wind speeds applicable to transmission lines,” in 2017 Americas Conference of Wind Engineering ACWE (Gainesville, Fl).
Alahyari, A., and Longmire, E. K. (1994). Particle image velocimetry in a variable density flow: application to a dynamically evolving microburst. Exp. Fluids 17, 434–440. doi: 10.1007/BF01877047
Anderson, J. R., Orf, L. G., and Straka, J. M. (1992). A 3-D model system for simulating thunderstorm microburst outflows. Meteorol. Atmos. Phys. 49, 125–131. doi: 10.1007/BF01025404
ASCE-74, American Society of Civil Engineers (ASCE). (2010). Guidelines for Electrical Transmission Line Structural Loading. ASCE Manuals and Reports on Engineering Practice, New York, NY.
Behncke, R. H., and White, H. B. (2006). “Applying gust loading to your lines,” in Proceedings of the 9th International Conference on Overhead Lines (Fort Collins, CO).
Chay, M., and Albermani, F. (2005). “Dynamic response of a SDOF system subjected to simulated downburst wind,” in 6th Asia-Pacific Conference on Wind Engineering (Seoul).
Chay, M. T., Albermani, F., and Wilson, R. (2006). Numerical and analytical simulation of downburst wind loads. Eng. Struct. 28, 240–254. doi: 10.1016/j.engstruct.2005.07.007
Chay, M. T., and Letchford, C. W. (2002). Pressure distributions on a cube in a simulated thunderstorm downburst—Part A: stationary downburst observations. J. Wind Eng. Industr. Aerodyn. 90, 711–732. doi: 10.1016/S0167-6105(02)00158-7
Chen, L., and Letchford, C. W. (2004a). A deterministic–stochastic hybrid model of downbursts and its impact on a cantilevered structure. Eng. Struct. 26, 619–629. doi: 10.1016/j.engstruct.2003.12.009
Chen, L., and Letchford, C. W. (2004b). Parametric study on the along-wind response of the CAARC building to downbursts in the time domain. J. Eng. Industr. Aerodyn. 92, 703–724. doi: 10.1016/j.jweia.2004.03.001
Dempsey, D., and White, H. B. (1996). Winds Wreak Havoc on Lines: The cause of most transmission structure outages in many areas of the world is high-intensity wind. Trans. Distrib. World 48, 32–42.
El Ansary, A. M., El Damatty, A. A., and Nassef, A. O. (2010). A coupled finite element genetic algorithm technique for optimum design of steel conical tanks. Thin Walled Struct. 48, 260–273. doi: 10.1016/j.tws.2009.10.004
El Ansary, A. M., El Damatty, A. A., and Nassef, A. O. (2011a). A coupled finite element genetic algorithm for optimum design of stiffened liquid-filled steel conical tanks. Thin-Walled Struct. 49, 482–493. doi: 10.1016/j.tws.2010.12.006
El Ansary, A. M., El Damatty, A. A., and Nassef, A. O. (2011b). Optimum shape and design of cooling towers. World Acad. Sci. Eng. Technol. 5, 12–21.
Elawady, A., Aboshosha, H., and El Damatty, A. (2018). Aero-elastic response of transmission line system subjected to downburst wind: validation of numerical model using experimental data. Wind Struct. 27, 71–88.
Elawady, A., Aboshosha, H., El Damatty, A., Bitsuamlak, G., Hangan, H., and Elatar, A. (2017). Aero-elastic testing of multi-spanned transmission line subjected to downbursts. J. Wind Eng. Industr. Aerodyn. 169, 194–216. doi: 10.1016/j.jweia.2017.07.010
Elshaer, A., Bitsuamlak, G., and El Damatty, A. (2015). “Aerodynamic shape optimization for corners of tall buildings using CFD,” in 14th International Conference on Wind Engineering (ICWE) (Porto Alegre).
Engineering Sciences Data Unit (ESDU) (2010). “Characteristics of Atmospheric Turbulence Near The Ground, Part I: definitions and general information,” in Engineering Sciences Data Unit (ESDU) (London).
Hadziabdic, M. (2006). LES, RANS and combined simulation of impinging flows and heat transfer (Doctoral dissertation). TU Delft, Delft University of Technology, Delft, Netherlands.
Holmes, J. D., Hangan, H. M., Schroeder, J. L., Letchford, C. W., and Orwig, K. D. (2008). A forensic study of the Lubbock-Reese downdraft of 2002. Wind Struct. 11, 137–152. doi: 10.12989/was.2008.11.2.137
Kim, J., and Hangan, H. (2007). Numerical simulations of impinging jets with application to downbursts. J. Wind Eng. Industr. Aerodyn. 95, 279–298. doi: 10.1016/j.jweia.2006.07.002
Kwon, D. K., and Kareem, A. (2009). Gust-front factor: new framework for wind load effects on structures. J. Struct. Eng. 135, 717–732. doi: 10.1061/(ASCE)0733-9445(2009)135:6(717)
Li, C. Q. (2000). A stochastic model of severe thunderstorms for transmission line design. Prob. Eng. Mech. 15, 359–364. doi: 10.1016/S0266-8920(99)00037-5
Lundgren, T. S., Yao, J., and Mansour, N. N. (1992). Microburst modelling and scaling. J. Fluid Mech. 239, 461–488. doi: 10.1017/S002211209200449X
Mason, M. S., Fletcher, D. F., and Wood, G. S. (2010). Numerical simulation of idealised three-dimensional downburst wind fields. Eng. Struct. 32, 3558–3570. doi: 10.1016/j.engstruct.2010.07.024
Mason, M. S., Wood, G. S., and Fletcher, D. F. (2009). Numerical simulation of downburst winds. J. Wind Eng. Industr. Aerodyn. 97, 523–539. doi: 10.1016/j.jweia.2009.07.010
McCarthy, P., and Melsness, M. (1996). Severe Weather Elements Associated with September 5, 1996 Hydro Tower Failures Near Grosse Isle. Manitoba, Manitoba Environmental Service Centre, Environment Canada.
Orf, L., Kantor, E., and Savory, E. (2012). Simulation of a downburst-producing thunderstorm using a very high-resolution three-dimensional cloud model. J. Wind Eng. Indust. Aerodyn. 104, 547–557. doi: 10.1016/j.jweia.2012.02.020
Oseguera, R. M., and Bowles, R. L. (1988). A Simple, Analytic 3-Dimensional Downburst Model Based on Boundary Layer Stagnation Flow. Hampton, VA.
Savory, E., Parke, G. A. R., Zeinoddini, M., Toy, N., and Disney, P. (2001). Modelling of tornado and microburst-induced wind loading and failure of a lattice transmission tower. Eng. Struct. 23, 365–375. doi: 10.1016/S0141-0296(00)00045-6
Sengupta, A., and Sarkar, P. P. (2008). Experimental measurement and numerical simulation of an impinging jet with application to thunderstorm microburst winds. J. Wind Eng. Indus. Aerodyn. 96, 345–365. doi: 10.1016/j.jweia.2007.09.001
Shehata, A. Y., and El Damatty, A. A. (2007). Behaviour of guyed transmission line structures under downburst wind loading. Wind Struct. Int. J. 10, 249–268. doi: 10.12989/was.2007.10.3.249
Shehata, A. Y., El Damatty, A. A., and Savory, E. (2005). Finite element modeling of transmission line under downburst wind loading. Finite Elements Anal. Des. 42, 71–89. doi: 10.1016/j.finel.2005.05.005
Shehata, A. Y., Nassef, A. O., and El Damatty, A. A. (2008). A coupled finite element-optimization technique to determine critical microburst parameters for transmission towers. Finite Elements Anal. Des. 45, 1–12. doi: 10.1016/j.finel.2008.07.008
Vermeire, B. C., Orf, L. G., and Savory, E. (2011a). A parametric study of downburst line near-surface outflows. J. Wind Eng. Indust. Aerodyn. 99, 226–238. doi: 10.1016/j.jweia.2011.01.019
Vermeire, B. C., Orf, L. G., and Savory, E. (2011b). Improved modelling of downburst outflows for wind engineering applications using a cooling source approach. J. Wind Eng. Indust. Aerodyn. 99, 801–814. doi: 10.1016/j.jweia.2011.03.003
Winkelman, P. F. (1959). Sag-tension computations and field measurements of Bonneville power administration. Trans. Am. Inst. Electr. Eng. 78, 1532–1547. doi: 10.1109/AIEEPAS.1959.4500595
Wood, G. S., Kwok, K. C., Motteram, N. A., and Fletcher, D. F. (2001). Physical and numerical modelling of thunderstorm downbursts. J. Wind Eng. Indust. Aerodyn. 89, 535–552. doi: 10.1016/S0167-6105(00)00090-8
Yao, J., and Lundgren, T. S. (1996). Experimental investigation of microbursts. Exp. Fluids 21, 17–25. doi: 10.1007/BF00204631
Keywords: downburst, high intensity wind, transmission line conductors, terrain roughness, optimization, genetic algorithms
Citation: Al-Issa A, El Ansary AM, Aboshosha H, Aboutabikh M and Ghazal T (2019) Evaluation of Peak Transmission Line Conductor Reactions Under Downburst Winds Using Optimization and Simplified Approaches. Front. Built Environ. 5:88. doi: 10.3389/fbuil.2019.00088
Received: 20 September 2018; Accepted: 18 June 2019;
Published: 02 July 2019.
Edited by:
Matthew Mason, University of Queensland, AustraliaReviewed by:
Mohammadtaghi Moravej, Extreme Events Institute, Florida International University, United StatesFaris Albermani, Central Queensland University, Australia
Copyright © 2019 Al-Issa, El Ansary, Aboshosha, Aboutabikh and Ghazal. This is an open-access article distributed under the terms of the Creative Commons Attribution License (CC BY). The use, distribution or reproduction in other forums is permitted, provided the original author(s) and the copyright owner(s) are credited and that the original publication in this journal is cited, in accordance with accepted academic practice. No use, distribution or reproduction is permitted which does not comply with these terms.
*Correspondence: Ayman M. El Ansary, YWVsYW5zYUB1d28uY2E=