 Vahid Shahsavari
 Maryam Mashayekhi
 Milad Mehrkash
 Erin Santini-Bell
- Department of Civil and Environmental Engineering, University of New Hampshire, Durham, NH, United States
A practical long term structural health monitoring program must be based on reasonable field capabilities, the needs of the bridge owner, and the anticipated structural behavior unique to the structure. Each sensor installed as part of the monitoring program should provide information directly in response to operational needs related to the structure's short term and long term performance. A thoughtfully considered instrumentation plan developed in cooperation with the bridge designer, bridge manager, bridge maintenance operator and academic researchers will provide data to enhance both the state of the practice and state of the art for the bridge structural design, management and maintenance. Monitoring a bridge's structural response has the potential to (a) detect the presence of structural changes for condition assessment, (b) inform the bridge manger to assist in daily operational decision-making and (c) validate the structural design assumptions and (d) refine a structural model of the bridge to be used for performance prediction. The excitation for these responses typically comes from traffic or environmental demands. Vertical lift bridges provide a unique opportunity for structural health monitoring based on the dynamic response due to the frequent and repeated impact imparted on the structure each time the lift span opens and closes. In this paper, a structural health monitoring system designed to provide valuable information for design verification, structural model calibration, fatigue monitoring, and operational decision-making support for the reconstructed Memorial Bridge carrying US Route 1 between Portsmouth, New Hampshire and Kittery, Maine. This paper will detail the development of the sensor layout including input from stakeholders, accessibility issues and complementary and contradicting objectives. A set of structural models with varying degrees on complexity were created based on the structural performance objectives. The data collected during a pseudo-static truck load test was used to calibrate the structural models of the bridge and to select the appropriate model for each post-processing and decision-making tools related to structural performance.
Introduction
Restoring and improving the urban infrastructure of the United States is one of the National Academy of Engineering Grand Challenges highlighting the need for data-driven, effective and efficient bridge management (NAE, 2017). Critical components of the US transportation infrastructure are bridge structures, which elevates the importance of the design and maintenance of bridge structures for bridge designers, owners and the general public. According to a 2015 accounting of the United States' bridges, 144,621 of the nation's 608,445 bridges (23.8%) are considered structurally deficient or functionally obsolete by the Federal Highway Association (Ingraham, 2015). As these bridges are repaired and replaced, engineers look to incorporate innovation to increase the service life of the structure (AASHTO, 2008). The idea of continuously monitoring these structures, which results in more efficient maintenance and inspections management, is not feasible for every bridge. However, signature bridges that push the design envelope and are operationally critical to an infrastructure network are ideal candidates for structural health monitoring. This selective application of sensors can contribute to the goal of managing an aging bridge inventory with high maintenance and replacement costs. Structural Health Monitoring (SHM) systems, which have recently expanded in application with respect to infrastructure management, include not only sensors but controlled non-destructive load tests and post-processing algorithms for condition assessment and decision-making framework for short term and long term operational resource allocation.
Within the nation's bridge inventory, movable bridges play an integral role in modern transportation infrastructure systems. As means of passage for both vehicular and naval traffic at a single location, their reliable performance is a matter of concern since they must work in harmony to minimize the down time both for vessel and vehicle traffic. For instance, the maintenance of movable bridges like vertical lift bridges is of high importance given the frequency of lift operation to allow for marine traffic. However, with the hundreds of movable bridges in the US, which are typically located in coastal environments that are typically highly susceptible to extreme weather events, there are few long term monitoring programs for these bridges subjected to vertical operations in addition to traffic and environmental loads (Catbas et al., 2014).
Literature Survey
The importance of structural health monitoring to detect structural damage in a global sense has been demonstrated in recent works (Doebling et al., 1998). In the context of civil SHM, the term structural damage often refers to any deficiency presented in the structural system during the design or construction as well as any deterioration during the lifetime of the structure (Yao, 1985). SHM and control systems cover a broad range of techniques to effectively monitor the behavior of structures and provide in-service information with respect to their actual conditions. Various techniques ranging from statistical approaches (Shahsavari et al., 2017a,b) and machine learning algorithms (Vafaei et al., 2018) to system identification methods including both time-domain and frequency-domain techniques (García-Palencia and Santini-Bell, 2014; Shahsavari et al., 2018a,b) can be a means to derive meaningful structural performance information from the collected data. As bridges age and deteriorate over time, the idea of proactively monitoring their behavior and the ability to predict the impact of structural changes on the structural performance is becoming a leading area of research to increase the service life of the structure. In recent years, with an ever-increasing number of instrumented bridges, there is strong and growing interest among engineers, researchers, and bridge owners to ensure efficient resource allocation via a cost-effective and optimized instrumentation strategy for which the SHM sensors are mainly dedicated to capturing the response of critical members. The more sensors spatially dispersed throughout the structure, the more meaningful the information collected from the bridge, which can ultimately lead to a more reliable structural condition assessment. The complex mechanism of damage within the structural components as well as the uncertainties associated with the structural behavior at different locations are factors that impose challenges to confidently determine the condition and impact of members that are critical to maintaining the bridge performance. Hence, in operationally critical bridges having a sophisticated design and geometry, such as movable bridges, the main difficulty in sketching the preliminary concepts of the instrumentation plan is the identification of the members whose damage would considerably affect the load carrying capacity of the bridge.
Since the structural performance and load carrying capacity of bridges would be altered due to likely damage scenarios imposed on critical components, the ability to confidently predict the remaining service life and load rating reduction is one of the major concerns for bridge engineers. Structural model calibration is a well-documented tool that can be used for structural condition assessment and performance prediction (Cardini and DeWolfe, 2009; Santini-Bell et al., 2013). A global structural model of the bridge system will aid in both the design of the instrumentation plan, as well as serve as a tool for performance assessment, and prediction of the structural behavior once the model is calibrated using the collected structural response data. As steel bridges are subjected to cyclic (fatigue) loading, mainly due to high traffic volumes, a verification of bridge structural components becomes crucial in terms of fatigue life. Fatigue damage in steel bridges is a local phenomenon which can progress continuously and threaten the healthy performance of the structure. Fatigue cracks may initiate at the vicinity of the possible defects, material degradations and the concentrated high-stressed areas which can progressively propagate leading to failure of the component.
Fatigue is often a decisive degradation phenomenon for steel bridges that, at the same time, is afflicted with large uncertainties on the resistance side as well as on the action effect side (Leander et al., 2018). An efficient SHM program can provide valuable information regarding the actual performance and live-load induced stresses at the critical instrumented areas of the structure. However, development of stress range spectra for the evaluation of fatigue life of structural details in bridges is a challenging task as they are strongly site-specific depending upon various factors such as vehicle types, the range of vehicle speeds, road roughness conditions, ambient environment and bridge type (Laman and Nowak, 1996). While field measurements can be used to account for some of these uncertainties, in situ monitoring of all the fatigue-prone regions of a bridge is not feasible in practice (Kwad et al., 2017). Nevertheless, fatigue life prediction of bridges has been accomplished by a number of researchers through field measurements and experimental testing. García et al. (2018) performed a fatigue analysis study on experimental specimens obtained with the same steel grades as those used in a welded joints of a suspension bridge and with the same welding procedures as those practiced in the structure. Mohammadi et al. (1998) reported an application of field measurements for fatigue evaluation of highway bridges. Kashefi et al. (2010) presented the procedures used for assessment of remaining fatigue life of an aging steel deck bridge using strain field measurements carried out on critical fatigue details as well as laboratory tests on limited samples. Liu et al. (2017) performed a fatigue life evaluation for critical connections of a suspension bridge under the passing fatigue truck load. Leander et al. (2018) presented a case study of a steel railway bridge subjected to fatigue deterioration with an overall aim to support rational decisions on how to evaluate and procure different assessment actions to improve the accuracy of the predicted service life of existing bridges. Aygül et al. (2013) discussed the accuracy and benefits of different fatigue failure assessment methods for commonly welded details in steel bridges to conclude how well each method describes the fatigue strength of each welded detail. The authors performed statistical investigations on the results of finite element analyses obtained from solid element based finite element models for welded bridge details and the fatigue test data collected from the literature. The present case study reviews the results of a comprehensive research comparing the applicability of the nominal stress and hot-spot stress methods for fatigue assessment of a bridge connection. While the nominal stress approach is a non-local fatigue assessment method the hot-spot stress method considers a fictitious stress at a fatigue-critical point, the so-called hot-spot point, where the stress is considered representative of the component.
Besides fatigue, bridges are also subjected to other types of damage such as corrosion, vehicular collision, vessel impact, fire, etc. Therefore, the ability to confidently evaluate the decreased load carrying capacity of the damaged bridge with respect to its performance is essential for effective and efficient bridge management. The Hercílio Luz Bridge (HLB), which is an eye-bar chain suspension bridge located between the Santa Catarina Island and the mainland of Brazil, was completely closed to traffic in 1991 due to high corrosion levels and deterioration of its critical members (Carvalho et al., 2017). Truck accident is the third leading cause of bridge failure or collapse in the United States. Although current AASHTO guide specifications recommend static load to improve the impact resistance of bridge piers against truck impacts, recent investigations have revealed that the dynamic loads due to truck impacts may be significantly higher than that prescribed by AASHTO (Agrawal et al., 2013). The collapse of the I-5 Skagit River Bridge, located in Washington, is one of the most recent bridge collapse disasters due to collision of an over-height truck to the over-head braces of the through-truss bridge on May 23, 2013. This incident caused a 49-m (160-ft) simple-span section of the 339-m (1,112-ft) bridge collapsing into the river while, at the same time, two passenger vehicles fell into the river (Stark et al., 2016). Among bridges, the movable bridges are highly susceptible to impact damage by marine vessels for which even minor impact on the substructure or superstructure can disrupt the bridge operations causing the closure of the bridge until repairs are made. In 2013, a 144 m (473 ft) cargo ship broke loose from its moorings and impacted the south span of the Sarah Mildred Long Bridge in New Hampshire, thereby causing damage to a diagonal member, a vertical member, and the lower chord of the bridge. As a result of this incident and because of unclear understanding of the bridge structural response under operating conditions, the bridge owners shut down the bridge to all traffic for 6 weeks while the damaged members were repaired (Fu et al., 2015).
Post-event evaluation of bridge condition and through understanding its capacity is a critical component in any bridge management and maintenance system. Although the requirements of the Guide Specifications for vessel-collision of highway bridges were developed to give designers specific guidelines in protecting these structures (Knott and Damgaard, 1990), there is lack of effective warning systems to support the development of real-time operational decision-making protocols in the event of an impact damage. Long term SHM data can be integrated into a bridge management protocol to better assess the actual condition of the bridge and improve the level of service that bridge owners can provide to the traveling public. In recent years, considerable efforts have been made to explore the features that represent the highest sensitivity to structural deficiency in bridges and that can be used as a prime candidate for real-time assessment of the system response (Santini-Bell et al., 2013). The implementation of an effective pattern recognition algorithm such as the X-bar control chart analysis into the wavelet packets extracted from post-processing of the SHM data has been found promising to reliably distinguish between two different states (damaged, undamaged) of the structure. The wavelet packet transform (WPT) is indeed a robust signal processing tool that has been recently favored over traditional methods to extract more detailed information from vibration data. To extend the application of wavelets for damage assessment of bridge structures, Sun and Chang (2002) used the wavelet packet component energies obtained from a three-span continuous bridge as inputs into neural networks. Shahsavari et al. (2018a) reported a combined application of the WPT and statistical control chart analysis to quantify the change in a bridge system response based on the average normalized energy stored in the wavelet packets. This case study presents an operational decision-making criterion based on the procedure of Shahsavari et al. (2018a) to enhance the discrimination of wavelet features between two different states of a bridge. The wavelet indices extracted from a calibrated model of an instrumented bridge are used to study the applicability of the proposed approach to damage detection problem studies under progressive damage scenarios.
A series of controlled load tests (pseudo-static and dynamic) are conducted to calibrate the analytical models used for fatigue performance prediction, load rating degradation, and real-time condition assessment for decision support described in Chapter 6. Diagnostic load tests are generally performed to compare the resulting structural response of a bridge with its analytical models, estimate the load carrying capacity of an in-service bridge and/or determine the safety and serviceability of a newly built bridge before putting into service (Sanayei et al., 1997; Olaszek et al., 2014). This paper highlights the advantage of structural health monitoring, diagnostic testing and structural modeling to provide three means of using the collected structural response information into a decision-making approach related to bridge management. The efficiency of the proposed case study is defined via a cost-effective strategy integrating the collected field data from structural health monitoring with current engineering practices, according to the AASHTO Manual for Bridge Evaluation provisions, and model-predicted structural response information to meet the paper objectives for “local” and “global” performance-based assessment of an in-service bridge. A method for fatigue assessment and load rating reduction prediction will directly use the field responses as well as the bridge predicted response from a calibrated structural model, while a real-time condition assessment using wavelet packets is presented that only requires the use of the collected structural responses. A long term SHM program is developed based on a short term monitoring program to design an efficient and cost-effective layout for collection of data at locations where the bridge components are highly susceptible to fatigue, impact damage and excessive dynamic movements.
Case Study: Memorial Bridge
Memorial Bridge carries US Route 1 across the Piscataqua River connecting Portsmouth, NH with Kittery, ME. The bridge is also the only pedestrian link between the two communities, who value this bridge as much for its function as a transportation link as for its beauty and the access to the water views. The original Memorial Bridge, constructed in 1923, was a through truss vertical lift bridge. The bridge was closed to vehicular traffic in 2012 due to structural concerns. The new Memorial Bridge, partially funded by the Transportation Investment Generating Economic Recovery (TIGER) program at the Federal Highway Administration (FHWA), was opened to traffic in July 2013. The new Memorial Bridge includes an innovative “gusset-less” truss connection and a metalized corrosion protective coating (see Figure 1). The gusset-less truss connection is unique to this bridge and is the only connection of its kind in a vehicular bridge, which makes the verification of the design procedure vital for future applications of this connection type (Nash, 2016). This paper will detail the development of the instrumentation layout to support a long term structural health monitoring program with short term applications. The planning process to create the long term monitoring program includes structural modeling and data analysis as well as the preliminary model and short term data collections that were used to assist in designing the monitoring system.
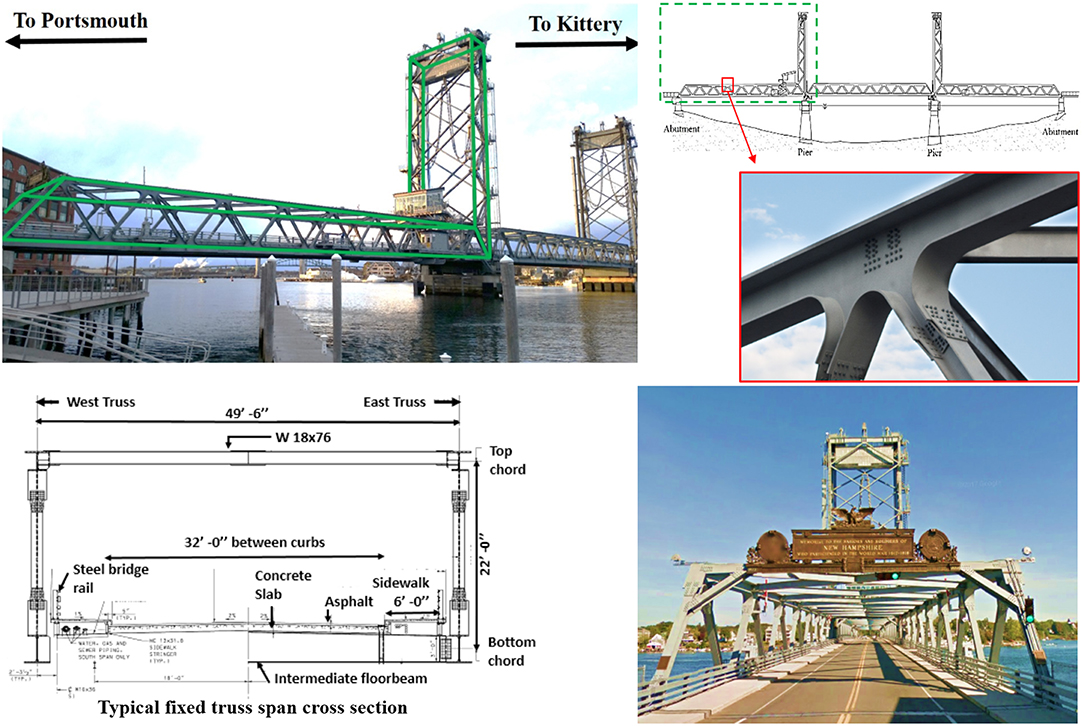
Figure 1. The new Memorial Bridge connecting Portsmouth, NH to Kittery ME, highlighting the bridge gusset-less truss connection and the fixed truss span cross-section.
For this case study, the instrumentation plan is focused only on the Portsmouth-side span with a 297 ft length as well as the Portsmouth-side vertical lift tower with a 158 feet height. The truss elements consist of W14 section diagonals ranging in size from a W14x90 to a W14x211 depending on location along the span and built-up chord elements with an integral knuckle connection. The chord elements are constructed with 1-inch and 1-1/4-inch thick web plates. The top chord web plates are 24 inches tall and the bottom chord web plates are 36 inches tall. The flange plates range in thickness from 1–1/4-inch to 2–3/4 inches and are 26 inches to 36 inches wide. The web-flange connection is a 5/8-inch (1.6 cm) weld (Adams et al., 2017).
Design of Structural Health Monitoring System
In order to make an efficient and cost-effective plan for structural health monitoring, several components must be considered. The main goals for monitoring, the type of the structure, the region and its environmental condition, the volume and type of traffic, as well as the bridge owners' particular demands are key factors for successful strategic planning. Likewise, the accessibility for installation and maintenance of the sensor networks as well as the power and communication infrastructure available at the bridge can significantly increase the cost of a monitoring plan if they are not included in the design process. These factors should be considered during the SHM design process, especially for post-construction sensor installation.
In this case study, the proposed monitoring program was designed based on short term and long term design strategies to effectively capture the structural response at critical locations that are prone to fatigue, impact damage based on bridge operation and significant dynamic movements. These objectives were developed through collaboration with the bridge owners and the bridge designer. The short term approach mainly aimed to provide bridge operators with information related to environmental conditions, specifically wind speed, and their impact on the vertical lift operation. The long term goals for this SHM system are (1) monitoring the dynamic performance of both the horizontal span and the lift tower of the instrumented portion of the Memorial Bridge (see Figure 1), (2) the strain distribution through the gusset-less connection for design verification and fatigue performance assessment, including the fracture-critical radiused weld connecting the web and flange on the bottom chord and (3) monitoring of the impact of corrosion overtime on load-carrying capacity given the harsh coastal environment and that the structural deficiency due to material loss caused the closure of the original Memorial Bridge in 2012 (Mashayekhi et al., 2018).
The long term monitoring program was focused to approximate an optimum number of different types of sensors at sparse locations through which the actual performance of the bridge can be evaluated. In addition, the limited access for sensor installation and maintenance as well as the electrical conduit configuration and communications capabilities were other factors considered during the development of a cost-effective and efficient monitoring program. The complexity of the structural elements particularly the gusset-less connections of the Memorial Bridge necessitates a detailed Finite Element (FE) model, which requires a significant resource investment for creation and analysis. Therefore, prior to embarking on a lengthy multi-purpose modeling program, a preliminary analysis was performed by creating a three-dimensional wire-frame structural model of the Portsmouth-side horizontal span and lift tower in SAP2000® (see Figure 2). The model was created to get an overview of the behavior of the bridge and verify the modeling procedures through comparison with collected acceleration data from short term initial monitoring. It should be noted that the monitoring program includes the Portsmouth-side of the bridge; therefore, only the Portsmouth-side of the bridge is included in this work. Given the output obtained from the structural modeling in SAP2000®, three areas were determined over the bridge as temporary locations for sensor installation and short term response collection. These areas are marked in Figure 3.
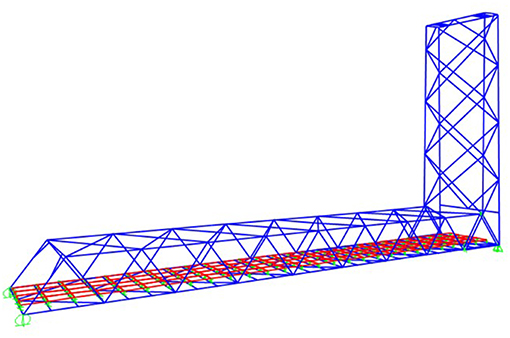
Figure 2. Structural model of the south span of the Memorial Bridge in SAP2000®.
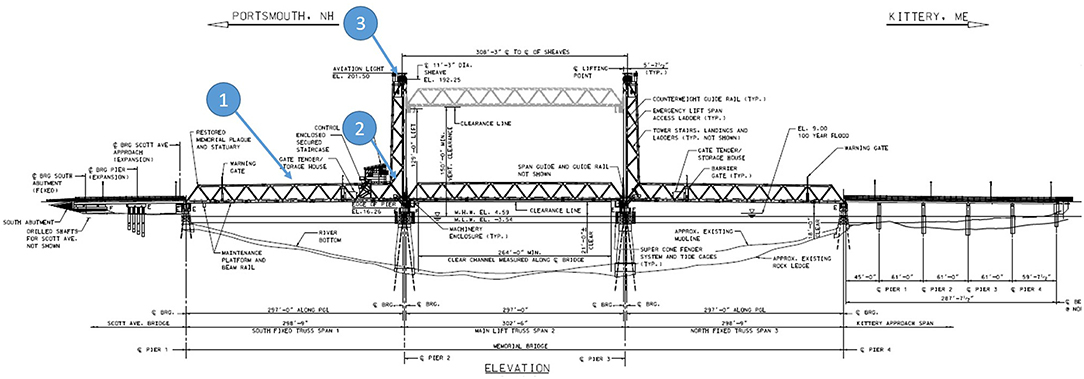
Figure 3. Sensor's location areas for the short term monitoring program.
Preliminary Short Term Monitoring
Prior to the long term monitoring program design, it is beneficial to get an overview of the bridge's behavior thorough some short term monitoring. With these goals in mind, accelerometers and strains transducers were temporarily deployed at three strategic locations during six short term SHM sensor deployments (4–6 h each) and data collections in 2015 (Adams et al., 2017). The sensors for this monitoring were clamped in place in three areas of the bridge, the south span at midspan (Area 1), the base of the south tower (Area 2), and the top of the south tower (Area 3), as shown in Figure 3. The sensors used at Area 1 included uniaxial strain gages on the top chord and diagonals as well as uniaxial accelerometers on the top chord and deck. Uniaxial strain gages were used at Area 2 to capture the maximum strains in the tower trusses during lift events and truck passages. Uniaxial and triaxial accelerometers were placed in Area 3 to measure the vibration of the top of the tower during lift events and truck passages.
While Figure 4A shows the data from the strain response (blue line) and the acceleration response (red line) from Area 1 due to a truck crossing the bridge, the time-history shown in Figure 4B corresponds to the acceleration response collected at Area 1 during a vertical lift of the center span. This data clearly shows the traffic stopping when the gates close for the lift, the lifting operation, the span in the up position, the lowering operation and the impact of the lift span as it locks in place. The vertical lift operation provides a consistent excitation for dynamic data collection. The correlation between the traffic monitoring image and the structural response data was instrumental in discussion with the bridge owners as it clearly demonstrated the ability of the sensors to clearly capture the difference in response between a truck and car passage.
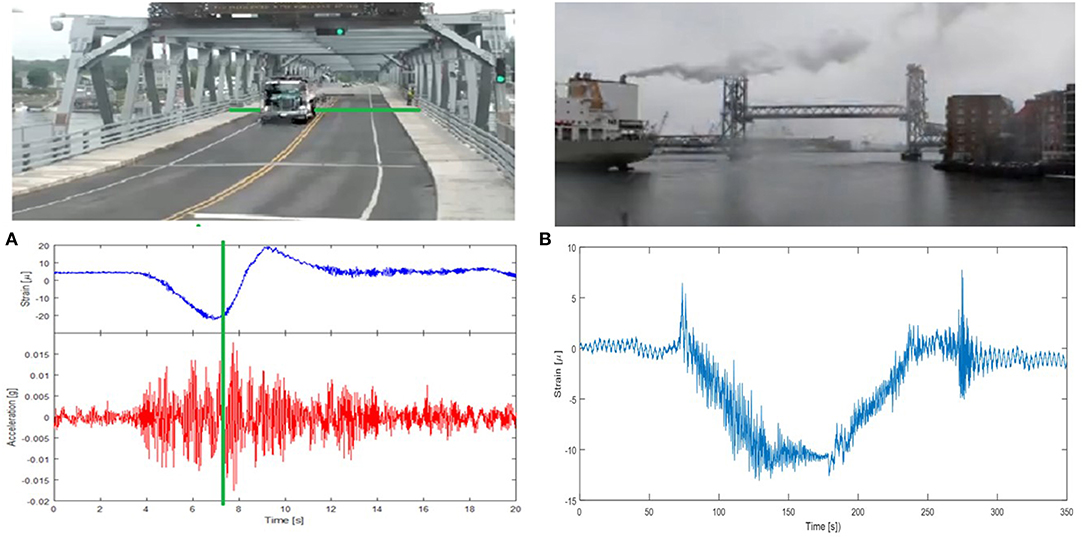
Figure 4. Strain and acceleration measurement at area 1, (A) during a truck passage and (B) during a lift operation at the Memorial Bridge.
Long Term Monitoring Program and Associated Structural Models
The results from the temporary data collections, together with the response predicted by the structural model and the special considerations for the bridge, detailed in the previous section, informed the development of a long term structural monitoring plan installed at the Memorial Bridge, shown in Figure 5 (Mashayekhizadeh et al., 2017). The bridge is instrumented by a series of SHM sensors including accelerometers, uniaxial strain gauges, strain rosettes, and tiltmeters. A total number of twelve uniaxial accelerometers are deployed for monitoring the bridge vibration response along the length of the horizontal span and height of the tower. The instrumentation system includes a set of six accelerometers along the top and bottom chords of the span on the downstream (east) truss as well as two additional accelerometers deployed on the upstream (west) truss, allowing the comparison of both east and west sides vibration modes. There are also four additional accelerometers on the south facing lift tower, where the two accelerometers installed at the base of the lift tower on both east and west sides able one to identify torsional motion in the tower. In addition to accelerometers, there are clusters of five strain rosettes at two gusset-less connections on the span, and six strain rosettes at three joints on the tower which allow for investigation of force path through the webs of the gusset-less connections shown in Figure 5. Uniaxial strain gauges are mounted on a diagonal member connecting the instrumented connections on both east and west faces of the bridge. This is done to assess the symmetric behavior of the bridge. There are also two bi-axial tiltmeters at the top and bottom of the tower to study the movement of the tower due to the wind load, bridge lifts, and combinations of the two. The long term monitoring system was installed and operational in March 2017.
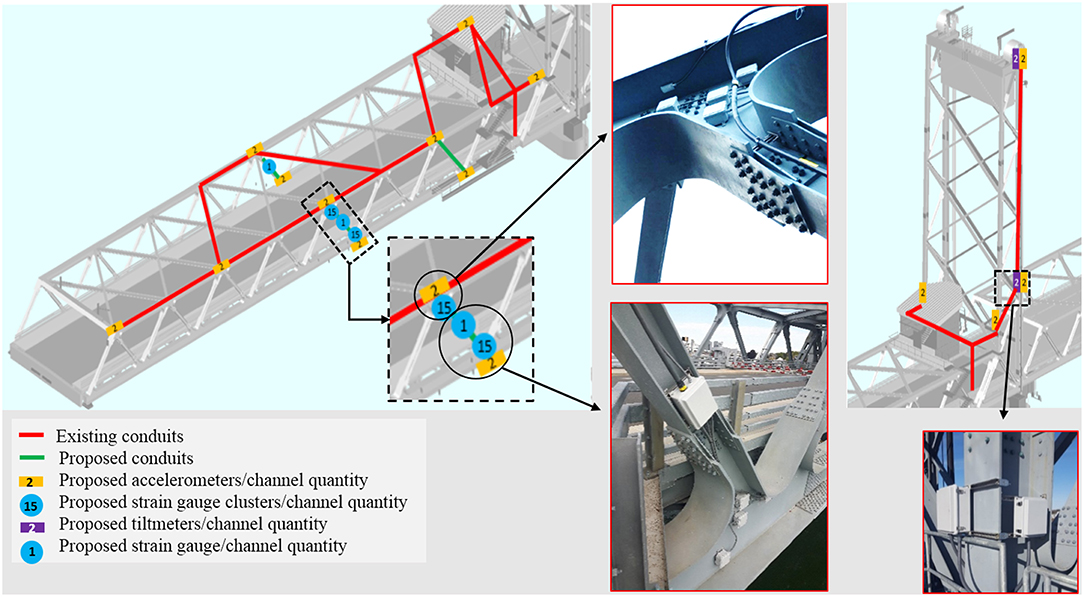
Figure 5. The instrumentation plan for the long term monitoring program of the Memorial Bridge.
A set of more detailed FE models were simultaneously created in Lusas® to assess the data given the complexity to the gusset-less connection (see Figure 6). The structural responses predicted by these models, once calibrated, were used to determine the performance of the structure with respect to the design expectations. In creating the global models in Lusas®, as-built drawings of the bridge, provided by the bridge owner, were used. The element used for the shell element model (see Figure 6A), is a four-noded quadrilateral element, QTS4, to represent thick shell behavior due to the sizable thickness of the members. The use of thick shell elements also provides stress results throughout the thickness of the element. The size and shape of the elements vary due to the geometry of each part from irregular dimension element for the gusset-less connections to the biggest elements for beams and cross braces to minimize the analysis time. Given the complex geometry of the gusset-less connection, a well-detailed FE model of the bridge is required to provide response predictions for both the local and global assessment of the structural performance. However, a global FE model developed with higher dimensional elements may not provide additional valuable performance information with respect to project objectives and will result in a time-consuming analysis, thereby limiting the application of the model for complex analyses. In this study, a multi-scale modeling approach was applied to achieve the desired global FE model to accurately represent the local performance of the connection with efficient computational efforts. In order to create the multi-scale models (see Figures 6B,C), different dimensions of elements were connected by defining the appropriate constraint equations at the interface point to ensure the uniformity of the stress distributions and displacements (Mashayekhi and Santini-Bell, 2019). In the application of the multi-scale approach for a global model, the interface point showing the ratio of the higher to lower dimensions of elements plays a dominant role in the global stiffness of the structure. In addition, the interface points surrounding the higher scale element determine the local stiffness of the component which is required to be positioned in optimum locations to provide a harmonic balance for the components.
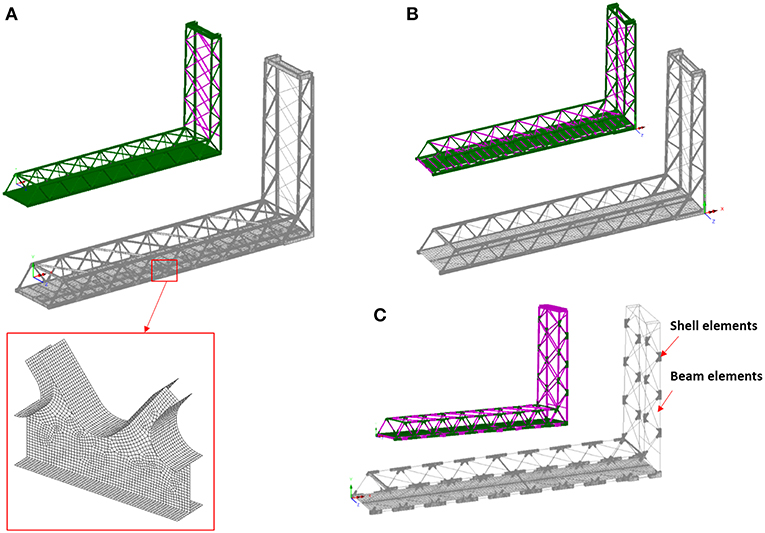
Figure 6. The finite element models of the bridge created in Lusas, (A) shell element model, (B) detailed multi-scale model, and (C) multi-scale model.
A well-detailed global model of the case study bridge (see Figure 6A), at which all members were modeled with higher-scale elements (shell element), was initially developed and used as a baseline for the development of efficient multi-scale models (Mashayekhi et al., 2018). The shell element model was considered as the baseline to understand the structural performance of the members which can be conveniently modeled with lower scale beam elements without a significant decrease in accuracy. The shell elements are indeed three-dimensional 4-noded thick shell elements having 6-nodal degrees of freedom (DOF) each. In particular, this model was developed to study the continuous stress variations between the gusset-less connection and the other connecting members to the connection.
The second model is the detailed multi-scale model (see Figure 6B), that considers both the beam and shell elements in the model. The beam elements are three-dimensional thick beam elements that have 6-nodal DOFs. This model was developed for simulating the lifting action of the bridge. The east and west truss of the bridge, as well as the deck of the bridge were modeled with shell elements. The long members that are in the out-of-plane direction of the trusses were modeled with beam elements. These long members include the braces in the tower and the top of the south span, the floor beams and the skewed floor beams. The selection of these members was based on the beam-like performance of the members, observed in the shell element model. The reduction in the dimension of the selected members can significantly increase the efficiency of the model by reducing the computation time. The development of the detailed multi-scale model was performed through a step-wise procedure by replacing the groups of similar members initially modeled with shell elements with a single beam element and application of the appropriate constraint equations. After each step of a scale-reduction, the optimum location of the interface point was determined by minimizing the difference between the structural responses of the two models.
The third model is the multi-scale model (see Figure 6C), at which the gusset-less connections and the deck of the bridge were modeled with beam elements. This model was developed for an efficient performance assessment of the gusset-less connections under the traffic loads, which is applied for fatigue assessment of the connection. In the detailed multi-scale model, the remaining long members having less-complex geometric properties including the floor beams and braces were modeled by beam elements while the gusset-less connections and chord members by modeled with shell elements. Similar beam and shell elements as those used in aforementioned models were applied in this model. The coupling between two different dimensions of the elements at the interface point of the beam and shell elements were provided using the multi-point constraint equations (McCune et al., 2000; Mashayekhi et al., 2018).
The multi-scale models were developed with an overall aim to create an efficient representative model by reducing the computational time and limiting the element complexity, which leads to a major increase in the number of degrees of freedom. To do so, a mesh sensitivity analysis was performed to acquire the optimum size of the mesh for the beam and thick shell elements. For the multi-scale model, shown in Figure 6C, the top chords, bottom chords and diagonals were also modeled by the beam elements while the same interface coupling was applied. The run time for modal analysis varies from 40 min for the shell model to 14 min for the detailed multi-scale model. Lastly, the multi-scale model was determined to adequately represent both the global and local performance of the bridge based on a comparison with structural response data collected during a diagnostic truck load test, as detailed in section the next section.
Diagnostic Testing for Model Verification of the Memorial Bridge
Load testing is a common practice among bridge engineers for the assessment of bridge safety and serviceability. Diagnostic load testing is one type of load test methods that helps establish a comparison between the resulting structural response of a bridge and its analytical predictions. This method can be used either as a means for estimating the load carrying capacity of an in-service bridge or as an acceptance test before the bridge is put into service (Olaszek et al., 2014). Given a controlled load test, the calibrated models would be beneficial to be used for operational decisions such as those relating to maintenance scheduling and overweight vehicle permitting. Creating a calibrated structural model that can predict the impact of operational and environmental variations on the lift operation and bridge performance will allow for the creation of a data-driven decision-making matrix for fatigue performance prediction, load rating deterioration and real-time condition assessment.
Description of the Design and Implementation of the Load Test for the Memorial Bridge
A series of controlled pseudo-static and dynamic load tests were designed and conducted on the Portsmouth span of the bridge using a tri-axial NHDOT dump truck. The gross weight of the truck was measured at 39 kips, including rear and front axles weighing 22 and 15 kips, respectively (see Figure 7A). Each run of the load test included a series of individual truck passes to ensure collection of high-quality data with the least measurement errors due to uncertainty and variability in the field testing. The dynamic truck tests were conducted with the approximate speed of 30 miles/h, the maximum speed which could be safely attained within the limits of each lane on the bridge. The static tests were designed for two stopping positions on both northbound and southbound of the bridge. Figure 7B shows the stop locations and the distribution of the loads to each truck wheel.
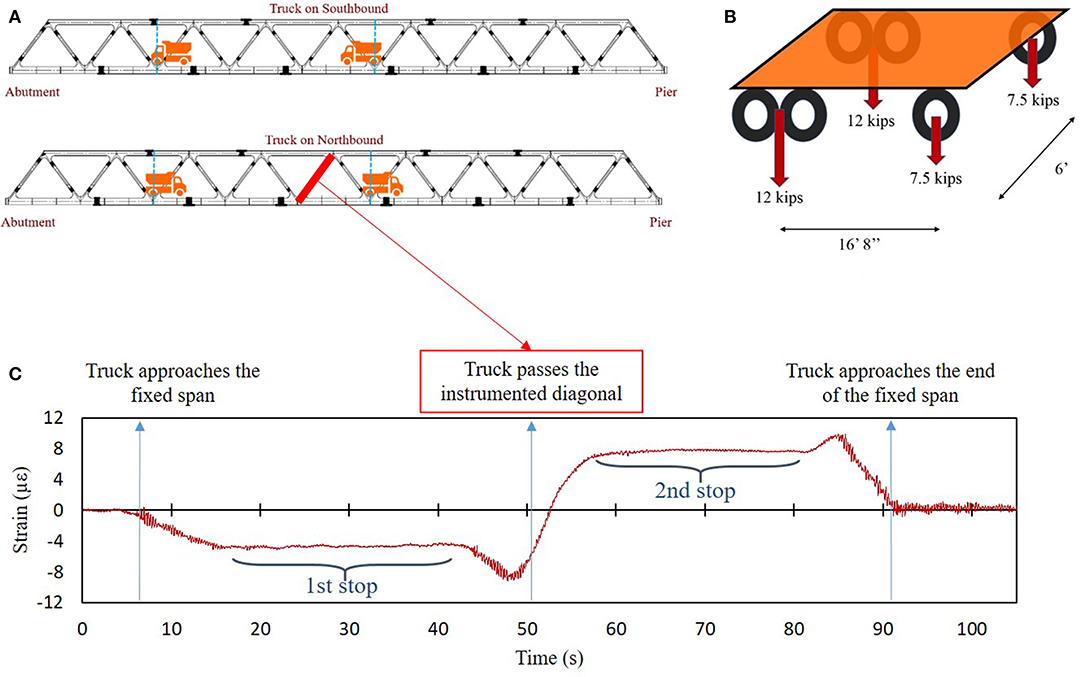
Figure 7. Truck load testing, (A) load distribution to each wheel, (B) stop locations on northbound and southbound, and (C) strain time-history of the instrumented diagonal.
With the bridge temporary closed to traffic, the collection of data was performed using a sampling frequency of 100 Hz for all sensors deployed over the span and tower of the bridge. The sensors were connected to a digital data acquisition system, provided by Bridge Diagnostic Inc., collecting the monitoring data during the test. To minimize the adverse effects of environmental conditions on data reading, namely temperature, for each run of the test, all sensors were zeroed prior to each truck passage. The loaded truck was heavy enough to develop substantial stresses in the structural members while maintaining a linear elastic structural response. The average zero mean value of strains, at both extremities of the recorded time-history, developed in the instrumented diagonal shown in Figure 7C implies the linear elastic behavior of the bridge during the load test. In this instance, the truck was positioned on the northbound lane of the bridge. The negative and positive signs of strain correspond to compressive and tensile strains developed in the instrumented diagonal, respectively. It is also noticed that the sign of the strain changes when the truck passes the instrumented diagonal member.
To approximate reliably the bridge structural behavior and calibrate the finite element models created in this project, the live load strains developed in instrumented members in addition to bridge natural frequencies predicted by the analytical models were compared with the bridge structural response. In this study, the calibration of the FE models was performed based on the pseudo-static truck load test to verify the analytical models with respect to the bridge's structural performance. The following sections demonstrate the application of the proposed diagnostic load testing for two different approaches, including the static model calibration of the FE models developed in Lusas® and structural system identification of the numerical model in SAP2000®. While the former approach has been mainly considered to accurately reflect the fatigue behavior of gusset-less joints and critical regions via the multi-scale models, the latter approach has been used finite element model updating and global structural condition assessment of the bridge.
Static Model Calibration
The static calibration of the FE model using the field data is essential to reduce possible errors induced by simplifications or inaccurate assumptions made in model development (Sanayei et al., 1997). Wrong assumptions are mostly caused by insufficient knowledge about structural details, materials properties, inevitable simplifications of the details or ignorance of the non-structural components, and boundary conditions. In the model calibration procedure, prior to refining the wrong assumptions made in the model developments, it is essential to determine the important parameters causing a deviant response in the model. The refinement attempts are required to change the recognized influential parameters and minimize the errors until the desired accuracy is achieved (Catbas et al., 2007). The strain response of the bridge at the location of the strain rosettes has a more local property compared to the modal response. The comparison between the strain response of the field data and analytical model at a single node becomes difficult as the analytical responses will be mesh-sensitive and therefore, less considered in model calibration studies (Aktan et al., 1998).
In this case study, the strain time-history response of the strain rosettes recorded during the quasi-static load test provides sufficient information for static model calibration of the multi-scale models in Lusas®. The deck of the models at both the northbound and southbound stop locations during the load test was re-meshed to consider an accurate path to account for the truck applying loads. In the initial evaluation of FE models, it was understood that the strain response is more sensitive to the defined boundary conditions, loading conditions and the interface point for the multi-scale model. The refined boundary conditions tuned with the modal response, which expressed in the previous section, was considered as finalized and thus did not change in this part of static model calibration. In the static analysis of the FE models, it was realized that the strain response of the models under the applied truck load simulated as a distributed load and the discrete load is not effectively different. However, more diversity in the strain responses was observed through the change in the distance of the applied load from the truss axles, which indicates that accurate load location has significant impact on the model calibration effort.
In the multi-scale model, it was found that the local stiffness of the gusset-less connection and the induced strain response can be conveniently refined through a minor change in the interface point location. However, in the single scale, the calibration of the shell element model as compared to the multi-scale model using strain response was more restricted. The contours for the principal strain response of the developed FE models in addition to the locations of stress concentration (nominal and hot-spot locations for fatigue assessment) are shown in Figure 8. The numerical results obtained from the FE models were used to be compared to the equivalent field strain response during the load test. The shell model, Figure 8A, shows the most uniform stress distribution at the gusset-less connection. The minor stress concentration areas are observed in the multi-scale models, Figures 8B,C, at the location of the floor beam's connection to the gusset-less connection. The concentrated strain areas indicate that the interface point location must be located as a greater distance from the web of the gusset-less connection. However, since the main objective of developing the multi-scale models is to obtain a cost-efficient model by reducing the degree of freedoms, the current models were accepted and applied for further condition assessment purposes. Table 1 shows the comparison results between the strain responses acquired through the structural analysis of the developed FE models with those calculated from the field data. The representing analytical responses belong to the horizontal strain gauges (Ex) for the bottom connection under the truck load corresponding to the second stop during the load test. The structural response data in Table 1 illustrates that the detailed multi-scale model produces lower strain responses indicating a stiffer connection, as expected with more beam elements, when compared to the multi-scale and shell element models. Consequently, the detailed multi-scale model shows a better agreement to the field data compared to other models.
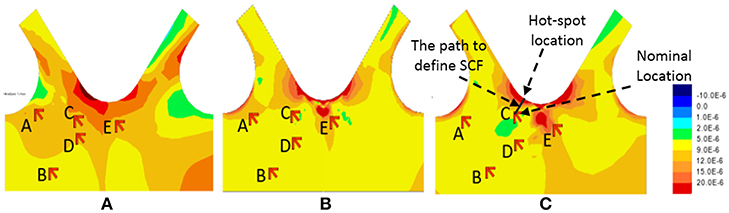
Figure 8. The principal strain contours of the Lusas® FE model, (A) shell element model, (B) detailed multi-scale model, and (C) multi-scale model.
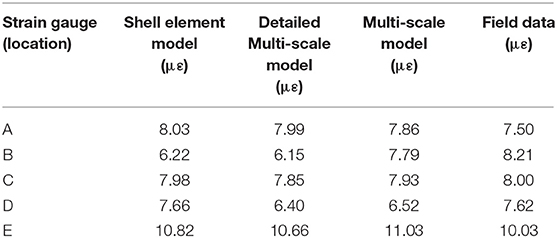
Table 1. Verification of the strain of the developed FE models in Lusas® with the field data.
The verification and calibration of the FE models were also performed through the application of a dynamic moving load on the models to compare with the dynamic load test results. Model calibration under the dynamic load provides more realistic information on the performance of the structure. This was performed through the application of the moving dynamic load on the model considering the truck configurations and speed information while neglecting the influence of the vehicle dynamic impact in the model. Figure 9 shows the comparison between the resulting strain time-history response of the detailed multi-scale model, as shown in Figure 6B, in the horizontal direction (Ex) and the strain response of the bridge recorded by a strain rosette in the same direction.
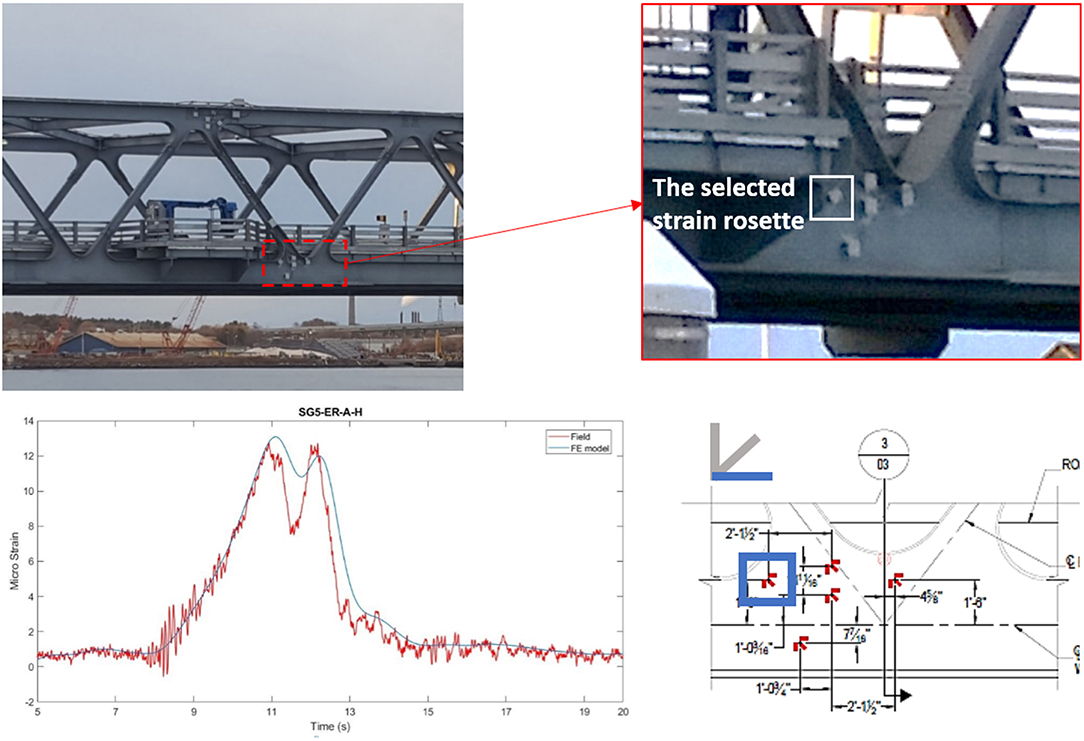
Figure 9. Analytical vs. field time-history response at the strain gage location under the moving truck load.
Structural System Identification
The structural beam model of the bridge developed in SAP2000® was updated to reflect field observed structural behavior better. The updating of the model was performed based on a parameter estimation procedure that changes the stiffness values of the structural members so that the error between the analytical model and the in-service bridge is minimized. For the Memorial Bridge, in particular, the stiffness of the gusset-less connections is a critical concern and the mechanical behavior of this innovative type of connection is not well-known (Mehrkash and Santini-Bell, 2018). There are numerous techniques for finite element model updating and structural condition assessment for which many of these methods require the modal properties of the structure, i.e., natural frequencies and mode shapes obtained by processing the monitoring data (Sanayei et al., 1999).
The diagnostic load test data was not used for model system identification, as the lift response data provided a larger dynamic response and would be more informative for this operation. With a total number of twelve accelerometers deployed on the Portsmouth-side span and lift tower of the bridge, the accelerometers have been capturing the bridge dynamic acceleration response continuously. However, since the excitation source of the bridge is not known clearly, the bridge excitation was categorized as ambient vibrations to pursue structural modal analysis in this work. In the output-only modal identification methods, the frequency domain decomposition is an efficient approach for the modal extraction. For the ambient vibration, the input can be assumed as a zero-mean Gaussian white noise, so the power spectral density of the input is a constant matrix. Therefore, we can write (Brincker et al., 2001):
where ω is the frequency, Gyy(ω) is the power spectral density matrix of the responses, dk is a scalar constant, ϕk is the mode shape, λk is the pole and “−” and T indicate complex conjugate and transpose, respectively.
To perform the frequency domain decomposition, using the singular value decomposition, the output power spectral density is decomposed as follows:
where Ĝyy(ω) is the estimate of the output power spectral density, the matrix Ui = [ui1, ui2, …, uim] is a unitary matrix including vectors uij, Si is a diagonal matrix holding the singular vectors and superscript H denotes conjugate response. While the peaks of the output spectrum show the natural frequencies of the system, the first singular vector estimates the corresponding mode shape. Figure 10A shows the acceleration time history captured by an accelerometer located on the top chord during a lift event.
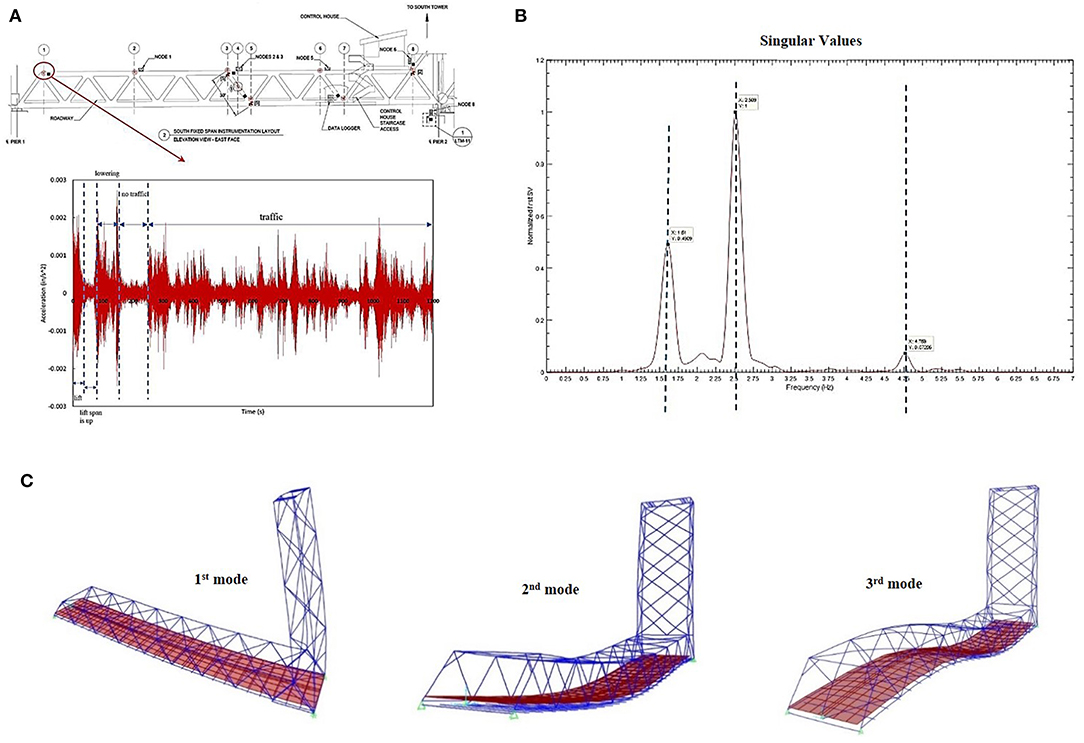
Figure 10. Frequency-domain decomposition analysis of the bridge, (A) the acceleration time history captured by the specified sensor during a lift event, (B) the output spectrum peaks representing the natural frequencies of the Memorial Bridge, and (C) the first three mode shapes derived from the structural model in SAP2000®.
By a sampling rate of 50 Hz and using a Hanning window with 60% overlap, while a bandpass Butterworth IIR filter of 4th order with the lower cutoff frequency of 1 Hz and higher cutoff frequency of 5 Hz were applied, the singular values and their corresponding singular vectors were identified. Figure 10B shows the output spectrum in which the peaks represent the first three natural frequencies of the bridge. For this case, the accelerometers on the tower of the bridge were not considered. To make sure there is not any periodicity in the signal, only the part of the signal between the lowering of the lift span at the end of a lift operation and resuming of vehicular traffic was used for the frequency domain decomposition. While Figure 10C shows the mode shapes corresponding to the first three vibration modes of the bridge from the SAP2000® model. Table 2 compares the resulting natural frequencies of both SAP2000® and Lusas® FE models with monitoring data.
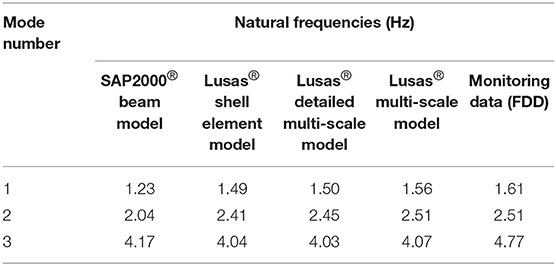
Table 2. Verification of the bridge natural frequencies for both SAP2000® and Lusas® FE models with monitoring data.
Decision Support Using the Verified Model
Management decision related to in-service bridges must consider resource constraints and the need to maintain the structural health of the bridge components and the infrastructure network. A verified structural model of a complex high-value bridge can benefit management and operational decision-making. The verified models of the Memorial Bridges were used to predict fatigue damage, reduction in load carrying capacity, real-time condition assessment and member vulnerability with respect to likely damage scenarios.
Fatigue Damage Prediction
The radiused filet welds at the gusset-less connection of the Memorial Bridge connecting the cold bent flanges to the web of the connection (as shown in Figure 8) can make the weld toe of the connection a hot-spot location. The geometric complexities and discontinuities induce the hot-spot stresses at the toe of the welded connections. Due to the limitations in existing sensor installation location, the installed strain gages at the gusset-less connection are 2-inches away from the weld toe, as shown in Figure 5, and therefore; these sensors are able to record the nominal strains (stress) of the connection. In consequence, the application of the field collected nominal strains recorded through the strain gauges for fatigue assessment of the connection may not properly inform on fatigue status of the component. Consequently, the acquired fatigue damage response may lead to overestimating the remaining life of the component.
The captured strains by the sensors at the bridge are the nominal strains which can be less critical for fatigue damage assessment. In this study, considerable efforts were made to determine the hot-spot locations using the calibrated FE model developed in Lusas®. To measure the fatigue damage of the gusset-less component, it is essential to determine the stress ranges and stress cycles under the live loads experienced by the structure. The measured nominal stress range, Snom, is represented as the difference between the maximum stress, σmax, and the minimum stress, σmin, measured in one stress cycle expressed in Equation (3) (Ni et al., 2010). The hot-spot stress range can be calculated using the Stress Concentration Factor (SCF) through the Equation (4):
The SCFs for the standard welded connections are well-documented in the previous studies and available codes for welding (IIW, 2000; Niemi et al., 2006). The SCF factors for the complex components which are not documented on the codes, can be measured through a validated FE model by dividing the hot-spot stress, σhot, by the nominal stress, σnom, expressed in Equation (5):
To determine the appropriate SCF, the numerical strain response at the toe of the weld and the nominal strain response at the location of the strain rosette are applied. The numerical nominal and hot-spot stress range are computed from Equation (5) using the time-history responses of the model, as expressed in Figure 9. The SCF for the location of the strain rosette C is computed using a perpendicular path starting from the strain rosette location to the weld toe, as shown in Figure 8C. Through the FE analysis, the SCF was acquired 1.38. The resulting SCF is applied to be multiplied by the field collected stress ranges from the investigating strain rosettes.
The field collected stress responses, induced by the traffic loads have a variable amplitude property. To measure the variable amplitude stress ranges the rain-flow cycle counting algorithm (Downing and Socie, 1982) was applied to extract the stress range and the stress cycles through the field time-history strain responses. The nominal stress ranges are multiplied by the measured SCF to achieve the hot-spot stress ranges. The acquired stress cycles are applied to measure the fatigue damage index using the S-N curve and Miner's rule given by Equation (6) (Miner, 1945):
where ni denotes the number of the cycles for the stress range, Si and Ni is the number of cycles to failure at the stress range of Si. In applying the S-N curve for the fatigue damage measurement, the novel gusset-less connection is not categorized among the recognized components existing in American Association of State and Highway Transportation Officials (AASHTO) fatigue categories. However, the Category C is considered for component investigating at the toe of the weld based on the designer's assumptions and the AASHTO categorized specifications considered for the filet welds (AASHTO, 1995). Also, category B is considered for the nominal stress ranges. Figure 11 illustrates the results of the mean stress histograms at the hot-spot location of the weld toe and the nominal stress at the instrumented locations of the gusset-less connections. The results of the nominal and hot-spot stress ranges as well as the associated fatigue responses are expressed in Table 3. The resulting fatigue responses due to the limited number of cycles are still representing infinite fatigue life. However, it can be observed for the considering period, the hot-spot fatigue response is about four times of the nominal fatigue response. In the longer periods of data collection, higher number of cycles of stress ranges are achieved. With the higher recorded cycles of stress ranges (considerable for fatigue assessment), the difference between the nominal and hot-spot fatigue responses can be infinite and finite reports of the remaining life of the component. Consequently, it is essential to measure the nominal and hot-spot fatigue responses in evaluating the health status of the fracture critical structural components.
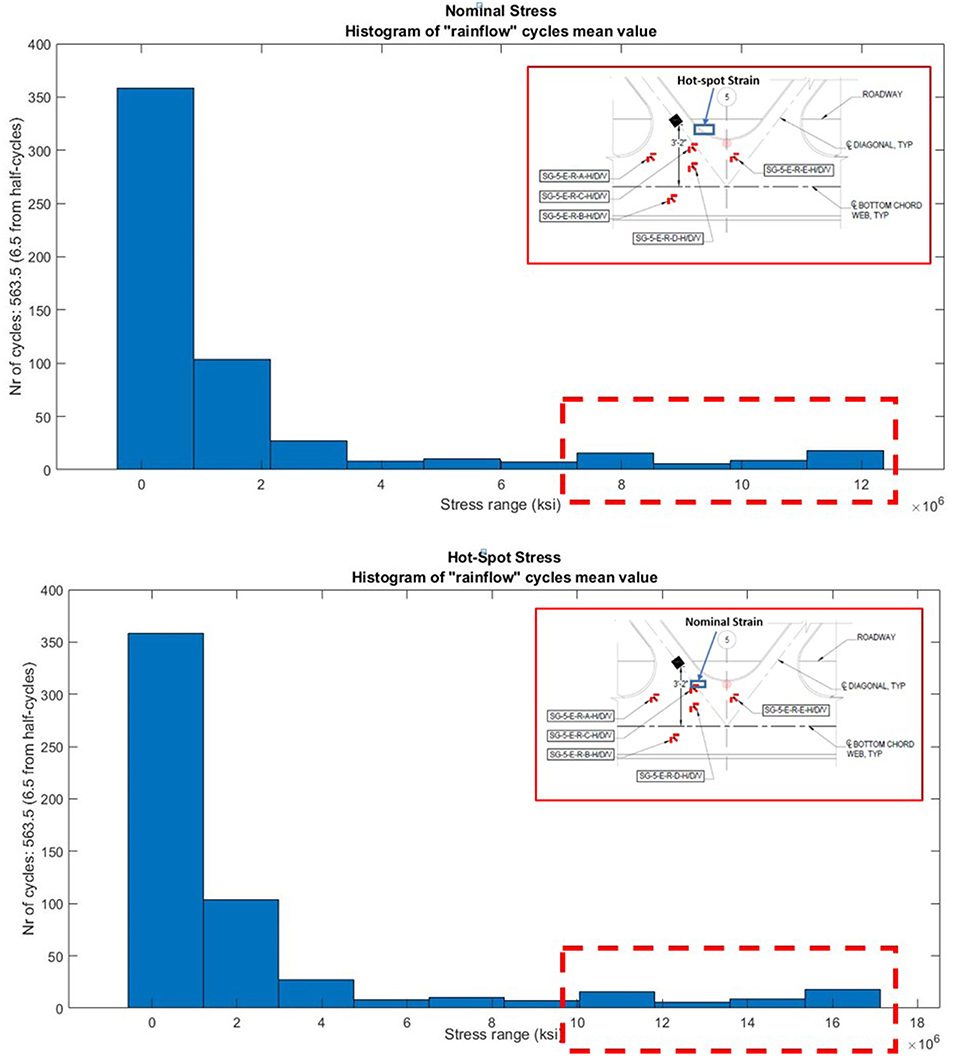
Figure 11. Nominal stress vs. hot-spot mean stress range.
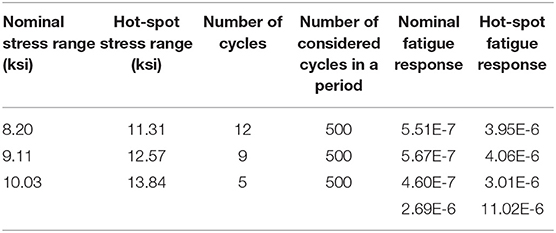
Table 3. The results of the nominal and hot-spot stress ranges as well as the associated fatigue responses for the Lusas® FE model.
Load Rating Degradation Due to Damage Scenarios
The calibrated structural model created in SAP2000® was used for reliable assessment of the bridge actual condition subjected to likely damage scenarios. In particular, such models can be used to verify how the damage of one or more particular member(s) may degrade the load carrying capacity or load rating of the bridge. The load rating of a bridge is defined as (AASHTO, 2011):
where RF is the rating factor, C is the capacity of one member, DC, DW and LL are Dead load effect due to structural components and attachments, Dead load effect due to wearing surface and utilities and Live load effect, respectively. Also γDC, γDW and γLL are LRFD load factor for structural components and attachments, LRFD load factor for wearing surfaces and utilities, and live load factor, respectively and IM is the dynamic load allowance.
For instance, if a bottom chord of the bridge in the middle of the fixed-span and its neighboring diagonal is hit by a vessel collision, the load rating capacity of the bridge is diminished. Based on the intensity of the ship collision, one may consider various percentages of damage. If the damage intensity is simulated by reduction of property modifiers of the damaged members in the analytical model and the capacity of the damaged member is diminished by corresponding reduction factors, the degradation of load rating of the bridge can be obtained. The calibrated model of the bridge was used for understanding the bridge capacity due to likely damage scenarios. Figure 12A shows a typical example of the load rating degradation of the bridge based on the bending capacity of the damaged bottom chord and its neighboring diagonal as shown in Figure 12B. The redundancy of the structural system allows for load redistribution to surrounding health members. This analysis indicates that these members do not need to be repaired but it does demonstrate the design system redundancy and safety factor.
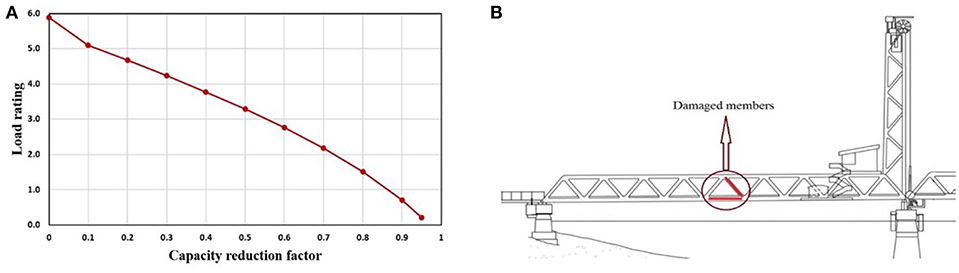
Figure 12. Load rating calculation due to the ship collision, (A) load rating degradation of the bridge, (B) damaged members due to a ship collision.
Real-Time Condition Assessment for Operational Decision-Making Protocol
When a bridge experiences an unexpected occurrence of accidental events, such as the vessel collision as expressed in the previous section, a major concern for bridge managers is effective and informed operational decision-making with respect to the remaining capacity of the bridge. This protocol could be functional via the monitoring data collected through a long term SHM system to predict the bridge structural behavior in the presence of damage. Since the Memorial Bridge is a relatively new bridge suffering no damage so far, in a parallel study, considerable efforts were performed to take advantage of the frequent and repeated lift operations that impart a significant impact load on the bridge. The simulated lift impact vibrates the fixed-span of the verified SAP2000® model so that the resulting accelerations can be collected under varying health and damage scenarios. The principal concept behind the excitation technique is explained in detail by Shahsavari et al. (2018a).
Given the load rating reduction estimated by the bridge analytical model, an integrated decision-making protocol combining different approaches will be beneficial to bridge managers for making decisions on the damaged (pre-repair) state of the structure with respect to different damage scenarios. Therefore, in this case study, the verified structural model was used as a baseline to (a) determine the structural system response for damage detection using the combined application of signal processing and statistical pattern recognition techniques and (b) investigate the bridge decreased load carrying capacity according to the AASHTO Manual for Bridge Evaluation (AASHTO, 2011). Various damage scenarios were modeled near the mid-length of the fixed-span to simulate damage caused by truck accident, vessel collision, fatigue damage in the gusset-less connection, and loose bolts. These case scenarios were simulated to be reflective of likely damage scenarios jeopardizing the structural safety and serviceability of the bridge under operating conditions.
A damage detection criterion relying on the wavelet energy rate index of acceleration signals was proposed to continuously post-process the bridge collected dynamic data as a means for real-time condition assessment. The damage detection procedure of Shahsavari et al. (2018a) was employed to discriminate between two different states of the structure using the collected acceleration data obtained from the SAP2000® model at pseudo-sensor (accelerometer) locations throughout the bridge model. For each structural condition, the bridge was subjected to multiple random excitations to simulate the frequent and dynamic impacts of the bridge movable (lift) span on the fixed-span and tower. The Wavelet Packet Component (WPT) was used to determine how the bridge system response will be affected by damaged-induced change in dynamic properties. By definition, the wavelet packet function is expressed by:
where i, j, and k denote the modulation, scale, and translation parameters, respectively. The wavelet packet component is given by:
where is the wavelet coefficient at time instant (t). In theory, the wavelet coefficient is used as a scalar value specifying the degree of correlation between the wavelet function and the analyzed portion of the signal at an instant of time. The WPT is based on a binary decomposition algorithm in which each level of decomposition (j) offers 2jnumber of wavelet packet components (i) in total. The energy distribution (E) of the wavelet packet component is computed by:
Given that the energy rate index corresponding to acceleration time-series are highly correlated to structural dynamic characteristics, the average energy rate index investigated from the energy distribution of all accelerometers was used as representative of the bridge dynamic response for different structural conditions. The proposed damage detection criterion is based on performing a control chart analysis on the wavelet packet averaged data for feature classification between different states. The core of the control chart analysis is to enclose the inherent variations of the wavelet-based vibration features, measured in the healthy state of the structure, within two threshold lines (upper and lower control limits). Given the statistical enclosure, an exceedance of sample mean μ corresponding to alternate (damaged) models beyond the control limits can be attributed to the presence of unusual sources of variability with high confidence.
For this case study, the statistical baseline was constructed by enclosing the reference data within plus and minus three standard deviations σ from the sample mean μ for the undamaged state of the bridge, resulting in a 99.7% confidence interval. Figure 13 represents the control chart analysis of sample (wavelet) data due to damage induced to the bridge members by the vessel collision shown in Figure 12B. In this instance, various levels of damage, ranging from 10 to 90% reduction in cross sectional properties of the damaged members, were simulated to account for the intensity of the potential ship impact. As shown in the graph, as the damage level increases the average normalized energy of signals increases which in turn may cause sample data to exceed the threshold lines based on the observations measured in the reference (undamaged) state of the bridge. The proposed approach was mainly developed to make the bridge owners aware of a significant change in the system performance due to likely damage to determine the need for more costly actions, either through a targeted visual inspection for areas of potential damage or model updating and parameter estimation depending on the available data (Santini-Bell et al., 2007; Sanayei et al., 2011).
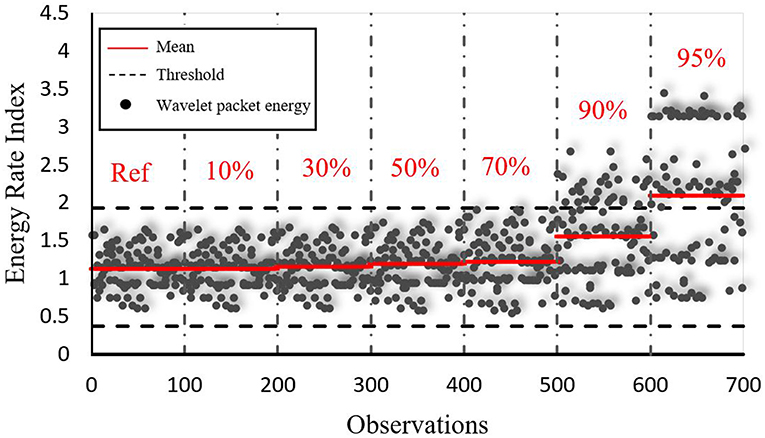
Figure 13. Control chart analysis for incremental levels of damage due to the ship collision.
In general, the wavelet-based decision-making methodology consists of different steps sequentially come after each other. Once the source of damage is identified, the next step is to assess the damage impact on the load carrying capacity of the bridge, which is quantified by load rating concept using the AASHTO design code provisions, Equation 7, to better prioritize management strategies for a deteriorated bridge. The proposed protocol was developed to demonstrate how the use of sensor technology and structural modeling combined with enhanced methodologies and engineering practices can yield reliable bridge condition assessment and proactive visual inspection and subsequent load rating evaluation on demand basis. This approach not only provides bridge owners with additional time and flexibility for maintenance and rehabilitation of deteriorated bridges, but it also can facilitate a better resource allocation to repair or replace damaged components.
Conclusion
This paper presents a case study to better prioritize the management strategies for smart and in-service bridges instrumented by structural health monitoring sensors. The paper is structured in a manner that provides three means of using the collected structural response information, diagnostic testing and structural modeling into a decision-making approach. The Memorial Bridge, owned by New Hampshire and Maine Departments of Transportation, is outfitted with a number of monitoring sensors to continuously monitor the bridge response from structural performance to fatigue assessment and load rating reduction prediction using the bridge calibrated analytical models developed in Lusas® and SAP2000®. These models are developed based on local and global performance assessment goals. The main finding is that the multi-scale modeling approach developed in Lusas® is promising to accurately represent the local performance of the bridge gusset-less connections for fatigue evaluation whereas the SAP2000® wired-based model has a high potential to predict the system response and load rating degradation due to likely damage scenarios or excessive change in dynamic characteristics.
The fatigue assessment results represent infinite fatigue life for the bridge gusset-less connection, the measured fatigue damage response at the hot-spot region is about four times of the estimated fatigue response for the nominal stress location. Based on this observation, both the nominal and hot-spot fatigue responses are essential for evaluating the health status of the fracture critical complex structural components.
This paper also presents the application of a wavelet-based method based on the real-time data collected from the SHM sensors to quantify the change in the bridge system response in the presence of likely damage scenarios. The proposed approach demonstrates how the SHM data collected from an instrumented bridge can be integrated into an objective decision-making protocol with the aim to reliability assess the actual condition of deteriorated bridges on demand basis and facilitate a better resource allocation for bridge maintenance. The vessel impact is assessed using the wavelet-based damage detection criterion. For the case scenario at which the damage has reached its critical level, the results indicate that there is statistically significant evidence to detect a noticeable change in the bridge performance. If the bridge experiences a vessel collision causing a significant reduction in the overall capacity of the target members as modeled in this work, ≥90% of the member capacity, deliberate actions should be taken immediately to reduce demand or replace the damaged members. Potential actions include setting management strategies such as closing the bridge, posting load limits, and performing analytical investigations to repair or replace the damaged members.
This practice demonstrates the need for establishment of performance-based warning systems to proactively keep informed the bridge managers and maintenance engineers of any appreciable change in global response of important transportation infrastructure. Further studies are underway presenting a more reliable methodology to better support operational decision-making protocols for structural condition assessment using the AASHTO LRFD Bridge Design Specifications.
Author Contributions
VS coordinated the contributions from all authors, provided editorial support and conducted and drafted the real-time condition assessment using wavelet packets section of this manuscript. MMa created the multi-scale finite element models, performed the static model calibration, and conducted the fatigue assessment included in this manuscript. MMe created the beam structural model, performed the modal model calibration, and conducted load rating degradation study included in this manuscript. ES-B led the design and deployment of the instrumentation plan, load test, model creation, data post-processing efforts, and developed the architecture for this manuscript.
Funding
This material is partially supported through Grant No. 1430260 from the National Science Foundation, FHWA AID: DEMO Program and funding received from the New Hampshire Department of Transportation Research Advisory Council. Any opinions, findings and conclusions, or recommendations expressed in this material are those of the author(s), and do not necessarily reflect those of the NSF, FHWA, or the New Hampshire Department of Transportation.
Conflict of Interest Statement
The authors declare that the research was conducted in the absence of any commercial or financial relationships that could be construed as a potential conflict of interest.
Acknowledgments
We acknowledge support from the New Hampshire Department of Transportation for access to the Memorial Bridge throughout this project. The bridge designer, HNTB Corporation, specifically Ted Zoli and Christopher Engel were instrumental in the design of the structural health monitoring system, model creation and load test design presented in this work.
References
AASHTO (1995). Guide Specifications for Fatigue Evaluation of Existing Steel Bridges. American Association of State Highway and Transportation Officials.
AASHTO (2008). Bridging the Gap-restoring and Rebuilding the Nation's Bridges. American Association of State Highway and Transportation Officials.
AASHTO (2011). Manual for Bridge Evaluation, 2nd Edn. Farmington Hills, MI: American Association of State Highway and Transportation Officials.
Adams, T., Mashayekhizadeh, M., Santini-Bell, E., Wosnik, M., Baldwin, K., and Fu, T. (2017). Structural Response Monitoring of a Vertical Lift Truss Bridge. Transportation Research Board. No. 17-06353. Washington, DC.
Agrawal, A. K., Liu, G. Y., and Alampalli, S. (2013). “Effects of truck impacts on bridge piers,” in Advanced Materials Research, Vol. 639, eds X. Zhou, G. He, Y. Fan, Y. Xiao, S. K. Kunnath, and G. Monti (Trans Tech Publications), 13–25.
Aktan, E., Catbas, N., Turer, A., and Zhang, Z. (1998). Structural identification: analytical aspects. Struct. Eng. 124, 817–829. doi: 10.1061/(ASCE)0733-9445(1998)124:7(817)
Aygül, M., Bokesjö, M., Heshmati, M., and Al-Emrani, M. (2013). A comparative study of different fatigue failure assessments of welded bridge details. Int. J. Fatigue 49, 62–72. doi: 10.1016/j.ijfatigue.2012.12.010
Brincker, R., Zhang, L., and Andersen, P. (2001). Modal identification of output-only systems using frequency domain decomposition. Smart Mater. Struct. 10, 441–445. doi: 10.1088/0964-1726/10/3/303
Cardini, A. J., and DeWolfe, J. T. (2009). Implementation of a long-term bridge weigh-in-motion system for a steel girder bridge in the interstate highway system. Bridge Eng. 14, 418–423. doi: 10.1061/(ASCE)1084-0702(2009)14:6(418)
Carvalho, H., Fakury, R. H., and Vilela, P. M. L. (2017). The challenges of rehabilitating the Hercilio Luz suspension bridge. Latin Am. J. Solids Struct. 14, 700–713. doi: 10.1590/1679-78253401
Catbas, F. N., Ciloglu, S. K., Hasancebi, O., Grimmelsman, K., and Aktan, A. E. (2007). Limitations in structural identification of large constructed structures. Struct. Eng. 133. 1051–1066. doi: 10.1061/(ASCE)0733-9445(2007)133:8(1051)
Catbas, F. N., Gul, M., Gokce, H. B., Zaurin, R., Frangopol, D. M., and Grimmelsman, K. A. (2014). Critical issues, condition assessment and monitoring of heavy movable structures: emphasis on movable bridges. Struct. Infrastruct. Eng. 10, 261–276. doi: 10.1080/15732479.2012.744060
Doebling, S. W., Farrar, C. R., Prime, M. B., and Shevitz, D. W. (1998). A review of damage identification methods that examine changes in dynamic properties. Shock Vibrat. Digest. 30, 91–105. doi: 10.1177/058310249803000201
Downing, S. D., and Socie, D. F. (1982). Simple rainflow counting algorithms. Int. J. Fatigue 4, 31–40. doi: 10.1016/0142-1123(82)90018-4
Fu, T. S., Garcia-Palencia, A. J., Bell, E. S., Adams, T., Wells, A., and Zhang, R. (2015). Analyzing Prerepair and Postrepair vibration data from the Sarah Mildred Long Bridge after Ship Collision. Bridge Eng. 21:05015002. doi: 10.1061/(ASCE)BE.1943-5592.0000856
García, M. D., Cicero, S., and Gutiérrez, O. R. (2018). Structural integrity assessment of the welded joints of the constitution of 1812 bridge (Cádiz, Spain). Eng. Failure Anal. 90, 518–533. doi: 10.1016/j.engfailanal.2018.04.012
García-Palencia, A. J., and Santini-Bell, E. (2014). Structural model updating using dynamic data. Civil Struct. Health Monitor. 4, 177–194. doi: 10.1007/s13349-014-0073-8
IIW (2000). Fatigue Design Procedures for Welded Hollow Section Joints. IIW Doc. XIII-1804-99/XV-1035-99. Recommendations for IIW subcommision XV-E. International Institute of Welding.
Ingraham, C. (2015). Mapping America's Most Dangerous Bridges. Available online at: http://www.washingtonpost.com/blogs/wonkblog/wp/2015/02/04/mapping-americas-most-dangerous-bridges/
Kashefi, K., Zandi, A. P., and Zeinoddini, M. (2010). Fatigue life evaluation through field measurements and laboratory tests. Procedia Eng. 2, 573–582. doi: 10.1016/j.proeng.2010.03.062
Knott, M. A., and Damgaard, L. O. (1990). Guide Specification and Commentary for Vessel Collision Design of Highway Bridges. US Department of Transportation, Federal Highway Adminstration, Publ. No. FHWA-RD-91-006.
Kwad, J., Alencar, G., Correia, J., Jesus, A., Calçada, R., and Kripakaran, P. (2017). Fatigue assessment of an existing steel bridge by finite element modelling and field measurements. J. Phys. 843:012038. doi: 10.1088/1742-6596/843/1/012038
Laman, J. A., and Nowak, A. S. (1996). Fatigue-load models for girder bridges. Struct. Eng. 122, 726–733. doi: 10.1061/(ASCE)0733-9445(1996)122:7(726)
Leander, J., Honfi, D., Ivanov, O. L., and Björnsson, Í. (2018). A decision support framework for fatigue assessment of steel bridges. Eng. Failure Anal. 91, 306–314. doi: 10.1016/j.engfailanal.2018.04.033
Liu, Z., Hebdon, M. H., Correia, J. A. F. O., Carvalho, H., Vilela, P., De Jesus, A. M. P., et al. (2017). Fatigue life evaluation of critical details of the Hercílio Luz Suspension Bridge. Procedia Struct. Integr. 5, 1027–1034. doi: 10.1016/j.prostr.2017.07.063
Mashayekhi, M., Mehrkash, M., Shahsavari, V., and Santini-Bell, E. (2018). Multi-scale Finite Element Model Development for Long-term Condition Assessment of a Vertical Lift Bridge. Fort Worth, TX: ASCE Structure Congress.
Mashayekhi, M., and Santini-Bell, E. (2019). Three dimensional multiscale finite element models for in-service performance assessment of bridge. Comput. Aided Civ. Inf. Eng. 34, 385–401. doi: 10.1111/mice.12424
Mashayekhizadeh, M., Santini-Bell, E., and Adams, A. (2017). “Instrumentation and structural health monitoring of a vertical lift bridge,” in Proceedings of the ASNT 26th Research Symposium (Jacksonville, FL).
McCune, R. W., Armstrong, C. G., and Robinson, D. J. (2000). Mixed dinetional coupling in finite element models. Numerical Methods Eng. 49, 725–750. doi: 10.1002/1097-0207(20001030)49:6<725::AID-NME967>3.0.CO;2-W
Mehrkash, M., and Santini-Bell, E. (2018). “Modeling and characterization of complicated connections in structural and mechanical systems as applied to a gusset-less truss connection,” in 97th Annual Meeting of Transportation Research Board (Washington, DC).
Mohammadi, J., Guralnick, S. A., and Polepeddi, R. (1998). Bridge fatigue life estimation from field data. Pract. Period. Struct. Des. Const. 3, 128–133. doi: 10.1061/(ASCE)1084-0680(1998)3:3(128)
NAE (2017). NAE Grand Challenges for Engineering. National Academy of Engineering. Available online at: http://www.engineeringchallenges.org/challenges/infrastructure.aspx
Nash, T. P. (2016). An objective protocol for movable bridge operation in high-wind events based on hybrid analyses by European and American design code (Master's Thesis). University of New Hampshire, Durham, NC, USA.
Ni, Y. Q., Ye, X. W., and Ko, J. M. (2010). Monitoring-based fatigue reliability assessment of steel bridges: analytical model and application. Struct. Eng. 136, 1563–1573. doi: 10.1061/(ASCE)ST.1943-541X.0000250
Niemi, E., Fricke, W., and Maddox, S. J. (2006). Fatigue Analysis of Welded Components: Designer's Guide to the Structural Hot-Spot Stress Approach. Cambridge: Woodhead Publishing.
Olaszek, P., Łagoda, M., and Casas, J. R. (2014). Diagnostic load testing and assessment of existing bridges: examples of application. Struct. Infrastruct. Eng. 10, 834–842. doi: 10.1080/15732479.2013.772212
Sanayei, M., Imbare, G. R., McClain, J. A. S., and Brown, L. C. (1997). Structural model updating. Struct. Eng. 123, 792–798. doi: 10.1061/(ASCE)0733-9445(1997)123:6(792)
Sanayei, M., McClain, J. A., Wadia-Fascetti, S., and Santini, E. M. (1999). Parameter estimation incorporating modal data and boundary conditions. Struct. Eng. 125, 1048–1055. doi: 10.1061/(ASCE)0733-9445(1999)125:9(1048)
Sanayei, M., Phelps, J. E., Sipple, J. D., Santini-Bell, E., and Brenner, B. R. (2011). Instrumentation, nondestructive testing, and finite-element model updating for bridge evaluation using strain measurements. Bridge Eng. 17, 130–138. doi: 10.1061/(ASCE)BE.1943-5592.0000228
Santini-Bell, E., Lefebvre, P. J., Sanayei, M., Brenner, B., Sipple, J. D., and Peddle, J. (2013). Objective load rating of a steel-girder bridge using structural modeling and health monitoring. Struct. Eng. 139, 1771–1779. doi: 10.1061/(ASCE)ST.1943-541X.0000599
Santini-Bell, E., Sanayei, M., Javdekar, C. N., and Slavsky, E. (2007). Multiresponse parameter estimation for finite-element model updating using nondestructive test data. Struct. Eng. 133, 1067–1079. doi: 10.1061/(ASCE)0733-9445(2007)133:8(1067)
Shahsavari, V., Bastien, J., Chouinard, L., and Clément, A. (2017b). Likelihood-based testing of wavelet coefficients for damage detection in beam structures. Civil Struct. Health Monitor. 7, 79–98. doi: 10.1007/s13349-017-0212-0
Shahsavari, V., Chouinard, L., and Bastien, J. (2017a). Wavelet-based analysis of mode shapes for statistical detection and localization of damage in beams using likelihood ratio test. Eng. Struct. 132, 494–507. doi: 10.1016/j.engstruct.2016.11.056
Shahsavari, V., Chouinard, L., and Bastien, J. (2018b). “Detection of structural damage under varying environmental conditions,” in Proceedings of the 10th International Conference on Short and Medium Span Bridges (SMSB) (Quebec, QC: Canadian Society for Civil Engineering (CSCE)).
Shahsavari, V., Mehrkash, M., and Santini-Bell, E. (2018a). “Structural health monitoring of a vertical lift bridge using vibration data,” in Proceedings of the ASNT 27th Research Symposium (Orlando, FL).
Stark, T. D., Benekohal, R., Fahnestock, L. A., LaFave, J. M., He, J., and Wittenkeller, C. (2016). I-5 Skagit river bridge collapse review. J. Performance Construct. Facilities 30:04016061. doi: 10.1061/(ASCE)CF.1943-5509.0000913
Sun, Z., and Chang, C. C. (2002). Structural damage assessment based on wavelet packet transform. J. Struct. Eng. 128, 1354–1361. doi: 10.1061/(ASCE)0733-9445(2002)128:10(1354)
Vafaei, M., Alih, S. C., Shad, H., Falah, A., and Halim, N. H. F. A. (2018). Prediction of strain values in reinforcements and concrete of a RC frame using neural networks. Adv. Struct. Eng. 10, 29–35. doi: 10.1007/s40091-018-0178-0
Keywords: structural health monitoring, load testing, structural model calibration, vertical lift bridge, structural condition assessment
Citation: Shahsavari V, Mashayekhi M, Mehrkash M and Santini-Bell E (2019) Diagnostic Testing of a Vertical Lift Truss Bridge for Model Verification and Decision-Making Support. Front. Built Environ. 5:92. doi: 10.3389/fbuil.2019.00092
Received: 04 November 2018; Accepted: 24 June 2019;
Published: 16 July 2019.
Edited by:
Joan Ramon Casas, Universitat Politecnica de Catalunya, SpainReviewed by:
David Lattanzi, George Mason University, United StatesPavel Ryjáček, Czech Technical University, Czechia
Copyright © 2019 Shahsavari, Mashayekhi, Mehrkash and Santini-Bell. This is an open-access article distributed under the terms of the Creative Commons Attribution License (CC BY). The use, distribution or reproduction in other forums is permitted, provided the original author(s) and the copyright owner(s) are credited and that the original publication in this journal is cited, in accordance with accepted academic practice. No use, distribution or reproduction is permitted which does not comply with these terms.
*Correspondence: Erin Santini-Bell, ZXJpbi5iZWxsQHVuaC5lZHU=