 Eva O. L. Lantsoght
 Ane de Boer
 Cor van der Veen2
- 1Politécnico, Universidad San Francisco de Quito, Quito, Ecuador
- 2Concrete Structures, Department of Engineering Structures, Civil Engineering and Geosciences, Delft University of Technology, Delft, Netherlands
- 3Ane de Boer Consultancy, Arnhem, Netherlands
Proof load testing of existing reinforced concrete bridges is becoming increasingly important as the current bridge stock is aging. In a proof load test, a load that corresponds to the factored live load is applied to a bridge structure, to directly demonstrate that a bridge fulfills the code requirements. To optimize the procedures used in proof load tests, it can be interesting to combine field testing and finite element modeling. Finite element models can for example be used to assess a tested structure after the test when the critical position could not be loaded. In this paper, the case of viaduct De Beek, a four-span reinforced concrete slab bridge, is studied. Upon assessment, it was found that the requirements for bending moment are not fulfilled for this structure. This viaduct was proof load tested in the end span. However, the middle spans are the critical spans of this structure. The initial assessment of this viaduct was carried out with increasingly refined linear finite element models. To further study the behavior of this bridge, a non-linear finite element model is used. The data from the field test (measured strains on the bottom of the concrete cross-section, as well as measured deflection profiles) are used to update the non-linear finite element model for the end span, and to improve the modeling and assessment of the critical middle spans of the structure. Similarly, an improved assessment based on a linear finite element model is carried out. The approaches shown for viaduct De Beek should be applied for other case studies before recommendations for practice can be formulated. Eventually, an optimized combination of field testing and finite element modeling will result in an approach that potentially reduces the cost of field testing.
Introduction
Proof load testing of existing reinforced concrete bridges is becoming increasingly important as an assessment method for existing bridges, since the current bridge stock in Europe and North America is aging (Lantsoght et al., 2017f). A proof load test serves as a direct verification of the performance of the bridge, and as a demonstration that it can withstand the prescribed loads. As such, this assessment method can be used when analytical models are insufficient. Situations when analytical models are insufficient are: when no structural plans are available (Aguilar et al., 2015), when there are large uncertainties on the structural capacity as the result of material deterioration or degradation (Lantsoght et al., 2017c), or when the analytical models cannot (fully) consider additional sources of resistance such as transverse load redistribution (Lantsoght et al., 2015) or compressive membrane action (Collings and Sagaseta, 2015).
In a proof load test (Grigoriu and Hall, 1984; Juntunen and Isola, 1995; Saraf et al., 1996; Ransom and Heywood, 1997; Faber et al., 2000; Cai and Shahawy, 2003; Anay et al., 2016), a load that corresponds to the factored live load is applied to the bridge structure, to directly demonstrate that a bridge fulfills the code requirements. The maximum load that needs to be applied to demonstrate that the bridge fulfills the code requirements is called the target proof load. This load is often large, which increases the probability of failure of the bridge during the load test. Therefore, it is important to monitor the structural responses during a proof load test. The measured structural responses are evaluated constantly during the test and are compared to predetermined thresholds that should not be exceeded during the test, the so-called stop criteria (Lantsoght et al., 2018b). When a stop criterion is reached, further loading can result in irreversible damage to the structure or even collapse. The relevant stop criteria can be taken from available codes and guidelines (Ministerio de Fomento - Direccion General de Carreteras, 1999; Deutscher Ausschuss für Stahlbeton, 2000; Frýba and Pirner, 2001; ACI Committee 437, 2013). Where the stop criteria in the available codes and guidelines are insufficient or do not cover the expected governing mode of failure for the structure, thresholds should be carefully selected or derived prior to the load test. When a stop criterion is exceeded in a proof load test before reaching the target proof load, further loading is not permitted. Depending on the highest load level that is achieved during the test, the bridge then may be found to fulfill lower demands or may require posting, a reduction in the number of lanes, strengthening, or demolition and replacement.
To optimize the procedures used in proof load tests, it can be interesting to combine field testing and finite element modeling of the bridge under consideration (Halicka et al., 2018). Typically, finite element models are used during the preparation of a proof load test. During the preparation stage, a linear finite element model can be used to determine the most unfavorable position of the load and the target proof load (Lantsoght et al., 2017e). These models are then usually not used for additional analysis after the proof load test, since the test itself serves as a direct assessment method.
However, finite element modeling is often used together with another type of field tests on bridges: diagnostic load tests (Fu et al., 1997; Velázquez et al., 2000; Chajes et al., 2001; Olaszek et al., 2014; Sanayei et al., 2016; Bonifaz et al., 2018). Diagnostic load tests are carried out at lower load levels than proof load tests. The measurements taken during a diagnostic load test can be used to quantify the difference between the analytical model used for assessment and the actual bridge behavior determined in the field. The analytical model can then be optimized with the measured data, resulting in a field-verified model. Then, a model for rating can be developed that includes the effects of mechanisms that can be reliably counted on at the ultimate limit state, which leads to an improved assessment. Diagnostic field tests are used to determine (Barker, 2001), amongst others, the actual stiffness of the structure including the non-structural elements such as parapets and barriers, unintended composite action, the influence of frozen bearings, the actual transverse distribution, and the actual lateral live load distribution.
In combination with dynamic load testing, methods have been proposed to update finite element models to capture the behavior under service loads. One method (Duan et al., 2005) proposes a hybrid optimization technique that combines the global searching capability of the chaos-based optimization technique with the high searching efficiency of the trust-region optimization technique. This proposed method was verified with the experimental results of a 14-bay steel frame that was subjected to a dynamic test. A second proposed method consists of a two-phase optimization procedure (Wang et al., 2010): the tower and the bridge are analyzed separately to reduce the number of structural parameters that would require optimization. This proposed method was verified with field test results and ambient vibration measurements of a steel box girder bridge. It should be noted that these existing methods have focused on: (i) steel structures, and (ii) low load levels. For the optimization of finite element models of concrete bridges under proof load levels and high magnitude loads, further research is needed before standardized and automatic procedures can be recommended.
In this paper, the case of viaduct De Beek is studied. During the proof load test on this viaduct, the critical span could not be tested, because the critical span is located over the highway. To test this span, it would be necessary to close the highway to ensure the safety of the traveling public. Since closing the highway would cause large driver delays, the first span, which is not directly above the highway, was tested instead. After the proof load test, a synergy between proof load testing and finite element modeling is sought to improve the assessment of the viaduct and the critical second span with the information obtained during the load test.
Description of Viaduct De Beek
Geometry
Viaduct De Beek (Koekkoek et al., 2016; Lantsoght et al., 2017a,d), built in 1963, is located in the south of the Netherlands, in the province Noord Brabant. The viaduct lies in the Beekstraat over the highway A67. The viaduct is a four-span reinforced concrete slab bridge, see Figure 1A. The length of the end spans is 10.81 m and the length of the mid spans is 15.40 m, see Figure 2A. The width of the superstructure is 9.94 m, which gives a carriageway width of 7.44 m. The thickness of the slab at the carriageway varies in the longitudinal direction between 470 mm and 870 mm and follows a parabolic shape, see Figure 2B. In the transverse direction, the thickness of the slab at the carriageway varies from 470 mm in the middle to 408 mm at the sides at the end supports, see Figure 2C, and similarly it varies from 870 mm in the middle to 808 mm at the sides at the mid supports.
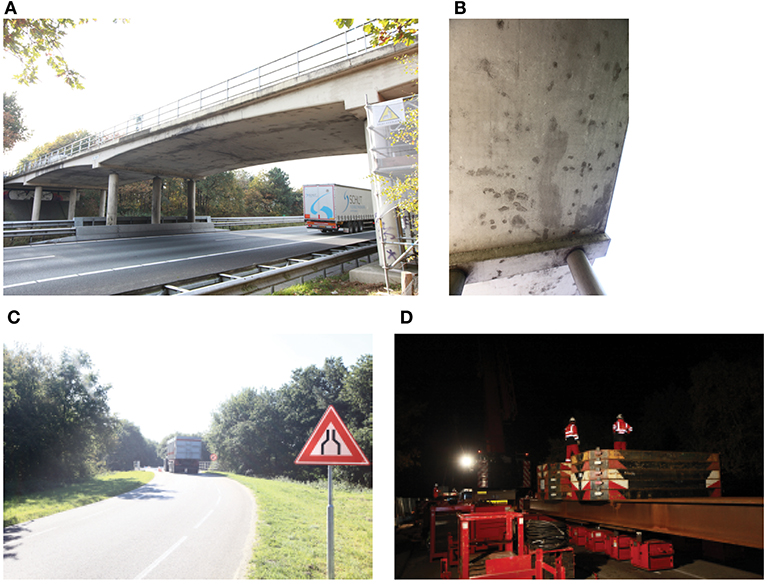
Figure 1. Photographs of viaduct De Beek: (A) side view; (B) material damage; (C) signposting of lane reduction; (D) execution of proof load test.
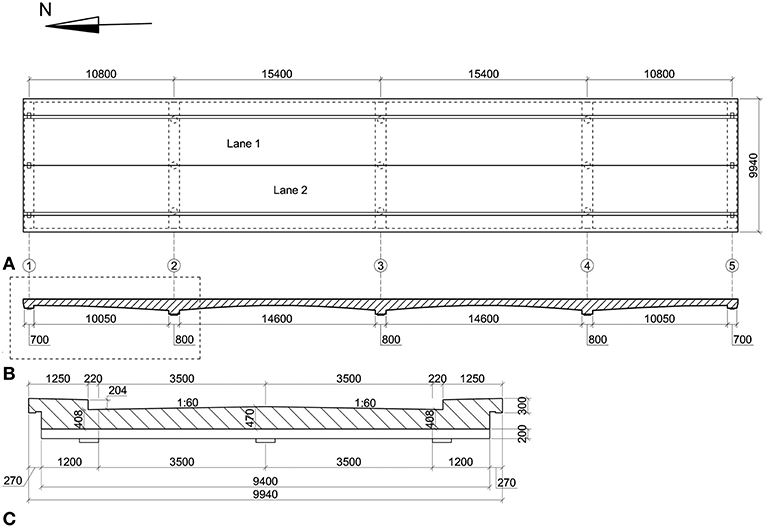
Figure 2. Geometry of viaduct De Beek: (A) top view; (B) longitudinal view; (C) cross-section at end supports. Units: mm.
Material Properties
The properties of the concrete and steel were measured by taking material samples. For the concrete compressive and tensile strength, nine core samples were taken. The characteristic value of the concrete compressive strength is fck = 44.5 MPa and the characteristic value of the splitting tensile strength is fctk = 4.4 MPa. The concrete can thus be categorized as C45/55 according to NEN-EN 1992-1-1:2005 (Comité Européen de Normalisation, 2005), which has a design compressive strength fcd = 30 MPa.
Based on three samples of the reinforcement steel, the measured average yield strength is fym = 291 MPa and the measured average tensile strength is ftm = 420 MPa. The reinforcement in the end spans (span 1 and span 4) consists of φ = 25 mm with a spacing of 93 mm (As = 5,259 mm2/m) and the reinforcement in the middle spans (span 2 and span 3) consists of φ = 25 mm with a spacing of 140 mm (As = 3,506 mm2/m).
Inspection and Assessment Results
Upon inspection (Willems et al., 2015), significant cracking was observed at the soffit of the slabs, see Figure 1B. This cracking raised concerns with regard to the durability of the bridge. An assessment of the viaduct led to the conclusion that the viaduct does not fulfill the code requirements for bending moment. The bending moment capacity in both the longitudinal and transverse direction was found to be insufficient in all spans. As a result of this assessment, the number of lanes for traffic on the viaduct was reduced from two lanes (one in each direction) to one single lane (Iv-Infra, 2015), see Figure 1C.
Results of Proof Load Tests
Viaduct De Beek was proof load tested in the end span. The position of the tested span is indicated with a dashed rectangle in Figure 2A. The middle spans are the critical spans of this structure, since the assessment of the middle spans resulted in the largest value for the Unity Check (ratio of load effect to capacity). The middle spans could not be tested as they are over the highway and would have required a closing of the highway during the load test, which was not permitted.
In November 2015, viaduct De Beek was subjected to two proof load tests at two positions in span 1. A full description of the preparation, execution, and post-processing of these proof load tests can be found in the report of the test (Koekkoek et al., 2016). The first proof load test studied the failure mode of bending moment, which is the governing failure mode for this span, and the second proof load test studied the failure mode of shear, for research purposes (Lantsoght et al., 2017a,b,d).
The load is applied with a system consisting of a load spreader beam, hydraulic jacks (equipped with load cells for real-time data visualization), and counterweights, see Figure 1D. The layout of the load application follows the design tandem of NEN-EN 1991-2:2003 (Comité Européen de Normalisation, 2003). The axle distance is 1.2 m. The center-to-center distance between the wheel prints in the transverse direction is 2 m. The size of the wheel print is 230 × 300 mm, which is the size used for the assessment of joints in the Netherlands, and which is different from the wheel print size of 400 × 400 mm of the Eurocode design tandem.
The critical position of the load depends on the considered failure mode. For bending moment, the critical position is found by moving the Eurocode design tandems in each lane, and finding the position that results in the largest sectional moment. This position is at 3.55 m between the face of the end support and the face of the design tandem. For shear, the critical position for reinforced concrete slabs (Lantsoght et al., 2013) results when the face-to-face distance between the load and the support is 2.5 dl, with dl the effective depth to the longitudinal reinforcement. For span 1, the governing distance is 1.1 m between the face of the end support and the face of the design tandem.
To determine the target proof load, the following procedure was followed:
1. In the linear finite element model of the bridge, the superimposed dead load and the Eurocode live load model are applied, including the load factors. The design tandems are placed at their critical position (depending on the studied failure mode).
2. The resulting sectional moment or sectional shear force (depending on the studied failure mode) is obtained from the output of the finite element model.
3. The Eurocode live load model is replaced by a single design tandem, the proof load tandem, at the critical position in the first lane.
4. The target proof load is the required load on the proof load tandem to get the same sectional moment or sectional shear force (depending on the studied failure mode) as with the total factored live load model.
Using this procedure results in a target proof load of 1,656 kN for the bending moment test and of 1,525 kN for the shear test.
The instrumentation during the proof load tests consisted of 4 laser distance finders, 16 LVDTs (linear variable differential transformers), 6 strain gages, and 7 acoustic emission sensors. The structural responses measured during the proof load tests were: vertical deflections of the slab and at the supports, crack opening, strains in the concrete, strains in the reinforcement steel, and acoustic emissions.
The load was applied in a cyclic manner. After each load cycle, all the measurements were evaluated, stop criteria were checked, and then the decision was made to allow the next load cycle. Figure 3 shows the loading protocol applied during the proof load test for bending moment. The maximum applied load during the bending moment test, including the self-weight of the jacks and loading plates, was 1,751 kN. For the shear test, the maximum applied load, including the self-weight of the jacks and loading plates, was 1,560 kN. With these applied loads, the end spans were shown to fulfill the code requirements. However, no direct assessment of the critical middle spans could be given based on the proof load test.
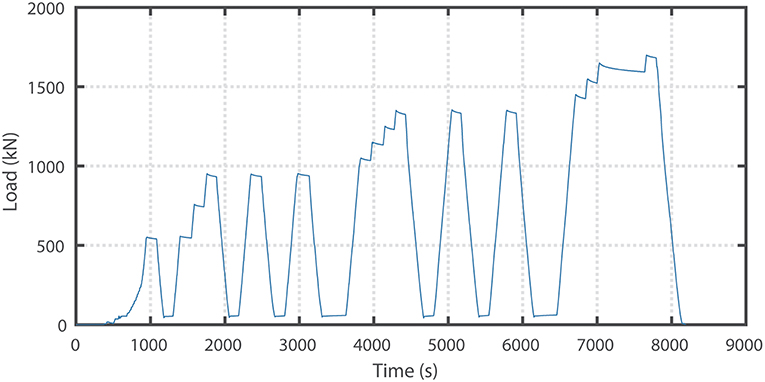
Figure 3. Loading protocol during bending moment test.
Description of Finite Element Models
Linear Finite Element Model
The initial assessment of this viaduct was carried out with increasingly refined linear finite element models. These models were developed in the finite element software DIANA FEA version 10.2 (DIANA FEA BV, 2017).
The first linear finite element model was developed for the assessment of the bridge, and to prepare the proof load test. In this first model, the slab is modeled with quadratic shell elements. The elements are 500 × 500 mm with a variable thickness from 470 to 870 mm. The non-structural elements that contribute to the stiffness of the structure (sidewalks and barriers) are not modeled in the initial model, but are instead applied as an equivalent permanent load. The supports are modeled as rigid supports and ideal supports. The effect of the cracked concrete on the overall stiffness is taken into account by using orthotropic behavior with a Young's modulus of the concrete of 14 GPa in the cracked direction and of 36 GPa in the uncracked direction. This approach allows for modeling cracking in a linear finite element model (note that this approach differs from the non-linear finite element model, in which the development of cracking in the model will be explicitly taken into account). This model of the slab is subjected to a load combination that consists of the self-weight (and equivalent permanent load of the elements that are not modeled), the wearing surface, and the live load combination Load Model 1 from NEN-EN 1991-2:2003 (Comité Européen de Normalisation, 2003). The wheel print of the design tandem of 400 × 400 mm was enlarged to take into account vertical load spreading under 45° to the center of the slab.
Non-linear Finite Element Model
To further study the behavior of this bridge and to see if the currently imposed load restriction can be removed, a non-linear finite element model is also used. In the Netherlands, guidelines are available for the use of non-linear finite element models in RTD 1016-1:2017 (Rijkswaterstaat, 2017a) and with a summary validation report in RTD 1016-2:2017 and separate validations for reinforced beams, prestressed beams, and slabs in RTD 1016-3a:2017, RTD 1016-3b:2017, and RTD 1016-3c:2017, respectively (Rijkswaterstaat, 2017b,c,d,e). The scope of these guidelines is reinforced concrete and prestressed concrete, and all bridge types (girder bridges, slab bridges, box girder bridges…) as well as tunnels and culverts. The safety format applied in RTD 1016-1:2017 (Rijkswaterstaat, 2017a) is the same as the safety format used in the fib Model Code 2010 (fib, 2012). Since these guidelines have been developed in the Netherlands in different (draft) versions over the past decade, quite some practical experience with the use of these guidelines already exists. This experience teaches us that when a non-linear finite element model is used for the assessment of an existing bridge, an additional capacity of between 10 and 30% can be found as compared to when a combination of a linear finite element model and sectional capacity calculations is used for the assessment.
In a first version of the non-linear finite element model, the situation with one traffic lane (current situation) is studied. The model is developed with DIANA version 10.1 (DIANA FEA BV, 2017). For this case, the loads applied to the slab in the model are one design tandem of 600 kN and a distributed lane load of 9 kN/m2. In the non-linear finite element model, the load is applied incrementally by increasing a load factor. For the assessment calculations according to RTD 1016-1:2017 the load factor on the applied live load in the model should increase to 1.6 when non-linear finite element models are used. The value 1.6 is the product of a model factor of 1.06, a factor considering the uncertainties on material properties and the geometry of 1.2, and the live load factor of 1.25 for the Usage level from the Dutch guidelines for the assessment of bridges RBK (Rijkswaterstaat, 2013). Since viaduct De Beek lies in a local road that is subjected to <20,000 trucks per year, a reduction factor for the traffic of 0.9 according to Table NB 4.1 from NEN-EN 1991-2/NA:2011 (Code Committee 351001 2011) can be used. The final load factor that thus has to be achieved for viaduct De Beek is 1.44.
Figure 4 shows the results of the initial non-linear finite element for a load factor of 0.6. At this load level, cracking occurs over the middle support and exceeds the requirements for serviceability (see Figure 4a for a top view, Figure 4b for a side view, and Figure 4c for a detail). The maximum crack width is 0.4 mm. Comparing Figures 4a,b shows that the crack over the middle support occurs in the cross-section right next to the transverse support beam. The detail in Figure 4c shows the cracking strains at the end support (lower plot) and at the mid support (upper plot), and includes a small part of the bridge deck (cantilevering out from the support beam).
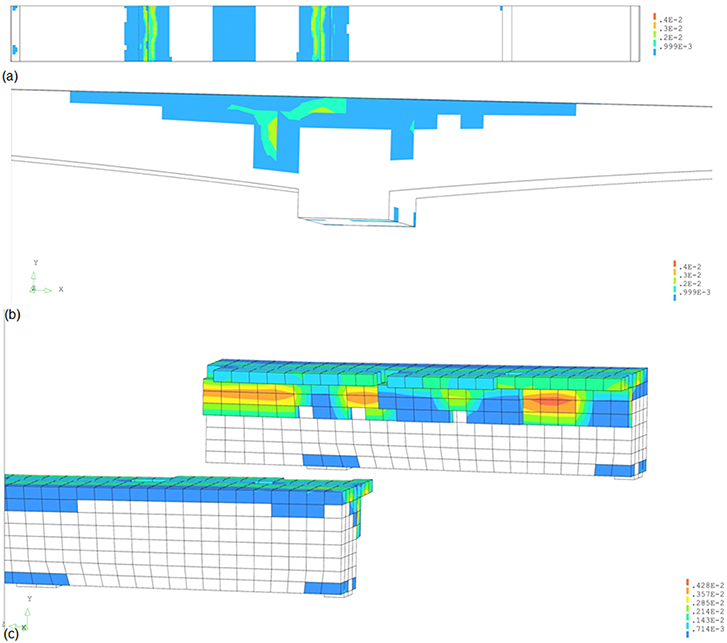
Figure 4. Overview of results of non-linear finite element model for load factor of 0.6: (a) top view showing cracking at middle support; (b) side view showing cracking at middle support; (c) detail of cracking over end support (bottom) and mid support (top), showing support beam.
Figure 5 gives an overview of the results of the non-linear finite element model with one traffic lane for the maximum required load factor of 1.44. The maximum strain of 1% occurs at support 3 (see Figures 5A,B for the general view of the results in span 2, and Figures 5C,E for the detailed results at support 3). The associated crack width is 1 mm. Figure 5D shows that the tension steel yields at this load level. Failure does not occur at this load level, so the results of the non-linear finite element model show that the bridge fulfills the requirements for one traffic lane.
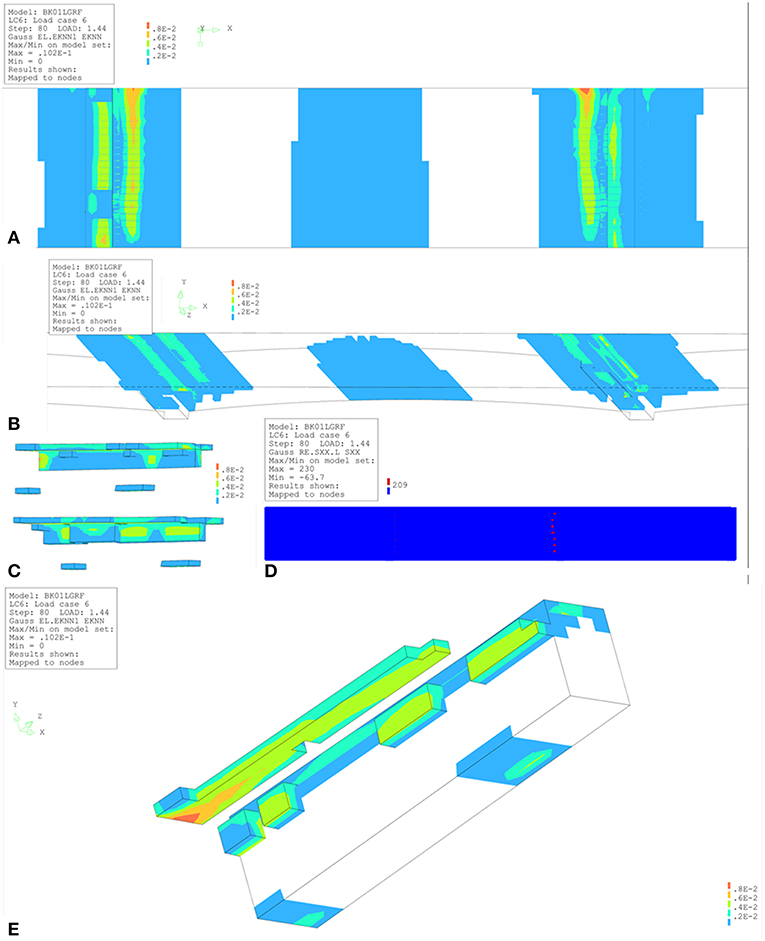
Figure 5. Overview of results from non-linear finite element model with one traffic lane for a load factor of 1.44: (A) detailed bottom view; (B) detailed top view; (C) detail of support 2 (top) and support 3 (bottom); (D) steel stresses, where the red dots indicate yielding of the steel; (E) results for support 3 where the maximum strain is 0.01 and the crack width equals 1 mm. εknn is the cracking strain.
Since the results in Figure 5 indicate that the bridge fulfills the requirements for one lane of the traffic (based on the current restriction), in a next step the live loads corresponding to two lanes of traffic (original situation) were applied to the model. Figure 6 shows the results in terms of the load-deflection diagram for the case with one lane of traffic and for the case with two lanes of traffic. The load is expressed based on the load factor on the live load. The results in Figure 6 show that the load factor of 1.44 can be achieved for one lane of traffic. For the case with two lanes of traffic, Figure 6 shows that failure occurs for a maximum load factor of 0.6. As such, the results of the initial non-linear finite element model show that the bridge does not fulfill the code requirements for two lanes of traffic.
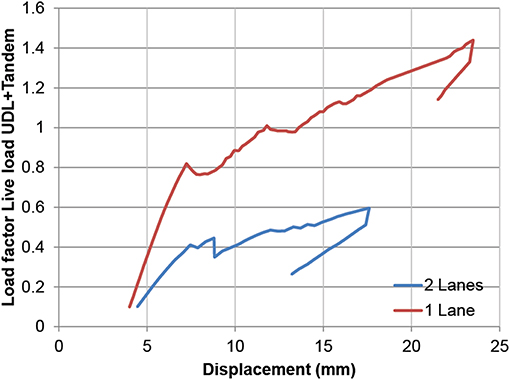
Figure 6. Load-displacement diagram for the situation with one lane and two lanes of traffic.
Assessment With Optimized Finite Element Model
Optimized Linear Finite Element Model
Updating by Refining Modeling of Structure
The initial linear finite element model is used to assess a tested structure after the test, since the proof load test cannot be used to evaluate the critical middle spans (Lantsoght et al., 2018a). In a first refinement of the initial finite element model, quadratic solid elements are used instead of quadratic shell elements. The solid elements have a size of 100 mm ×140 mm ×73 mm/140 mm. The effect of cracking on the stiffness is again taken into account by using orthotropic properties with a Young's modulus of 14 GPa in the cracked direction and 36 GPa in the uncracked direction. Figure 7A gives an overview of the improved finite element model. This figure shows that solid elements are used in spans 1, 2, and half of span 3, and that shell elements are used in the other half of span 3 and in span 4. In other words, the part of the bridge that was tested and is subsequently assessed is modeled in a refined manner by using solid elements (as compared to the model with shell elements that was used for preparation of the test). Figure 7B shows a detail of the meshing of the finite element model at the support. Figure 7C shows the bottom view of the entire model, and Figure 7D shows the top view of the entire model. The applied load on the improved finite element model is the combination of the self-weight (including the equivalent load of the non-structural members), the wearing surface, and live load model 1 from NEN-EN 1991-2:2003 (Comité Européen de Normalisation, 2003). Since solid elements are now used, the actual size of the wheel print of the design tandem (400 ×400 mm) is applied to the model of the slab.
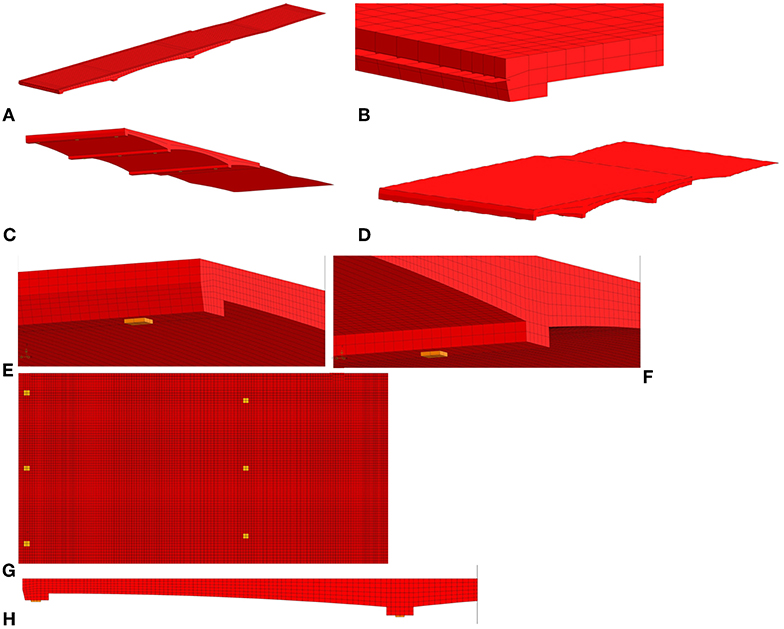
Figure 7. Overview of optimized finite element models: (A) overview of first model, showing different elements used; (B) detail of support in first model; (C) bottom view of first model; (D) top view of first model; (E) detail of elastomeric bearings at end support in second model; (F) detail of elastomeric bearings at mid support in second model; (G) overview of positions of bearings in span 1 and half of span 2 in second model; (H) side view of span 1 in second model.
A next improvement of the model included a more realistic modeling of the support conditions. Viaduct De Beek is supported by elastomeric bearings, so in the improved model the elastic properties in the gravity direction of the bearings were modeled. The second part of Figure 7 shows the model with elastomeric bearings, with the detail of the end support in Figure 7E, the detail of the mid support in Figure 7F, the top view showing span 1 and the supports in Figure 7G, and the side view showing span 1 and the supports in Figure 7H. By using the properties of the bearings, the support beam is subjected to a lower bending moment in the longitudinal direction, and the bending moment at mid span increases.
The next improvement to the linear finite element model is taking into account the non-structural elements. In this case, the curb was modeled, and as such the stiffness of this non-structural element was considered. As a result, the bending moment and shear at the critical cross-section become smaller. However, counting on the full stiffness of the curb may not correspond to the actual structural behavior. The first reason is that the curb was built later, so phased construction should be considered in the model. Secondly, the reinforcement that connects the slab and the curb is limited (φ 12 mm at 200 mm o.c.), so that full bond and load transfer between the slab and the curb may not be assumed.
A final optimization of the linear finite element model is considering the actual reinforcement layout as shown in Figure 8.
Figure 8. Layers of reinforcement in optimized model.
Assessment With Optimized Linear Finite Element Model
The optimized linear finite element model is then used to improve the assessment of viaduct De Beek. Table 1 gives an overview of the results in terms of the bending moment capacity MRd, the acting bending moment MEd of the initial and updated model, and the resulting Unity Check UC (MEd/MRd) of the initial and updated model. The results are given for the middle spans (spans 2 and 3), end spans (spans 1 and 4) and the middle support (supports 2 and 4).
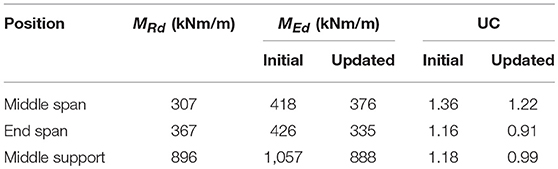
Table 1. Bending moment capacity MRd, acting bending moment MEd, and resulting Unity Check (UC) for initial and updated linear finite element model.
The value of the acting bending moment MEd is not the peak value resulting from the linear finite element but a value averaged over a certain distance in the transverse direction. The transverse distribution width depends on rules of thumb. In the Netherlands, the transverse distribution is either taken as 2dl or 3 m (the notional lane width), and no single codified provision or guideline exists to date. Therefore, for this study, a number of different values were studied for the transverse distribution: 1.46 (≈ 2dl), 1.74, 1.94, 2.24, and 2.42 m. The value of MEd at the middle support reported in Table 1 (888 kNm/m in the updated model) is based on a distribution width of 1.94 m. When we use a distribution width of 2.42 m instead, the value of MEd at the middle support reduces to 841 kNm/m. The justification for using a wider distribution width lies in the measured strains during the proof load test, see Figure 9. One can see that the variation in strains in the transverse direction is limited, indicating a larger distribution width in the transverse direction. The distribution width also appears to be a function of the load level: for the lowest load level the distribution width is about 4.5 m and for the highest load level, it is about 2 m.
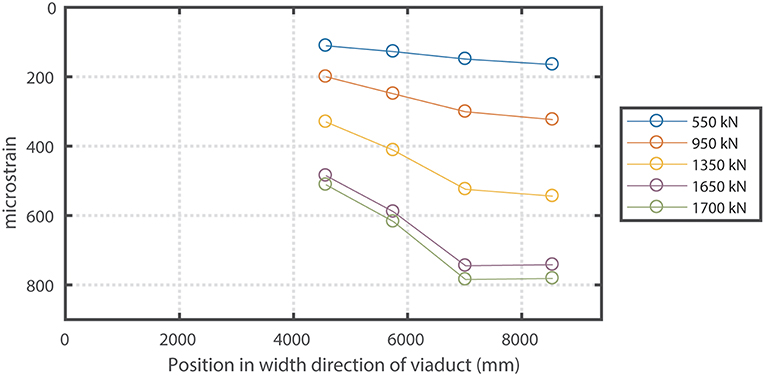
Figure 9. Measured strains at bottom of concrete cross-section during proof load test for bending moment for different load levels.
A section fulfills the code requirements when the Unity Check UC ≤ 1. Based on the results in Table 1, we can conclude that with the updated linear finite element model the sections at the end span and middle support fulfill the code requirements, but that the section in the critical spans does not fulfill the code requirements for one lane of traffic based on the presented calculations. The acting bending moment MEd is the sum of peak values of 96 kNm/m (contribution of the permanent loads) and 291 kNm/m (live loads), which gives a peak value of 387 kNm/m in total. Averaging the peak results in the reported value in Table 1 of 376 kNm/m. The capacity for live load is 211 kNm/m, or 72.5% of the demand of 291 kNm/m. As such, a maximum design tandem load of 72.5% of 600 kN, i.e., 435 kN should be the maximum allowable load. This load is slightly below the 450 kN design tandem of the VK45 road class in the Netherlands. The next step is then to further refine the calculations and use a non-linear finite element model.
Optimized Non-linear Finite Element Model
Updating With Proof Load Test Results
The data from the field test (measured strains on the bottom of the concrete cross-section and in the steel reinforcement, as well as measured deflections) can be used to update the non-linear finite element model for the end span. The reader should notice that the non-linear finite element models of the proof load test are based on average material properties and do not use load factors, as the goal of this part of the study is to come to a model that represents the field test as closely as possible. Then, for assessment, characteristic material properties will be used and a load factor for the live loads will need to be achieved. No standardized or automatic optimization procedure was used for this purpose, as we considered engineering judgment and the use of plausible ranges of input parameters very important for this study. The model output that was evaluated for the optimization process were the deflections (magnitudes and profiles in the transverse and longitudinal direction), as well as the strains (magnitudes and profiles).
In the following paragraphs, four iterations of model optimization will be shown: (1) FEA1 considers the support stiffness to match existing cracking patterns, (2) FEA2 is optimized for matching deflections with the proof load test results, (3) FEA3 balances optimizing deflections in longitudinal and transverse deflections as well as strains, and (4) “FEA Final” considers the effect of modeling the contribution of the curb.
A first step in optimizing the model (resulting in “FEA” or “FEA1” in the figures) is to modify the stiffness of the supports to match the existing cracks (Figure 1B) in the bridge. Reducing the stiffness of the supports results in a situation in which mostly cracks in spans 2 and 3 were observed. Note that the initial finite element model (Figure 5) results in cracking over the supports. The optimization of reducing the stiffness of the support thus matches better the real situation. The results of the comparison between the measured and analytically determined deflection profiles is shown in Figure 10A for the longitudinal profiles and in Figure 10B for the transverse profiles. These profiles are caused by the maximum proof load applied during the shear test. The actual behavior of the bridge is stiffer than the behavior observed in the non-linear finite element model based on the initial assumptions. The deflection at the support is also smaller in reality than in the model. A first step is thus to improve the boundary conditions in the model.
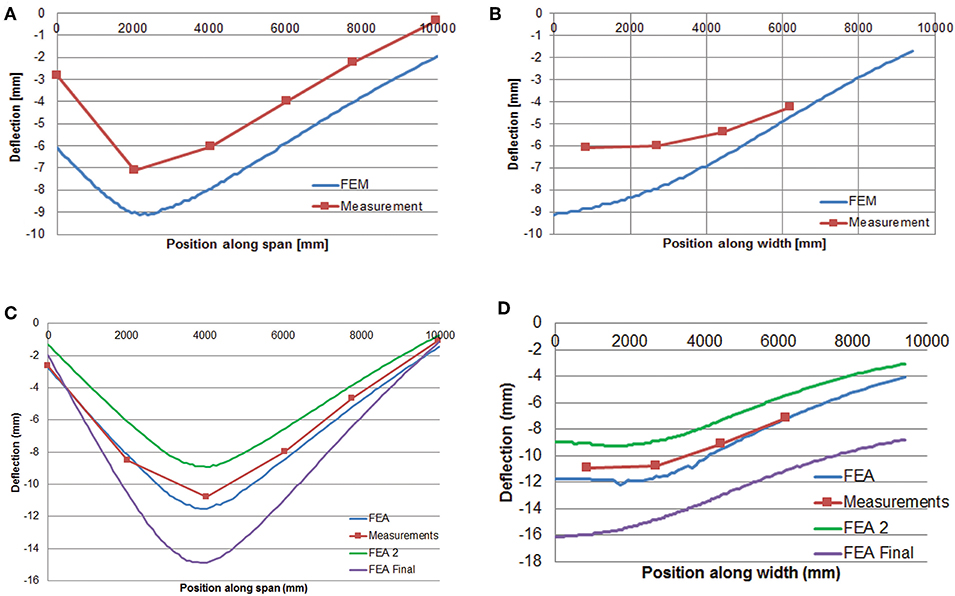
Figure 10. Comparison between measured deflection profile and profile resulting from non-linear finite element model at maximum load during proof load test: (A) first updated model, longitudinal deflection profile for shear test; (B) first updated model, transverse direction profile for shear test; (C) all models, longitudinal deflection profile for bending moment test; (D) all models, transverse deflection profile for bending moment test.
The second optimization step (resulting in FEA2) is based on matching the deflections measured in the field with the deflections in the model. The deflections are optimized to match the longitudinal profile. The results for the maximum load applied during the bending moment test are shown in Figure 10C for the longitudinal direction and in Figure 10D for the transverse direction.
The third version of the model (resulting in FEA3) is based on optimization to match the deflections in both the longitudinal and transverse direction, as well as by comparing the strains in the non-linear finite element model and the measured strains. The optimization procedure is shown in Figure 11A for the bending moment test and in Figure 11B for the shear test. For the bending moment test, the strains are the averaged values over the entire last load step. For the shear test, two measured strains are shown: the strains measured at the maximum load (1,509 kN), which was a short peak during the penultimate load step, and the averaged values over the entire last load step. The strains in the plots are corrected for the measurement of the strains caused by temperature and humidity, and are also corrected for the output at a load of 0 kN.
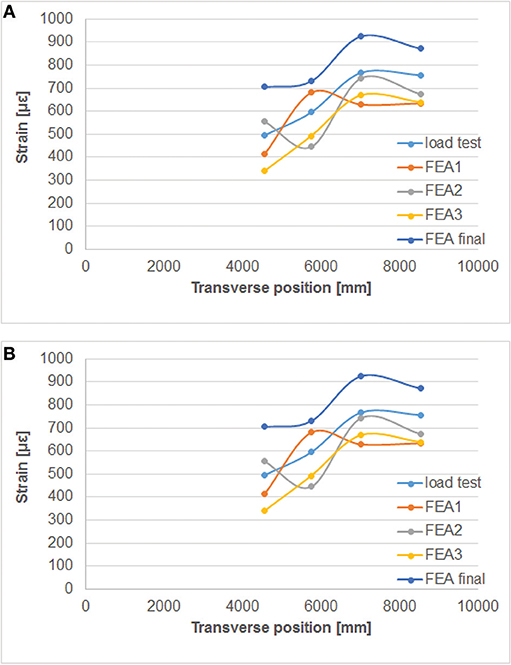
Figure 11. Comparison between measured strains in transverse direction to strains from finite element models, with FEA2 and FEA3 the optimized models and FEA final the final model: (A) bending moment test; (B) shear test.
In a last optimization step (indicated with “FEA final” in the figures), the influence of the stiffness of the curb is evaluated. Since the reinforcement that connects the slab and the curb is limited, it may be that the curb does not contribute to the overall structural behavior. Figure 12 shows the outcome of the models with and without the curb as compared to the measured load-deflection response. Based on these results, we can conclude that at lower load levels the curb does not contribute to the overall structural behavior. At higher load levels, some contribution of the curb seems to occur. It is however a conservative approach to remove the contribution of the curb.
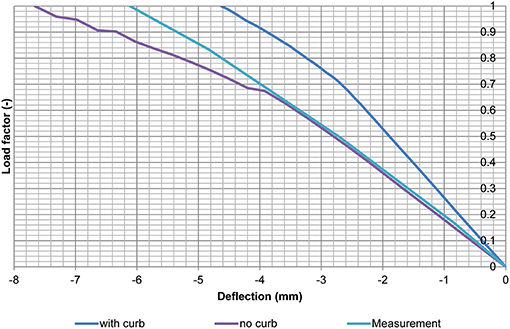
Figure 12. Comparison between load-deflection diagram with contribution of the curb and without the curb to the measured load-deflection response. The load factor is F/1,500 kN.
As can be seen, several models have been developed, and the final selected model (“FEA final”) has the most uniform behavior for the deflections and strains, for both the test at the bending moment position and the shear position, and the outcome of the model is on the conservative side. The results show that with the optimized model, the error on the strains at the bending moment position is maximum 12%, whereas for the shear position this error is maximum 61% when the results for the maximum load are considered and 58% when the results for the final load step are considered. The error on the model FEA3 is smaller, but the results are not always on the conservative side. Therefore, it was decided to select the model without the contribution of the curb as the final model.
The shape of the plot of the strains in Figure 11A displays a local maximum or minimum value of the strains (for FEA1 and FEA2, respectively) caused by local cracking. This effect is not present anymore in FEA3 and the final finite element model. For both the shear and bending moment test, the final finite element model follows the same overall shape as the profile measured during the test, which is an improvement as compared to the other models. The cracking found in the final finite element for the bending moment position can be observed based on the strain plots shown in Figure 13A and for the shear position in Figure 13B. For the shear position, the maximum cracking strain is εknn = 2,044 με and the maximum crack width is calculated as 0.205 mm when the element length of 146 mm is considered, over which an average strain occurs of 1,470 με. An overview of the development of the principal strains and cracking strains in the shear test at the position where the largest cracking strain is found is given in Figure 14 as a function of the load factor (F/1,500 kN).
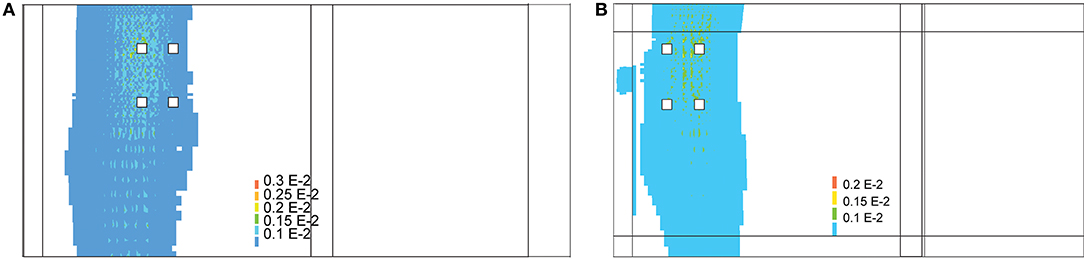
Figure 13. Strains in finite element model: (A) bending moment position; (B) shear position (showing position of tandem).
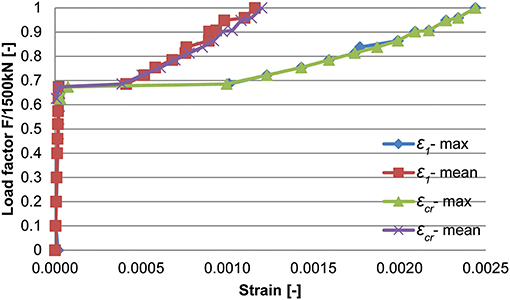
Figure 14. Development of principal strain ε1 (mean value over element and maximum of the 27 calculation points per element) and cracking strain εcr as a function of the load factor (F/1,500 kN) at critical element for shear position.
The final finite element model can also be evaluated based on the plots of the deflection. Figures 10C,D show the comparison between the output of the final finite element model in the longitudinal and transverse direction, respectively, and the measurements for the bending moment position. In addition, the comparison between the output of the final finite element model in the longitudinal and transverse direction with the measured deflections for the shear position is given in Figures 15A,B, respectively. To come to a better representation of the shear test, a possibility would be to change the cracking model from rotating cracking to fixed cracking at a predetermined value of the cracking strain. As compared to the original non-linear finite element model, developed without the knowledge of the field measurements, the current optimized model results in a better correspondence between the measured and analytical deflections, cracking patterns, and strains.
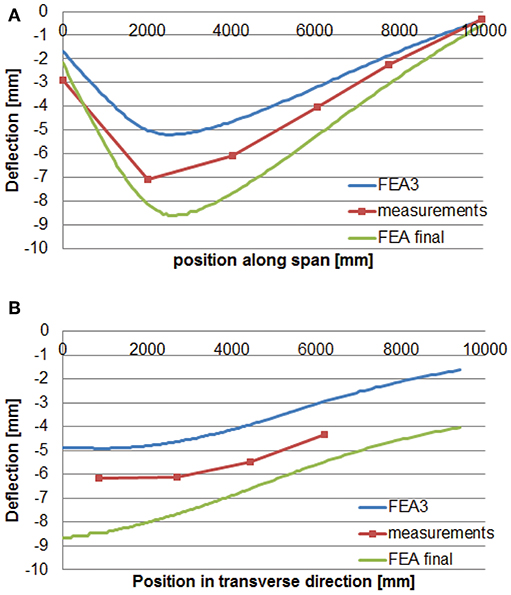
Figure 15. Comparison between deflection as measured during proof load test and as obtained with the final finite element model for the shear position: (A) longitudinal direction; (B) transverse direction.
We can see here that selecting the final finite element model requires balancing the performance of the model across the two test positions, and for both strains and deflections. Whereas, an earlier model was fully optimized to fit the deflections in the bending moment test (see Figures 10C,D), this model did not result in the best performance overall. Selecting the best model requires engineering judgment, as one can see from the previous discussions.
Assessment With Optimized Non-linear Finite Element Model
The improved model of the proof load test can be used to better estimate the behavior in the spans that were not tested. For the assessment, the characteristic material parameters were used instead of the average (measured) parameters used for the development of the field-verified model. As such, the model with characteristic material properties can be used to come to a more realistic assessment for the critical middle spans of the structure.
The maximum load factor that was found is 1.8 for one lane of traffic, which is larger than the required factor of 1.44. The resulting cracking at the top, bottom, and side in the model are shown in Figures 16A–C, respectively. The maximum crack strain is εknn = 9,020 με. To find the maximum crack width, the average strain 7,250 με over 150 mm is used, which gives wmax = 1.08 mm. Figure 17 shows the load-displacement diagram with the load factor on the y-axis. As the maximum load factor is 1.8, we can conclude that the bridge fulfills the requirements for one lane of traffic. These results can be compared with the results of the initial finite element model in Figure 6, where a maximum load factor of 0.6 was found for two lanes of traffic and 1.44 for one lane of traffic. The field-verified model, adjusted for the use of characteristic material parameters, thus shows that the load-carrying capacity of the bridge is larger than determined with the originally developed non-linear finite element model, as expected. The non-linear finite element model also gives an improvement when comparing the assessment result based on the linear finite element model (for which load posting was required for one lane of traffic) to the result based on the non-linear finite element model (which shows that the requirements for one lane of traffic are fulfilled).
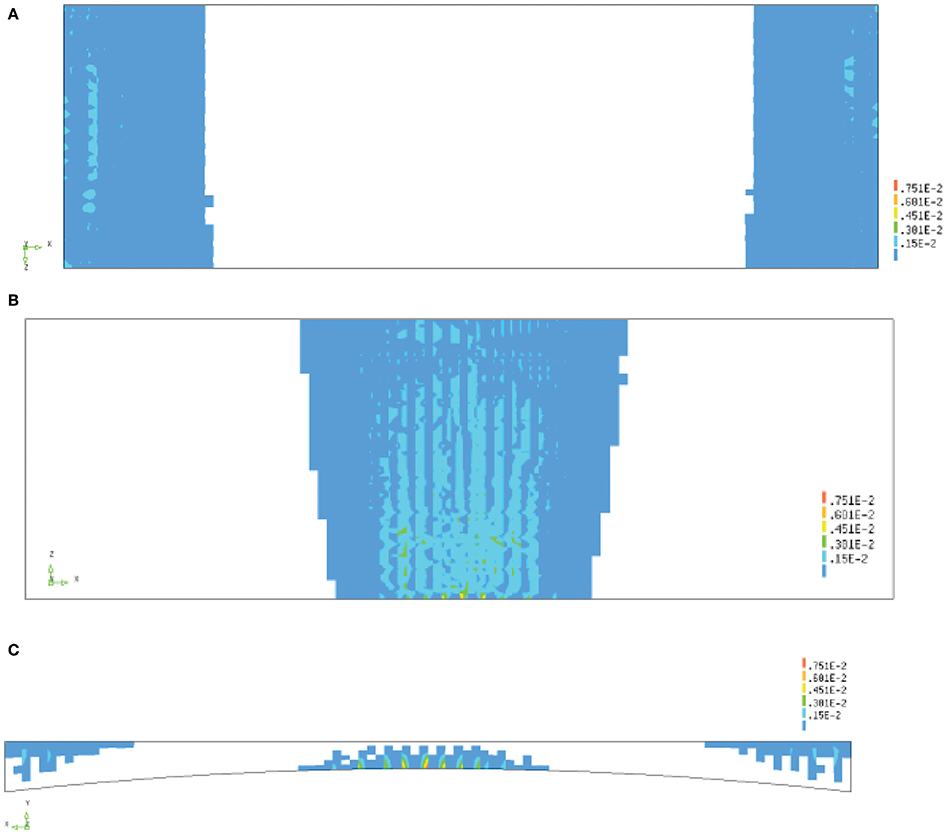
Figure 16. Cracking for load factor of 1.8: (A) top view showing cracks over mid supports; (B) bottom view for cracks at midspan for span 2; (C) side view of cracking over support and at midspan for span 2.
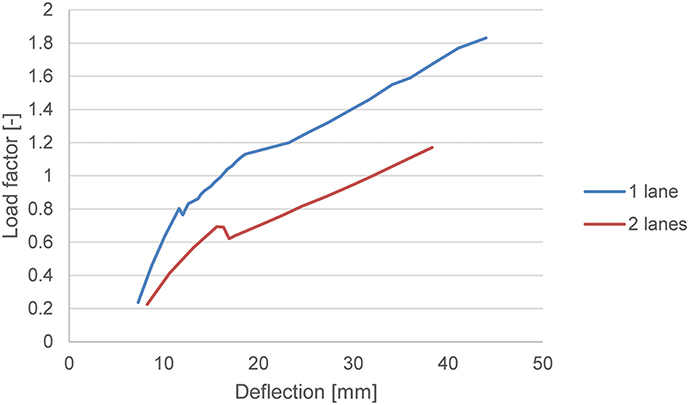
Figure 17. Load-displacement diagram for assessment of span 2, showing the applied live load in terms of a live load factor for one lane of traffic and two lanes of traffic.
Since the assessment with the non-linear finite element model shows that viaduct De Beek fulfills the code requirements for one lane of traffic load, the same model is used for evaluating the design situation with two lanes of traffic. Figure 17 shows the load-displacement diagram for the situation with two lanes of traffic. A maximum load factor of 1.17 is now reached. In other words, the traffic loads should be restricted to 81% of the regular traffic and a load posting should be applied to the bridge when two lanes of traffic are permitted on the bridge. Comparing Figure 6 (load factor 0.6 for two lanes of traffic) and Figure 17 (load factor 1.17 for two lanes of traffic) shows the benefit of including the results from a proof load test on a non-linear finite element model.
Discussion
The previous analyses show how field test data as well as details of the structure (reinforcement layout, support conditions, non-structural elements) can be incorporated into the models to improve the assessment of an existing bridge. When the measurements obtained during the proof load test are included, the result is an improved model for the entire structure, which uses the field data of the end span. This improved model then results in an improved Unity Check when linear finite element models are used, or an improved estimation of the maximum load factor (with target value 1.44) when non-linear finite element models are used.
The finite element models are based on the uncracked stiffness of the concrete. This assumption may explain the differences between the model and the measured deflections and strains. In the non-linear finite element model, cracking occurs as the load increases, but the existing cracks in the bridge were not modeled. Furthermore, recently, diagnostic load tests have been carried out on this bridge: the strains resulting from three vehicle types (six runs per vehicle type) have been measured, which can improve the assumptions regarding the stiffness of the structure. With these data, both the concrete compressive strength (which was determined by taking core samples) and the stiffness can be used as input values for the finite element model. These vehicles can also be placed as preloading on the model, to introduce cracks into the model before applying the proof load on the model, and thus including existing cracks into the model. A preliminary study on the effect of precracking is shown in Figure 18A for the bending moment position of the proof load test and in Figure 18B for the shear position. Since for loading with the 600 kN vehicle, no cracks occurred in the slab, the effect of precracking was taken into account by lowering the modulus of elasticity of the concrete Ec. When 90% of the original value of Ec is used in a new model, the maximum displacement increases with 0.9 mm and becomes 9.8 mm, see Figure 18A. The maximum displacement in the experiment was 10.8 mm. As such, using a reduced value for Ec could provide an additional improvement of the modeling of the non-linear finite element model. Similar observations are drawn from the shear position, as indicated in Figure 18B.
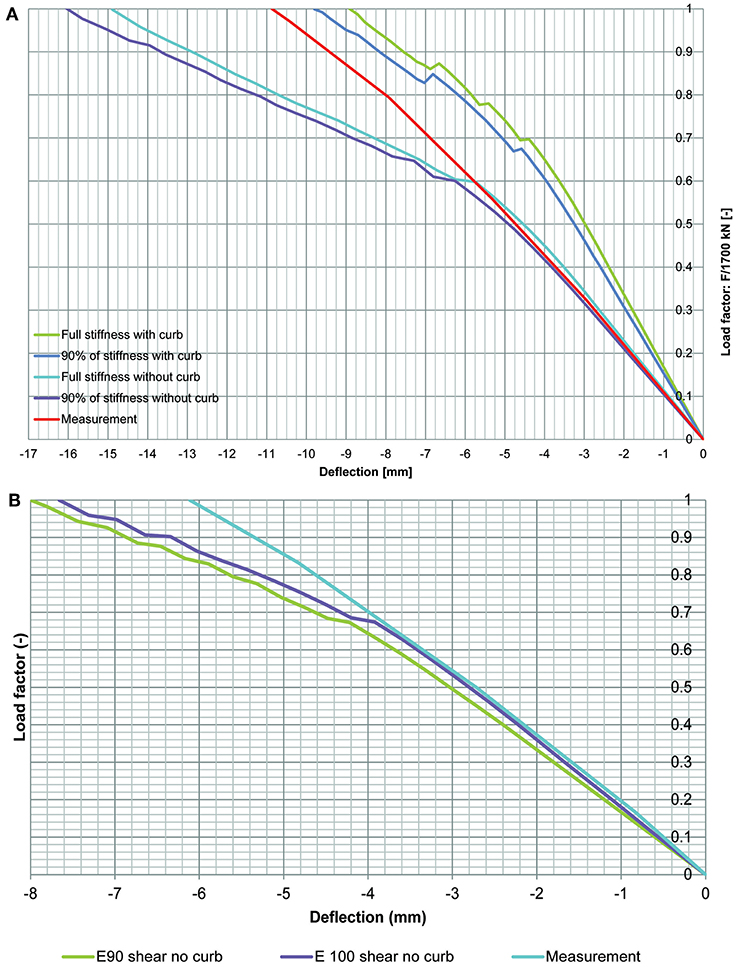
Figure 18. Comparison between load-displacement diagram, for the case with full E and 90% of E: (A) for proof load testing location for bending moment in span 1; (B) for proof load testing location for shear in span 1.
When comparing the results of the model without the curb and with the curb in Figure 18A, we can observe that the measured structural response lies in between the response with and the response without the curb. Since the reinforcement that ties the curb to the deck is rather limited (φ 12 mm at 200 mm o.c.), it is a conservative approach to leave out the contribution of the curb. However, the experimental results show that the curb has some effect on the overall structural response. A possible step for improvement could thus be to assign a partial contribution to the curb. To find out the contribution of the curb, one could study the response for load factor 1 and find out for which percentage contribution of the curb the measured deflection can be obtained. To model the contribution of the curb, a possible solution is to add interface elements between the curb and the slab. As one can observe in Figure 18A, the initial structural response of the measurements corresponds to the model without the curb. Then, as the load increases, redistribution of load to the curb takes place, and the contribution of the curb can be activated. These steps are however outside the scope of the present study.
One possible future application of this approach is the combination between non-linear finite element modeling and non-contact measurement techniques. If we can scan the entire surface of the span that is being tested and can obtain the full surface response of displacements, we can then optimize the non-linear finite element model in such a way that the measured and modeled surface responses are as similar as possible.
The comparison between the initial and final non-linear finite element model shows that, for this case, having a better understanding of the bridge behavior, based on the field observations and measurements during the proof load test, results in the conclusion that the bridge fulfills the code requirements for one lane of traffic. However, developing the field-verified model based on the proof load test in span 1 turned out to be more difficult than expected initially. Many choices need to be made in this process, and further studies on other bridges seem to be necessary to come up with a general recommendation to couple non-linear finite element models with proof load tests. This paper indicates that the combination of non-linear finite element models with proof load tests can be valuable for cases where access to the site and the most critical position of the viaduct may be limited. However, further research is necessary to specify the way in which the proof load test results should be used to update the original non-linear finite element model, which is not as straight-forward as for linear finite element models. Further research is important, so that this method can be used for an optimal combination of field testing and finite element modeling, in a way that can reduce the costs of field tests. This first case study shows that the first results with this approach are promising.
Summary and Conclusions
Proof load testing can be a valuable tool for the assessment of existing bridges when the uncertainties on the capacity are too large to use analytical assessment methods. This paper discusses the case of viaduct De Beek, which was found analytically to not fulfill the code requirements for bending moment in none of its four spans. As a result, traffic is currently only permitted on one lane for this bridge. The most critical spans, with the largest Unity Check, are spans 2 and 3. These spans are directly over the highway. Proof load testing of these spans would require closing of the highway, which was not a feasible option. Therefore, span 1 was subjected to a proof load test at a position resulting in the largest sectional moment and a position resulting in the largest sectional shear. The proof load test demonstrated that span 1 fulfills the code requirements for two lanes of traffic.
To extrapolate the results of the proof load test on span 1 to the critical span 2, two approaches were followed: using linear finite element models, and using non-linear finite element models. The linear finite element model was updated by making the following changes: use of solid elements instead of shell elements, adjusting the stiffness of the supports to represent the actual bearing stiffness, using the reinforcement layout as given on plans, and using a larger distribution width for the peak bending moment. Including these optimizations shows that the bridge does not fulfill the code requirements for one lane of traffic.
The non-linear finite element model was updated by making the following changes: using different assumptions for the material modeling, adjusting the stiffness of the supports to represent the actual bearing stiffness, evaluating the contribution of the curb, and modeling the reinforcement layout completely as given on the plans. The measured structural responses during the proof load test in span 1 and the responses determined in the non-linear finite element model were compared to evaluate the influence of changing parameters. The responses that were evaluated were strains and deflection profiles in longitudinal and transverse directions, for the bending moment and shear proof load tests. However, this exercise shows that there is no single model that matches each of these outputs completely, and that many choices are left to the engineer. As such, our recommendation at this moment is to apply this approach to more case studies, so that recommendations for the coupling of proof load tests and non-linear finite element modeling can be developed. This first application shows that the updated non-linear finite element model can be used to demonstrate that the bridge fulfills the code requirements for one lane of traffic, or that two lanes of traffic with posting can be used.
Data Availability
The datasets used for this study are available on request to the corresponding author.
Author Contributions
EL: analysis of proof load test results, manuscript writing. AdB: finite element modeling, manuscript review and editing. CvdV: guidance with assessment, modifications to manuscript. DH: coordination of load testing research.
Funding
This research was funded by the Dutch Ministry of Infrastructure and Water Management (Rijkswaterstaat) and the Province of Noord Brabant.
Conflict of Interest Statement
AdB was employed by company De Boer Consultancy, however company De Boer Consultancy was not involved with this study in any capacity.
The remaining authors declare that the research was conducted in the absence of any commercial or financial relationships that could be construed as a potential conflict of interest.
Acknowledgments
The authors wish to express their gratitude and sincere appreciation to the Dutch Ministry of Infrastructure and the Environment (Rijkswaterstaat) and the Province of Noord Brabant for financing this research work. The contributions and help of our colleagues Albert Bosman, Sebastiaan Ensink, Rutger Koekkoek, and Yuguang Yang, and of former student Werner Vos of Delft University of Technology are gratefully acknowledged. The authors also would like to thank Frank Linthorst and Danny den Boef of Witteveen+Bos, responsible for the logistics and safety, and Otto Illing and the late Chris Huissen of Mammoet, responsible for applying the load, for the fruitful discussions.
References
ACI Committee 437 (2013). Code Requirements for Load Testing of Existing Concrete Structures (ACI 437.2M-13) and Commentary. Farmington Hills, MA.
Aguilar, C. V., Jáuregui, D. V., Newtson, C. M., Weldon, B. D., and Cortez, T. M. (2015). “Load rating a prestressed concrete double-tee beam bridge without plans by proof testing,” in Transportation Research Board Annual Compendium of Papers (Washington, DC). doi: 10.3141/2522-09
Anay, R., Cortez, T. M., Jáuregui, D. V., Elbatanouny, M. K., and Ziehl, P. (2016). On-site acoustic-emission monitoring for assessment of a prestressed concrete double-tee-beam bridge without plans. J. Perform. Construct. Facilities 30. doi: 10.1061/(ASCE)CF.1943-5509.0000810
Barker, M. G. (2001). Quantifying field-test behavior for rating steel girder bridges. J. Bridge Eng. 6, 254–261. doi: 10.1061/(ASCE)1084-0702(2001)6:4(254)
Bonifaz, J., Zaruma, S., Robalino, A., and Sanchez, T. A. (2018). “Bridge diagnostic load testing in ecuador – case studies,” in IALCCE 2018 (Ghent).
Cai, C. S., and Shahawy, M. (2003). Understanding capacity rating of bridges from load tests. Pract. Period. Struct. Design Construct. 8, 209–2016. doi: 10.1061/(ASCE)1084-0680(2003)8:4(209)
Chajes, M. J., Shenton Iii, H. W., and Finch, W. W. (2001). Diagnostic and in-service testing of transit railway bridge. Transport. Res. Rec. 1770, 51–57. doi: 10.3141/1770-08
Collings, D., and Sagaseta, J. (2015). A review of arching and compressive membrane action in concrete bridges. Inst. Civil Eng. Bridge Eng. 169, 271–284. doi: 10.1680/bren.14.00039
Comité Européen de Normalisation (2003). Eurocode 1: Actions on Structures - Part 2: Traffic Loads on Bridges. NEN-EN 1991-2:2003. Comité Européen de Normalisation, Brussels, Belgium.
Comité Européen de Normalisation (2005). Eurocode 2: Design of Concrete Structures - Part 1-1 General Rules and Rules for Buildings. NEN-EN 1992-1-1:2005. Comité Européen de Normalisation, Brussels, Belgium.
Deutscher Ausschuss für Stahlbeton (2000). DAfStb-Guideline: Load Tests on Concrete Structures (in German) (DAfStb-Richtlinie: Belastungsversuche an Betonbauwerken). Deutscher Ausschuss fur Stahlbeton, Berlin, Germany.
Duan, Z., Liu, Y., and Spencer, B. F. (2005). Finite element model updating of structures using a hybrid optimization technique. Proc. SPIE 5765, 335–344. doi: 10.1117/12.602009
Faber, M. H., Val, D. V., and Stewart, M. G. (2000). Proof load testing for bridge assessment and upgrading. Eng. Struct. 22, 1677–1689. doi: 10.1016/S0141-0296(99)00111-X
fib (2012). Model Code 2010: Final Draft. Lausanne: International Federation for Structural Concrete.
Frýba, L., and Pirner, M. (2001). Load tests and modal analysis of bridges. Eng. Struct. 23, 102–109. doi: 10.1016/S0141-0296(00)00026-2
Fu, G., Pezze Iii, F. P., and Alampalli, S. (1997). Diagnostic load testing for bridge load rating. Transport. Res. Rec. 1594, 125–133. doi: 10.3141/1594-13
Grigoriu, M., and Hall, W. B. (1984). Probabilistic models for proof load testing. J. Struct. Eng. 110, 260–274. doi: 10.1061/(ASCE)0733-9445(1984)110:2(260)
Halicka, A., Hordijk, D. A., and Lantsoght, E. O. L. (2018). “Rating of concrete road bridges with proof loads,” in ACI SP 323 Evaluation of Concrete Bridge Behavior Through Load Testing - International Perspectives (Farmington Hills, MI), 16.
Iv-Infra (2015). 51H-304-01 - De Beek - Recalculation Bridge Deck (in Dutch). Papendrecht, Netherlands.
Juntunen, D. A., and Isola, M. C. (1995). Proof Load Test of R01 of 61131 M-37 Over CSX Railroad, South of Bailey, Michigan. Lansing, MI: Michigan Department of Transportation.
Koekkoek, R. T., Lantsoght, E. O. L., Yang, Y., and Hordijk, D. A. (2016). Analysis Report for the Assessment of Viaduct De Beek by Proof Loading. Delft University of Technology, Delft, Netherlands.
Lantsoght, E. O. L., De Boer, A., Van Der Veen, C., and Hordijk, D. A. (2018a). “Modelling of the proof load test on viaduct De Beek”, in Euro-C (Bad Hofgastein).
Lantsoght, E. O. L., Koekkoek, R., Yang, Y., Van Der Veen, C., Hordijk, D., and De Boer, A. (2017a). “Proof load testing of the viaduct De Beek,” in 39th IABSE Symposium - Engineering the Future (Vancouver, BC).
Lantsoght, E. O. L., Koekkoek, R. T., Hordijk, D. A., and De Boer, A. (2017c). Towards standardization of proof load testing: pilot test on viaduct Zijlweg. Struct. Infrastruct. Eng. 16, 365–380. doi: 10.1080/15732479.2017.1354032
Lantsoght, E. O. L., Koekkoek, R. T., Van Der Veen, C., Hordijk, D. A., and De Boer, A. (2017d). Pilot proof-load test on viaduct de beek: case study. J. Bridge Eng. 22:05017014. doi: 10.1061/(ASCE)BE.1943-5592.0001131
Lantsoght, E. O. L., Van Der Veen, C., De Boer, A., and Walraven, J. (2015). Transverse load redistribution and effective shear width in reinforced concrete slabS. Heron 60, 145–180. Available online at: http://www.heronjournal.nl/60-3/2.html
Lantsoght, E. O. L., Van Der Veen, C., De Boer, A., and Walraven, J. C. (2013). Recommendations for the shear assessment of reinforced concrete slab bridges from experiments. Struct. Eng. Int. 23, 418–426. doi: 10.2749/101686613X13627347100239
Lantsoght, E. O. L., Van Der Veen, C., Hordijk, D., and De Boer, A. (2017b). “Recommendations for proof load testing of reinforced concrete slab bridges,” in 39th IABSE Symposium - Engineering the Future (Vancouver, BC).
Lantsoght, E. O. L., Van Der Veen, C., and Hordijk, D. A. (2018b). “Proposed stop criteria for proof load testing of concrete bridges and verification,” in IALCCE 2018. (Ghent).
Lantsoght, E. O. L., Van Der Veen, C., Hordijk, D. A., and De Boer, A. (2017e). Development of recommendations for proof load testing of reinforced concrete slab bridges. Eng. Struct. 152, 202–210. doi: 10.1016/j.engstruct.2017.09.018
Lantsoght, E. O. L., Van Der Veen, C., Hordijk, D. A., and De Boer, A. (2017f). State-of-the-art on load testing of concrete bridges. Eng. Struct. 150, 231–241. doi: 10.1016/j.engstruct.2017.07.050
Ministerio de Fomento - Direccion General de Carreteras (1999). Recomendaciones para la realizacion de pruebas de carga de recepcion en puentes de carretera. Madrid.
Olaszek, P., Lagoda, M., and Casas, J. R. (2014). Diagnostic load testing and assessment of existing bridges: examples of application. Struct. Infrastruct. Eng. 10, 834–842. doi: 10.1080/15732479.2013.772212
Ransom, A. L., and Heywood, R. J. (1997). “Recommendations for Proof Load Testing in Australia,” in Proceedings of the Autostrads 1997 Bridge Conference Bridging the Milenia. (Sydney).
Rijkswaterstaat (2013). Guidelines Assessment Bridges - Assessment of Structural Safety of an Existing Bridge at Reconstruction, Usage and Disapproval (in Dutch). RTD 1006:2013 1.1, Utrecht, Netherlands.
Rijkswaterstaat (2017a). Guidelines for Nonlinear Finite Element Analysis of Concrete Structures. RTD 1016-1:2017, Utrecht, Netherlands.
Rijkswaterstaat (2017b). Validation of the Guidelines for Nonlinear Finite Element Analysis of Concrete Structures - Part 2: Review of results: RTD 1016-2:2017. Utrecht, Netherlands.
Rijkswaterstaat (2017c). Validation of the Guidelines for Nonlinear Finite Element Analysis of Concrete Structures - Part 3A: Reinforced Beams. RTD 1016-3A:2017, Utrecht, Netherlands.
Rijkswaterstaat (2017d). Validation of the Guidelines for Nonlinear Finite Element Analysis of Concrete Structures - Part 3B: Pre-stressed Beams. RTD 1016-3B:2017, Utrecht, Netherlands.
Rijkswaterstaat (2017e). Validation of the Guidelines for Nonlinear Finite Element Analysis of Concrete Structures - Part 3C: Slabs. RTD 1016-3C:2017, Utrecht, Netherlands.
Sanayei, M., Reiff, A. J., Brenner, B. R., and Imbaro, G. R. (2016). Load rating of a fully instrumented bridge: comparison of LRFR approaches. J. Perform. Construct. Facil. 30. doi: 10.1061/(ASCE)CF.1943-5509.0000752
Saraf, V. K., Nowak, A. S., and Till, R. (1996). “Proof load testing of bridges,” in Probabilistic Mechanics and Structural Reliability: Proceedings of the Seventh Specialty Conference, eds D. M. Frangopol and M. D. Grigoriu (Worcester, MA). doi: 10.3141/1541-07
Velázquez, B. M., Yura, J. A., Frank, K. H., Kreger, M. E., and Wood, S. L. (2000). Diagnostic Load Tests of a Reinforced Concrete Pan-Girder Bridge. Austin, TX: The University of Texas at Austin).
Wang, H., Li, A.-Q., and Li, J. (2010). Progressive finite element model calibration of a long-span suspension bridge based on ambient vibration and static measurements. Eng. Struct. 32, 2546–2556. doi: 10.1016/j.engstruct.2010.04.028
Willems, M., Ruiter, P. B. D., and Heystek, A. P. (2015). Inspection Report Object 51H-304-01 (in Dutch). Utrecht.
Notation List
Keywords: assessment, bridge evaluation, concrete bridges, field testing, finite element modeling, load testing, optimization, proof load testing
Citation: Lantsoght EOL, de Boer A, van der Veen C and Hordijk DA (2019) Optimizing Finite Element Models for Concrete Bridge Assessment With Proof Load Testing. Front. Built Environ. 5:99. doi: 10.3389/fbuil.2019.00099
Received: 08 May 2019; Accepted: 29 July 2019;
Published: 16 August 2019.
Edited by:
Emilio Bastidas-Arteaga, Université de Nantes, FranceReviewed by:
Miguel Angel Astiz, Polytechnic University of Madrid, SpainHao Wang, Southeast University, China
Copyright © 2019 Lantsoght, de Boer, van der Veen and Hordijk. This is an open-access article distributed under the terms of the Creative Commons Attribution License (CC BY). The use, distribution or reproduction in other forums is permitted, provided the original author(s) and the copyright owner(s) are credited and that the original publication in this journal is cited, in accordance with accepted academic practice. No use, distribution or reproduction is permitted which does not comply with these terms.
*Correspondence: Eva O. L. Lantsoght, ZWxhbnRzb2dodEB1c2ZxLmVkdS5lYw==